Ocean acidification increases susceptibility to sub-zero air temperatures in ecosystem engineers and limits poleward range shifts
- Department of Zoology, University of British Columbia, Canada
- Department of Ecoscience – Marine Ecology & Arctic Research Centre, Aarhus University, Denmark
- Department of Biological Sciences, University of Alberta, Canada
- Institut des sciences de la mer, Université du Québec à Rimouski, Canada
- Institute for the Oceans and Fisheries, University of British Columbia, Canada
Figures
Figure 1 with 1 supplement

Proportion of survival in intertidal Mytilus trossulus, subtidal M. trossulus, and subtidal M. galloprovincialis after 10 days of acclimation to pH conditions (pH = 7.9or pH = 7.5).
Groups of mussels were exposed to seven sub-zero air temperatures. Lines indicate fitted logistic regression models; solid black lines represent control conditions (pH = 7.9); and dashed blue lines represent acidified conditions (pH = 7.5). Dots represent actual survival, and shaded areas indicate 95% confidence intervals of the fitted model.
Figure 1—figure supplement 1
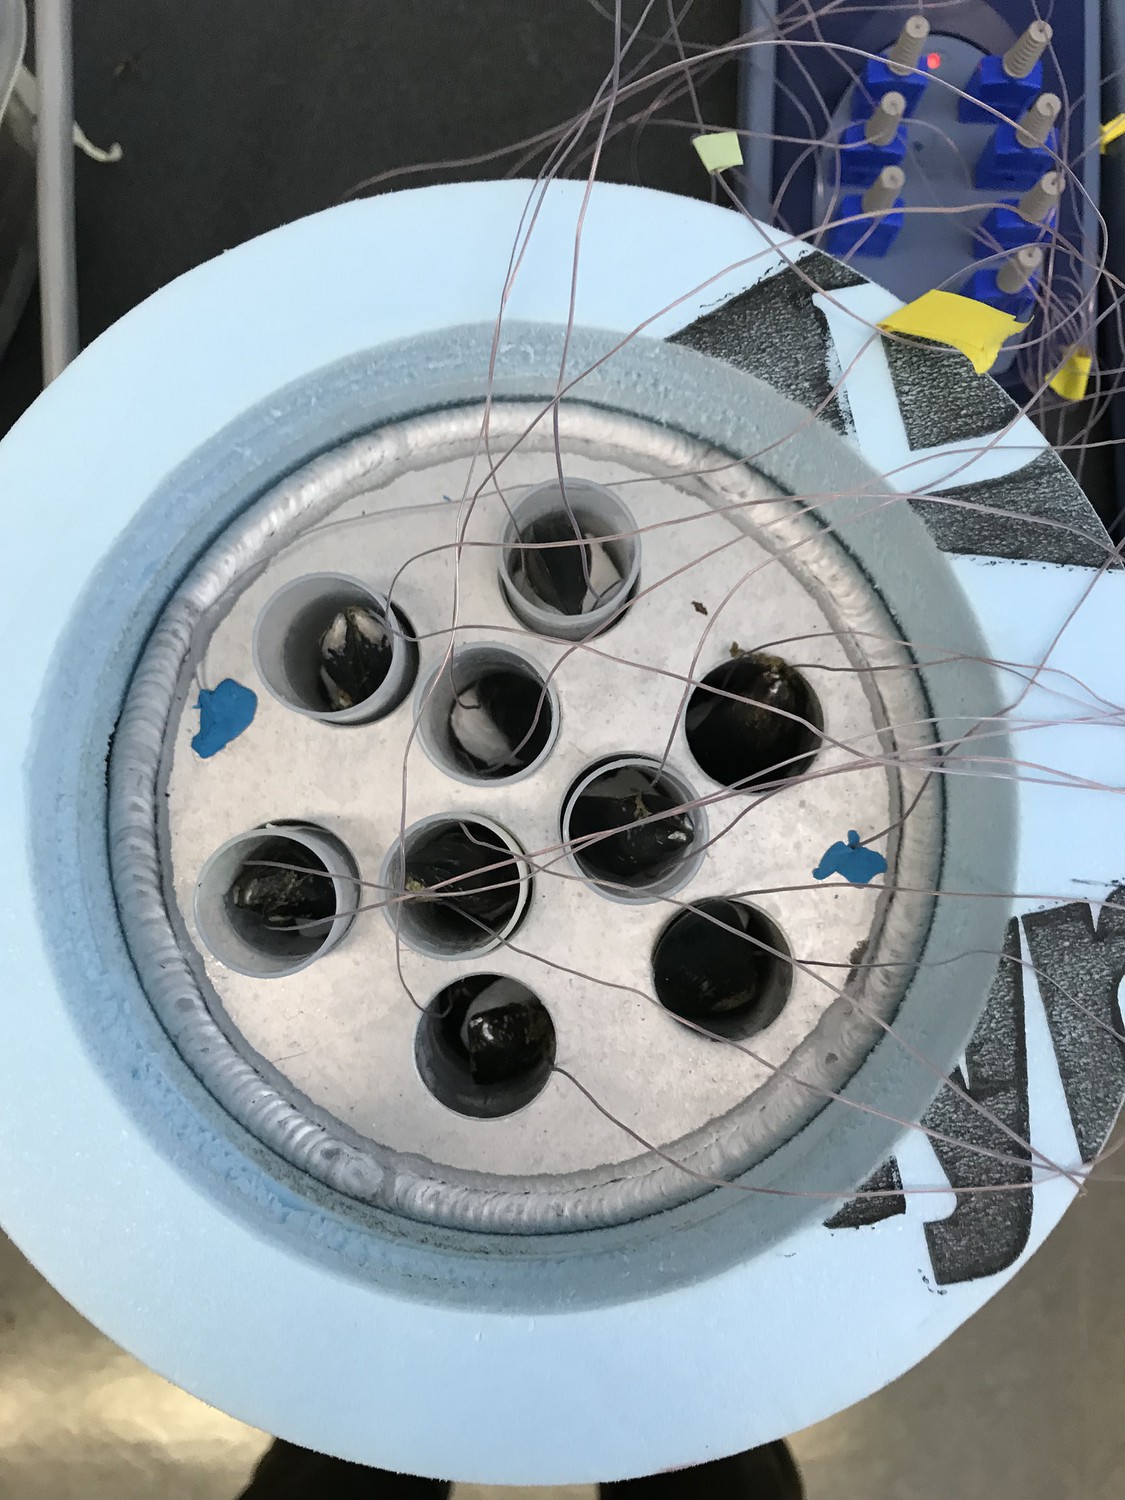
Mussels placed in wells drilled into a cooled aluminum block to assay freezing survival.
Figure 2
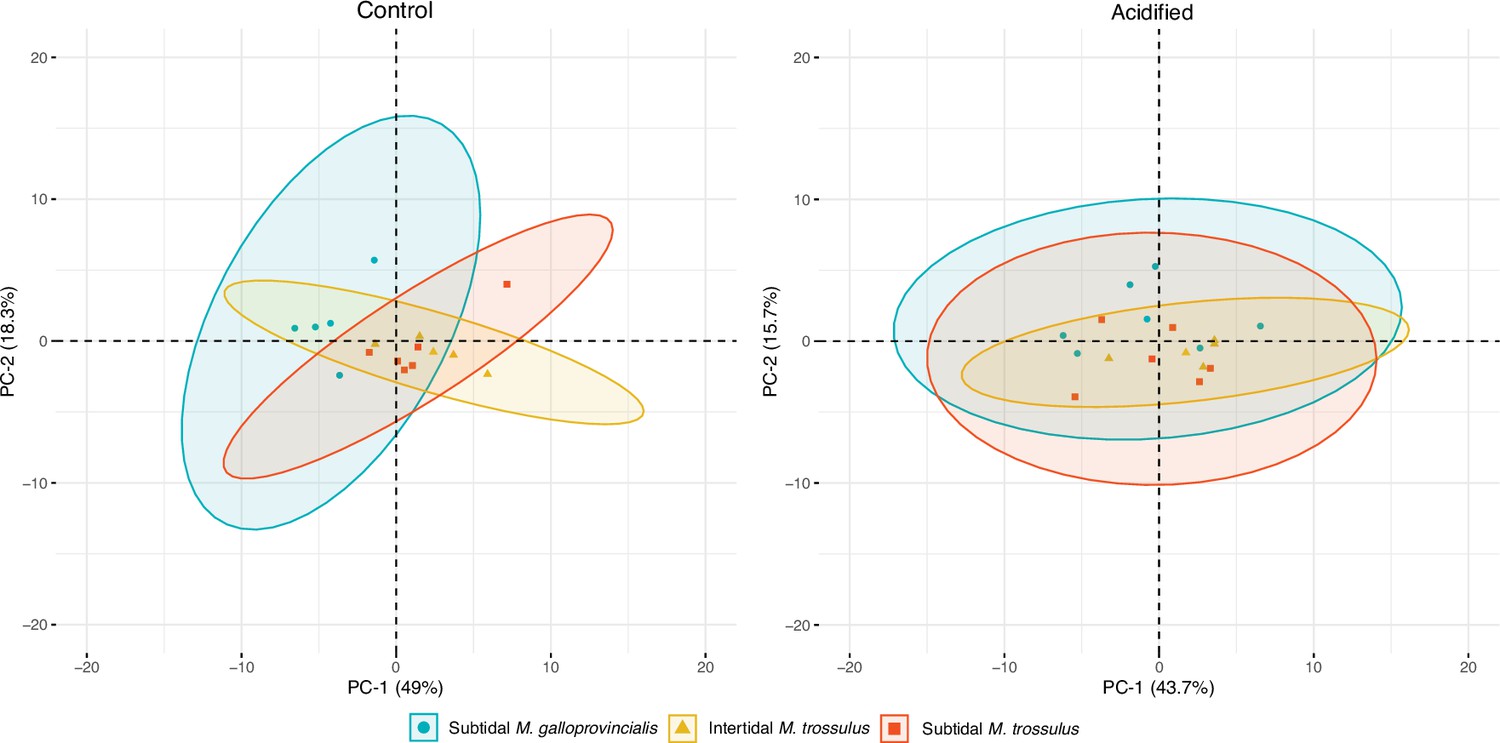
Principal component analysis (PCA) plot based on all identified metabolites in intertidal Mytilus trossulus, subtidal M. trossulus, and subtidal M. galloprovincialis after 10 days of acclimation to pH conditions (pH = 7.9or pH = 7.5).
Each point represents an individual, and the ellipses extend to the 95% confidence interval of the mussel category.
Figure 3

The concentration of common gill tissue osmolytes in intertidal Mytilus trossulus, subtidal M. trossulus, and subtidal M. galloprovincialis after 10 days of acclimation to pH conditions (pH = 7.9 or pH = 7.5).
The horizontal line in each boxplot is the median, the boxes define the hinges (25–75% quartile), and the whisker is 1.5 times the hinges (n = 5). Colored dots represent data outside this range.
Figure 4
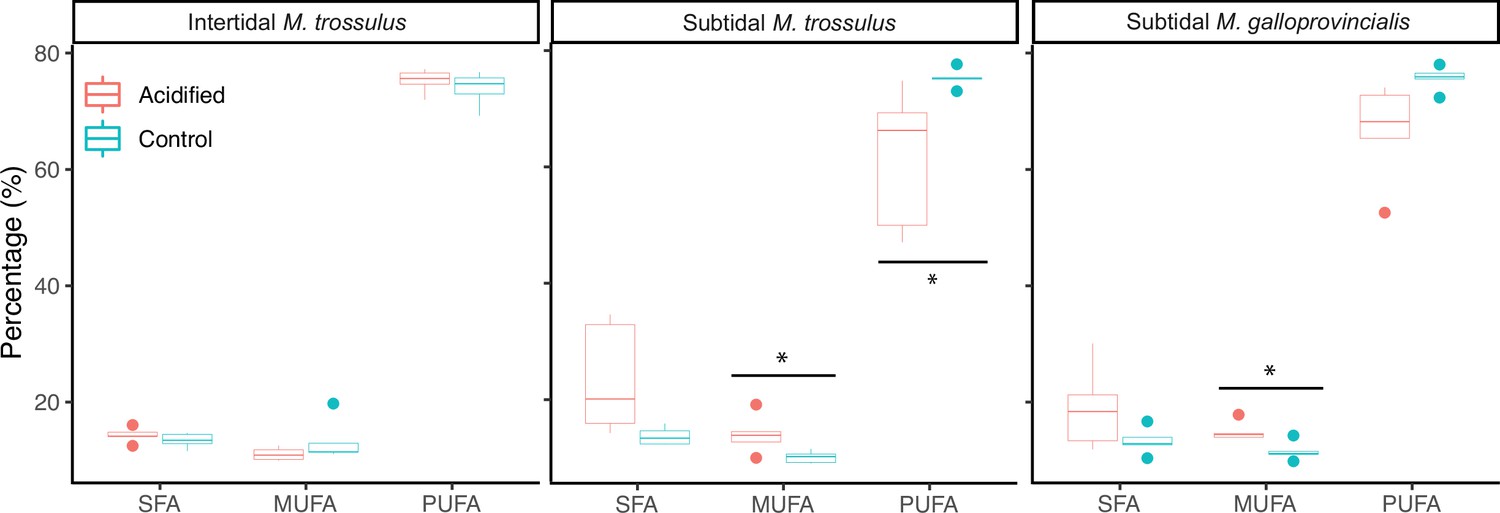
The molar percentage of saturated fatty acids (SFA), monounsaturated fatty acids (MUFA), and polyunsaturated fatty acids (PUFA) of gill tissue in intertidal Mytilus trossulus, subtidal M. trossulus, and subtidal M. galloprovincialis after 10 days of acclimation to pH conditions (pH = 7.9 or pH = 7.5).
The horizontal line in each boxplot is the median, the boxes define the hinges (25–75% quartile), and the whisker is 1.5 times the hinges (n = 5). Colored dots represent data outside this range. Asterisks indicate a significant difference (ANOVA, p<0.05) between control and acidified conditions.
Figure 5

pH measurements from each incubator during the observation period.
Incubators 1–3 were set to control conditions (pH = 7.9), while incubators 4–6 were set to acidified conditions (pH = 7.5).
Tables
Table 1
Mean (± SD) amino acid composition (% total amino acid content) of gill tissue in intertidal Mytilus trossulus, subtidal M. trossulus, and subtidal M. galloprovincialis after 10 days of acclimation to pH conditions (pH = 7.9 or pH = 7.5, n = 5).
| Intertidal – M. trossulus | Subtidal – M. trossulus | Subtidal – M. galloprovincialis | ||||
|---|---|---|---|---|---|---|
| Amino acid | Acidified | Control | Acidified | Control | Acidified | Control |
| Asx | 11.18 ± 0.44 | 11.39 ± 0.25 | 11.07 ± 0.30 | 11.34 ± 0.86 | 11.07 ± 0.30 | 11.01 ± 0.33 |
| Ala | 5.50 ± 0.22 | 5.74 ± 0.35 | 5.54 ± 0.21 | 5.47 ± 0.33 | 5.54 ± 0.21 | 5.56 ± 0.13 |
| Arg | 7.92 ± 0.85 | 7.11 ± 0.10 | 7.07 ± 0.07 | 7.08 ± 0.11 | 7.07 ± 0.07 | 7.22 ± 0.19 |
| Glx | 14.08 ± 0.99 | 14.97 ± 0.16 | 15.07 ± 0.12 | 14.81 ± 0.46 | 15.07 ± 0.12 | 14.97 ± 0.17 |
| Gly | 9.37 ± 0.91 | 9.15 ± 0.62 | 9.15 ± 0.61 | 9.39 ± 1.43 | 9.15 ± 0.61 | 9.31 ± 0.7 |
| His | 2.03 ± 0.04 | 2.15 ± 0.12 | 2.04 ± 0.07 | 2.09 ± 0.10 | 2.04 ± 0.07 | 2.05 ± 0.05 |
| Ile | 4.16 ± 0.18 | 4.14 ± 0.09 | 4.03 ± 0.16 | 4.10 ± 0.26 | 4.03 ± 0.16 | 3.97 ± 0.19 |
| L-Dopa | 0.14 ± 0.01 | 0.17 ± 0.02 | 0.09 ± 0.01 | 0.14 ± 0.03 | 0.09 ± 0.01 | 0.11 ± 0.01 |
| Leu | 6.49 ± 0.18 | 6.53 ± 0.09 | 6.30 ± 0.25 | 6.42 ± 0.34 | 6.30 ± 0.25 | 6.3 ± 0.3 |
| Lys | 7.65 ± 1.60 | 7.06 ± 0.33 | 6.51 ± 0.37 | 6.69 ± 1.16 | 6.51 ± 0.37 | 6.47 ± 0.36 |
| Met | 2.55 ± 0.12 | 2.60 ± 0.08 | 2.76 ± 0.05 | 2.64 ± 0.10 | 2.76 ± 0.05 | 2.68 ± 0.08 |
| Phe | 4.26 ± 0.19 | 4.36 ± 0.12 | 4.16 ± 0.15 | 4.31 ± 0.44 | 4.16 ± 0.15 | 4.08 ± 0.18 |
| Pro | 5.25 ± 0.48 | 5.26 ± 0.27 | 5.92 ± 0.31 | 5.59 ± 0.61 | 5.92 ± 0.31 | 6.03 ± 0.24 |
| Ser | 5.06 ± 0.21 | 4.85 ± 0.15 | 4.81 ± 0.10 | 4.87 ± 0.14 | 4.81 ± 0.10 | 4.77 ± 0.1 |
| Thr | 4.36 ± 0.16 | 4.38 ± 0.04 | 4.72 ± 0.07 | 4.50 ± 0.13 | 4.72 ± 0.07 | 4.75 ± 0.05 |
| Tyr | 5.12 ± 0.47 | 5.25 ± 0.28 | 5.62 ± 0.10 | 5.55 ± 0.44 | 5.62 ± 0.10 | 5.63 ± 0.15 |
| Val | 5.03 ± 0.24 | 5.06 ± 0.11 | 5.22 ± 0.10 | 5.13 ± 0.11 | 5.22 ± 0.10 | 5.21 ± 0.08 |
-
Asx, aspartic acid/asparginine; Ala, alanine; Arg, arginine; Glx, glutamic acid/glutamine; Gly, glycine; His, histidine; Ile, isoleucine; L-Dopa. Levodopa; Leu, leucine; Lys, lysine; Met, methionine; Phe, phenylalanine; Pro, proline; Ser, serine; Thr, threonine; Tyr, tyrosine; Val, valine.
Table 2
Mean (± SD) fatty acid composition (% fatty acid content) of the 13 fatty acids contributing ∼90% of the differences in fatty acid composition after 10 days of acclimation to pH conditions (pH = 7.9 or pH = 7.5).
UI = unsaturation index. Bold numbers indicate significant differences among the control and low pH treatment within a mussel category (ANOVA, p<0.05, n = 5).
| Intertidal – M. trossulus | Subtidal – M. trossulus | Subtidal – M. galloprovincialis | ||||
|---|---|---|---|---|---|---|
| Fatty acid | Acidified | Control | Acidified | Control | Acidified | Control |
| 16:0 | 9.53 ± 0.89 | 8.72 ± 1.21 | 16.56 ± 6.62 | 10.21 ± 1.21 | 12.95 ± 5.17 | 8.83 ± 1.44 |
| 18:0 | 2.57 ± 0.34 | 2.53 ± 0.17 | 4.30 ± 1.98 | 2.28 ± 0.38 | 3.38 ± 1.26 | 2.53 ± 0.67 |
| 16:1ω7 | 1.01 ± 0.1 | 1.2 ± 0.22 | 1.58 ± 0.33 | 0.97 ± 0.19 | 1.71 ± 0.33 | 1.07 ± 0.27 |
| 17:1ω7 | 1.71 ± 0.63 | 4.07 ± 4.16 | 1.94 ± 1.14 | 1.43 ± 1.1 | 2.26 ± 1.63 | 2.04 ± 2.15 |
| 18:1ω7 | 1.48 ± 0.12 | 1.37 ± 0.37 | 1.91 ± 0.52 | 1.21 ± 0.2 | 2.08 ± 0.58 | 1.5 ± 0.34 |
| 20:1ω9 | 4.31 ± 0.3 | 4.12 ± 0.46 | 6.21 ± 1.13 | 4.86 ± 0.61 | 5.43 ± 1.32 | 4.37 ± 0.48 |
| 18:2ω6 | 0.91 ± 0.1 | 0.94 ± 0.35 | 1.46 ± 0.67 | 1.31 ± 0.25 | 0.79 ± 0.36 | 0.64 ± 0.14 |
| 18:3ω3 | 1.12 ± 0.07 | 1.21 ± 0.5 | 1.04 ± 0.57 | 1.52 ± 0.19 | 0.31 ± 0.1 | 0.36 ± 0.09 |
| 20:2ω6 | 9.41 ± 0.76 | 8.82 ± 1.05 | 11.96 ± 1.21 | 9.87 ± 0.58 | 9.78 ± 1.79 | 8.67 ± 1.41 |
| 20:4ω6 | 9.70 ± 1.1 | 9.81 ± 0.9 | 3.76 ± 2.61 | 6.07 ± 0.76 | 6.95 ± 2.43 | 9.7 ± 1.37 |
| 20:5ω3 | 9.78 ± 1.15 | 10.74 ± 1.97 | 4.87 ± 3.59 | 12.19 ± 1.05 | 7.0 ± 2.98 | 10.21 ± 1.68 |
| 22:2-NMI | 11.54 ± 0.84 | 10.86 ± 1.5 | 12.72 ± 0.95 | 9.55 ± 0.66 | 13.53 ± 1.5 | 12.19 ± .1.14 |
| 22:6ω3 | 14.13 ± 0.99 | 13.73 ± 0.69 | 6.36 ± 4.86 | 16.22 ± 0.48 | 9.7 ± 4.61 | 15.88 ± 2.06 |
| UI | 234.73 ± 6.14 | 238.84 ± 8.75 | 150.94 ± 55.19 | 244.97 ± 4.59 | 187.59 ± 46.35 | 242.92 ± 8.78 |
-
16:0, palmitic acid; 18:0, stearic acid; 16:1ω7, palmitoleic acid; 17:1ω7, 10Z-heptadecenoic acid; 18:1ω7, vaccenic acid; 20:1ω9, gondoic acid; 18:2ω6, linolelaidic acid; 18:3ω3, γ-linolenic acid; 20:2ω6, docosadienoic acid; 20:4ω6, arachidonic acid; 20:5ω3, eicosapentaenoic acid; 22:2-NMI, non-methylene-interrupted dienoic acid; 22:6ω3, docosahexaenoic acid.
Additional files
-
Supplementary file 1
Estimated regression parameters, standard errors, z-values, and p-values for the binomial generalized linear models (GLM).
- https://cdn.elifesciences.org/articles/81080/elife-81080-supp1-v2.docx
-
Supplementary file 2
Mean (± SD) metabolite concentration (nmol/100 g ww gill tissue) detected from the 1H NMR analysis after 10 days of acclimation to pH conditions (pH = 7.9 or pH = 7.5) (n = 5).
- https://cdn.elifesciences.org/articles/81080/elife-81080-supp2-v2.docx
-
Supplementary file 3
Mean (± SD) total hydrogen ion scale (pHT) and temperature measured directly in aquaria in each incubator.
- https://cdn.elifesciences.org/articles/81080/elife-81080-supp3-v2.docx
-
Supplementary file 4
Mean (± SD) carbonate measurements taken from discrete water samples at the start and end of the exposure period.
- https://cdn.elifesciences.org/articles/81080/elife-81080-supp4-v2.docx
-
Supplementary file 5
Carbonate measurement data from the burke-o-lator system at the Hakai Institute.
Bold numbers indicate anomalous values.
- https://cdn.elifesciences.org/articles/81080/elife-81080-supp5-v2.docx
-
Supplementary file 6
Mean (± SD) fatty acid composition (% fatty acid content) of all fatty acids after 10 days of acclimation to pH conditions (pH = 7.9 or pH = 7.5) (n = 5).
The molar percentage of saturated fatty acids (SFA), monounsaturated fatty acids (MUFA), and polyunsaturated fatty acids (PUFA) is presented.
- https://cdn.elifesciences.org/articles/81080/elife-81080-supp6-v2.docx
-
MDAR checklist
- https://cdn.elifesciences.org/articles/81080/elife-81080-mdarchecklist1-v2.docx
Download links
A two-part list of links to download the article, or parts of the article, in various formats.
Downloads (link to download the article as PDF)
Open citations (links to open the citations from this article in various online reference manager services)
Cite this article (links to download the citations from this article in formats compatible with various reference manager tools)
Ocean acidification increases susceptibility to sub-zero air temperatures in ecosystem engineers and limits poleward range shifts
eLife 12:e81080.
https://doi.org/10.7554/eLife.81080


