Sensory conflict disrupts circadian rhythms in the sea anemone Nematostella vectensis
- Biology Department, Woods Hole Oceanographic Institution, United States
- MIT-WHOI Joint Program in Oceanography/Applied Ocean Science & Engineering, United States
Figures
Figure 1
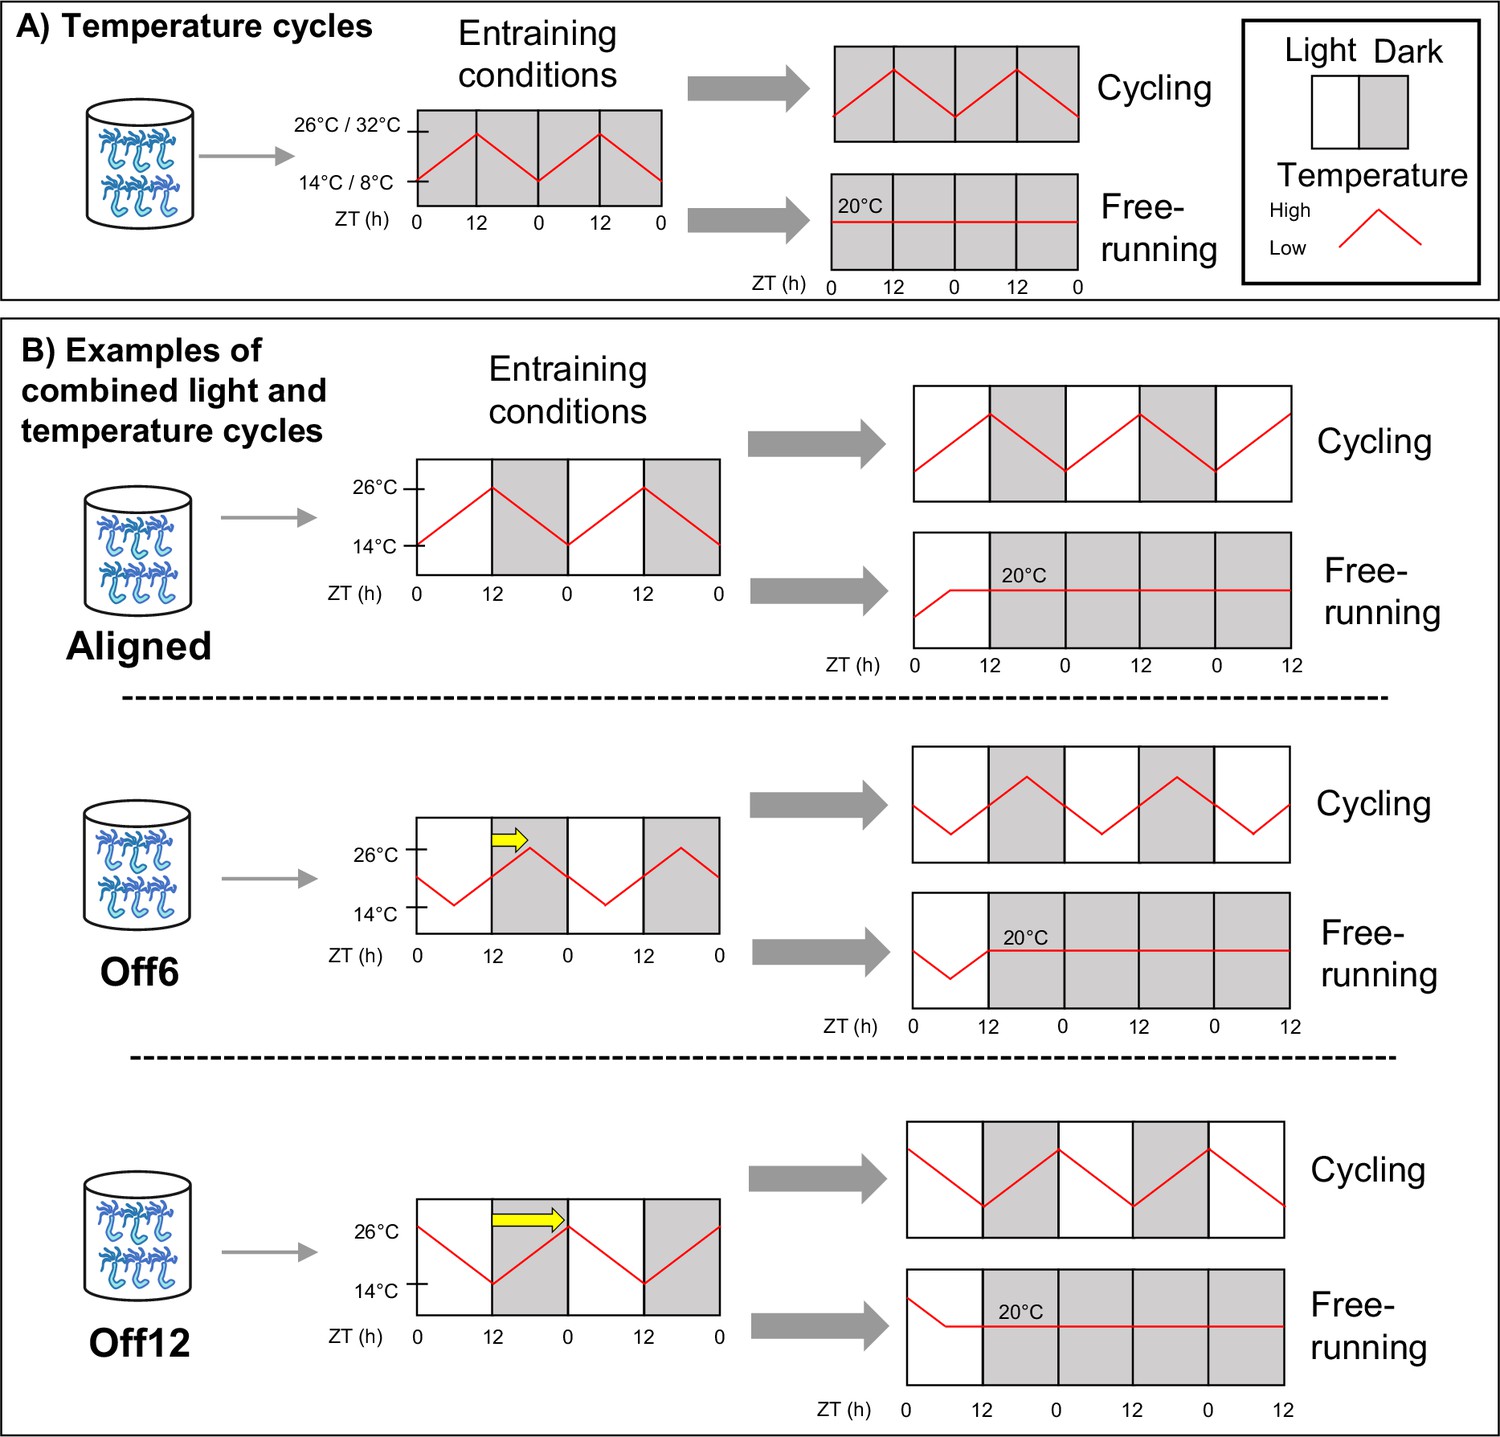
Schematic of the experimental design.
(A) Anemones in constant darkness were entrained to ramped 24 hr temperature cycles that changed gradually from 14–26 °C, or from 8–32 °C. For temperature cycle experiments, ZT0 refers to the coldest time point. Locomotor behavior was recorded during entrainment conditions (n=18 for 14–26 °C, n=17 for 8–32 °C) and for different individuals during free-running conditions (constant darkness and 20 °C; n=23 for 14–26 °C, n=46 for 8–32 °C). We used qRT-PCR to measure the expression of select clock-related genes for the 8–32 °C group (Figure 2c), with time points taken every 4 hr for 48 hr during both entrainment and free-running conditions. (B) Anemones were entrained to 12:12 light-dark cycles (LD) and simultaneous 14–26 °C temperature cycles. For these experiments, ZT0 always refers to lights-on. In the Aligned (reference) group, the coldest part of the temperature cycle was aligned with lights-on. For six other groups of anemones, the phase of the temperature cycle was delayed relative to the light cycle in 2 hr increments up to 12 hr. For simplicity, we only show the 6 hr (Off6) and 12 hr (Off12) offsets here (yellow arrows indicate phase shifts). For each group, behavior was recorded during entrainment conditions (n=24a), and for separate groups of anemones (n=24) during free-running (dark, 20 °C). We conducted RNA sequencing for the Aligned and 12 hr offset groups, with time points taken every 4 hr for 48 hr during entrainment conditions. In both (A) and (B), anemones were acclimated to experimental conditions for at least 2 weeks before measuring behavior for 3 days, with feeding occurring for each group at the same time of day around ZT8. Animals were not fed during behavior recording. Shaded and unshaded regions represent dark and light periods, respectively, and red lines represent temperature. aExcept the 12 hr offset, which had n=36.
Figure 2 with 1 supplement
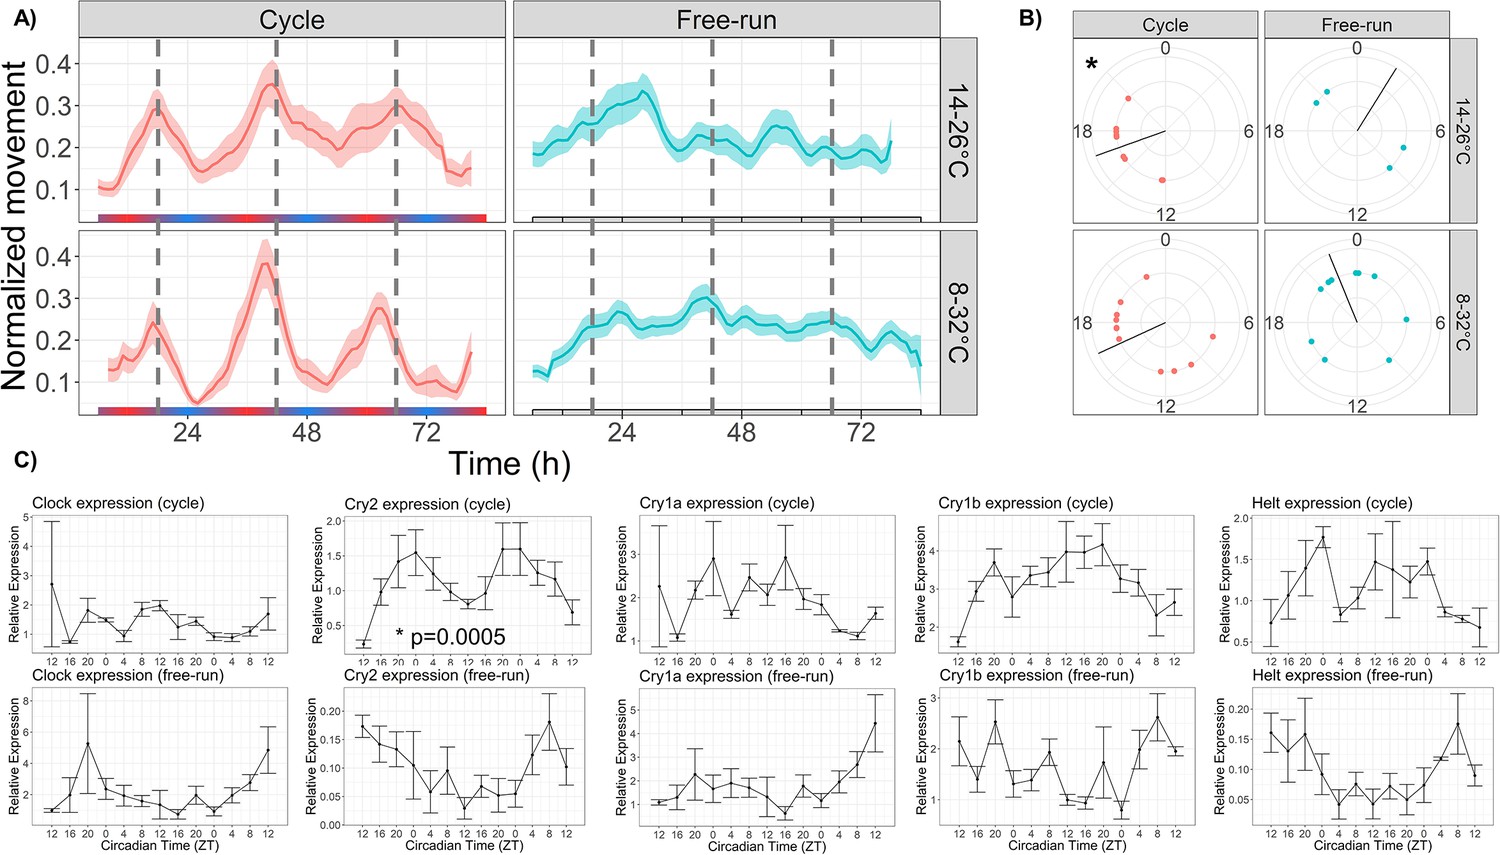
Temperature cycles drive rhythmic locomotor behavior and Cry2 expression, and weakly entrain circadian behavior.
(A) Mean behavior profiles of anemones in each group over 3 days. Individual locomotor profiles were normalized, averaged, and smoothed (see Materials and methods). Shaded area represents standard error. Left, temperature cycles with scale bar indicating cold (blue) and hot (red) temperatures; n=18 (top) and n=23 (bottom). Right, free-running at 20 °C; n=17 (top) and n=46 (bottom). Dashed lines indicate ZT18, the period of peak activity during entrainment conditions. (B) Phases of rhythmic animals calculated by MFourFit. Black line represents circular mean. *:Rayleigh test, p<0.05. (C) Expression of core circadian genes entrained to a temperature cycle and under free-running conditions. Only Cry2 was significantly rhythmic (LSP, p<0.05).
-
Figure 2—source data 1
Behavioral rhythmicity results.
- https://cdn.elifesciences.org/articles/81084/elife-81084-fig2-data1-v2.xlsx
Figure 2—figure supplement 1
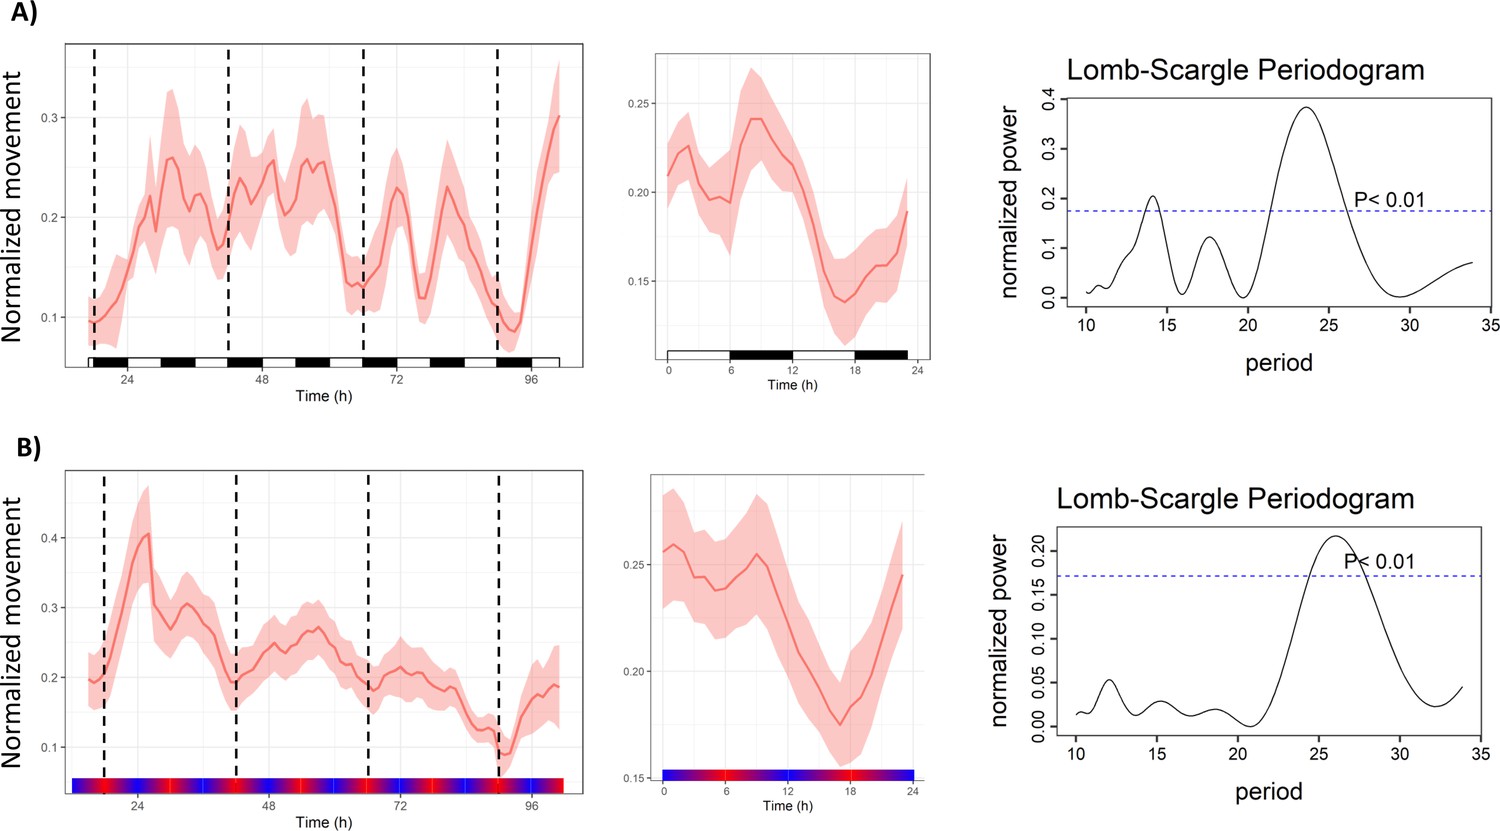
Zeitgeber cycles with a 12 hr period entrain circadian rhythms in Nematostella.
(A) Mean behavior profile (left), average 24 hr behavior profile (middle), and Lomb–Scargle periodogram (right) of animals entrained in a 6:6 LD cycle (n=12). (B) Mean behavior profile (left), average 24 hr behavior profile (middle), and Lomb–Scargle periodogram (right) of animals entrained in a 17–23 °C temperature cycle with 12 hr period (n=23). White and black boxes indicate lights-on and lights-off, respectively; colored bars indicate temperature. Dotted lines mark every 24 hr.
Figure 3 with 2 supplements
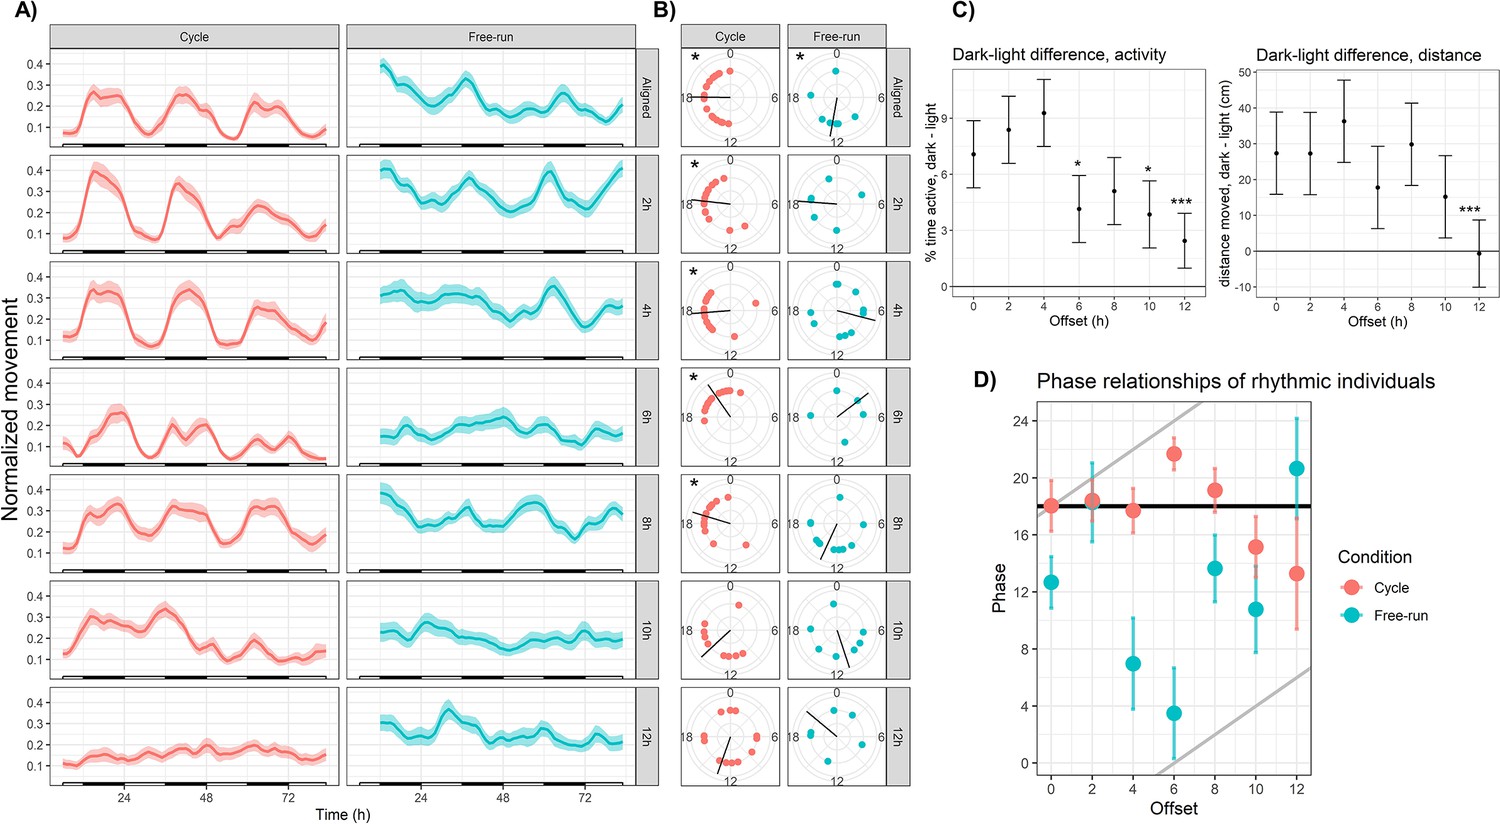
Sensory conflict disrupts rhythmic locomotor behavior in Nematostella.
(A) Mean behavior profiles. Individual locomotor profiles were normalized, averaged, and smoothed (see Materials and methods). Shaded area represents standard error. Left, entrainment conditions; white and black bars indicate lights-on and lights-off. Right, free-running at 20 °C and constant darkness; gray and black bars indicate subjective day and night. n=24 for each group except Off12-cycle, where n=36. (B) Phases of rhythmic animals calculated by MFourFit. Black line represents circular mean. *:Rayleigh test, p<0.05. (C) Difference, in percentage points, between percent time active per hour during dark and light phases (left), and difference between average distance moved per hour during dark and light phases (right). Asterisks indicate significant difference from Aligned-cycle. *: p<0.05; ***: p<0.001. (D) Means and standard errors of the phases of rhythmic individuals in each group. Black and grey lines represent expected phases of light-entrained and temperature-entrained rhythms, respectively (see ‘Relative strengths of light and temperature zeitgebers’).
Figure 3—figure supplement 1
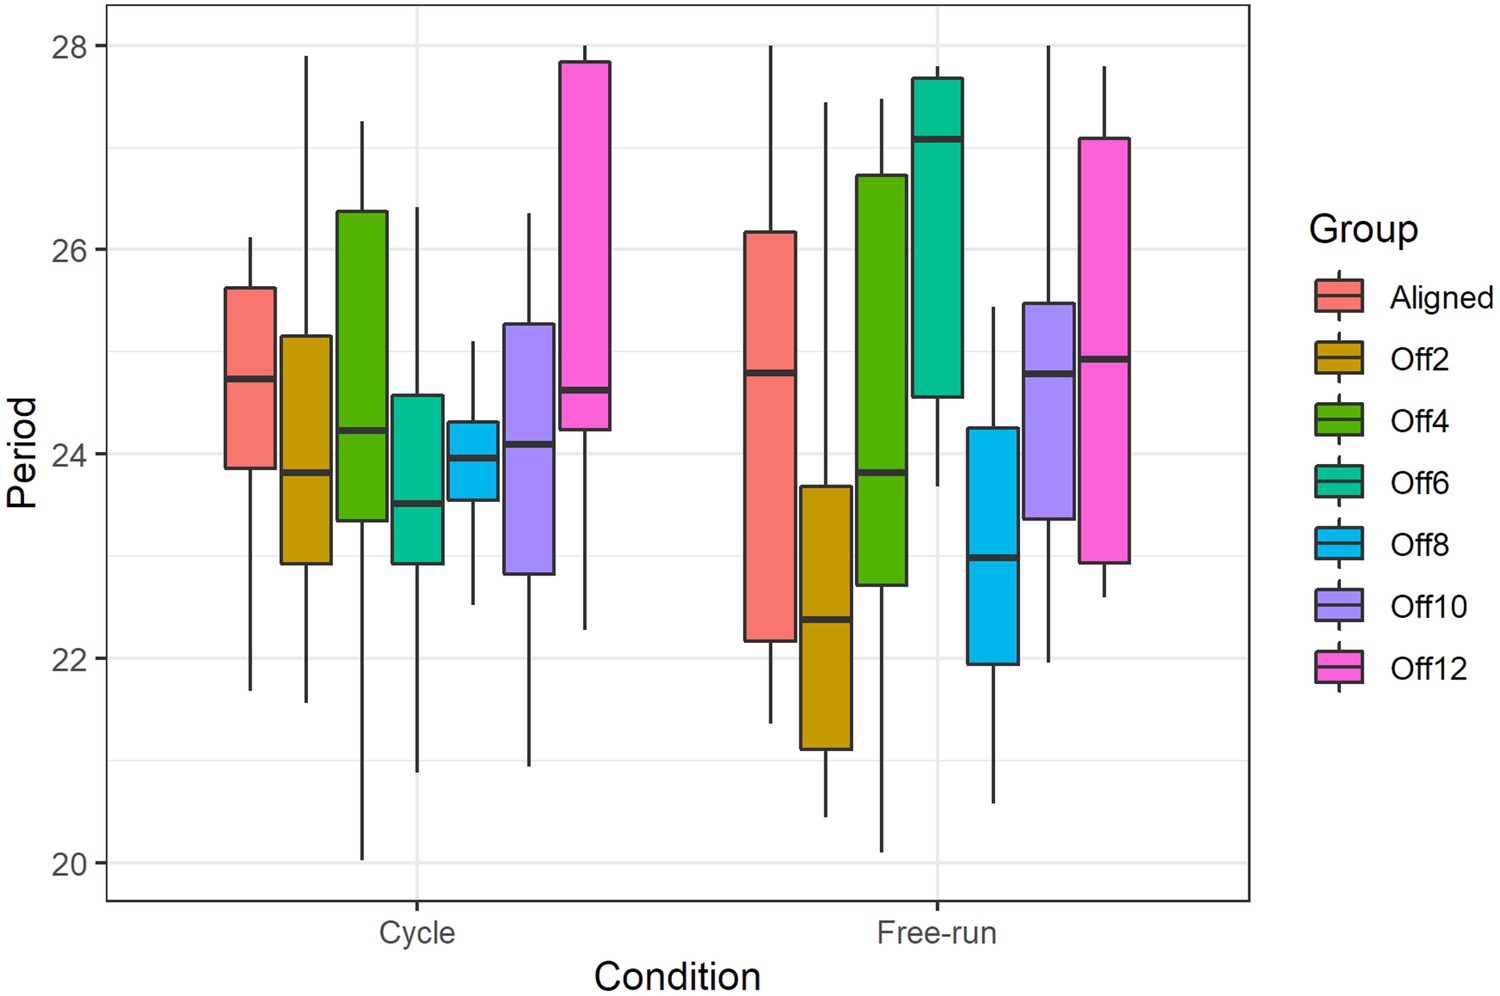
Period lengths of rhythmic individuals.
Periods had a wider variance in free-running groups compared to entrainment conditions (Levene’s test for variance homogeneity, p=1 × 10⁻⁴). However, there was no significant difference in mean period between groups (Kruskal-Wallis rank sum test, p=0.096).
Figure 3—figure supplement 2
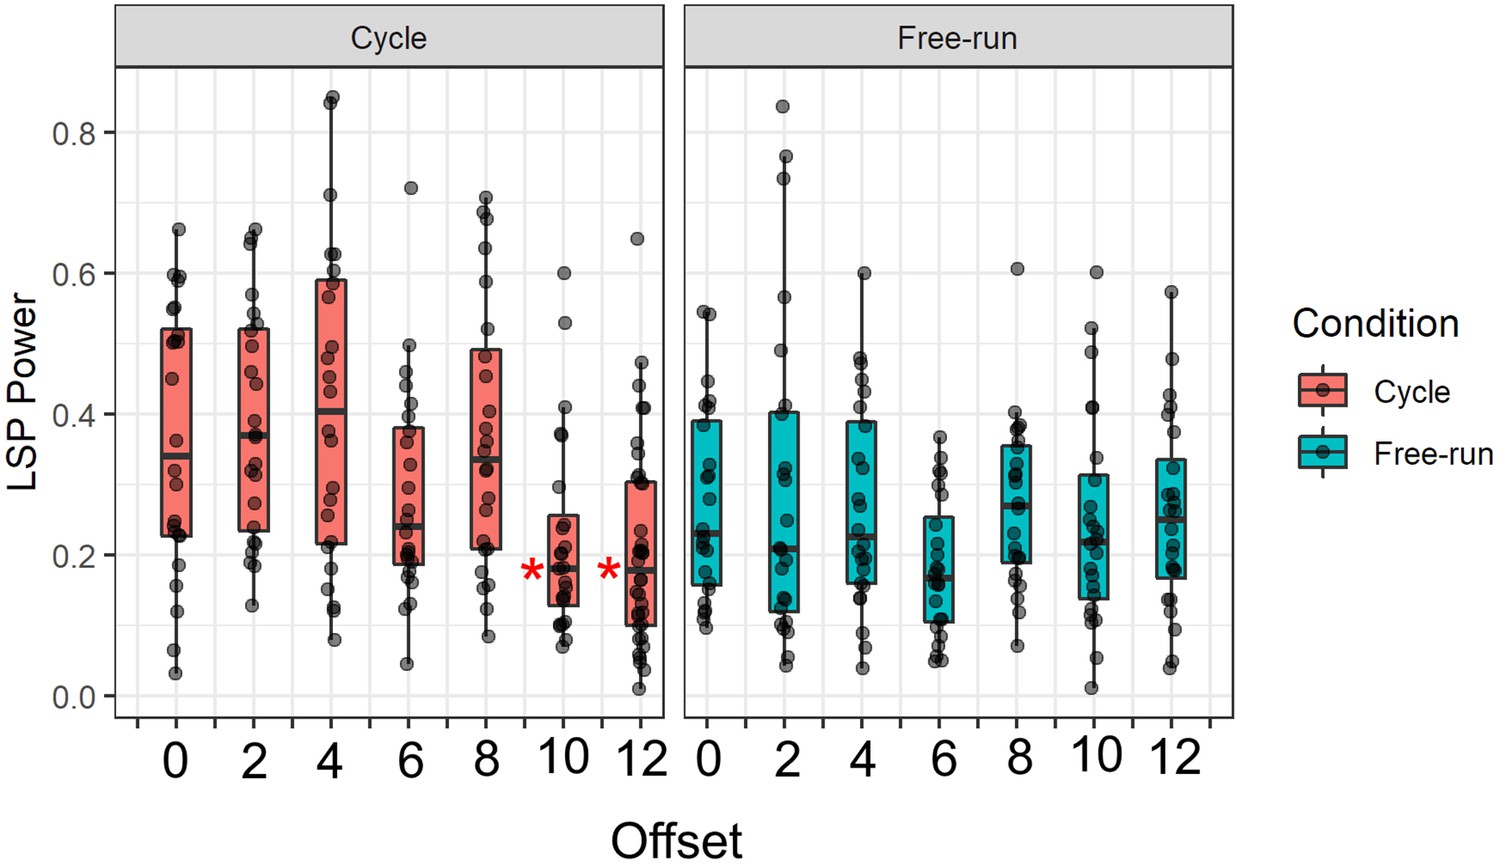
Lomb-Scargle Periodogram (LSP) power across groups.
*: Significantly lower than Aligned group (Dunn test, p<0.05).
Figure 4
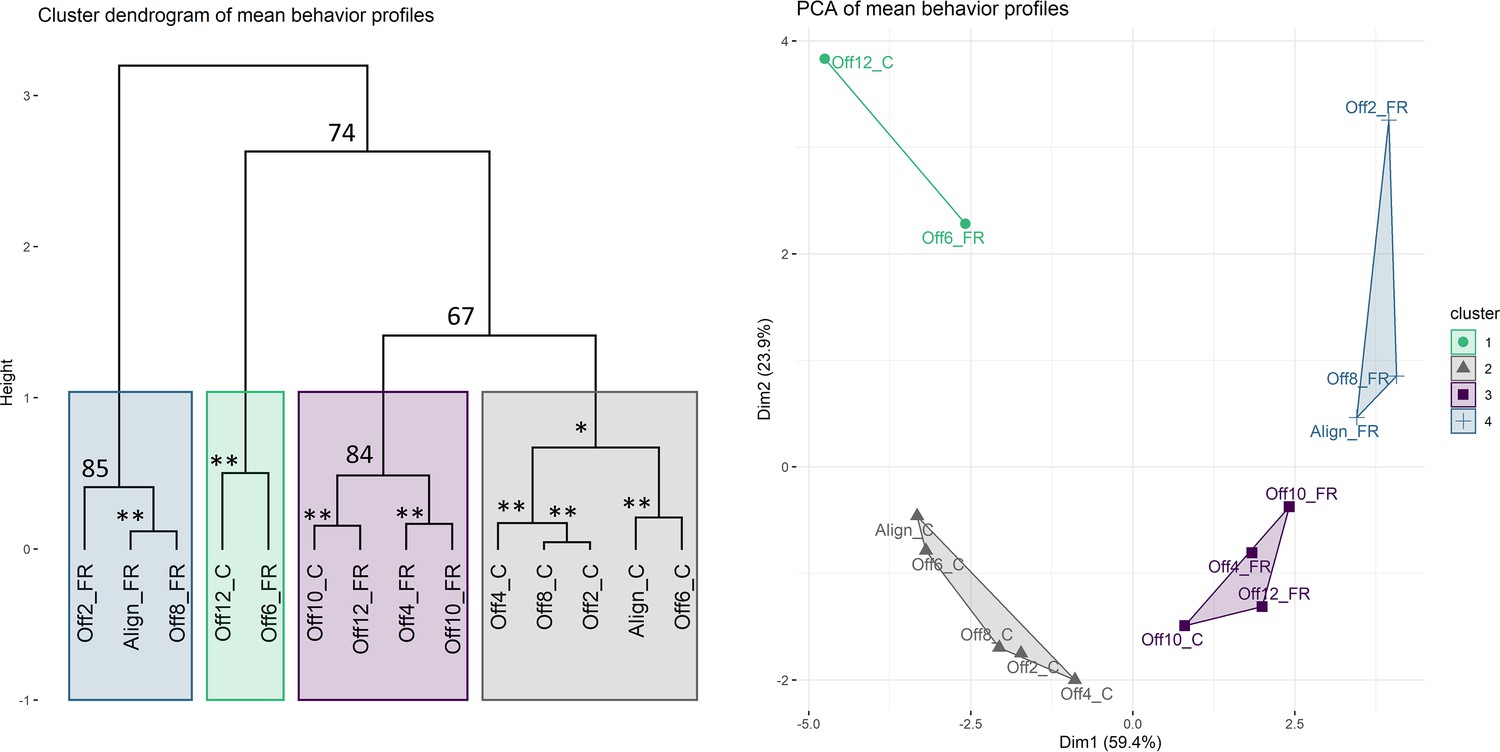
Clustering analysis of mean behavior profiles based on wavelet transformation.
(A) Principal component analysis of wavelet transformation distance matrix. Time series were grouped and colored based on the clusters identified in (B). C: cycles; FR: free-running. (B) Hierarchical clustering of samples in principal components space. Colored rectangles indicate the four clusters discussed in the text. Numbers indicate unbiased (AU) p-values. *AU p-value 90; **AU p-value 95.
Figure 5 with 1 supplement
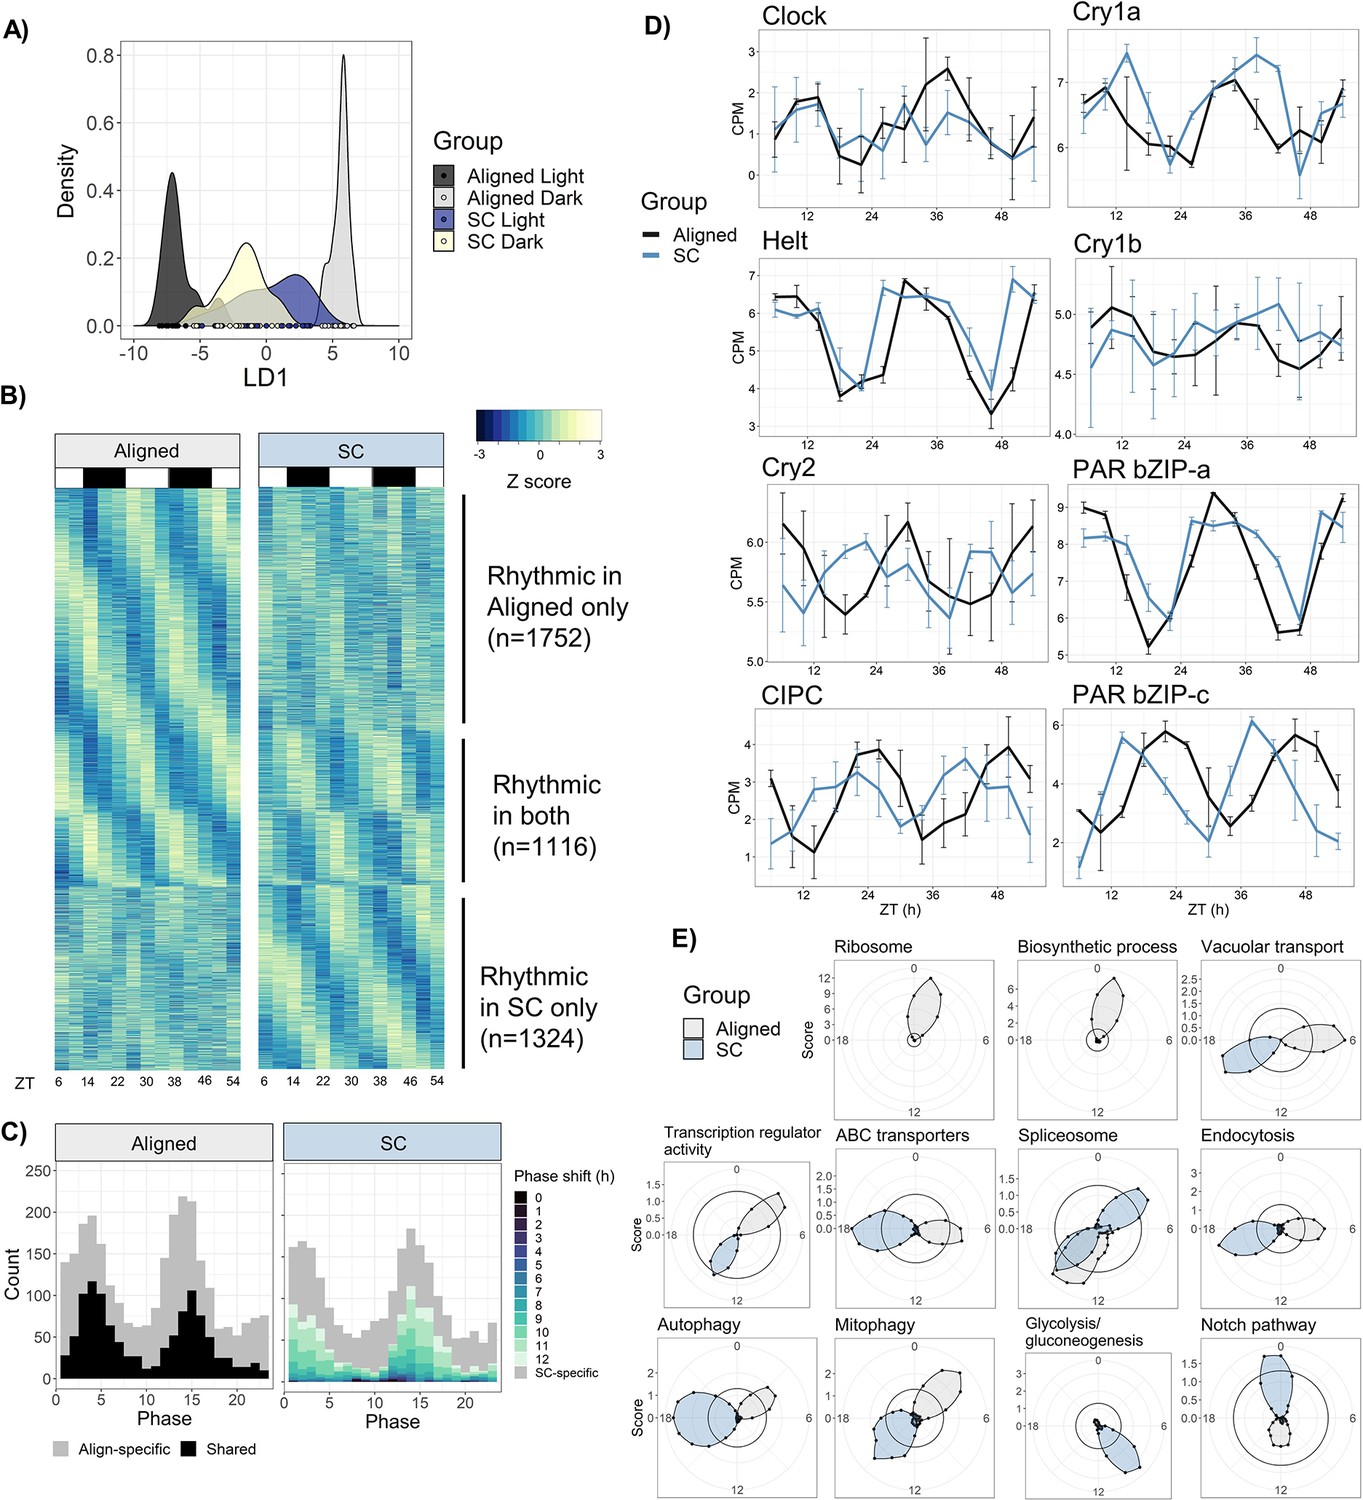
Sensory conflict alters patterns of rhythmic gene expression.
(A) Discriminant analysis of principal components (DAPC) demonstrates shifts in diel gene expression under SC. Density plot of sample loading values of light and dark samples during Aligned and SC conditions, on 1st discriminant axis from DAPC of aligned samples (’LD1‘). (B) Heatmaps of normalized rhythmic gene expression. Replicates were averaged at each time point and Z-scores were calculated for each gene and time series. ‘Rhythmic’ genes had a RAIN p-value < 0.01 in the Aligned time series only (top), SC time series only (bottom), or both (middle). White and black rectangles represent light and dark time points, respectively. (C) Phase distributions of rhythmic genes in Aligned (left) and SC (right) time series. Grey genes were rhythmic in only one time series, and black and colored genes were rhythmic in both. In SC, the color of shared rhythmic genes represents the phase shift of that gene from the Aligned time series. (D) Phases of core clock genes under Aligned and SC conditions. Lines show mean counts per million, and error bars represent 95% confidence intervals. (E) Sliding window enrichment analysis of select GO and KEGG terms during Aligned and SC time series. P-values were calculated by comparing genes with peak phase within a 4 hr sliding window with all other genes, and the score (y-axis) at each point is the average adjusted -log10 p-value at that time point (see Methods). Black circles indicates an FDR threshold of 0.05.
-
Figure 5—source data 1
Counts matrix.
Contains TMM-normalized counts-per-million on a log2 scale.
- https://cdn.elifesciences.org/articles/81084/elife-81084-fig5-data1-v2.txt
-
Figure 5—source data 2
Differential expression, rhythmicity, and WGCNA analyses, and gene annotations.
- https://cdn.elifesciences.org/articles/81084/elife-81084-fig5-data2-v2.xlsx
-
Figure 5—source data 3
Results of HOMER motif enrichment analyses.
- https://cdn.elifesciences.org/articles/81084/elife-81084-fig5-data3-v2.xlsx
-
Figure 5—source data 4
GO and KEGG enrichment results.
- https://cdn.elifesciences.org/articles/81084/elife-81084-fig5-data4-v2.xlsx
Figure 5—figure supplement 1
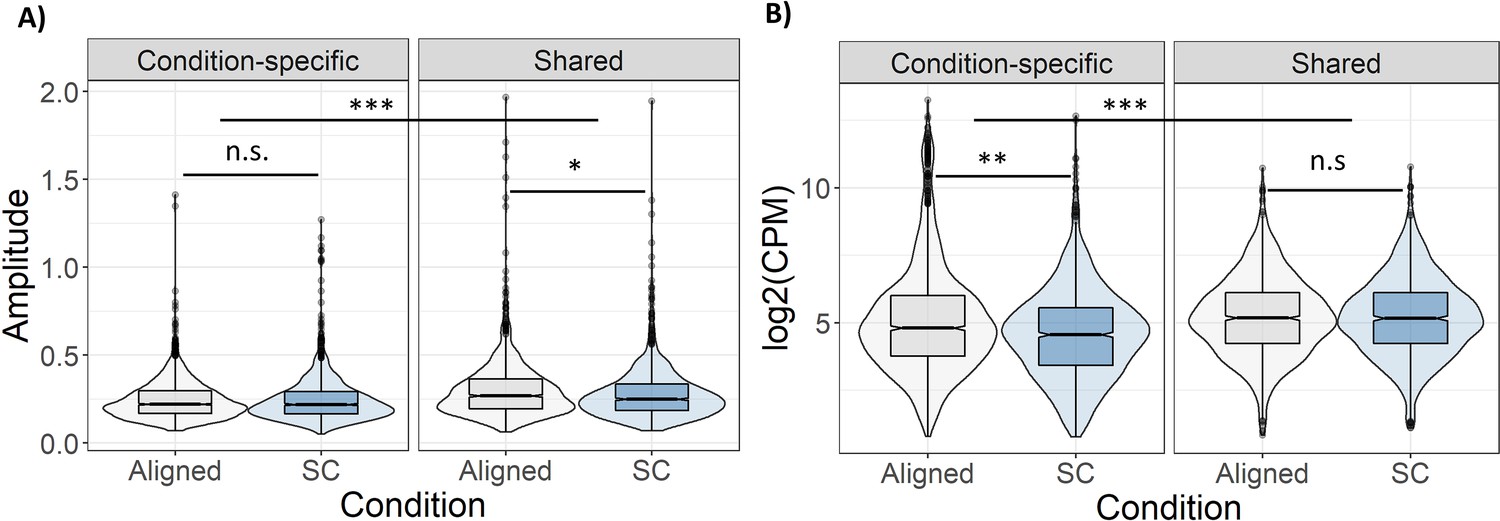
Amplitude and mean expression of rhythmic genes.
(A) Relative amplitude (midpoint to peak) of shared rhythmic genes was reduced during SC. (B) Mean expression level of condition-specific rhythmic genes was lower during SC. Significance calculated with Wilcoxon signed rank test. n.s.: not significant; *: p<0.01; **: p<1e-5; ***: p<1e-10. results.
Figure 6 with 1 supplement
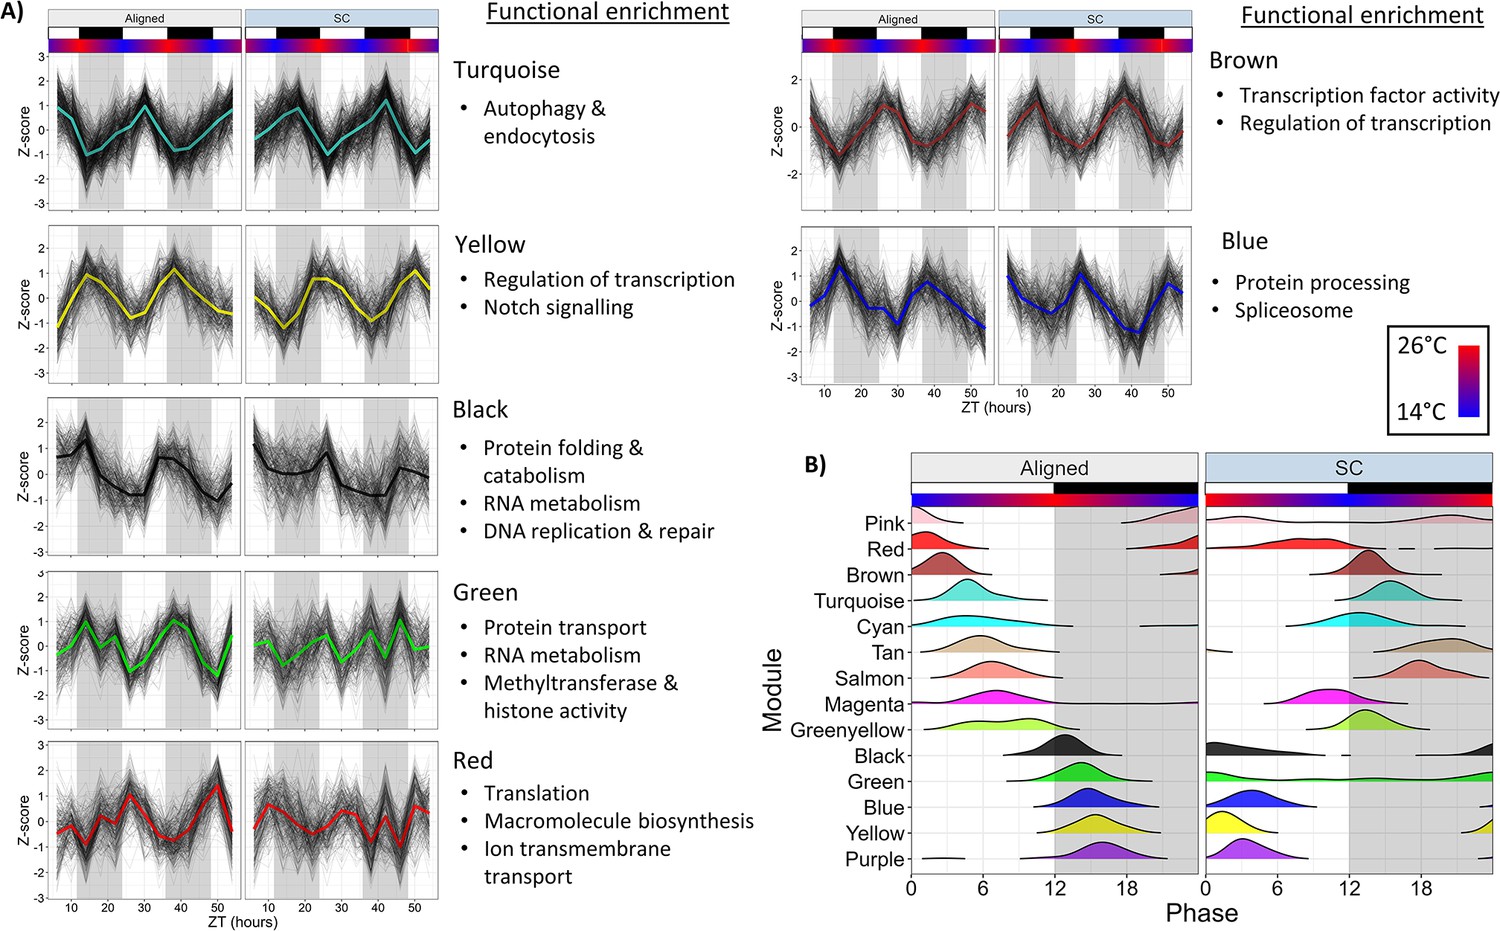
Network analysis identifies changes to rhythmically co-expressed gene modules.
(A) Expression patterns of select modules in the full network. Black lines are Z-scores (difference from mean divided by standard deviation) of the expression of each gene, and the colored line is the mean of those Z-scores. Left panels are Aligned samples, and right panels are SC samples. (B) Phase distributions of modules genes in the Full network during Aligned (left) and SC (right) conditions. Each line shows a smoothed density estimate of the phases of rhythmic genes within that module, weighted by the -log10(p-value) from RAIN. ZT0 refers to lights-on. White and black boxes indicate lights-on and lights-off, respectively; colored bars indicate temperature.
Figure 6—figure supplement 1
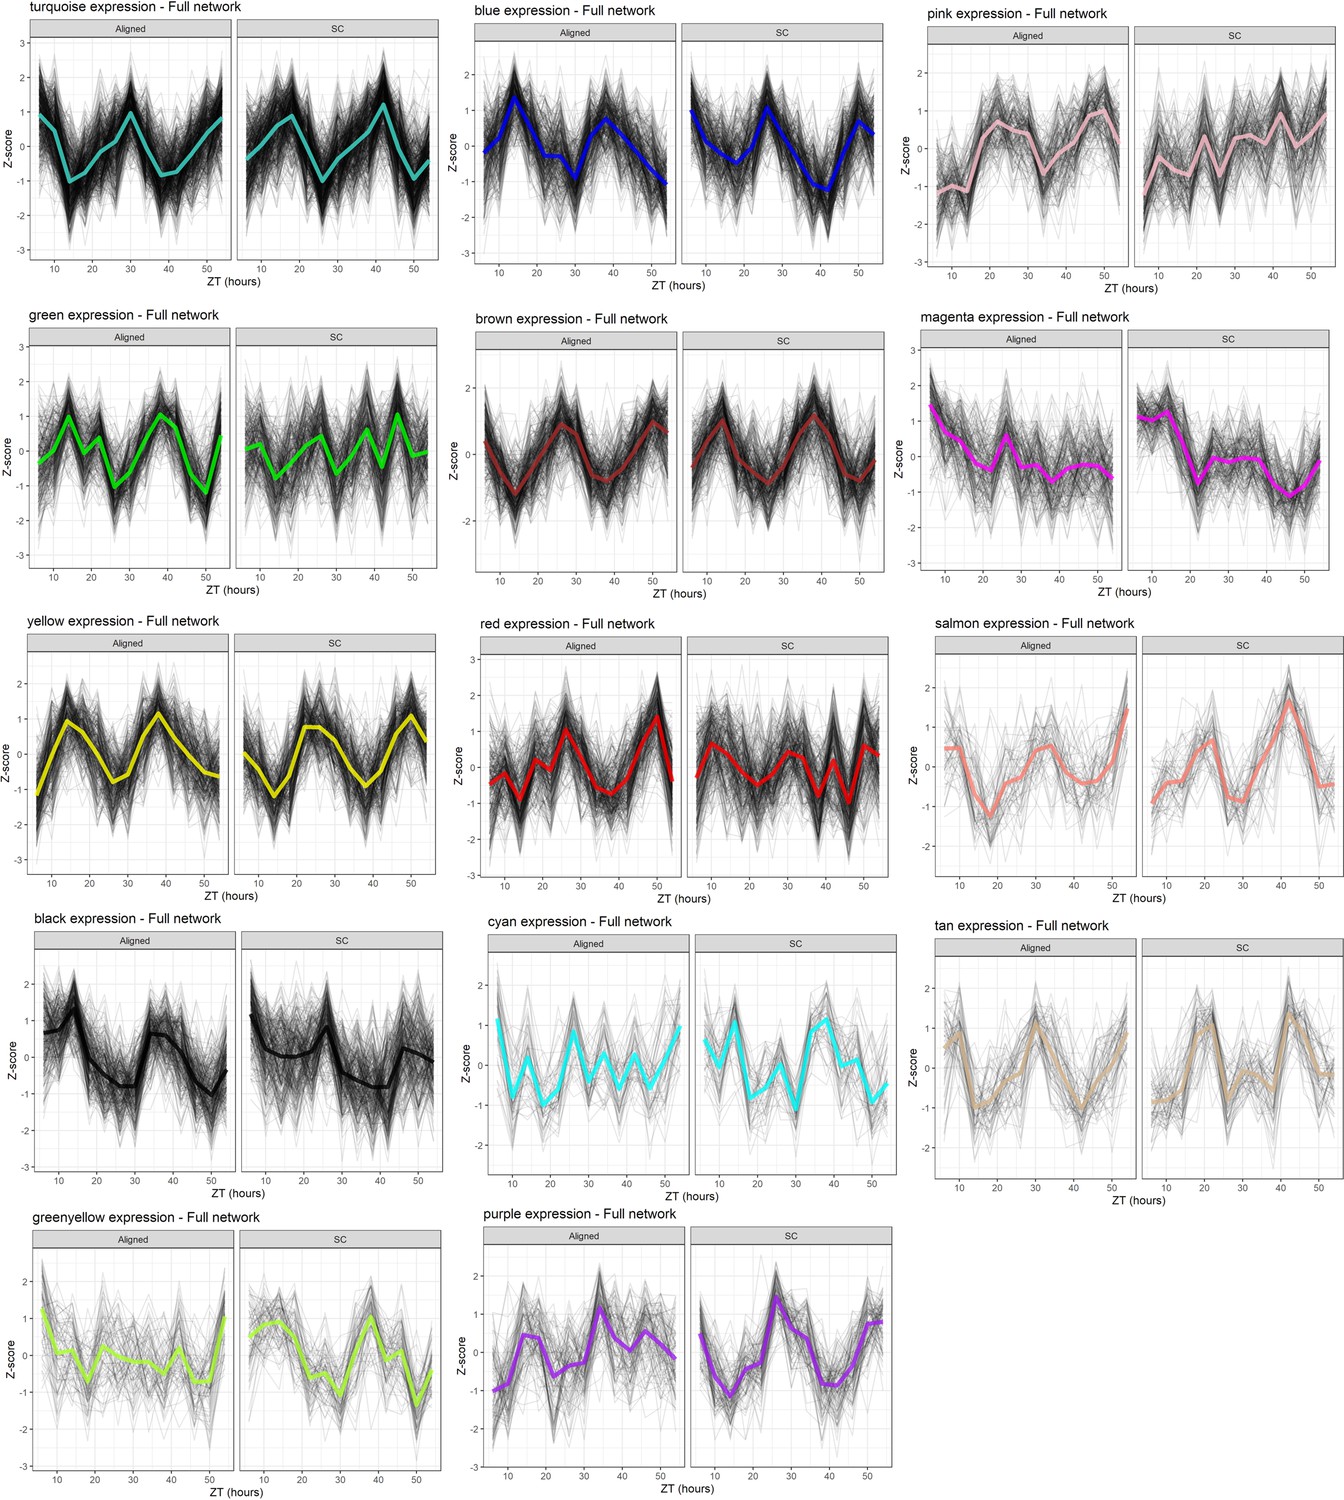
WGCNA module expression, Full network.
Black lines are Z-scores of the expression of each gene, and colored lines are means of those Z-scores. Left panels show module expression in Aligned samples, and right panels show expression in SC samples (network was inferred from all samples).
Videos
Video 1
Example of Nematostella vectensis locomotor behavior, with tracked center-point estimated by DeepLabCut.
This video is sped up 200 x and covers a period of 100 min. Width of arena is 3.5 cm.
Tables
Table 1
Summary statistics for sensory conflict experiments: Entrainment groups.
| Group | LSP p-value* | LSP power | eJTK p-value† | n rhythmic‡ | Period § | Phase § | Mean phase ¶ | Phase variance** | Amplitude†† |
|---|---|---|---|---|---|---|---|---|---|
| Aligned-cycle | 7.9e-4 | 0.85 | 2e-5 | 20/24 | 23.60 | 19.29 | 18.04 | 0.34 | 0.091 |
| Off2-cycle | 7.9e-4 | 0.75 | 2e-5 | 20/24 | 23.48 | 18.71 | 18.42 | 0.24 | 0.12 |
| Off4-cycle | 7.9e-4 | 0.84 | 2e-5 | 18/24 | 23.76 | 18.90 | 17.70 | 0.27 | 0.12 |
| Off6-cycle | 7.9e-4 | 0.60 | 2e-5 | 16/24 | 24.30 | 20.16 | 21.68 | 0.15 | 0.075 |
| Off8-cycle | 7.9e-4 | 0.85 | 2e-5 | 15/24 | 23.60 | 19.20 | 19.12 | 0.26 | 0.085 |
| Off10-cycle | 3.6e-3 | 0.19 | 1.7e-4 | 10/24 | 22.60 | 17.75 | 15.15 | 0.45 | 0.042 ‡ ‡ |
| Off12-cycle | 7.9e-4 | 0.22 | 4.5e-3 | 13/36 | 23.66 | 18.62 | 13.29 | 0.86 | 0.015 ‡ ‡ |
-
*
Tested periods between 20–28 hr.
-
†
Tested period of 24 hr.
-
‡
eJTK p<1 × 10⁻³.
-
§
determined by MFourFit.
-
¶
Circular mean of the phases of rhythmic individuals (eJTK p<1 × 10⁻³).
-
**
Circular variance of the phases of rhythmic individuals (eJTK p<1 × 10⁻³).
-
††
Determined with CircaCompare.
-
‡ ‡
:Reduced amplitude compared to Aligned-cycle, CircaCompare, p<0.05. LSP: Lomb-Scargle periodogram.
Table 2
Summary statistics for sensory conflict experiments: Free-running groups.
| Group | LSP p-value* | LSP power | eJTK p-value† | n rhythmic‡ | Period § | Phase § | Mean phase ¶ | Phase variance** | Amplitude†† |
|---|---|---|---|---|---|---|---|---|---|
| Aligned-FR | 7.9e-4 | 0.47 | 7e-5 | 10/24 | 25.84 | 11.63 | 12.67 | 0.35 | 0.060 |
| Off2-FR | 7.9e-4 | 0.79 | 7e-5 | 6/24 | 22.62 | 16.50 | 18.28 | 0.63 | 0.071 |
| Off4-FR | 7.9e-4 | 0.51 | 7e-5 | 11/24 | 23.64 | 14.17 | 6.98 | 0.74 | 0.050 |
| Off6-FR | 0.13 | 0.095 | 0.76 | 5/24 | 27.34 | 18.57 | 3.50 | 0.73 | 4.9e-3 ‡ ‡ |
| Off8-FR | 7.9e-4 | 0.67 | 7e-5 | 11/24 | 21.74 | 15.53 | 13.65 | 0.51 | 0.048 |
| Off10-FR | 0.53 | 0.042 | 0.61 | 7/24 | 28.00 | 3.39 | 10.78 | 0.70 | 2.8e-3 ‡ ‡ |
| Off12-FR | 7.9e-4 | 0.32 | 7e-5 | 6/24 | 22.96 | 11.72 | 20.65 | 0.80 | 0.034 ‡ ‡ |
-
*
Tested periods between 20–28 hr.
-
†
Tested period of 24 hr.
-
‡
eJTK p<1 × 10⁻³.
-
§
determined by MFourFit.
-
¶
Circular mean of the phases of rhythmic individuals (eJTK p<1 × 10⁻³).
-
**
Circular variance of the phases of rhythmic individuals (eJTK p<1 × 10⁻³).
-
††
Determined with CircaCompare.
-
‡ ‡
Reduced amplitude compared to Aligned-FR, CircaCompare, p<0.05. LSP: Lomb-Scargle periodogram.
Table 3
Comparison of phases of putative clock genes.
| Study | Clock | Helt | CIPC | PAR-bZIP-a | PAR-bZIP-c | Cry1a | Cry1b | Cry2 |
|---|---|---|---|---|---|---|---|---|
| Current study (Aligned) | 12.4 | 9.2 | 1.0 | 7.3 | 22.3 | 9.3 | 10.5 | 5.6 |
| Current study (SC) | 11.94 | 7.9 | 19.3 | 8.0 | 16.2 | 12.1 | NA | 21.8 |
| Oren et al., 2015* | 10.9 | 7.3 | 23.4 | 5.3 | 19.4 | 7.9 | NA | 2.3 |
| SimrBase ID | 6258 | 15017 | 4651 | 8136 | 8448 | 8109 | 8041 | 15282 |
| JGI ID | 160110 | 246249 | 245026 | 150375/ 87565 | 39846 | 168581 | 106062 | 194898 |
-
Phases estimated with CircaCompare. NA: below significance cutoff, phase not calculated. We used a p-value cutoff of p=0.01 for the current study, and p=0.05 for (Oren et al., 2015) because of their small sample size.
Key resources table
| Reagent type (species) or resource | Designation | Source or reference | Identifiers | Additional information |
|---|---|---|---|---|
| Commercial assay or kit | Aurum Total RNA Fatty and Fibrous Tissue Kit | Bio-Rad | #7326830 | |
| Commercial assay or kit | iScript cDNA synthesis kit | Bio-Rad | #1708891 | |
| Commercial assay or kit | iTaq Universal SYBR Green Supermix | Bio-Rad | #1725120 | |
| Commercial assay or kit | Aurum Total RNA Mini Kit | Bio-Rad | #736820 | |
| Software, algorithm | LinRegPCR | Ruijter et al., 2009 | ||
| Software, algorithm | NORMA-Gene | Heckmann et al., 2011 | ||
| Software, algorithm | DeepLabCut | Mathis et al., 2018 | ||
| Software, algorithm | R | R Project for Statistical Computing | RRID:SCR_001905 | |
| Sequence-based reagent | Clock_F | This paper | PCR primers | TAACCCGGAAGCTGA ATTTG |
| Sequence-based reagent | Clock_R | This paper | PCR primers | GCTTGGGGAAGACAC TAACTTG |
| Sequence-based reagent | Cry2_F | This paper | PCR primers | GCATCTGATTTGCA GAAATGG |
| Sequence-based reagent | Cry2_R | This paper | PCR primers | CTACACGGGCGA GATAGTGG |
| Sequence-based reagent | Cry1a_F | This paper | PCR primers | GCATGAATTCTG GCAGCTGG |
| Sequence-based reagent | Cry1a_R | This paper | PCR primers | CCAACTTCCACA GGGCAGAA |
| Sequence-based reagent | Cry1b_F | This paper | PCR primers | GATTCGGATGTTT GTCGCCA |
| Sequence-based reagent | Cry1b_R | This paper | PCR primers | TCGAACGAGTCCAG TGAACA |
| Sequence-based reagent | Helt_F | This paper | PCR primers | CGGACAAGGGCGCT AATGAA |
| Sequence-based reagent | Helt _R | This paper | PCR primers | CAAGGCTGTTGAGGG TCCAT |
Additional files
Download links
A two-part list of links to download the article, or parts of the article, in various formats.
Downloads (link to download the article as PDF)
Open citations (links to open the citations from this article in various online reference manager services)
Cite this article (links to download the citations from this article in formats compatible with various reference manager tools)
Sensory conflict disrupts circadian rhythms in the sea anemone Nematostella vectensis
eLife 12:e81084.
https://doi.org/10.7554/eLife.81084


