Integration of mouse ovary morphogenesis with developmental dynamics of the oviduct, ovarian ligaments, and rete ovarii
- Department of Cell Biology, Duke University Medical Center, United States
- Department of Genetics, The University of Texas MD Anderson Cancer Center, United States
Figures
Figure 1 with 1 supplement
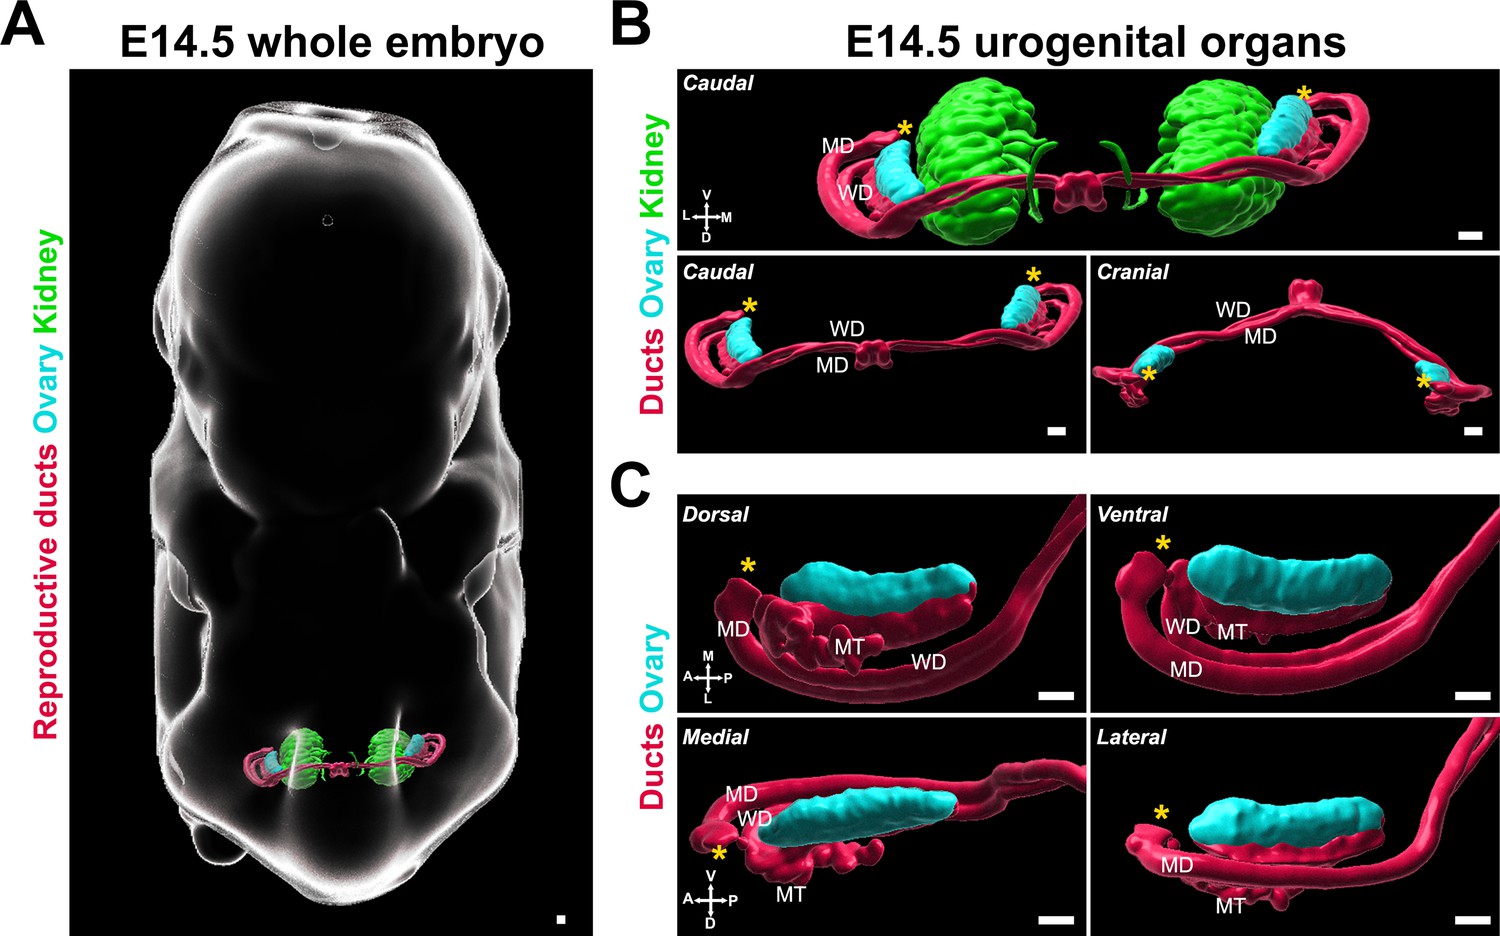
3D models of developing ovaries provide a new perspective of ovary morphology.
(A) 3D model generated by isosurface segmentation of lightsheet images taken of a whole XX embryo at E14.5 immunostained for PAX8 (kidney, reproductive ducts, green, red) and FOXL2 (gonad, cyan). (B) Caudal and cranial views of the surfaces representing the urogenital system, with and without the kidney surfaces, isolated from the whole embryo images in (A). (C) Close-ups of dorsal, ventral, medial, and lateral views of the surfaces representing the ovary and reproductive ducts, isolated from the images in (A). MD, Müllerian duct; MT, mesonephric tubule; WD, Wolffian duct. Yellow asterisks indicate the location of the infundibulum of the presumptive oviduct for reference. Compasses on the bottom left of each panel indicate the orientation of the ovary: A, anterior; D, dorsal; L, lateral; M, medial; P, posterior; V, ventral. Scale bars, 100 μm.
Figure 1—video 1
3D model of an XX embryo at E14.5.
Imaris isosurface segmentation tool was used to generate 3D models of the whole embryo volume (grayscale, based on background staining), the kidneys (green, based on PAX8 immunolabeling), the reproductive tract epithelia (red, based on PAX8 labeling), and the ovary (cyan, based on FOXL2 immunolabeling). The video shows rotation and close-ups of the sample to view different aspects of the complexes in their native context.
Figure 2 with 2 supplements
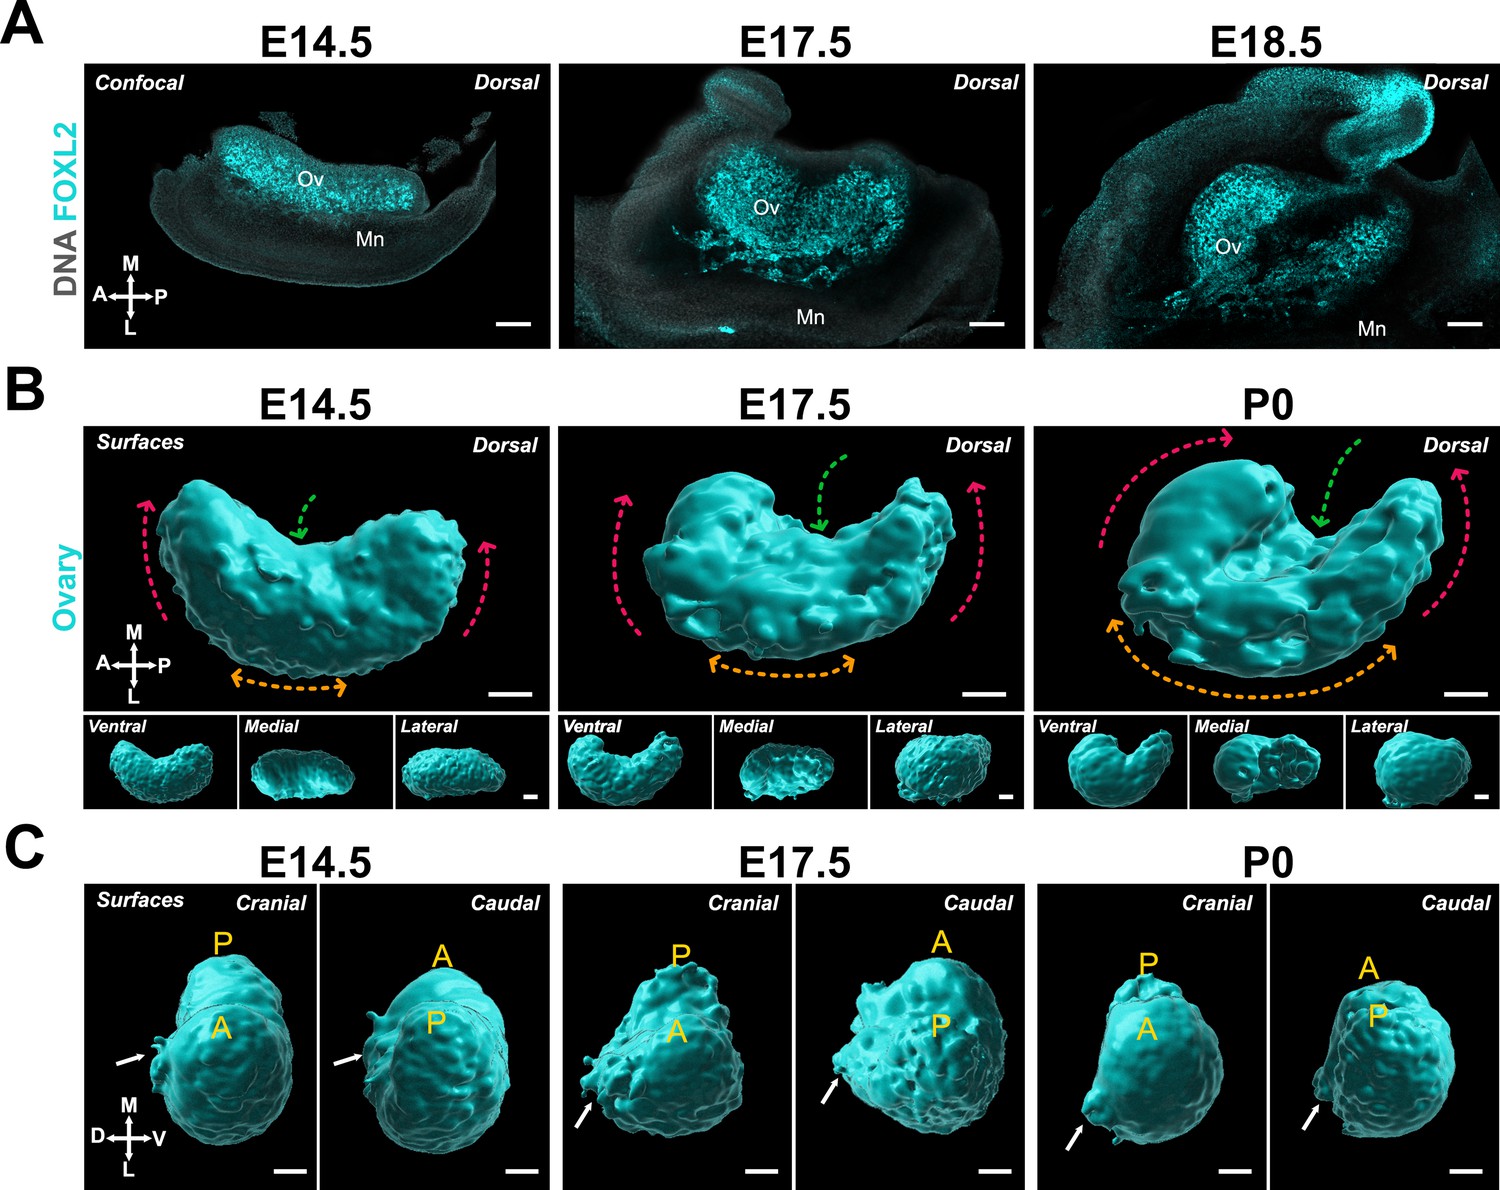
The ovary transitions from elongated to crescent-shaped during late gestation.
(A) Optical sections from confocal Z-stacks of whole immunostaining of ovary/mesonephros complexes at E14.5, E17.5, and E18.5 immunostained for FOXL2 (cyan) and counterstained with Hoechst nuclear dye (grayscale). (B) 3D model generated by isosurface segmentation of lightsheet images taken of whole ovaries at E14.5, E17.5, and P0 immunostained for FOXL2 (cyan). Top large panels represent the dorsal view, while small bottom panels illustrate ventral, medial, and lateral views of the same ovary. Dashed arrows illustrate the change in conformation of the ovary as it develops: red arrows, relocation of the anterior and posterior poles; green arrows, medial inflexion; orange arrows, increase in lateral concavity. (C) Cranial and caudal views of the surface of the ovaries presented in (B). White arrows point to the dorsal protrusion of the ovarian domain. A, anterior pole; MD, Müllerian duct; Mn, mesonephros; Ov, ovary; P, posterior pole. Compasses on the bottom left of each panel indicate the orientation of the ovary: A, anterior; D, dorsal; L, lateral; M, medial; P, posterior; V, ventral. Scale bars, 100 μm.
Figure 2—figure supplement 1
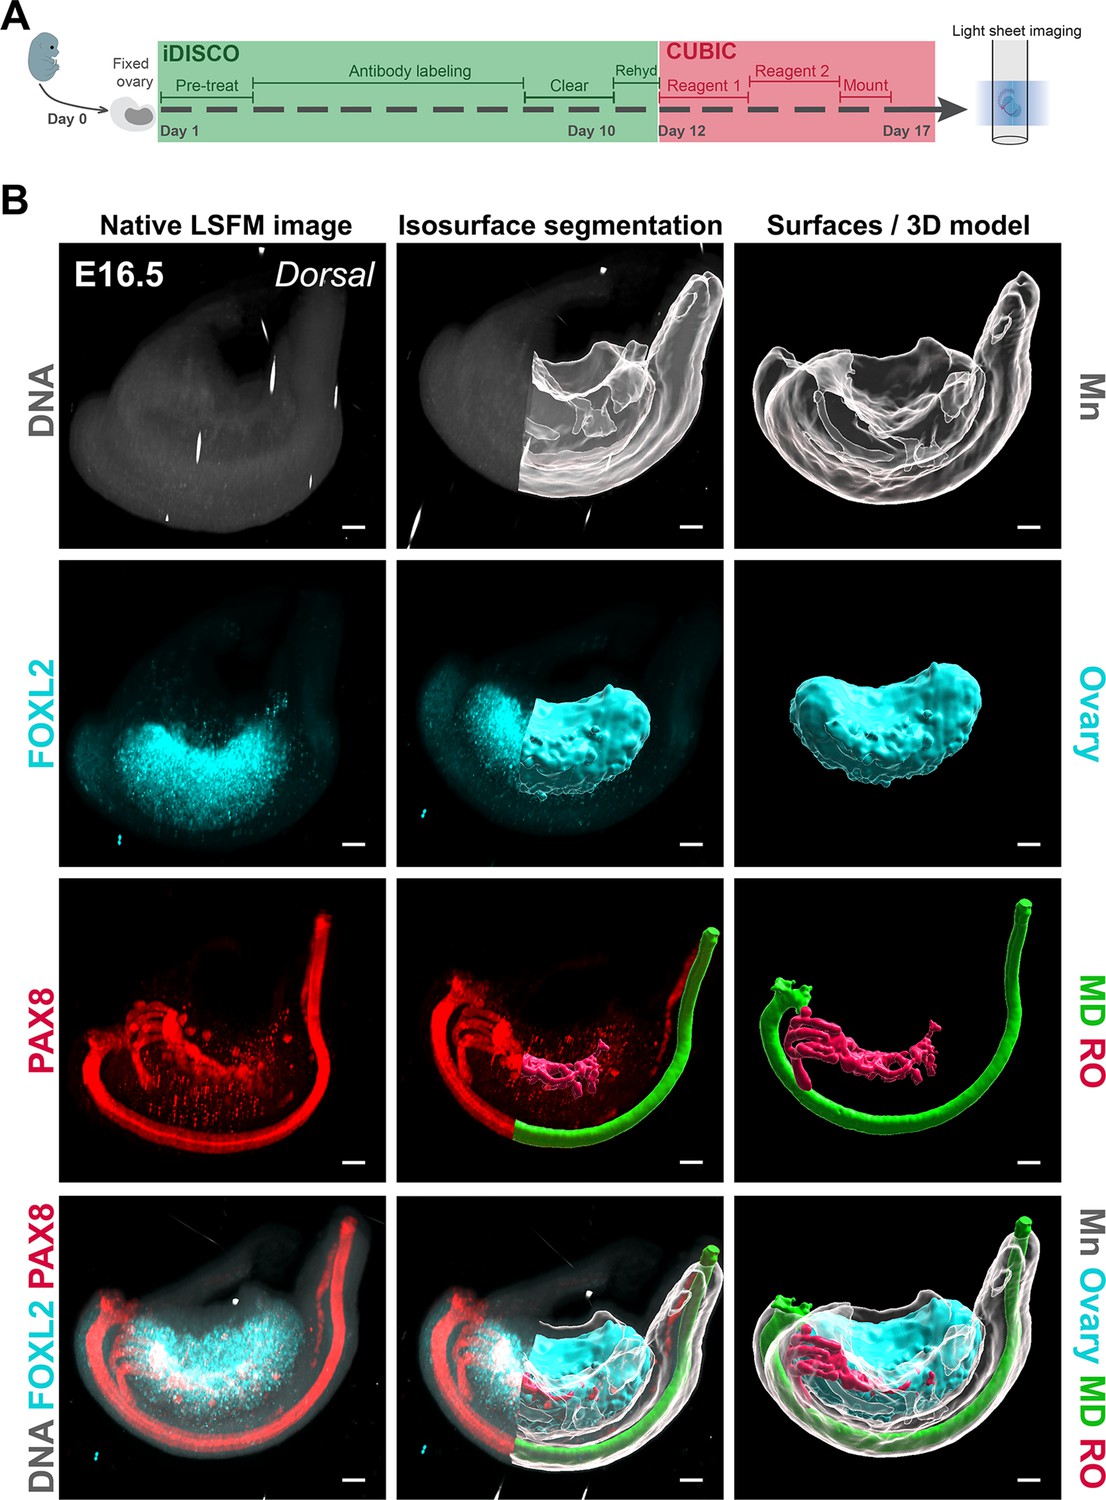
Approach to generate 3D models of the developing ovary.
(A) Schematic depicting the basic pipeline for producing 3D images of the fetal mouse ovary using iDISCO+CUBIC tissue clearing and lightsheet microscopy. (B) Approach for generating 3D models in Imaris software using isosurface segmentation of lightsheet images for each of the main markers used in this study. The left column shows the 3D maximum intensity projection view of the raw lightsheet Z-stack of an ovary/mesonephros complex E16.5 immunostained for FOXL2 (cyan) and PAX8 (red), and counterstained with Hoechst nuclear dye (grayscale); the middle column shows the process of isosurface segmentation in Imaris and the right column shows the final 3D surfaces used in the figures throughout the manuscript. MD, Mullerian duct; Mn, mesonephros; RO, rete ovarii. Scale bars, 100 μm.
Figure 2—video 1
Imaris workflow.
The video shows the 3D rendering of native lightsheet images of an E14.5 ovary mesonephros complex labeled with FOXL2 to visualize the gonad (cyan), PAX8 to visualize the reproductive ducts (red), and Hoechst nuclear dye to visualize the whole complex (grayscale). The next frames show the transition from native data to 3D models using isosurface segmentation in Imaris software and rotation of the sample to capture different 3D views of the ovary and mesonephros in their native conformation.
Figure 3
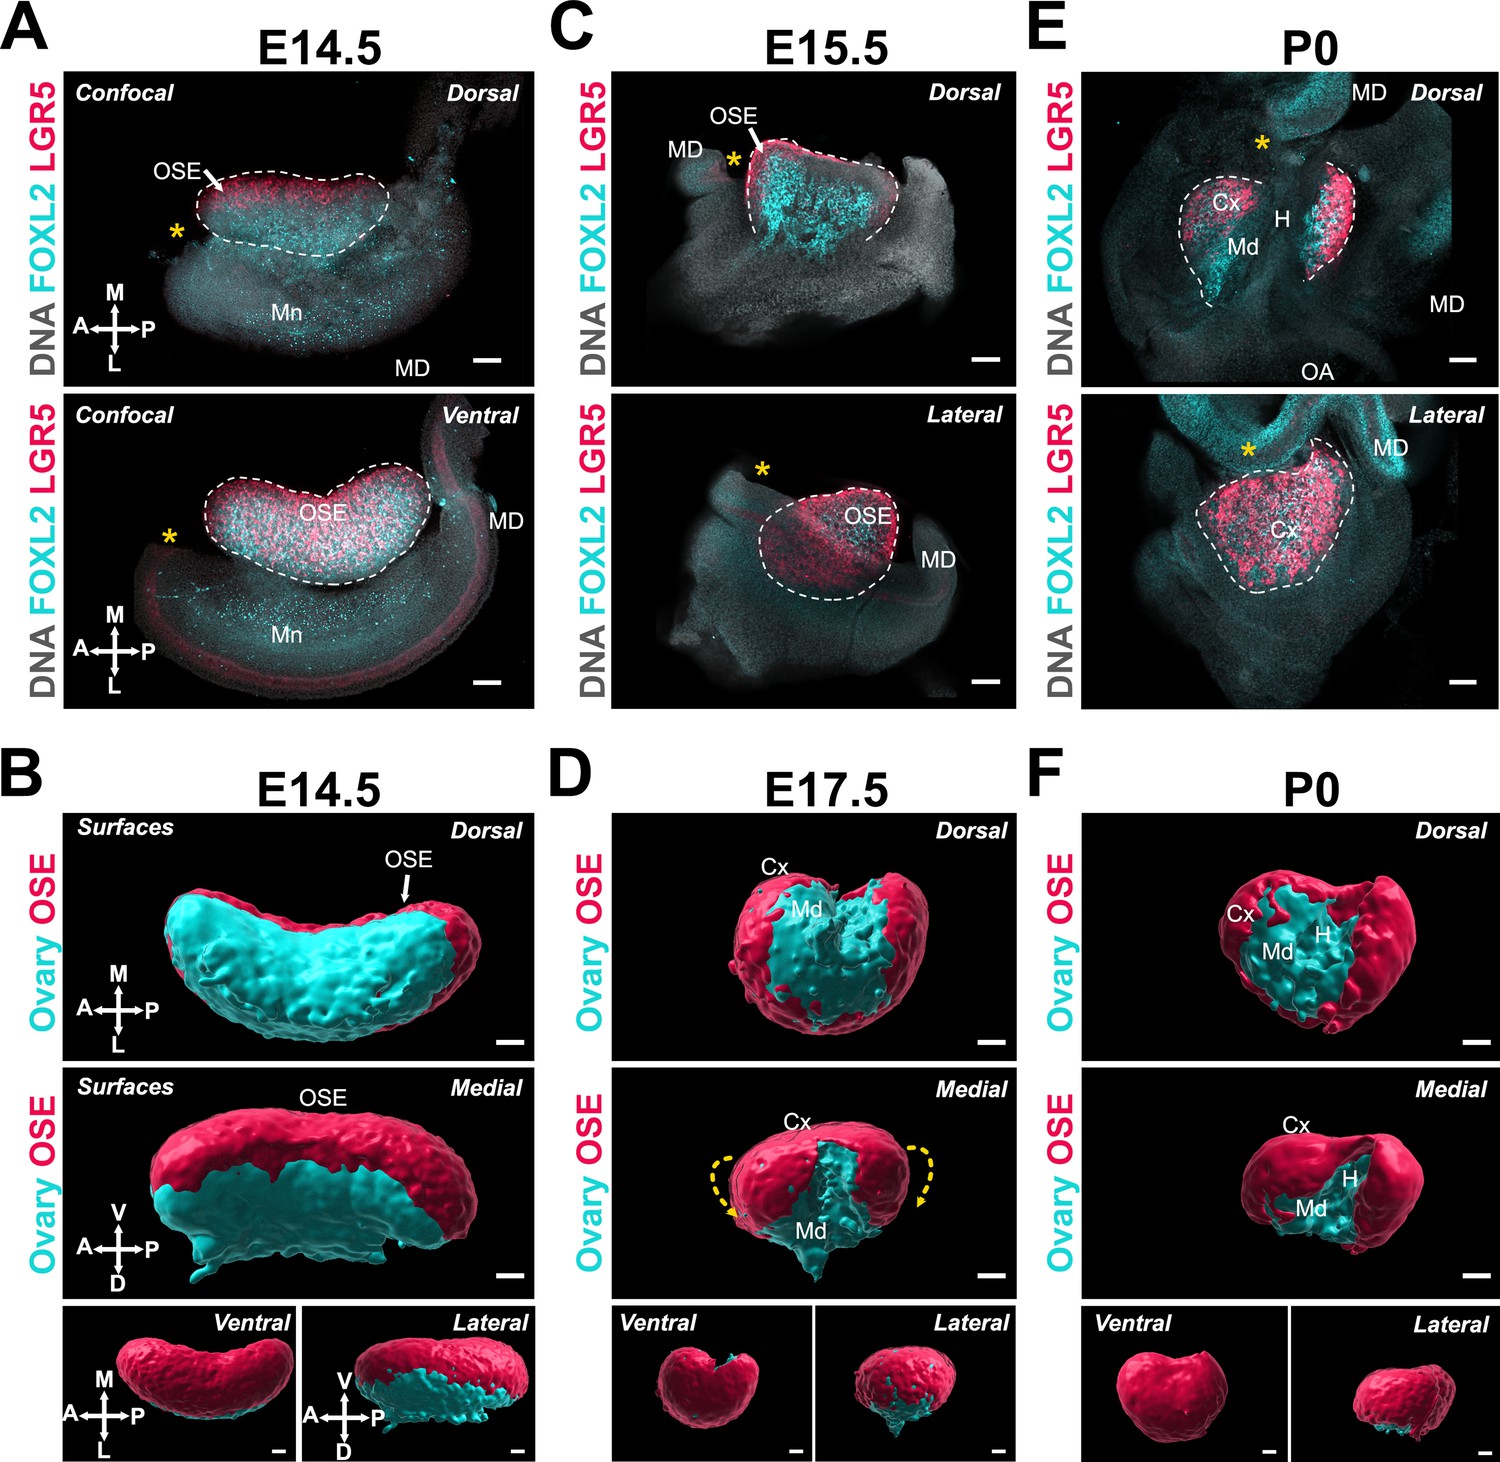
Ovary folding is concomitant with specification of the medullary and cortical compartments of the ovary.
(A, C, E) Optical sections from confocal Z-stacks of whole ovary/mesonephros complexes from Lgr5-Gfp mice at E14.5, E15.5, and P0 immunostained for GFP (red) and FOXL2 (cyan), and counterstained with Hoechst nuclear dye (grayscale). Images in the top row were taken from the dorsal side and the bottom row from the ventral (E14.5) or lateral (E17.5; P0). Yellow asterisks indicate the location of the infundibulum of the presumptive oviduct for reference. (B, D, F) 3D models generated by isosurface segmentation of lightsheet images taken of whole ovaries from Lgr5-Gfp mice at E14.5, E17.5, and P0 immunostained for FOXL2 (cyan) and GFP (red). Top panels represent the dorsal view, middle panels represent the medial view, and small bottom panels illustrate ventral and lateral views of the same ovary. Yellow dashed arrows in (D) indicate the wrapping of the ovarian surface epithelium (OSE) from the ventral to the dorsal side of the ovarian domain. White arrows point to the OSE. Cx, cortex; H, hilum; MD, Müllerian duct; Md, medulla; Mn, mesonephros. Compasses on the bottom left of each panel indicate the orientation of the ovary for the entire row: A, anterior; D, dorsal; L, lateral; M, medial; P, posterior; V, ventral. Scale bars, 100 μm.
Figure 4
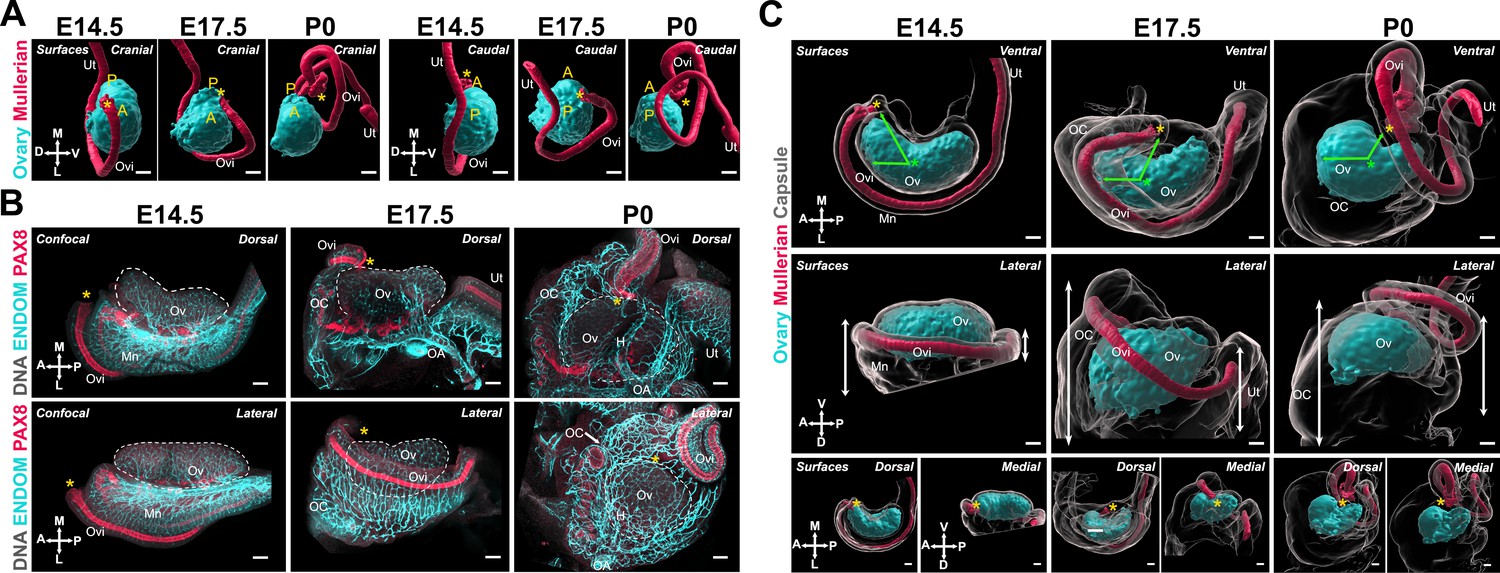
The expansion and relocation of the Müllerian duct leave the ovary fully encapsulated.
(A) 3D model generated by isosurface segmentation of lightsheet images taken of whole ovaries at E14.5, E17.5, and P0 immunostained for FOXL2 (cyan) and PAX8 (red). A, anterior pole; P, posterior pole. (B) Maximum intensity projections from confocal Z-stacks of whole ovary/mesonephros complexes at E14.5 (B, left), E17.5 (B, middle), and P0 (B, right) immunostained for PAX8 (red) and ENDOMUCIN (cyan), and counterstained with Hoechst nuclear dye (grayscale). Images in the top row were taken from the dorsal side and the bottom row from the lateral side. Yellow asterisks indicate the location of the infundibulum of the presumptive oviduct for reference. (C) 3D models generated by isosurface segmentation of lightsheet images taken of whole ovaries at E14.5 (C, left), E17.5 (C, middle), and P0 (C, right) immunostained for FOXL2 (cyan) and PAX8 (red), and counterstained with Hoechst nuclear dye (grayscale). The isosurfaces generated with the gray channel allow for visualization of the entire tissue, including the ovarian capsule. White arrowheads point to the Hoechst-based surface of the ovary, which extends beyond the FOXL2+domain, and should not be confused with the ovarian capsule. Top panels represent the ventral view, middle panels represent the lateral view, and small bottom panels illustrate dorsal and medial views of the same ovary. Green arrows indicate the change in position of the infundibulum relative to the longitudinal plane of the ovary. Green asterisks indicate the approximate center of the ovary. White double arrows indicate the extension of mesonephric tissue around the ovary in the anterior (left arrows) and posterior regions (right arrows). Yellow asterisks indicate the location of the infundibulum of the presumptive oviduct for reference. H, hilum; MD, Müllerian duct; Mn, mesonephros; OA, ovarian artery; OC, ovarian capsule; Ov, ovary; Ovi, oviduct; Ut, uterus. Compasses on the bottom left of each panel indicate the orientation of the ovary for the entire row: A, anterior; D, dorsal; L, lateral; M, medial; P, posterior; V, ventral. Scale bars, 100 μm.
Figure 5 with 1 supplement

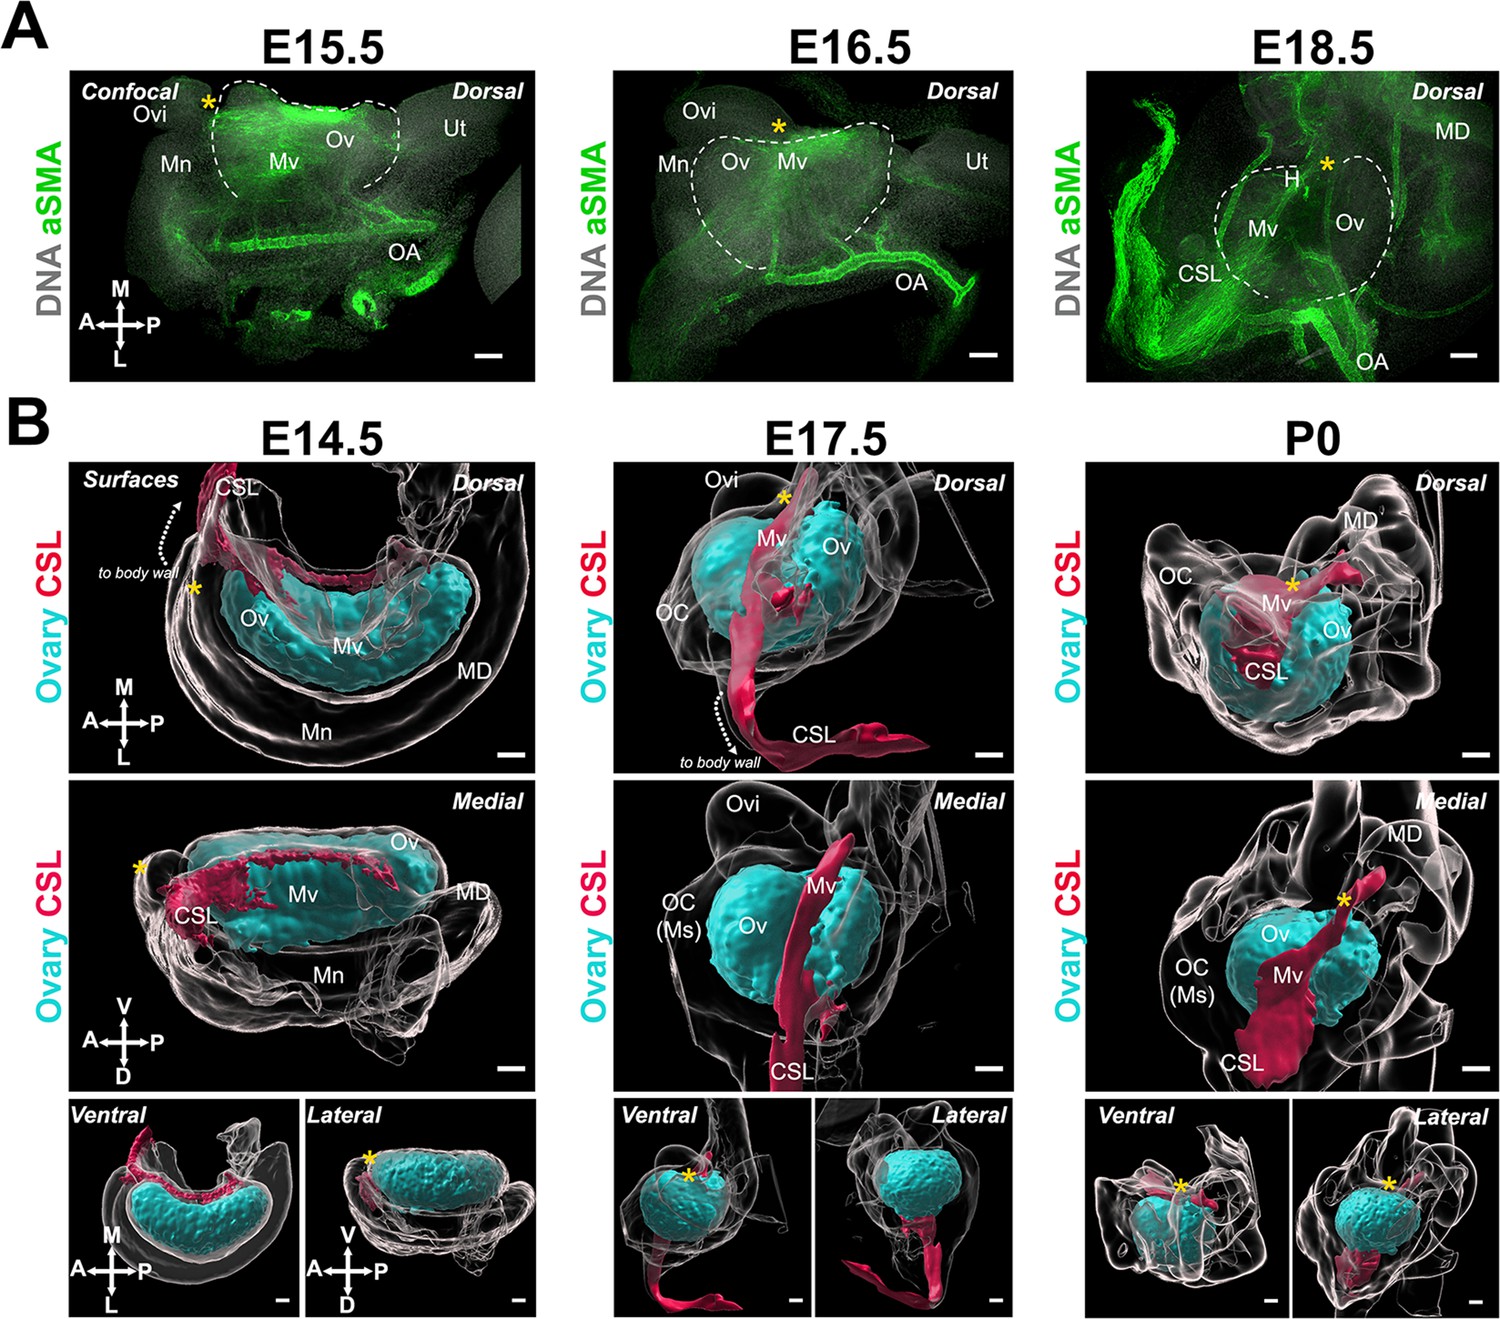
Developmental dynamics of the ovarian ligaments correlate with ovary morphogenesis.
(A) Maximum intensity projections from confocal Z-stacks of whole urogenital complexes at E15.5, E16.5, and E18.5 immunostained for TUJ1 (red) and FOXL2 (cyan—left and middle panel only), and counterstained with Hoechst nuclear dye (grayscale). Images on the bottom row are close-ups of the regions outlined in the top row images. (B) Maximum intensity projections from confocal Z-stacks of the whole urogenital complex of XX SF1-eGFP mice at E14.5 (left) and P0 (right), immunostained for GFP (green) and TNC (E14.4, red) or aSMA (P0, red), and counterstained with Hoechst nuclear dye (grayscale). The E14.5 sample was imaged from the ventral side and the P0 from the dorsal. The left bottom panel is a high magnification view of the area outlined in the left top panel. White arrows point to the continuity of the CSL from the ovary to the adrenal. (C) Maximum intensity projections from confocal Z-stacks of whole ovary/mesonephros complexes at E14.5 and E18.5 immunostained for FOXL2 (cyan) and TNC (red), and imaged from the medial side. White arrows point to the continuity of the CSL between the medial ridge of the ovary and the infundibulum. (D) Maximum intensity projections from confocal Z-stacks of whole ovary/mesonephros complexes at E15.5, E16.5, and E17.5 immunostained for RUNX1 (cyan) and aSMA (red), and imaged from the ventral side. White arrows point to the population of RUNX1+ cells linking the medial edge of the mesovarium to the infundibulum, and to the CSL. (E) 3D models generated by isosurface segmentation of lightsheet images taken of whole ovary/mesonephros complexes at E14.5 (left) and E17.5 (right) stained with Hoechst nuclear dye (grayscale), and false-colored to illustrate the three regions of the BL (purple, mesometrium; yellow, mesosalpinx; green, mesovarium), the CSL (red), and the ovary (cyan). Each row represents a different view of the same ovary for each stage (from top to bottom: medial; ventral; lateral; dorsal). Yellow asterisks indicate the location of the infundibulum of the presumptive oviduct for reference. Ad, adrenal; CSL, cranial suspensory ligament; K, kidney; Mm, mesometrium; Mn, mesonephros; Ms, mesosalpinx; Mv, mesovarium; OC, ovarian capsule; Ov, ovary; Ovi, oviduct; Ut, uterus. Scale bars, 100 μm.
Figure 5—figure supplement 1
The mesovarium and cranial suspensory ligament tether the ovary to the rest of the urogenital complex.
(A) Confocal images of whole ovary/mesonephros complexes at E15.5, E16.5, and E18.5 immunostained for aSMA (green), and counterstained with Hoechst nuclear dye (grayscale). Samples in the top two rows were imaged from the dorsal side and samples in the bottom row from the medial side. (B) 3D models generated by isosurface segmentation of lightsheet images taken of whole ovaries at E14.5, E17.5 and P0 immunostained for FOXL2 (cyan) and TNC (E14.5, red) or labeled with AF647-Hydrazine to reveal Elastin expression (E17.5, P0, red). All samples were counterstained with Hoechst nuclear dye (grayscale). Top panels represent the dorsal view, middle panels represent the medial view, and small bottom panels illustrate ventral and lateral views of the same ovary. White dashed arrows show the direction to the body wall. Yellow asterisks indicate the location of the infundibulum of the presumptive oviduct for reference. Compasses on the bottom left of each panel indicate the orientation of the ovary for the entire row: CSL, cranial suspensory ligament; D, dorsal; H, hilum; L, lateral; M, medial; MD, Müllerian duct; Mm, mesometrium; Mn, mesonephros; Ms, mesosalpinx; Mv, mesovarium; OA, ovarian artery; OC, ovarian capsule; Ov, ovary; Ovi, oviduct; Ut, uterus; V, ventral. Scale bars, 100 μm.
Figure 6 with 2 supplements
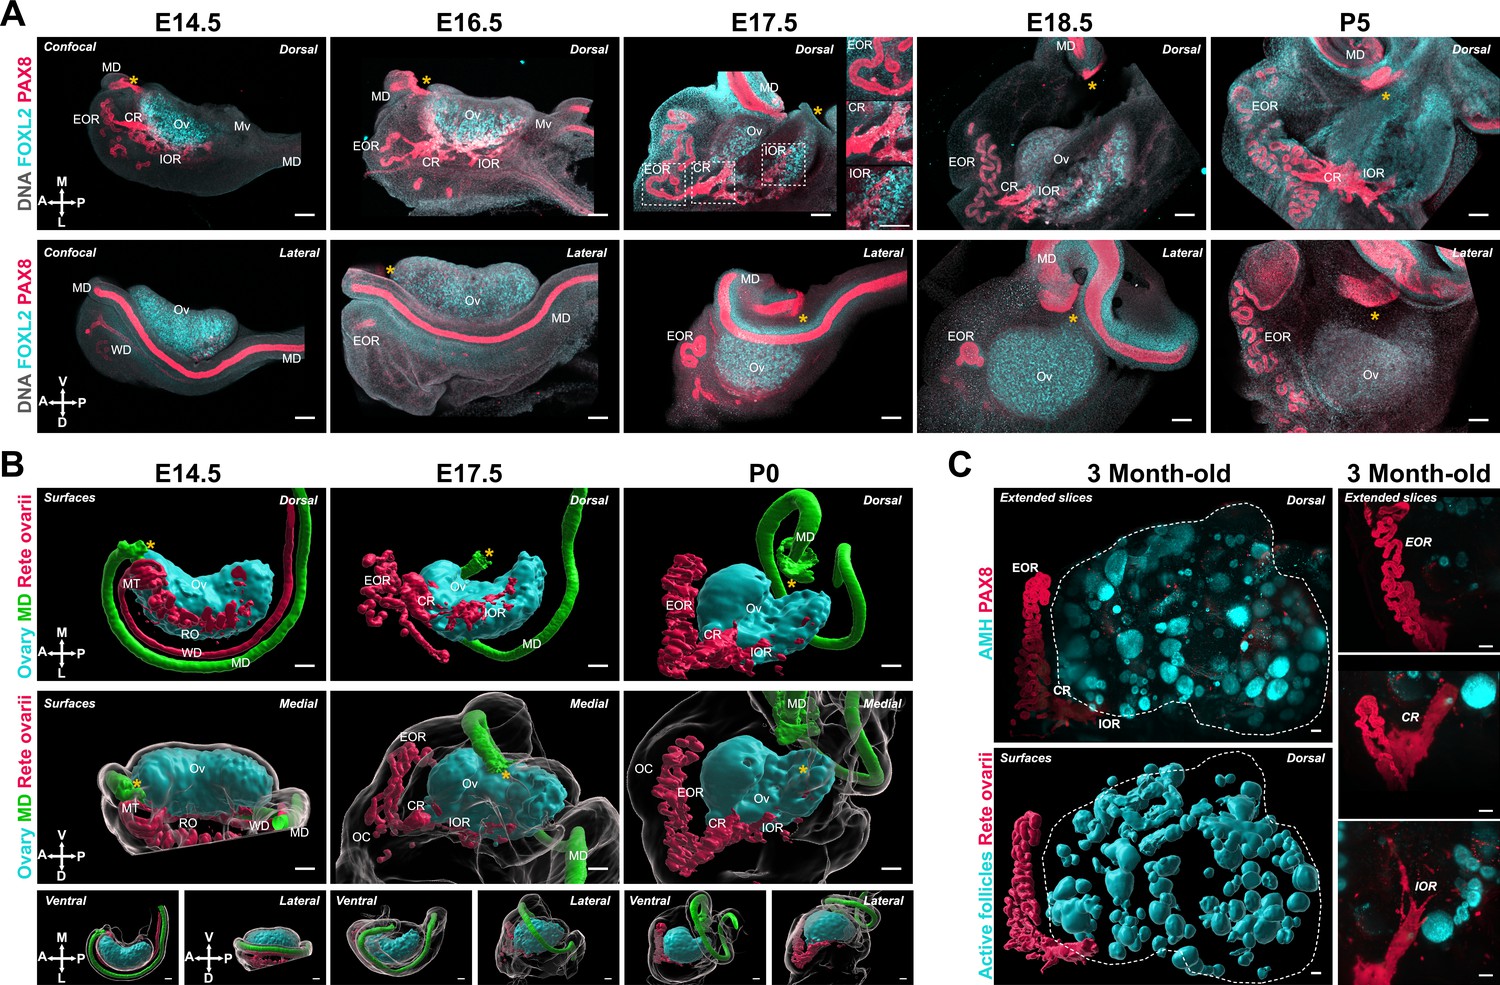
Developmental dynamics of the rete ovarii correlate with ovary morphogenesis.
(A) Maximum intensity projections from confocal Z-stacks of whole ovary/mesonephros complexes at E14.5, E16.5, E17.5, E18.5, and P5, immunostained for FOXL2 (cyan) and PAX8 (red), and counterstained with Hoechst nuclear dye (grayscale). Samples in the top row were imaged from the dorsal side and samples from the bottom row from the lateral side. Side panels in (A, E17.5) are close-ups of the three regions of the RO outlined at E17.5 (from top to bottom: EOR, CR, and IOR). (B) 3D models generated by isosurface segmentation of lightsheet images taken of whole ovaries at E14.5, E17.5, and P0 immunostained for FOXL2 (cyan) and PAX8 (Müllerian duct, green; and Rete ovarii, red). All samples were counterstained with Hoechst nuclear dye (grayscale). Top panels represent the dorsal view, middle panels represent the medial view, and small bottom panels illustrate ventral and lateral views of the same ovary. Yellow asterisks indicate the location of the infundibulum of the presumptive oviduct for reference. Compasses on the bottom left of each panel indicate the orientation of the ovary: ; D, dorsal; L, lateral; M, medial; V, ventral. (C) Lightsheet images of whole ovaries from 3-month-old mice immunostained for AMH (cyan) and PAX8 (red). The top panel shows the extended slice view of the native image, while the bottom panel illustrates the 3D surfaces of the RO (PAX8, red) and ovarian follicles (AMH, cyan) generated by isosurface segmentation of the same image. Images in the right panel are close-ups of the three regions of the RO in an adult ovary: top—EOR; middle—CR; bottom—IOR. CR, connecting rete; EOR, extraovarian rete; IOR, intraovarian rete; MD, Müllerian duct; Mn, mesonephros; MT, mesonephric tubules; Mv, mesovarium; OC, ovarian capsule; Ov, ovary; RO, rete ovarii; WD, Wolffian duct. Scale bars, 100 μm.
Figure 6—figure supplement 1
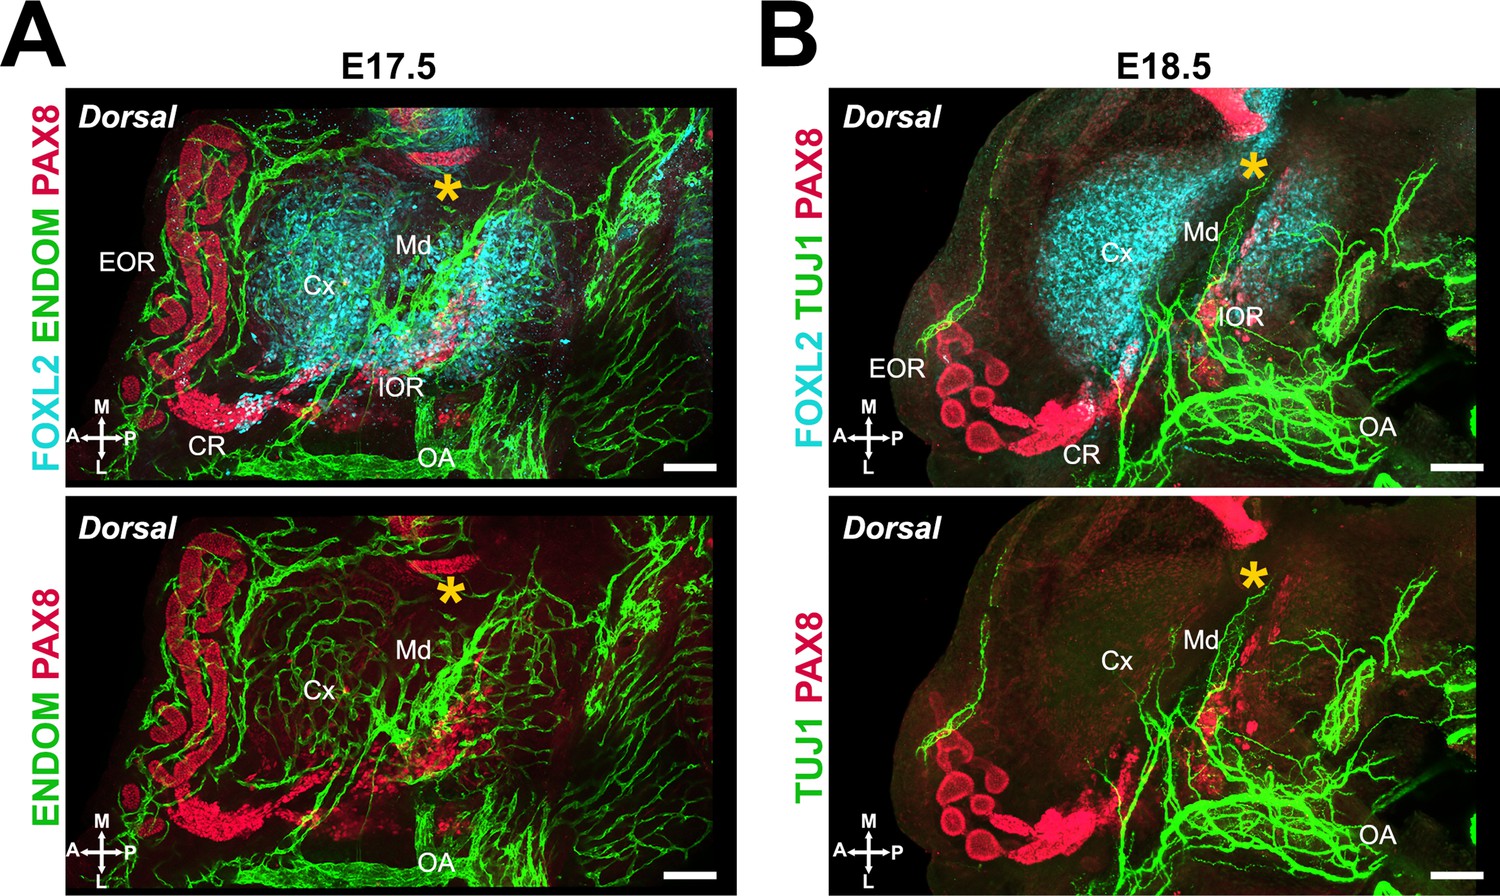
The IOR and CR coincide with the point of entry of vasculature and innervation into the ovary.
(A) Maximum intensity projections from confocal Z-stacks of the dorsal side of the whole ovary/mesonephros complex at E17.5 immunostained for ENDOMUCIN (green) and PAX8 (red). (B) Maximum intensity projections from confocal Z-stacks of a whole ovary/mesonephros complex at E18.5 immunostained for TUJ1 (green) and PAX8 (red), imaged from the dorsal side. Yellow asterisks indicate the location of the infundibulum of the presumptive oviduct for reference. CR, connecting rete; Cx, cortex; EOR, extraovarian rete; IOR, intraovarian rete; Md, medulla; OA, ovarian artery. Compasses on the bottom left of each panel indicate the orientation of the ovary: D, dorsal; L, lateral; M, medial; V, ventral. Scale bars, 100 μm.
Figure 6—figure supplement 2
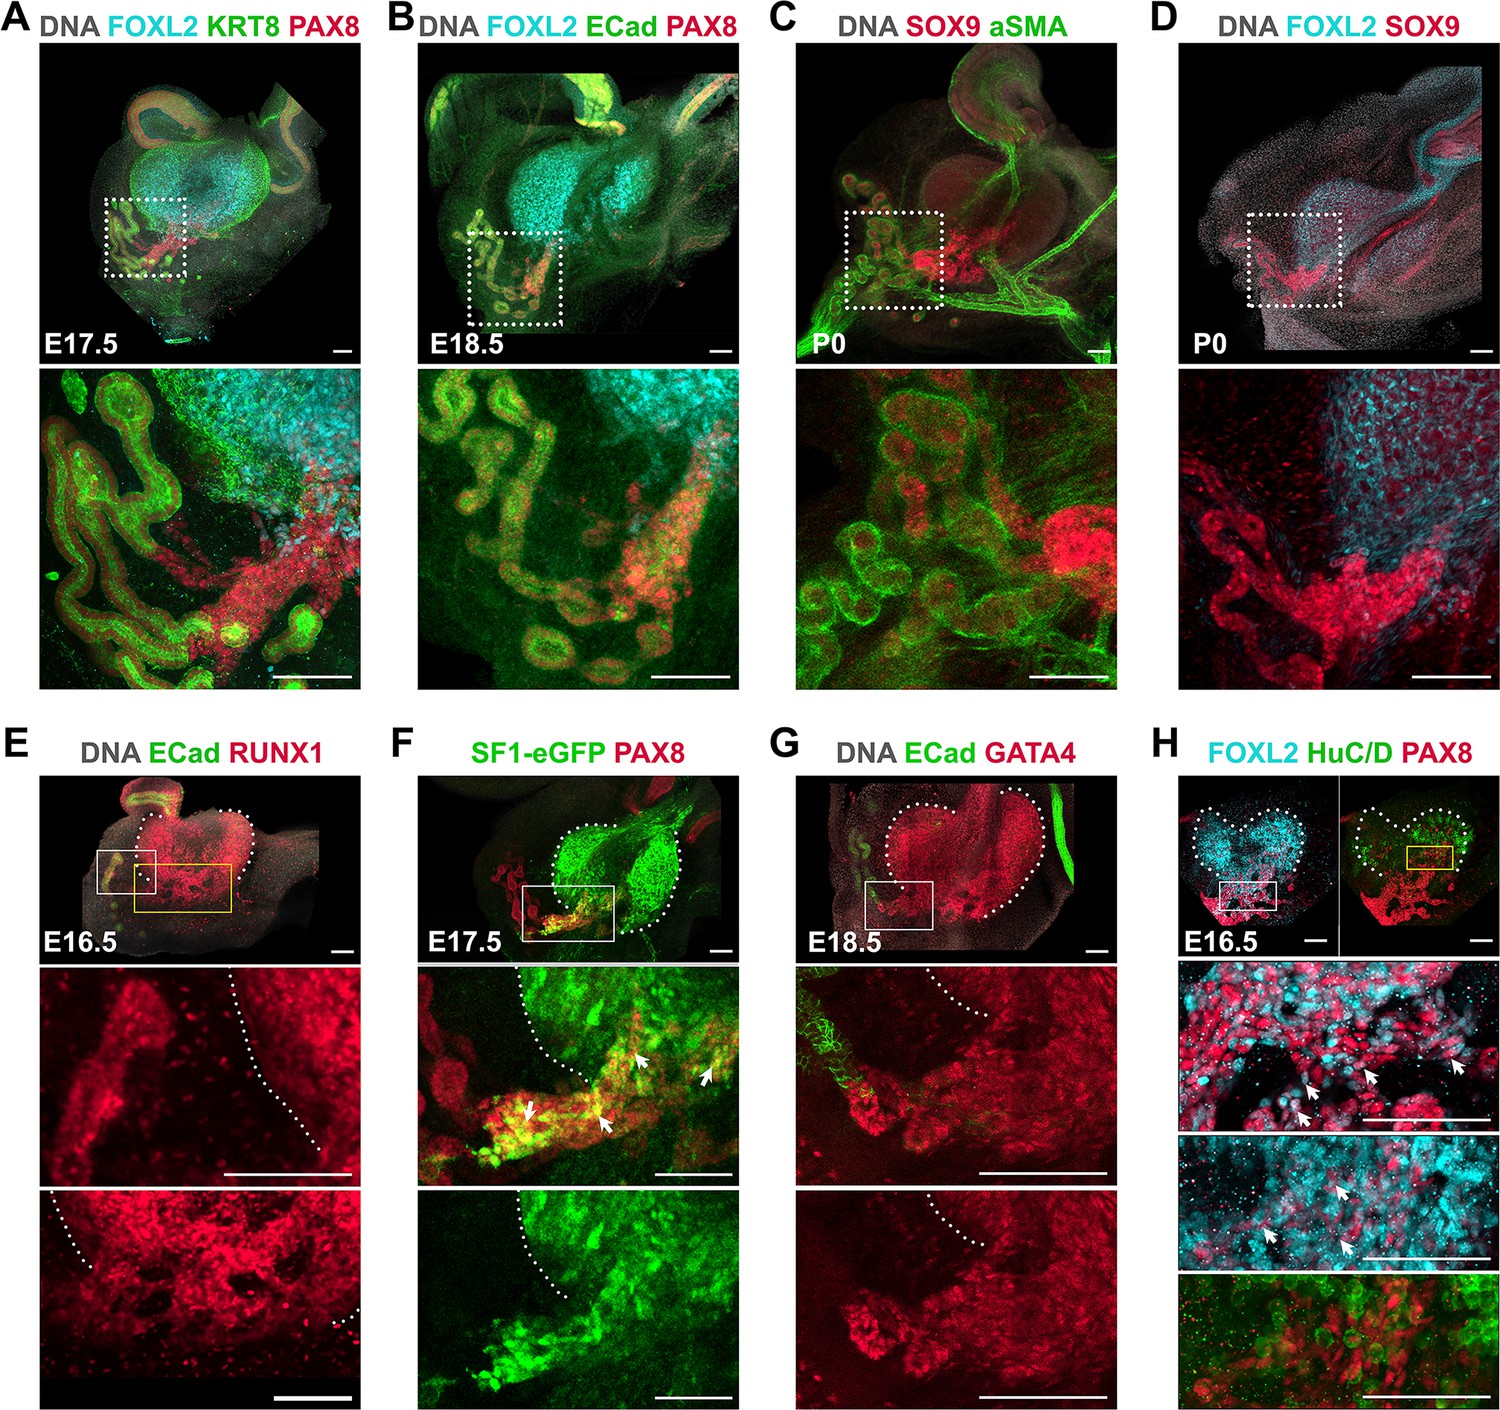
Expression of known epithelial and gonadal markers in the different regions of the rete ovarii.
(A–D) Maximum intensity projections from confocal Z-stacks of whole ovary/mesonephros complexes at E17.5, E18.5, or P0, imaged from the dorsal side. Images in the bottom row are close-ups of the areas outlined in the top row. (A) Immunostaining for FOXL2 (cyan), PAX8 (red), and KERATIN-8 (KRT8, green). (B) Immunostaining for FOXL2 (cyan), PAX8 (red), and E-CADHERIN (ECad, green). (C) Immunostaining for SOX9 (cyan) and aSMA (red). (D) Immunostaining for FOXL2 (cyan) and SOX9 (red). (E–H) Maximum intensity projections from confocal Z-stacks of whole ovary/mesonephros complexes from wild-type (E, G, H) or Sf1-eGFP (F) embryos at E16.5 (E, H), E17.5 (F), or E18.5 (G), imaged from the dorsal side. (E) Immunostaining for RUNX1 (red) and E-CADHERIN (ECad, green). (F) Immunostaining E17.5 Sf1-eGFP for GFP (green) and PAX8 (red). (G) Immunostaining for ECad (cyan) and GATA4 (red). (H) Immunostaining for FOXL2 (cyan), PAX8 (red), and HuC/D (green). White arrows point to PAX8+ cells that are also labeled with gonadal markers. Images in the bottom rows are close-ups of the areas outlined in the top row. Yellow rectangles in (E) and (H) outline the regions blown up in the lowest row. Scale bars, 100 μm.
Figure 7 with 1 supplement
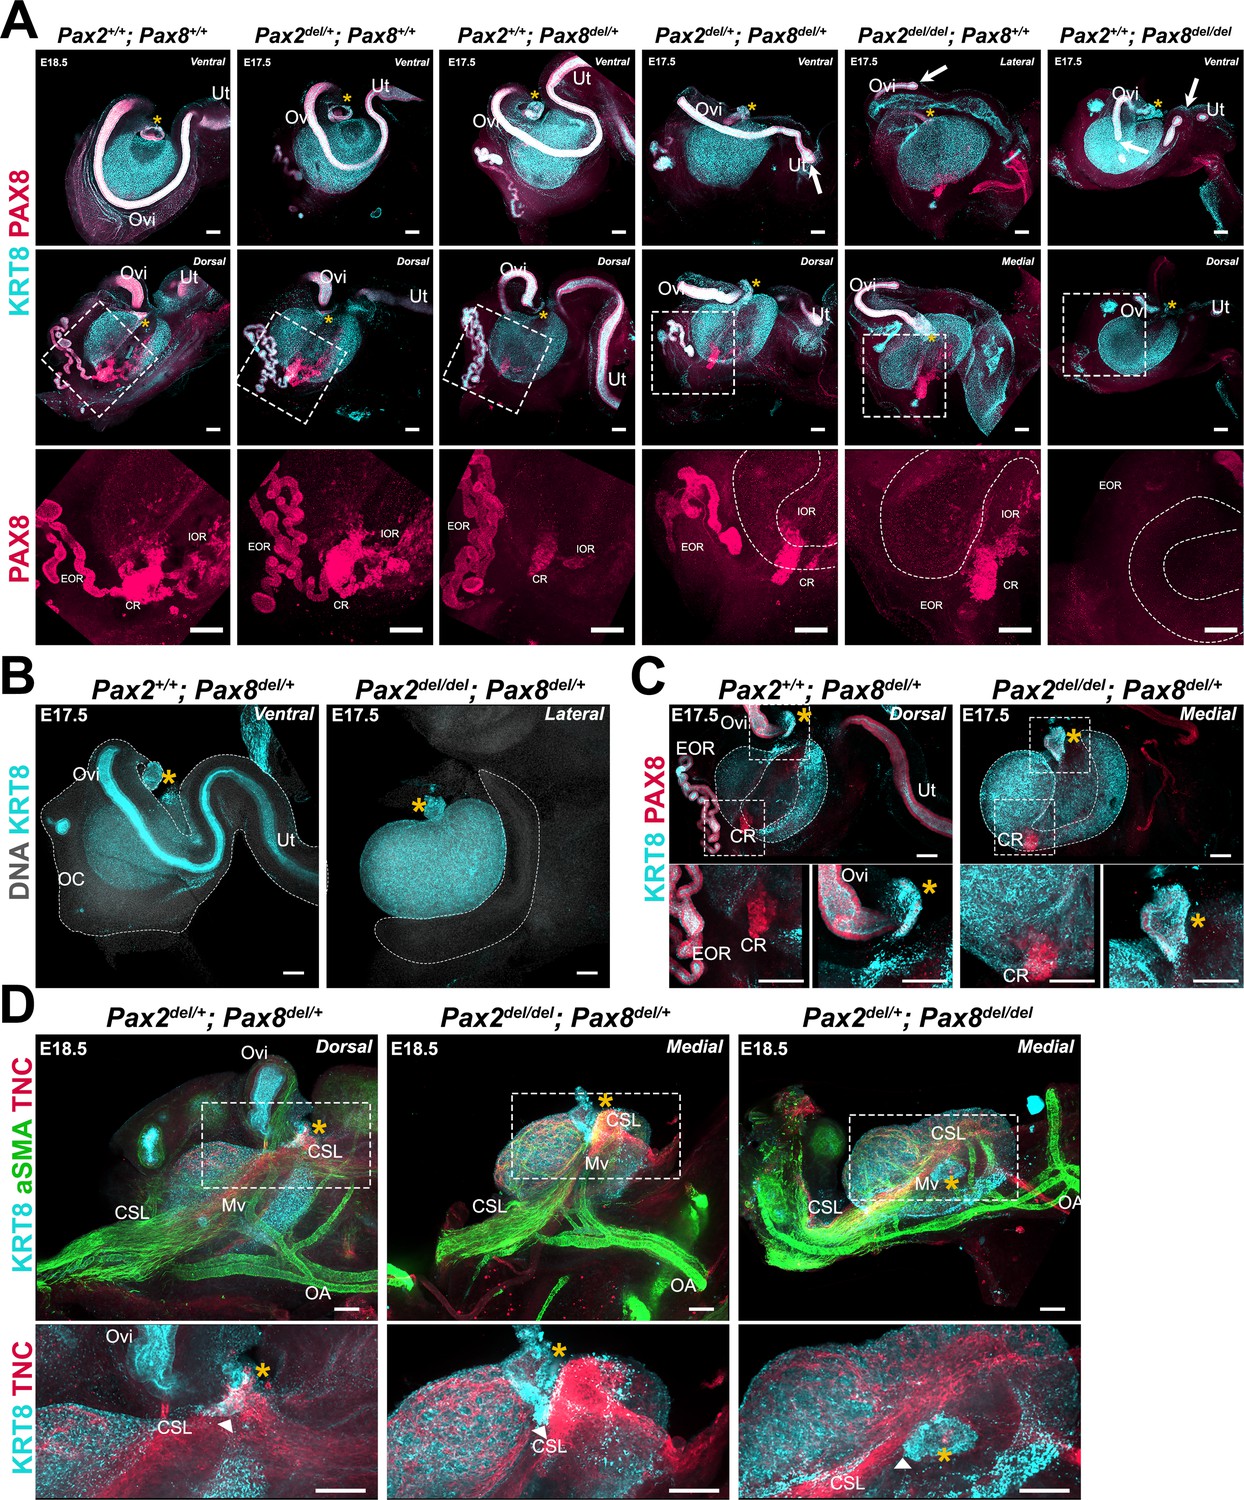
Perturbations of the Müllerian duct (MD) and rete ovarii by deletion of Pax2 and/or Pax8 disrupt ovary morphogenesis.
(A) Pax2/Pax8 deletion allelic series. Maximum intensity projections from confocal Z-stacks of whole ovary/mesonephros complexes at E17.5 and E18.5, immunostained for KRT8 (cyan) and PAX8 (red). Each sample is representative of the phenotype observed for different combinations of Pax2 and Pax8 deletion alleles. Images in the top row were captured from the dorsal side, and images in the middle, and bottom row from the dorsal side. Images in the bottom row are close-ups of the regions outlined in the middle row. White arrows point to disruptions of the MD. Dashed lines in the bottom row represent the KRT8+ cortical domain of the ovary. (B) The segment of the oviduct is required for ovary encapsulation. Maximum intensity projections from confocal Z-stacks of whole ovary/mesonephros complexes at E17.5, immunostained for KRT8 (cyan) and counterstained with Hoechst nuclear dye (grayscale). The dashed outline represents the ovarian capsule, which is absent in Pax2del/del; Pax8del/+ samples. (C) Only the infundibulum and connecting rete persist in Pax2del/del; Pax8del/+ samples. Maximum intensity projections from confocal Z-stacks of whole ovary/mesonephros complexes at E17.5, immunostained for KRT8 (cyan) and PAX8 (red). Images in the bottom row are close-ups of the regions outlined in the top row: left, rete ovarii; right, infundibulum. (D) The cranial suspensory ligament (CSL) remains tethered to the infundibulum remnant in Pax2del/del; Pax8del/+ and Pax2del/+; Pax8del/del samples. Maximum intensity projections from confocal Z-stacks of whole ovary/mesonephros complexes at E18.5, immunostained for KRT8 (cyan), aSMA (green), and TNC (red). Images in the bottom row are close-ups of the regions outlined in the top row. White arrowheads point to the attachment of the CSL to the infundibulum. Yellow asterisks indicate the location of the infundibulum of the presumptive oviduct for reference. CR, connecting rete; EOR, extraovarian rete; IOR, intraovarian rete; Mv, mesovarium; OA, ovarian artery; OC, ovarian capsule; Ov, ovary; Ovi, oviduct, Ut, uterus. Scale bars, 100 μm.
Figure 7—figure supplement 1
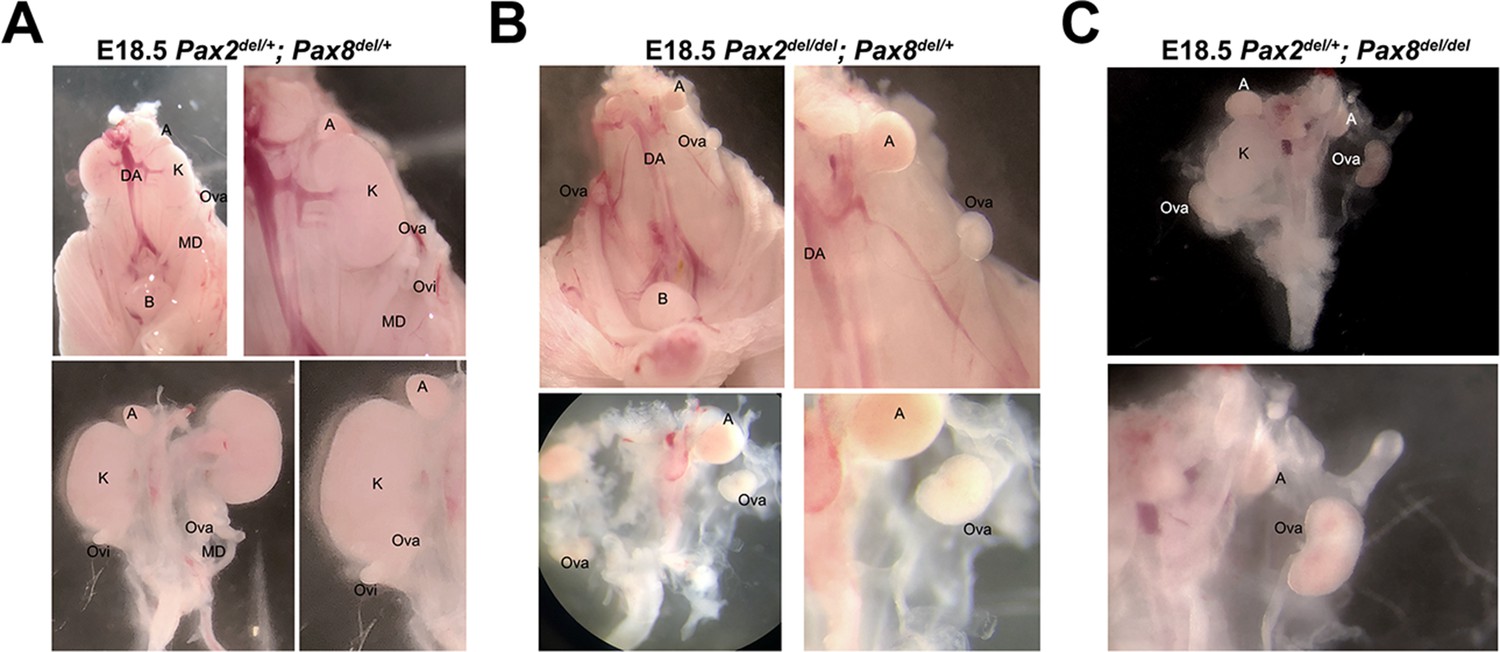
Gross morphology of Pax2del; Pax8del fetuses.
(A, B) Macrophotography of the urogenital complex in situ (top row) or isolated (bottom row) in Pax2del/+; Pax8del/+ (A) or Pax2del/del; Pax8del/+ (B) fetuses at E18.5. (C) Macrophotography of the isolated urogenital complex from a Pax2del/+; Pax8del/del fetus at E18.5. Note the absence of kidneys (K) in (B) and (C), and the resulting shorter distance between ovary (ova) and adrenal (A) compared to (A). A, adrenal; B, bladder; DA, dorsal aorta; K, kidney; MD, Müllerian duct; Ova, ovary; Ovi, oviduct.
Figure 8
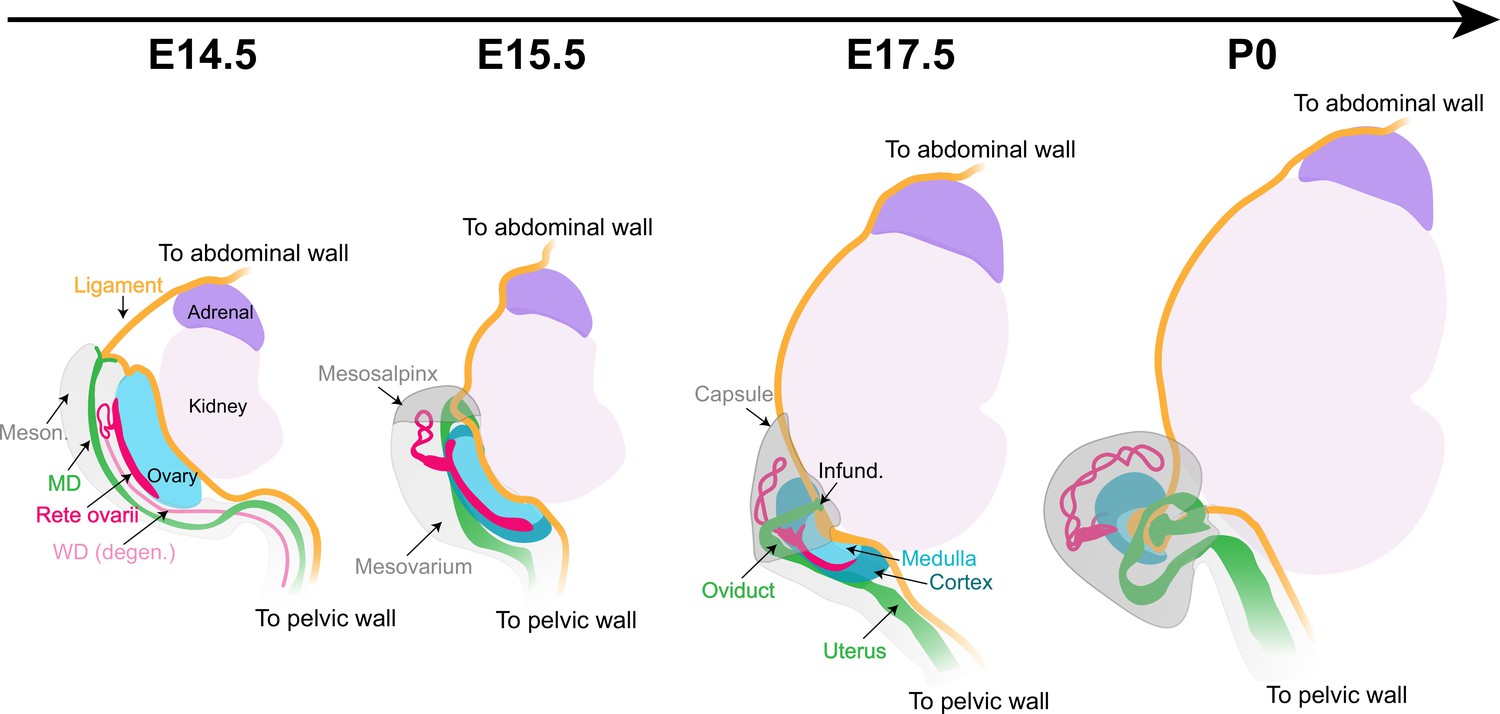
Morphogenesis of the fetal mouse ovary.
The dorsal face of the ovary is the center of action for most architectural changes during ovary morphogenesis. The cranial suspensory ligament (CSL, yellow), which tethers the ovary to the dorsal body wall, originally appears on the medial ridge of the ovary (blue). Throughout ovary morphogenesis, the cranial region of the oviduct (green), the infundibulum, remains linked to the original anterior pole of the ovary through their mutual attachment to the ligament. Ovary folding is associated with relocation of the infundibulum to the medio-ventral opening of the ovary. The relocation of the oviduct and infundibulum is driven by the dorsal expansion of mesonephric tissue (gray) to form the mesosalpinx and mesovarium. This process leaves the ovary fully encapsulated, with the ovarian capsule arising from the growth and fusion of the mesovarium and the mesosalpinx (gray). The developmental dynamics of the rete ovarii (red) follow the morphogenesis of the ovary, with the intraovarian and connecting regions closely associated with the ovarian domain throughout folding, and the extraovarian rete expanding within the developing ovarian capsule. Infund., infundibulum; MD, Müllerian duct; Meson., mesonephros; WD, Wolffian duct.
Tables
Key resources table
| Reagent type (species) or resource | Designation | Source or reference | Identifiers | Additional information |
|---|---|---|---|---|
| Strain, strain background (Mus musculus) | Crl:CD1(ICR) | Charles River | Strain code: 022 | |
| Strain, strain background (M. musculus) | C57BL/6J | Jackson Laboratory | Stock #:000664 | |
| Genetic reagent (M. musculus) | B6.129P2-Lgr5tm1(cre/ERT2)Cle/J | Jackson Laboratory | Stock #:008875 | |
| Genetic reagent (M. musculus) | Tg(Nr5a1/EGFP)1Klp | PMID:12351700 | MGI:5493455 | |
| Genetic reagent (M. musculus) | Tg(Wnt7a-EGFP/cre)#Bhr/Mmjax | PMID:20974921 | MMRRC Strain #036637-JAX | |
| Genetic reagent (M. musculus) | Pax8tm1Rdl; Pax2tm1a(KOMP)Wtsi | PMID:32381599 | ||
| Antibody | AMH (goat polyclonal) | Santa Cruz Biotechnology | #sc-6886 | 1:500 |
| Antibody | Smooth muscle alpha action (aSMA) (Cy3-conjugated mouse monoclonal) | Sigma-Aldrich | C6198 | 1:1000 |
| Antibody | Smooth muscle alpha action (aSMA) (FITC-conjugated mouse monoclonal) | Sigma-Aldrich | F3777 | 1:500 |
| Antibody | E-Cadherin (rat monoclonal) | Zymed (Thermo Fisher Scientific) | 13-1900 | 1:500 |
| Antibody | Endomucin (rat monoclonal) | Santa Cruz Biotechnology | sc-65495 | 1:500 |
| Antibody | FOXL2 (goat polyclonal) | Novus Biologicals | NB-100-1277 | 1:250 |
| Antibody | GATA4 (goat polyclonal) | Santa Cruz Biotechnology | sc-1237 | 1:250 |
| Antibody | GFP (chicken polyclonal) | Abcam | ab13970 | 1:1000 |
| Antibody | HuC/D (human polyclonal) | Gift from V. Lennon (Mayo Clinic) | 1:10,000 | |
| Antibody | KRT8 (rat monoclonal) | DSHB | TROMA-I | 1:250 |
| Antibody | PAX8 (rabbit polyclonal) This antibody has cross-reactivities with other PAX family members | Proteintech; Moretti et al., 2012 | A10336-1-AP | 1:500 |
| Antibody | RUNX1 (rabbit monoclonal) | Abcam | ab92336 | 1:500 |
| Antibody | SOX9 (rabbit polyclonal) | Millipore | AB5535 | 1:1000 |
| Antibody | TNC (rabbit polyclonal) | Gift from H. Erickson (Duke University) | 1:250 | |
| Antibody | TUJ1 (rabbit polyclonal) | Abcam | ab18207 | 1:1000 |
| Antibody | AF647 anti-Rabbit (donkey polyclonal) | Jackson ImmunoResearch | 711-605-152 | 1:500 |
| Antibody | AF488 anti-Chicken (donkey polyclonal) | Jackson ImmunoResearch | 703-545-155 | 1:500 |
| Antibody | AF488 anti-Human (donkey polyclonal) | Jackson ImmunoResearch | 709-545-149 | 1:500 |
| Antibody | AF488 anti-Rat (donkey polyclonal) | Life Technologies | A-21208 | 1:500 |
| Antibody | Cy3 anti-Goat (donkey polyclonal) | Jackson ImmunoResearch | 705-165-147 | 1:500 |
| Antibody | Cy3 anti-Chicken (donkey polyclonal) | Jackson ImmunoResearch | 705-165-155 | 1:500 |
| Antibody | Cy3 anti-Rat (donkey polyclonal) | Jackson ImmunoResearch | 712-165-150 | 1:500 |
| Chemical compound, drug | CF-647-hydrazide probe (to label Elastin) | MilliporeSigma | SCJ4600046 | 1:500 |
| Chemical compound, drug | Dichloromethane | MilliporeSigma | 270997-1L | |
| Chemical compound, drug | Benzyl Ether | MilliporeSigma | 108014-1KG | |
| Chemical compound, drug | Heparin | MilliporeSigma | H3393-50KU | |
| Chemical compound, drug | Quadrol = N,N,N′,N′-Tetrakis(2-Hydroxypropyl)ethylenediamine | MilliporeSigma | 122262 | |
| Software, algorithm | Zen Black Edition | Carl Zeiss | ||
| Software, algorithm | Imaris v9.6 | Bitplane | ||
| Software, algorithm | Adobe Creative Cloud | Adobe | Photoshop, Illustrator, Premier Pro |
Additional files
-
Supplementary file 1
Supplementary tables in support of this manuscript.
(a) Color-coded table recapitulating ovarian and Müllerian duct phenotypes in the Pax2 and Pax8 allelic series (green with ✓, intact; yellow with ~, perturbed; red with X, absent). (b) Table recapitulating the DNA forward (middle) and reverse (right) primers used for genotyping the transgenic mouse lines used in the present study (right). (c) Table recapitulating the primary antibodies used in this study. Information in the table columns includes, from left to right protein recognized, host species, dilution, source, and product #. (d) Table recapitulating the secondary antibodies used in this study. Information in the table columns includes, from left to right protein recognized, dilution, source, and product #.
- https://cdn.elifesciences.org/articles/81088/elife-81088-supp1-v2.docx
-
MDAR checklist
- https://cdn.elifesciences.org/articles/81088/elife-81088-mdarchecklist1-v2.pdf
Download links
A two-part list of links to download the article, or parts of the article, in various formats.
Downloads (link to download the article as PDF)
Open citations (links to open the citations from this article in various online reference manager services)
Cite this article (links to download the citations from this article in formats compatible with various reference manager tools)
Integration of mouse ovary morphogenesis with developmental dynamics of the oviduct, ovarian ligaments, and rete ovarii
eLife 11:e81088.
https://doi.org/10.7554/eLife.81088


