Shared enhancer gene regulatory networks between wound and oncogenic programs
- VIB Center for Brain & Disease Research, Belgium
- Laboratory of Computational Biology, Department of Human Genetics, University of Leuven, Belgium
- Faculty of Biology, Hilde-Mangold-Haus, University of Freiburg, Germany
- CIBSS Centre for Integrative Biological Signalling Studies, University of Freiburg, Germany
- Institute for Genetics Cologne Excellence Cluster on Cellular Stress Responses in Aging-Associated Diseases (CECAD), University of Cologne, Germany
- Department of Biological Sciences, Sam Houston State University, United States
- VIB Center for Cancer Biology, Belgium
- Laboratory of Growth Control and Cancer Research, Department of Oncology, University of Leuven, Belgium
Figures
Figure 1 with 2 supplements
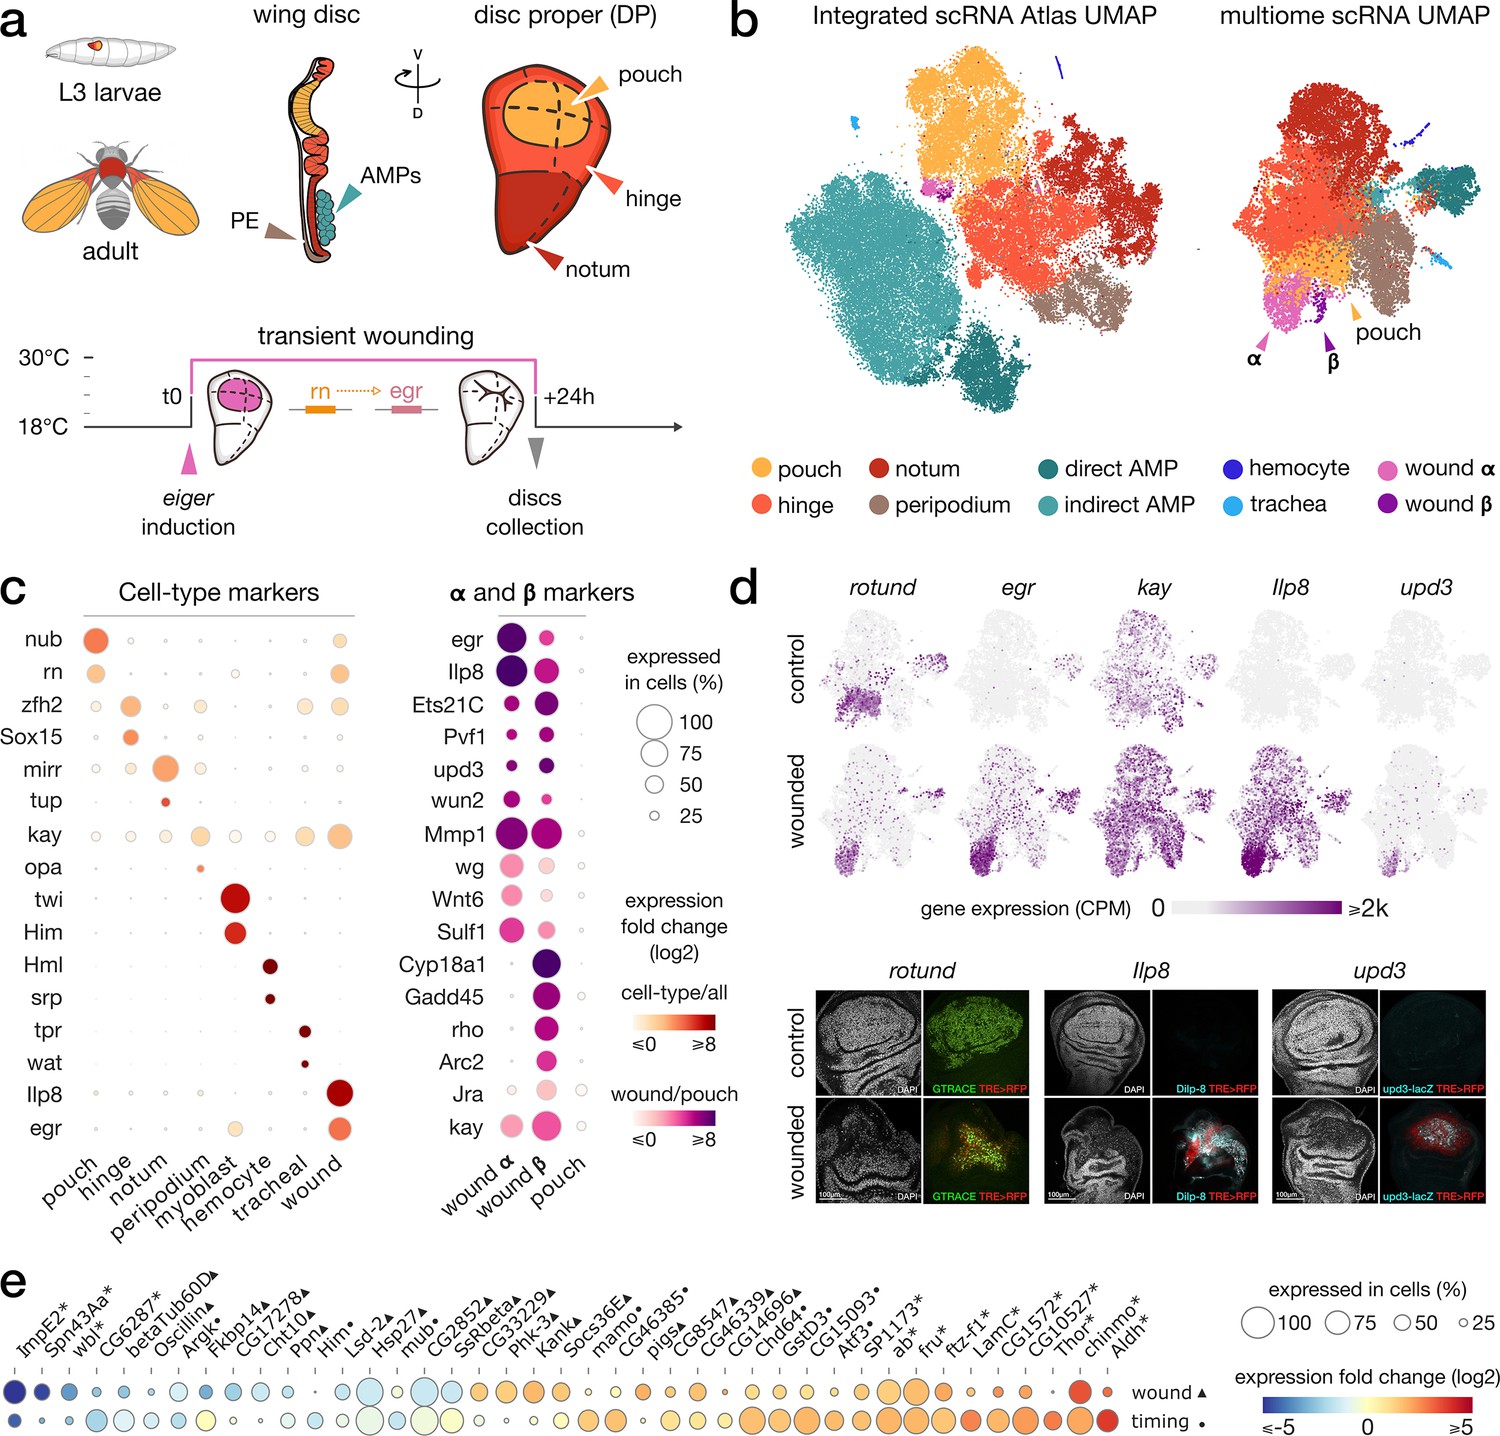
Gene expression patterns in wild-type and wounded wing discs.
(a) Top: schematic of the wing imaginal disc subdomains from a Drosophila third-instar larvae. The disc proper (DP) is composed of three domains and is shoehorned between the peripodial epithelium (PE) and the adult muscle precursors (AMP, or myoblasts). bottom: Design of the wound experiment, eiger expression is induced in the pouch for 24 hr, resulting in a localized apoptosis. (b) Representation of the wing disc scRNA Atlas tSNE (left) and the scRNA multiome data UMAP (right), where wound populations α and β can be detected. (c) Gene expression of marker genes across cell types (left) and wound subclusters in contrast to pouch (right) clusters. (d) Gene expression pattern of wound markers in multiome UMAP (top) and immunostaining (bottom). Ilp8, rn and upd3 are found to colocalize with JNK reporter (TRE-RFP), present at the wound site. (e) Relative expression (log2FC) of markers of wound response (first row, wounded/wild-type, ▲) and/or developmental timing (second row, 96 hr/120 hr after egg laying, ●). Shared markers are marked by an asterisk (*).
Figure 1—figure supplement 1
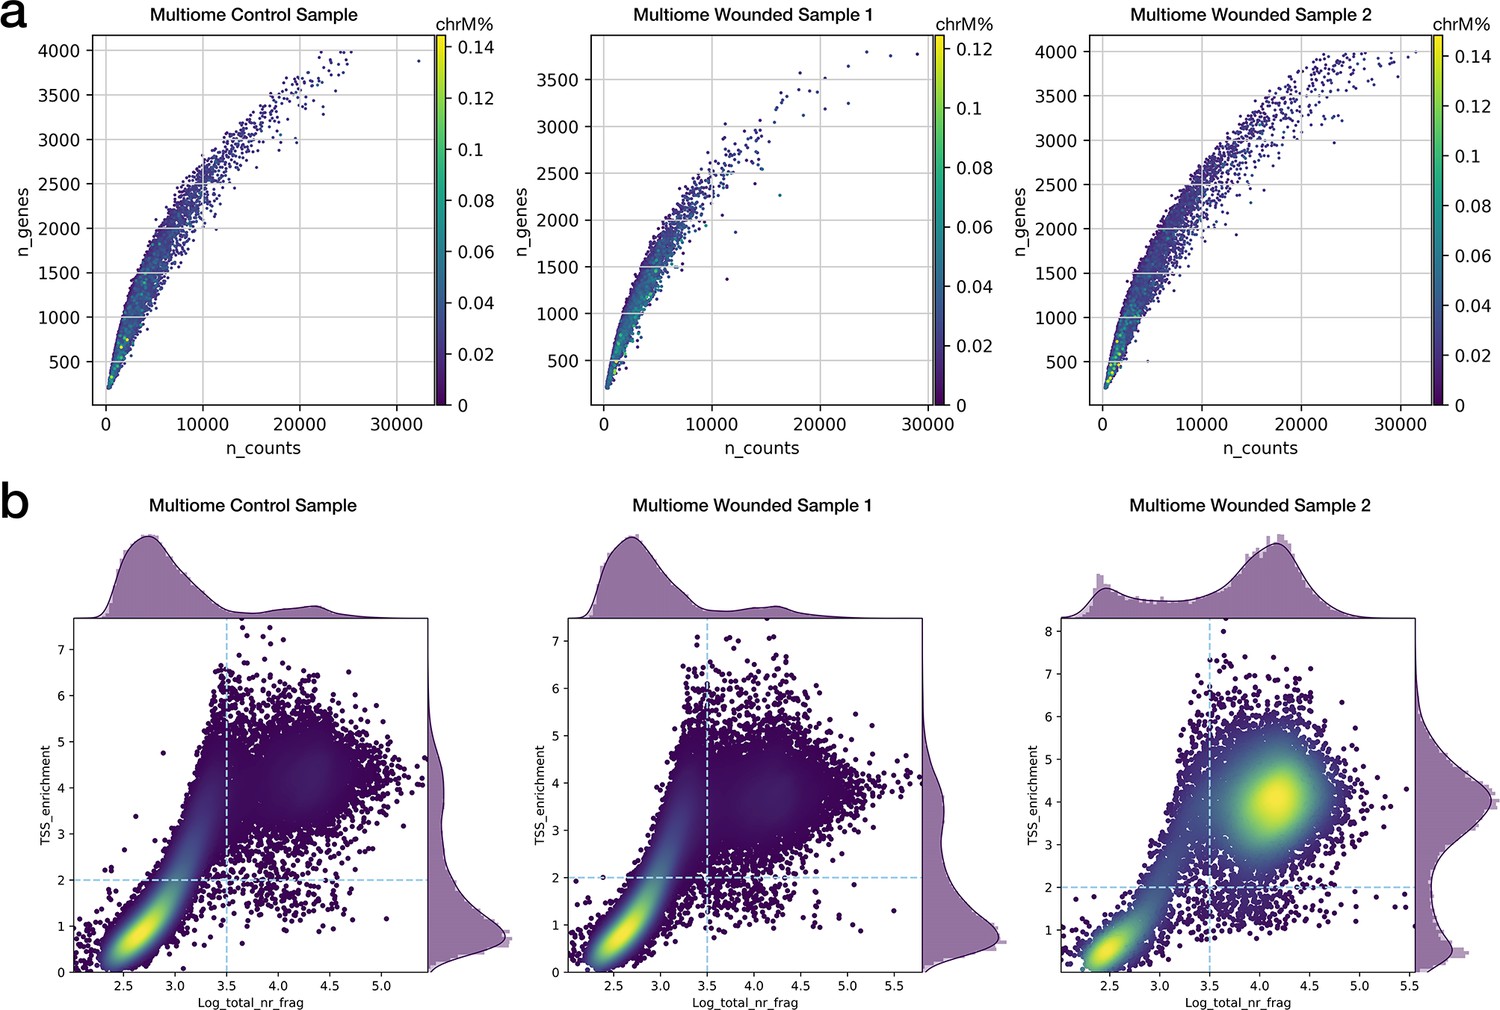
Single-cell quality metrics of multiome experiments.
(a) Distribution of the number of detected genes and total read counts for the multiome scRNA-seq assays. Color represents the proportion of mitochondrial reads per cell. (b) Heatmap distribution of TSS enrichment score and total fragment counts for the multiome scATAC-seq assays.
Figure 1—figure supplement 2
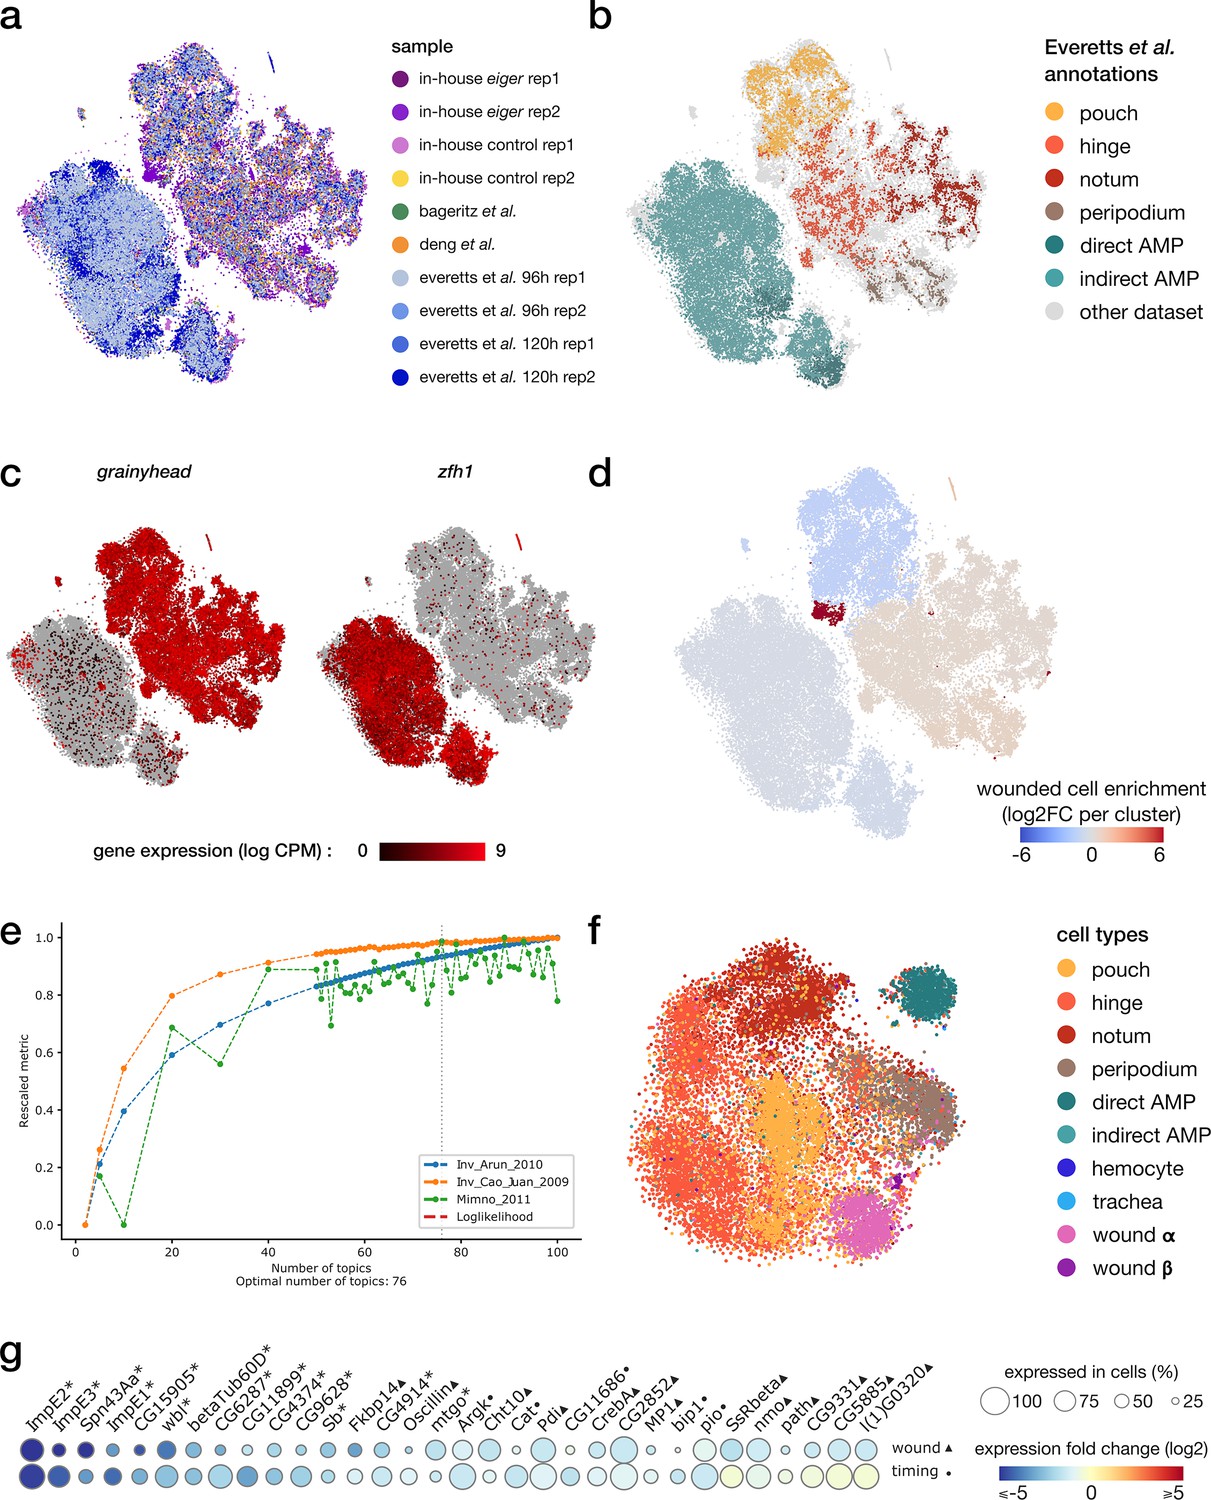
integration of scRNA and scATAC samples.
(a, b) Harmony-corrected tSNE visualization of the scRNA wing disc atlas, colored by the sample of origin (a) and annotations from Everetts et al. (b). (c) Gene expression patterns of the epithelial marker grainyhead and the myoblast marker zfh1. (d) Enrichment of cells originating from the wounded samples for each cluster. We note an imbalance in wild-type/wounded cell proportion in the pouch cluster (wound-depleted) and the wound cluster (wound-enriched). (e) cisTopic selection metrics across all tested LDA models. The selected model with best coherence scores comprises 76 topics. (f) tSNE representation of the topic embedding generated from the multiome scATAC data, colored by cell type identified from the scRNA view. (g) Relative expression (log2FC) of markers of wound response (1st row, wounded/wild-type, ▲) and/or developmental timing (second row, 96 hr/120 hr after egg laying, ●) in the notum domain. Shared markers are marked by an asterisk.
Figure 2 with 1 supplement
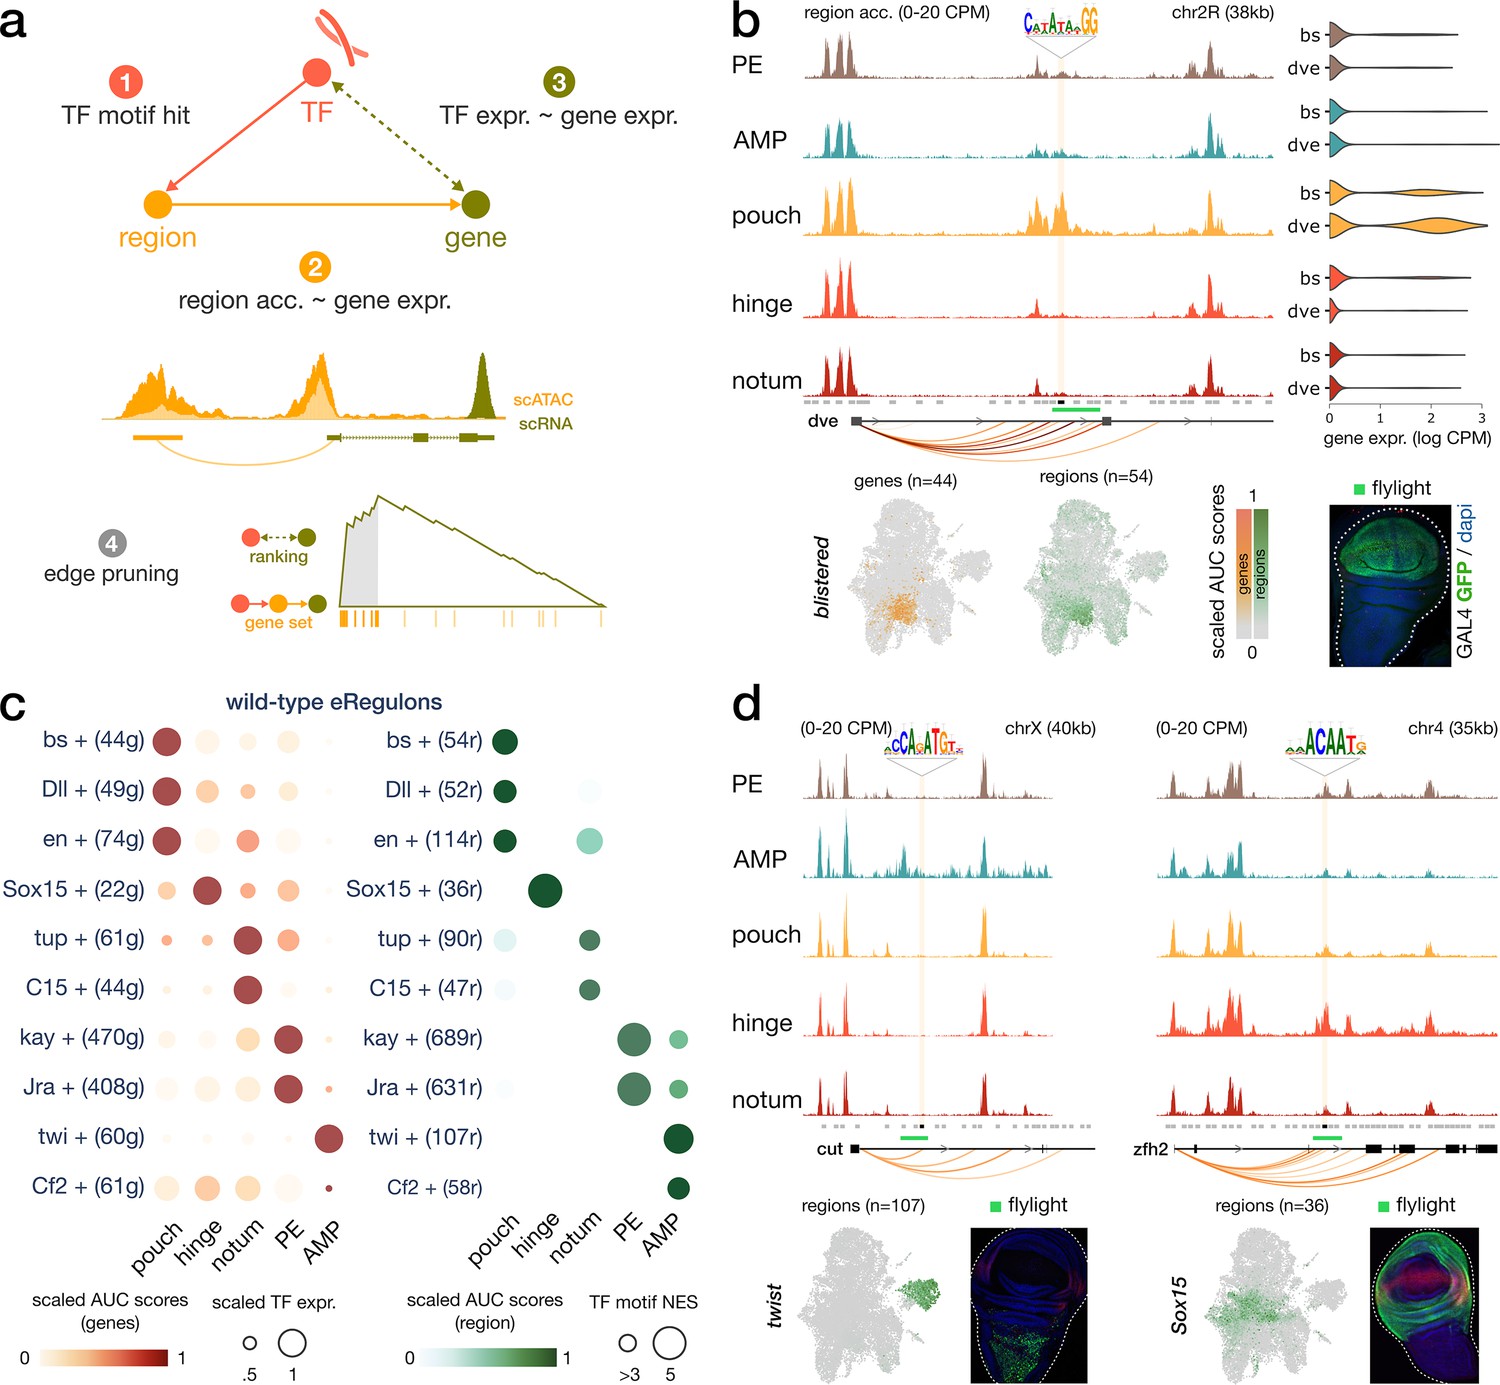
Construction of enhancer-mediated gene regulatory networks (eGRNs).
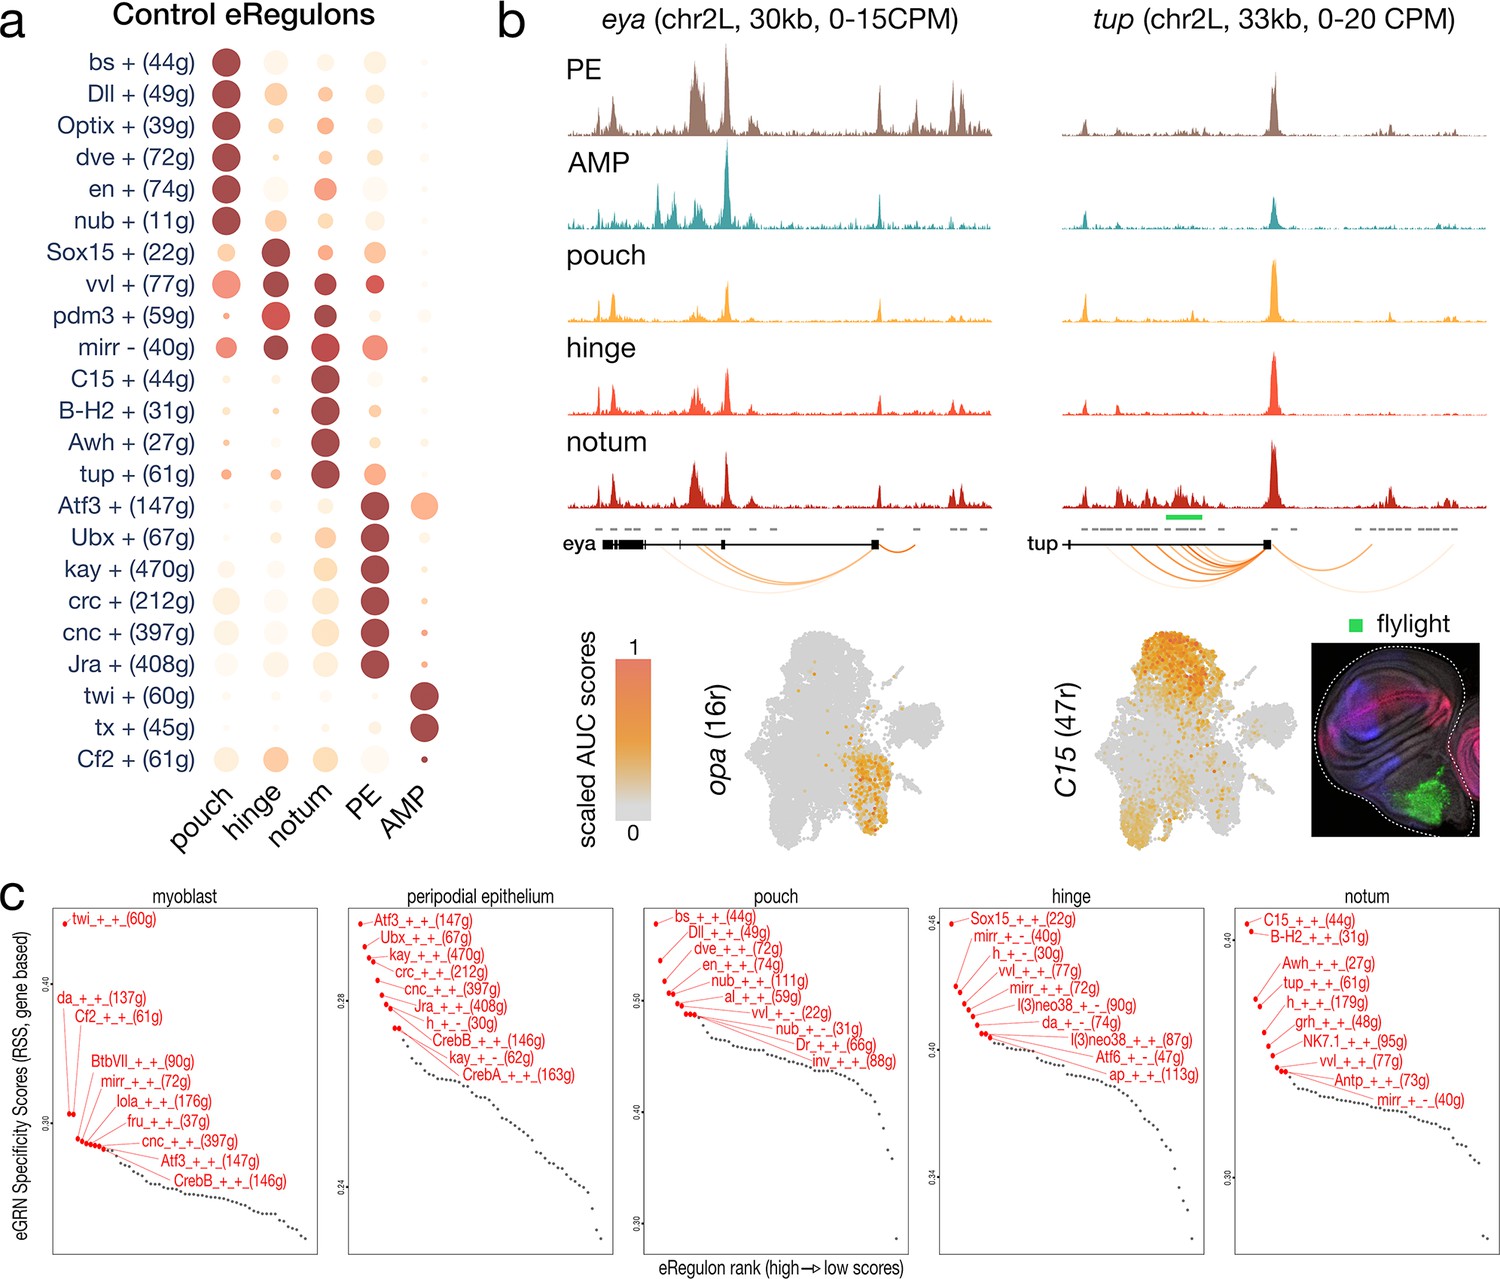
(a) eGRN construction is based on TF motif enrichment (1), co-variability of gene expression and chromatin accessibility (2–3), and followed by functional edge selection (4). (b) Aggregated wild-type chromatin accessibility signals around a target region (black rectangle, gold shaded box) of the blistered eGRN. The target region comprises a blistered motif hit, it is significantly correlated with expression of defective proventriculus (dve, orange arcs), and it overlaps a flylight reporter (green rectangle) expressed in the pouch domain. The activities of the blistered TF and its associated eGRN signatures are all similarly localized in the pouch (UMAP and violin plots). (c) Dotplot of the average gene-based (left) and region-based (right) activity of selected eGRNs with highest cell type specificity in wild-type conditions. (d) Aggregated chromatin accessibility signals similar to panel (b) for the target regions of two other eGRNs, active in the myoblast (twist, left) and the hinge domains (Sox15, right).
Figure 2—figure supplement 1
Enhancer gene regulatory network (eGRN) specificity across wild-type wing disc domains.
(a) Dotplot of the average gene-based activity of selected eGRNs with highest cell type specificity for wild-type conditions. (b) Aggregated wild-type chromatin accessibility signals around a target gene of the opa (left) and C15 (right) eGRNs. The target regions are significantly correlated with expression of each TF (orange arcs), and C15 targets overlap a flylight reporter (green rectangle) expressed in the hinge. The eGRN activities (UMAP) are localized in the peripodial epithelium (opa) and the hinge (C15). (c) regulon specificity score of selected eGRNs for each cell type, based on wild-type gene expression. Top 10 eGRNs are shown in red.
Figure 3 with 5 supplements
bZIP TF activity in senescent and proliferative wound populations.
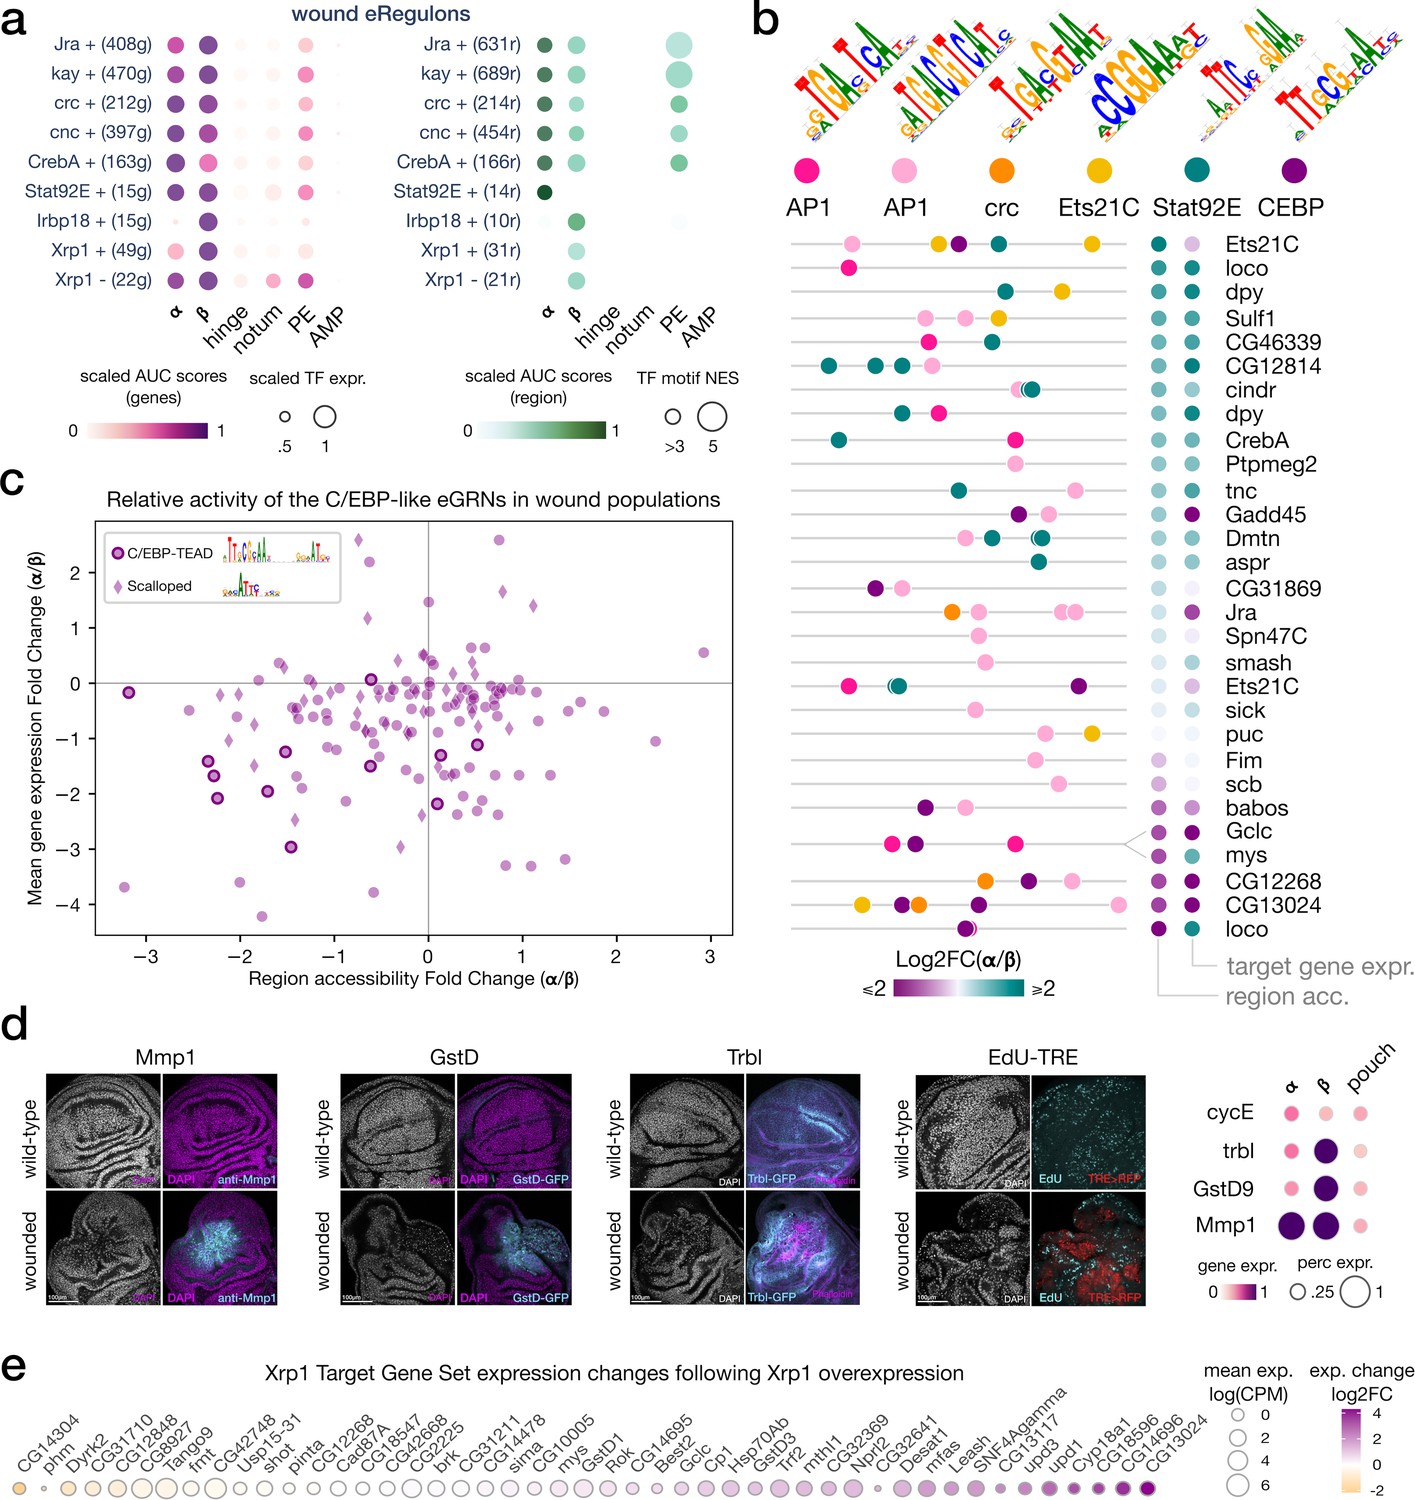
(a) Dotplot of the average gene-based (left) and region-based (right) activity of selected enhancer gene regulatory networks (eGRNs) with highest α and/or β specificity in wounded conditions. (b) Feature maps of six types of TF motifs on regions specifically accessible in the wound populations α and/or β. AP1 bindings are homogeneously present, while Stat92E and C/EBP motifs are specifically enriched in wound population α and β, respectively. One region targeted by both AP1 and C/EBP GRNs regulates two genes with antagonistic α/β expression patterns (mys and Gclc). (c) Scatterplot of the relative changes in target gene expression and chromatin accessibility for all enhancers targeted by the C/EBP eGRNS (vri, Irbp18, Xrp1, slbo). We note the presence of the CEBP-TEAD dimer motif in regions strongly upregulated in β. (d) Wing disc immunostaining (left) and normalized average expression of three wound marker genes and a proliferation marker (CycE, right). Both α and β marker genes are expressed and localized at the wound site. (e) Expression change of Xrp1 eGRN target genes following Xrp1 overexpression, we note the strong upregulation of the Unpaired ligands.
Figure 3—figure supplement 1
Damage-responsive element BRV118.
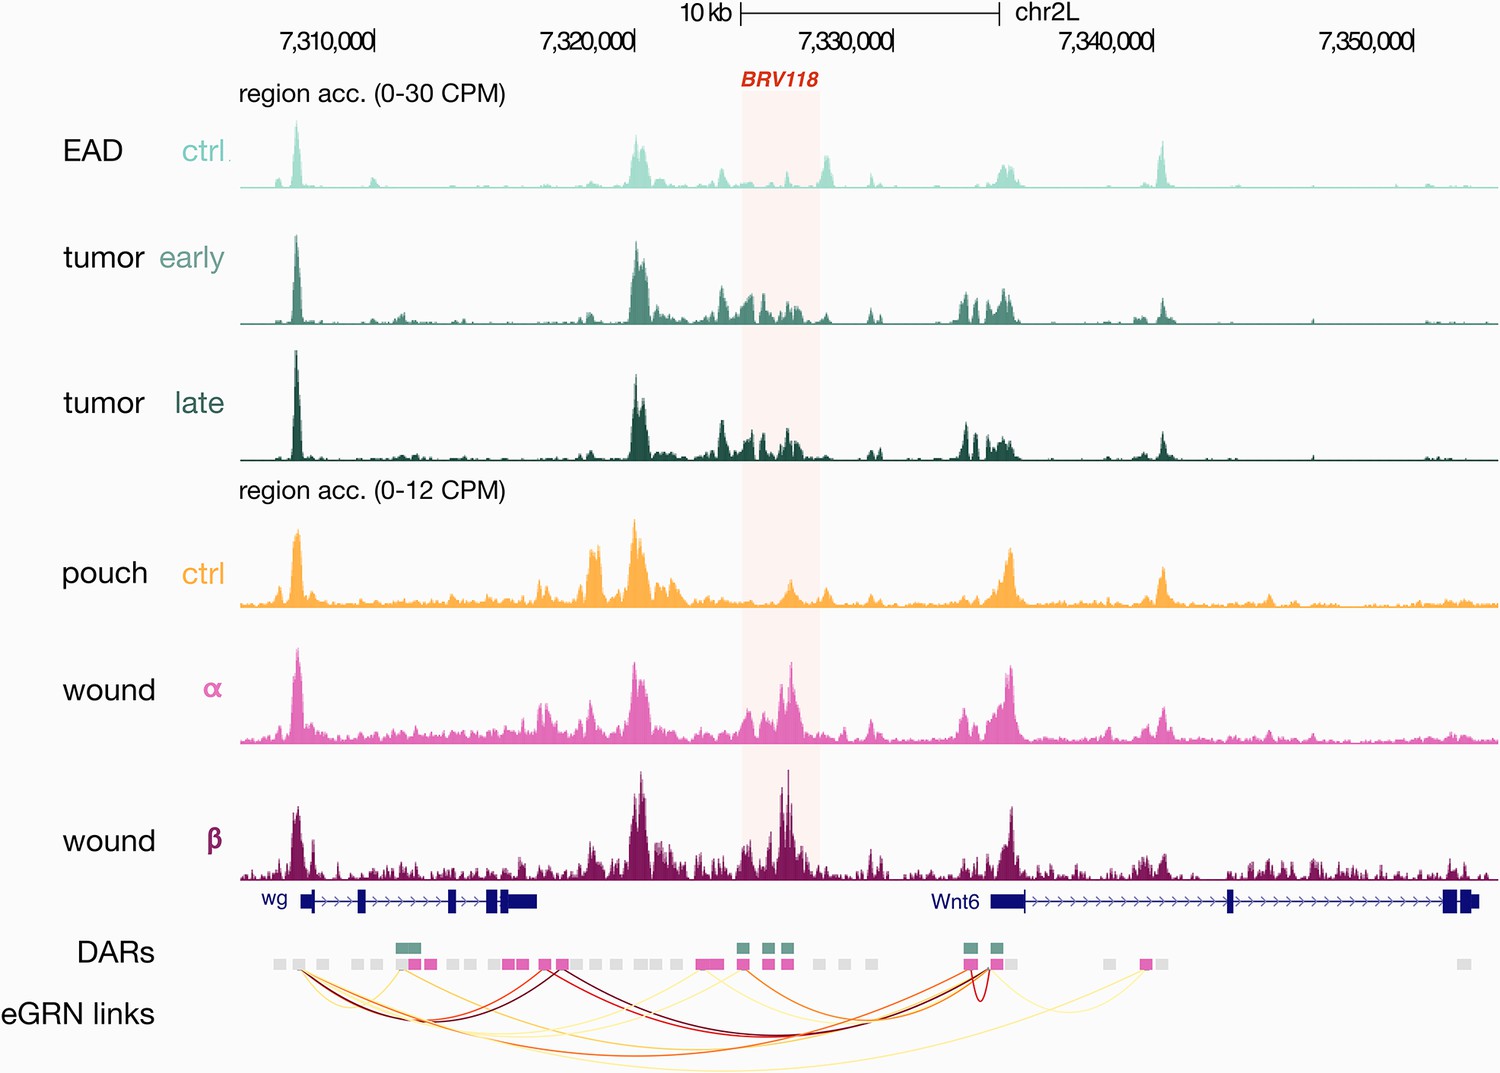
Aggregated wild-type, wounded and rasV12scrib-/- chromatin accessibility signals around the BRV118 regulatory region (chr2L:7324275–7327234) and the AP-1 eGRN target genes Wnt6 and wg. The BRV118 region overlaps with three enhancer gene regulatory network (eGRN) enhancers that belong to the signature regions of the wound (pink rectangles) and the rasV12scrib-/- tumor models (green rectangles). Orange arcs represent region-to-gene edges inferred from eGRN analysis.
Figure 3—figure supplement 2
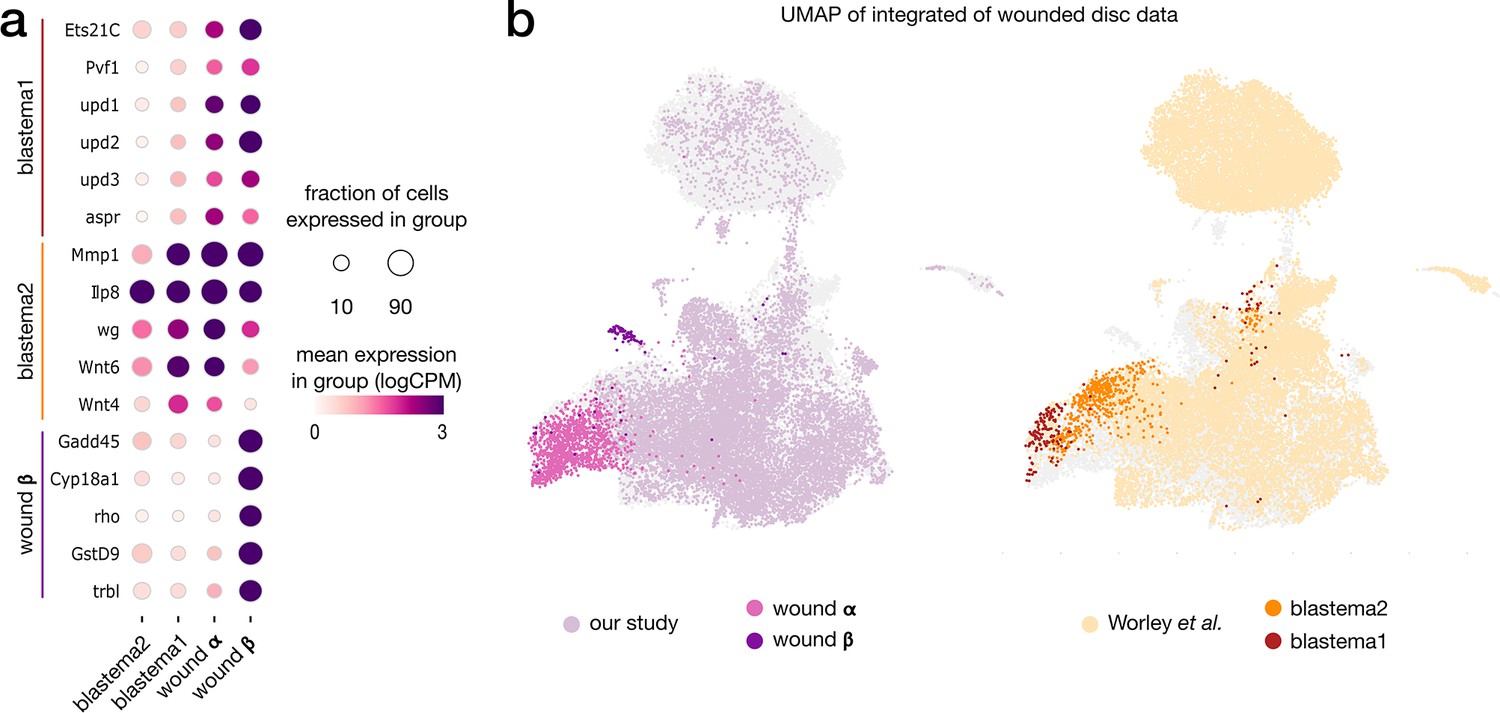
Contrast between wound and regenerating populations.
(a) Expression pattern of marker genes across wound populations from our study (α and β) and Worley et al. study. (b) Integrated wound atlas UMAP. Dark color clusters represent annotated wound populations from our study (α and β) and Worley et al. study (blastema 1 and 2). Both blastema populations overlap with the proliferative population α.
Figure 3—figure supplement 3
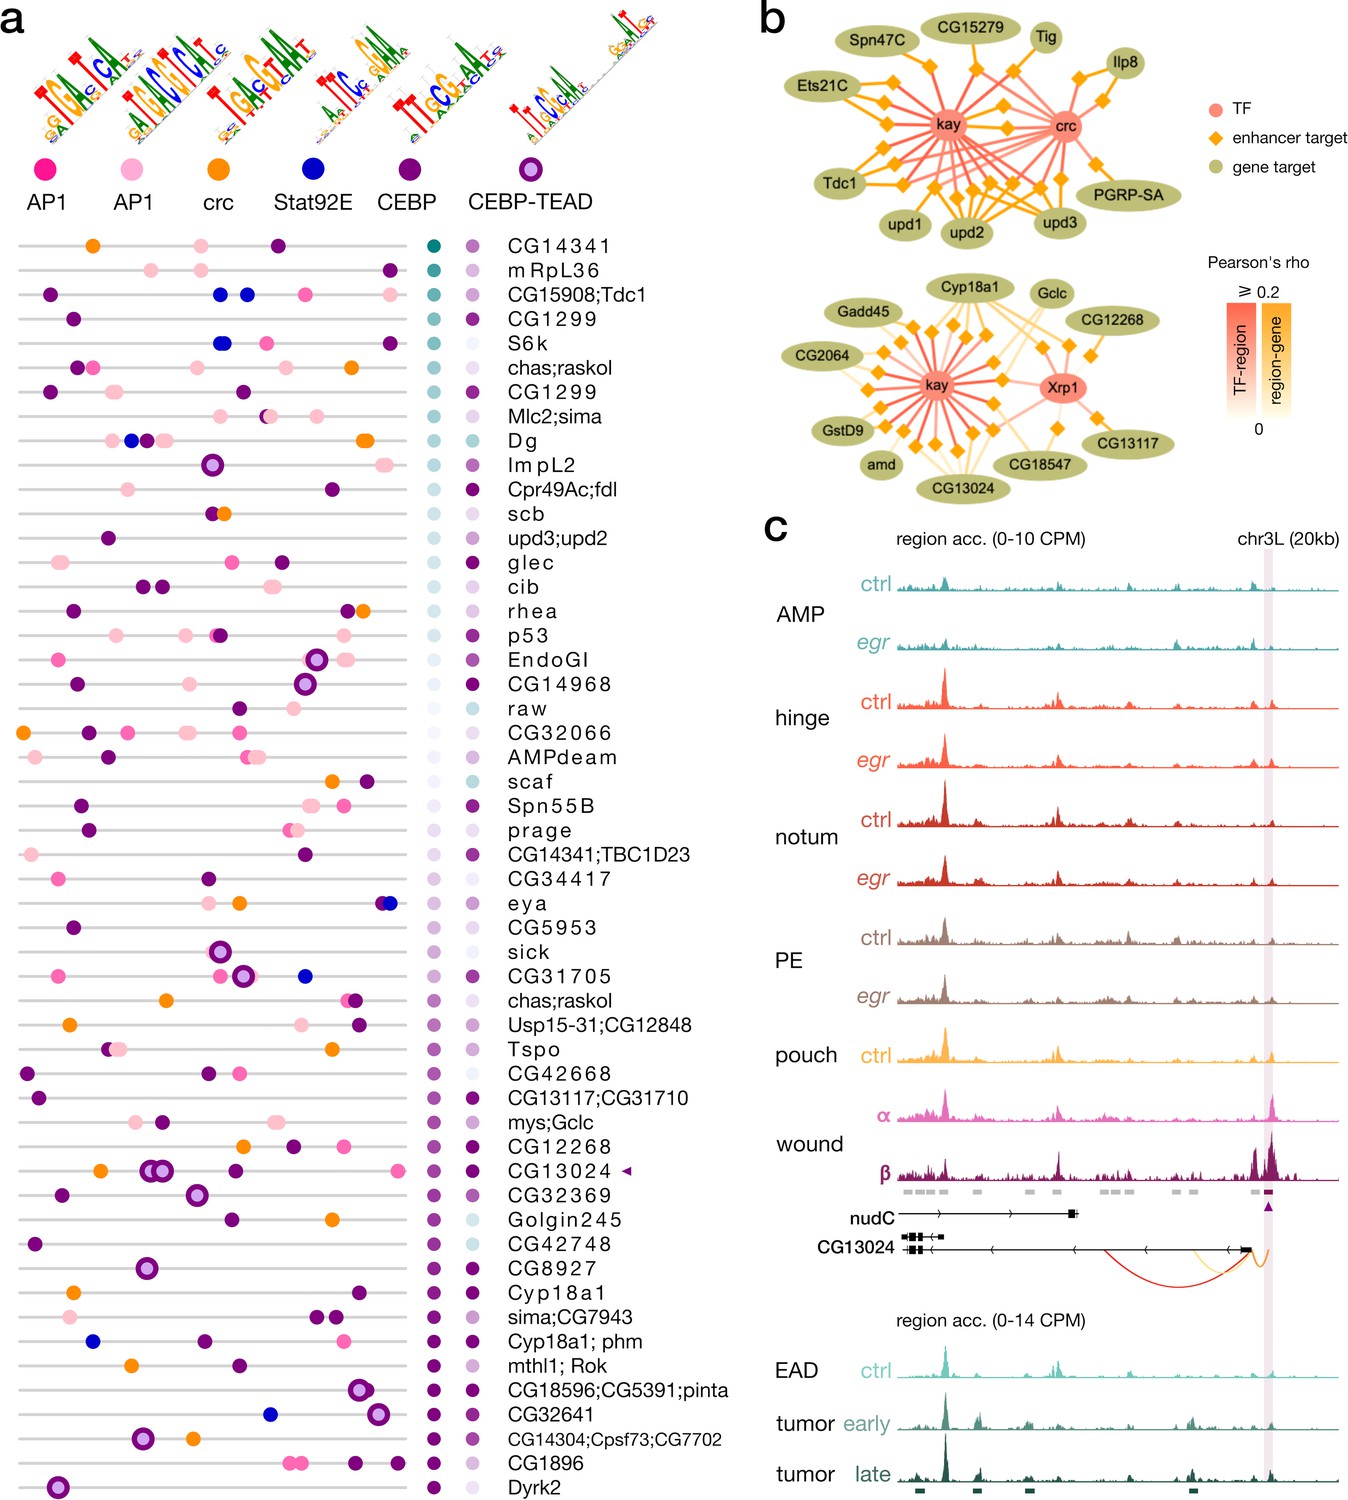
Enrichment of the C/EBP-TEAD motif in senescent cells.
(a) Feature maps of six types of TF motifs on enhancers targeted by the C/EBP-like enhancer gene regulatory networks (eGRNS). AP-1 bindings are homogeneously present, while C/EBP-TEAD motifs are enriched in targets with higher activity in β compared to α. (b) Example targets regions (lozenges) and genes (ellipses) of eGRNs active in the wound populations α (left, kay and crc) and β (right, kay and the Irbp18 partner Xrp1). Represented targets are the highest-scoring markers of each wound population. (c) Aggregated wild-type, wounded and rasV12scrib-/- chromatin accessibility signals around a target enhancer and a target gene (CG13024) of the C/EBP eGRNs. This enhancer comprises a C/EBP-TEAD dimer motif hit as shown in the first panel (purple triangle). Orange arcs represent region-to-gene edges and green rectangles represent the signature regions of the rasV12scrib-/- tumor model.
Figure 3—figure supplement 4
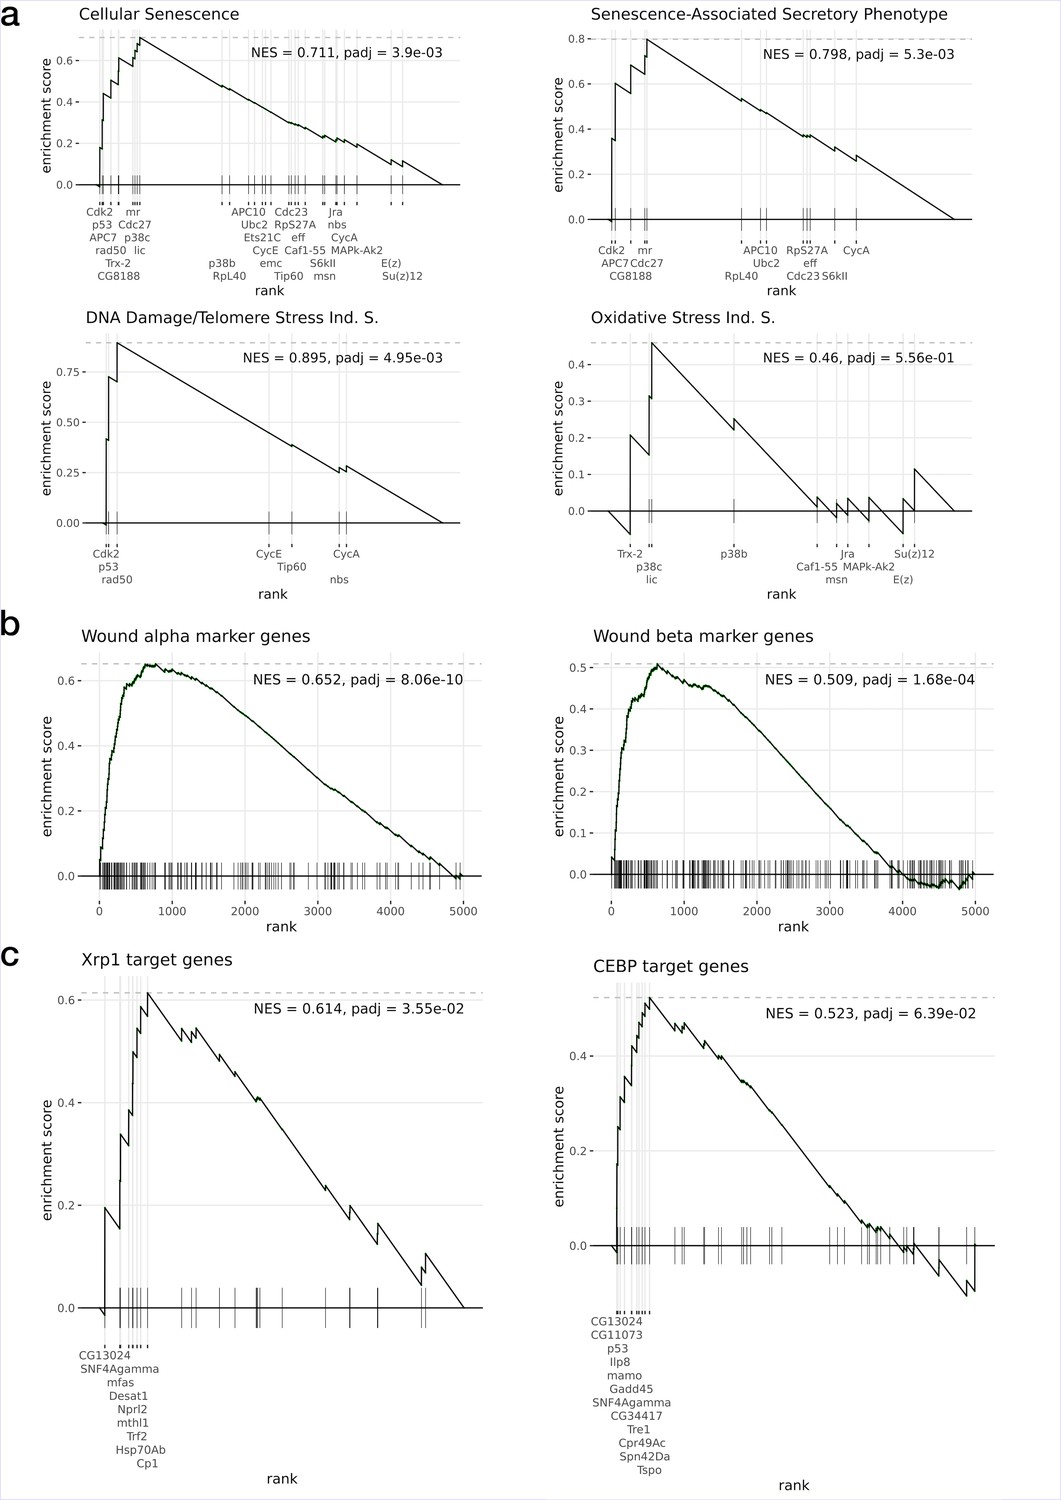
Gene set enrichment analysis of the Xrp1 overexpression data.
Tested gene sets correspond to (a) Reactome Pathway Database (Cellular Senescence pathway and related subsets), (b) markers from wound α and β populations, and (c) target genes inferred from enhancer gene regulatory networks (eGRNs) and associated TF binding motifs. All gene sets are significantly enriched (p-adj < 10e–3) with the exception of the Oxidative Stress Induced Senescence (Ind. S.) and the Oncogene Induced Senescence (NES = 0.49, p-adj=0.8, not shown).
Figure 3—figure supplement 5
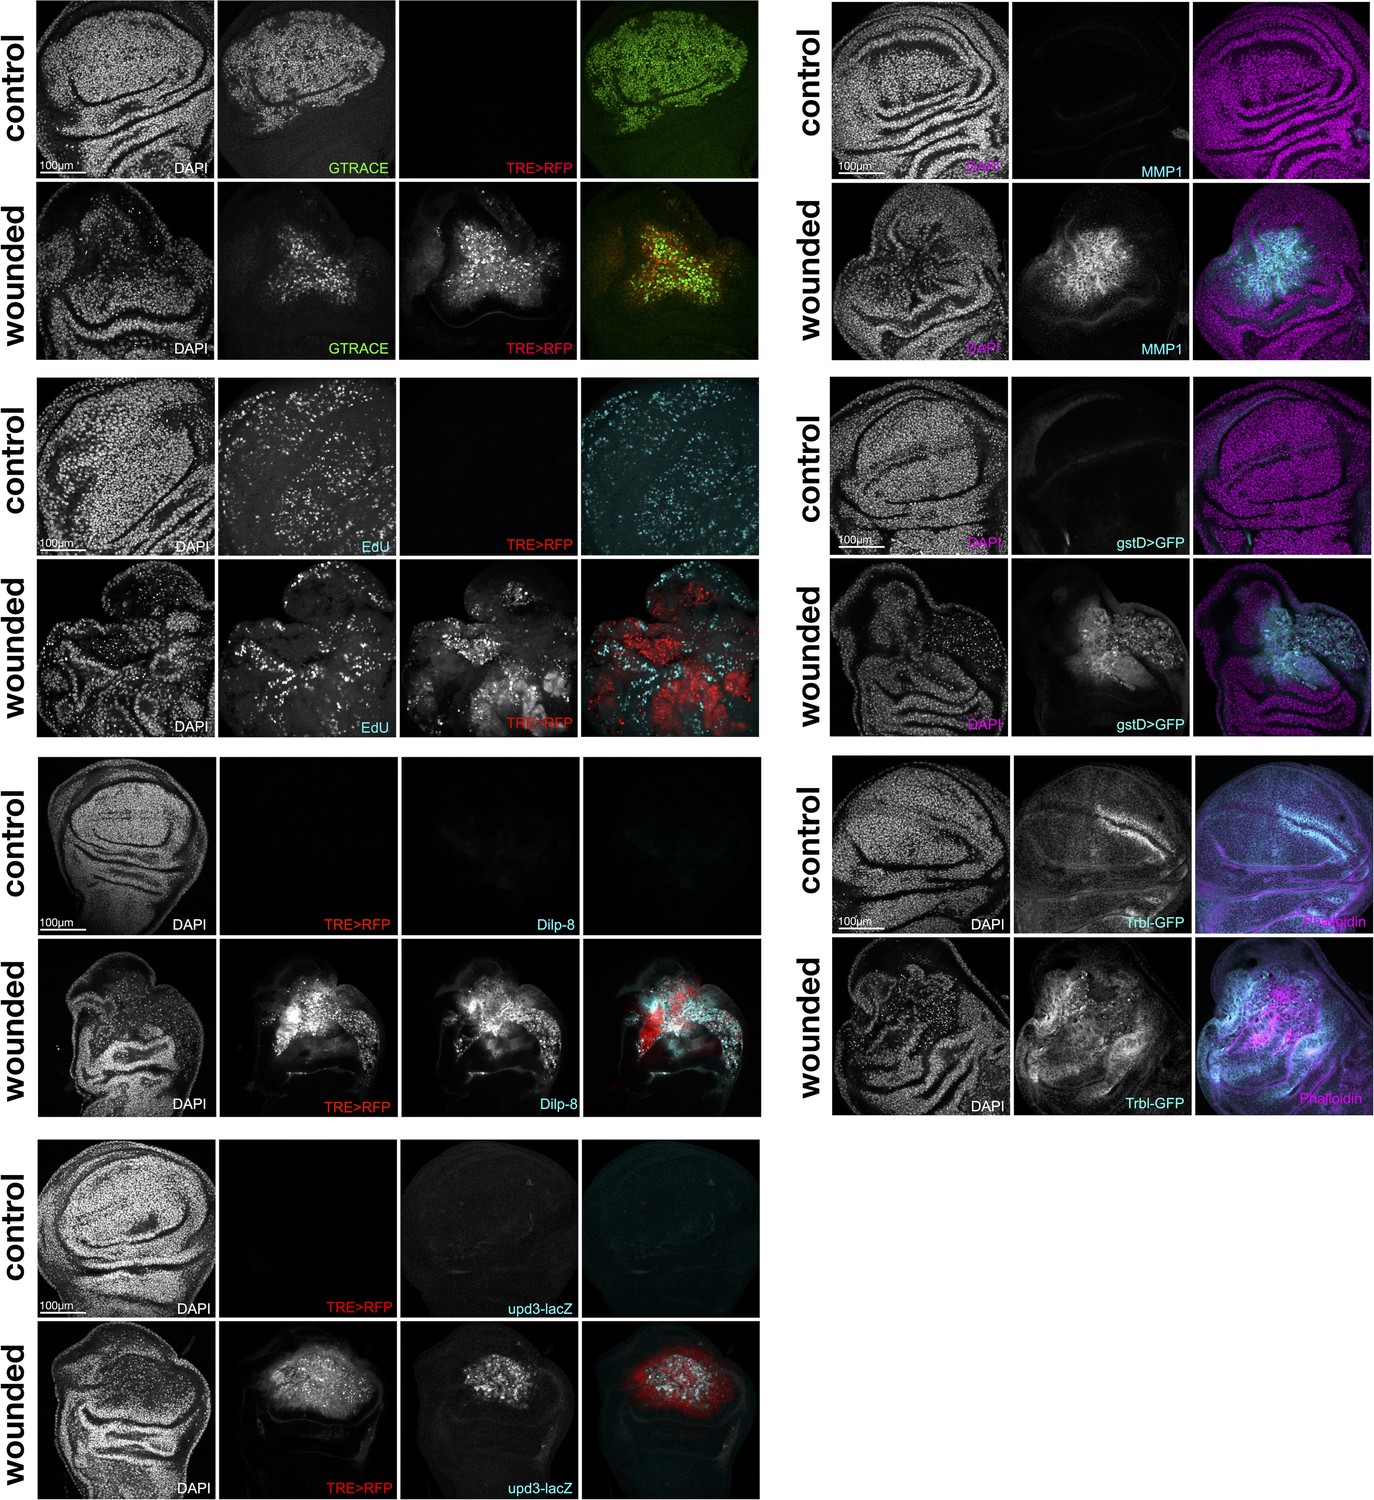
Single-channel Immunostainings.
Figure 4 with 2 supplements
Shared signatures between transient and persistent wound induction.
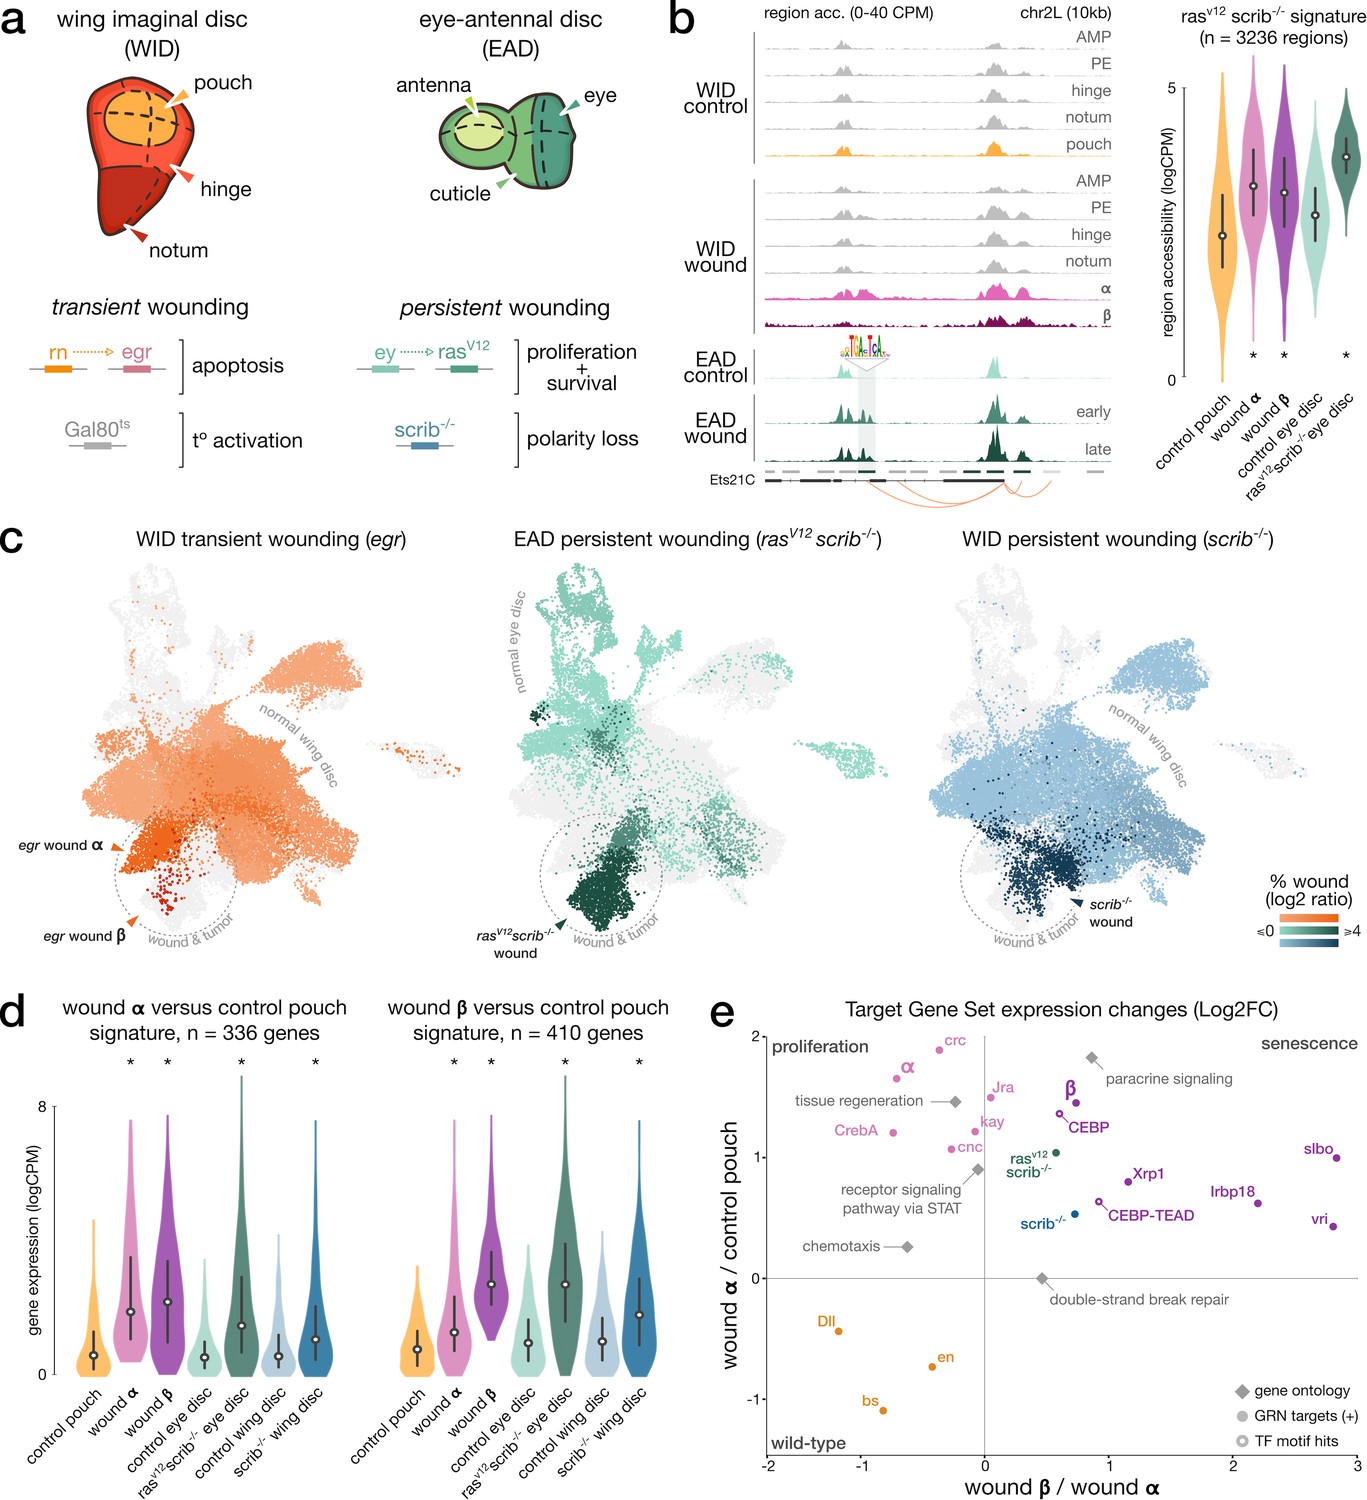
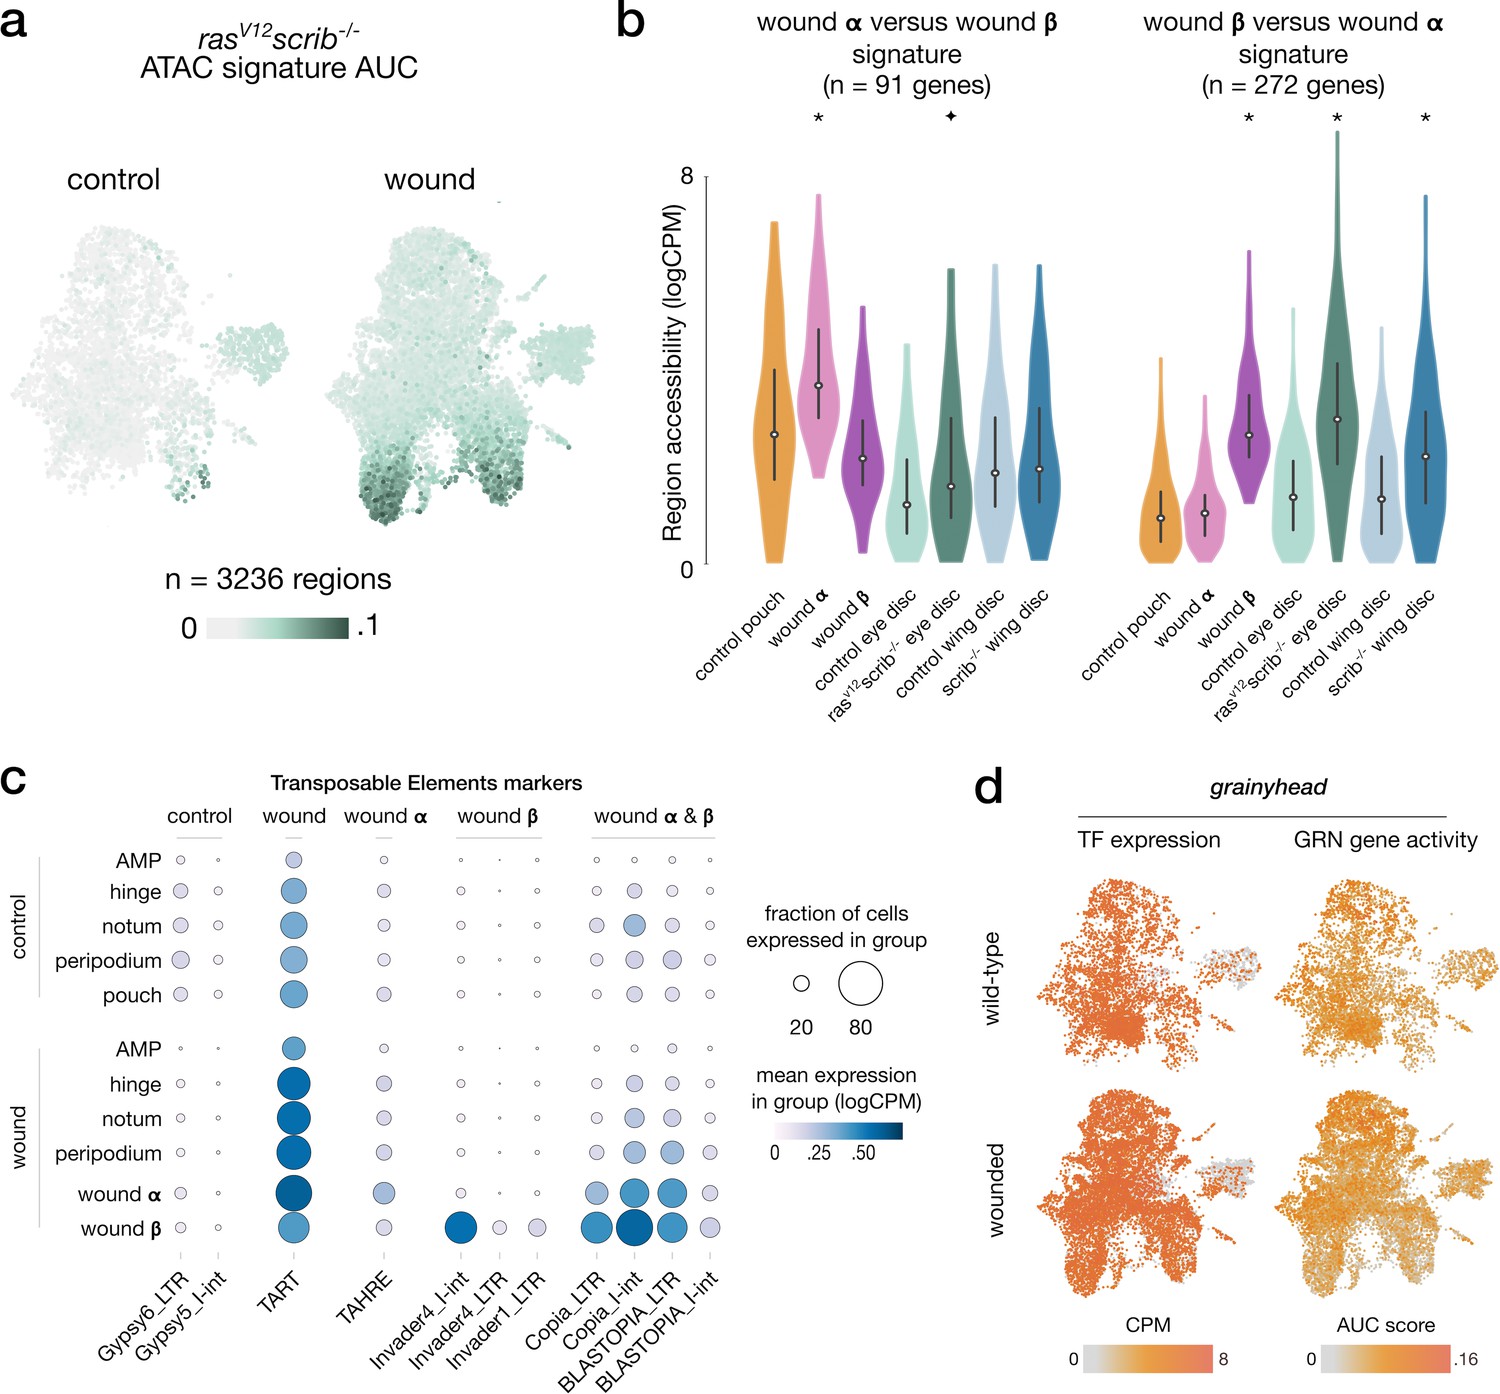
(a) Top: schematic of the imaginal wing and eye-antennal discs. bottom. Genetic constructs used to trigger localized, transient, or persistent wounding. (b) Left: example of a wound-responsive locus: aggregated (WID) and bulk (EAD) chromatin accessibility signals in wild-type and wound conditions at Ets21C loci, including an AP-1 target region (TF motif). right. Distribution of ATAC measures in rasV12scrib-/- region signature; asterisks denote significant enrichment compared to wild-type. (c) Integrated wound atlas UMAP. Dark color clusters are enriched in wound cells. We detect our populations α and β from the egr wound and two additional rasV12scrib-/- and scrib-/- wound populations. (d) Distribution of RNA measures in wound α and β gene signature; asterisks denote significant enrichment compared to wild-type. (e) Scatter plot of the mean expression fold-change of gene sets extracted from eGRN, GO, marker genes (rasV12scrib-/- and scrib-/-), and β-specific regions with CEBP or CEBP-TEAD motifs hits (target genes inferred from the CEBP eGRNS). Fold-changes are contrasting gene expression changes between (x) wound population α and β and (y) between wild-type pouch domain and wound α. All elements are significantly up- or downregulated in at least one axis (p-adj < 5*10e–3, paired t-test, Bonferroni corrected).
Figure 4—figure supplement 1
ATAC, RNA, and TE signatures in wound-specific populations.
(a) Scaled activity of the rasV12scrib-/- signature inferred from bulk ATAC data, scored using AUCell on wing disc ATAC data. (b) Distribution of gene expression measures of the gene signatures from wound α and β contrasted against each other across aggregated signals, asterisks (p-adj < 10e–3) and star (p-adj < 5*10e–3) denote significant enrichment compared to wild-type (one-tailed t-test). We note a higher accessibility of wound β signature in the rasV12scrib-/- ATAC signal. We also find a high accessibility of wound α signature in wild-type pouch ATAC signals, indicative of pouch specification markers present in this signature. (c) Results of the differential analysis of scRNA signal in Transposable Element regions (p-adj < 10e–3, log2FC > 1). We do not find a strong global change in TE signal between wild-type and wounded conditions. However, we note a clear increase in scRNA signal in the population β for the Invader4_I-int retrotransposon. (d) Activity of the grainyhead TF and its enhancer gene regulatory network (eGRN)-associated target genes in wounded and wild-type conditions.
Figure 4—figure supplement 2
Tumor sub-clustering analysis.
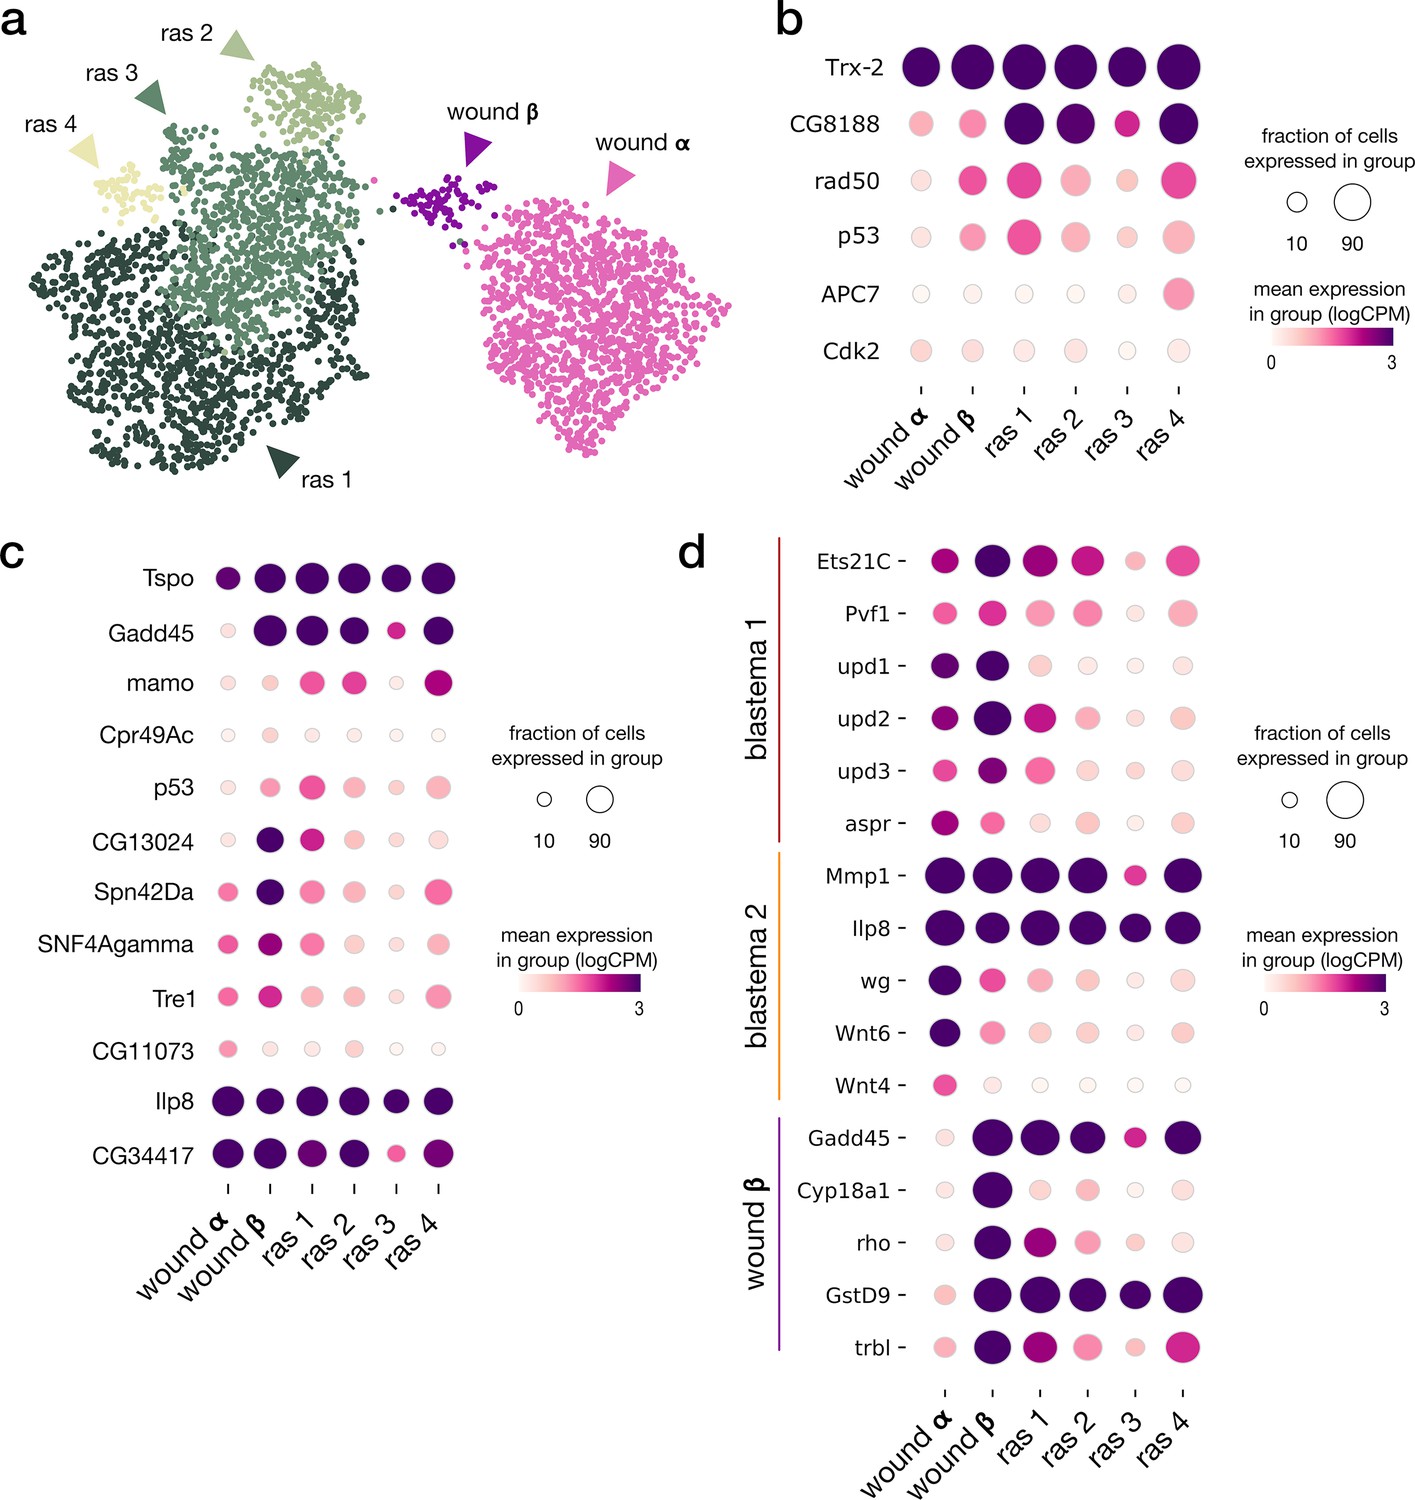
(a) Integrated UMAP of rasV12scrib-/- tumor and wound α and β populations. (b) Expression pattern of differentially expressed genes (p-adj < 10e–3, log2FC > 1.5) listed as leading edges of the Cellular Senescence gene set in Xrp1 overexpression analysis. The ras_1 subpopulation mostly includes cells from the late tumor sample. (c) Expression pattern of differentially expressed genes (p-adj < 10e–3, log2FC > 1.5) listed as leading edges of the CEBP target gene set in Xrp1 overexpression analysis. (d) Expression patterns of marker genes from wound population β and blastema populations from Worley et al.
Additional files
-
Supplementary file 1
Markers of the atlas cluster (leiden_resolution = 0.5), using scanpy rank_genes_groups, p_adj cutoff 0.01, log2FC cutoff of log2(3).
- https://cdn.elifesciences.org/articles/81173/elife-81173-supp1-v2.csv
-
Supplementary file 2
eRegulon metadata, orthology > 0.6, no min target set size, keep ext. if no direct, 0.2 minimum rho.
- https://cdn.elifesciences.org/articles/81173/elife-81173-supp2-v2.csv
-
Supplementary file 3
Enhancer DARs accessible in wound population with overlap information from previous work from Harris et al (EL3DR) and Vizcaya-Molina et al (iDRRE).
- https://cdn.elifesciences.org/articles/81173/elife-81173-supp3-v2.csv
-
Supplementary file 4
Markers of the wound populations (alpha vs. beta and both versus pouch) using scanpy rank_genes_groups, p_adj cutoff 0.01, log2FC cutoff of log2(2).
- https://cdn.elifesciences.org/articles/81173/elife-81173-supp4-v2.csv
-
Supplementary file 5
Markers of the tumors subclusters (each vs. all tumor), using scanpy rank_genes_groups, p_adj cutoff 0.01, log2FC cutoff of log2(2).
- https://cdn.elifesciences.org/articles/81173/elife-81173-supp5-v2.csv
-
Supplementary file 6
Regions and TF motif hit information used to construct featuremaps include the CEBP-specific target genes.
- https://cdn.elifesciences.org/articles/81173/elife-81173-supp6-v2.csv
-
MDAR checklist
- https://cdn.elifesciences.org/articles/81173/elife-81173-mdarchecklist1-v2.docx
Download links
A two-part list of links to download the article, or parts of the article, in various formats.
Downloads (link to download the article as PDF)
Open citations (links to open the citations from this article in various online reference manager services)
Cite this article (links to download the citations from this article in formats compatible with various reference manager tools)
Shared enhancer gene regulatory networks between wound and oncogenic programs
eLife 12:e81173.
https://doi.org/10.7554/eLife.81173


