Targeting the fatty acid binding proteins disrupts multiple myeloma cell cycle progression and MYC signaling
- Center for Molecular Medicine, Maine Health Institute for Research, United States
- Graduate School of Biomedical Science and Engineering, University of Maine, United States
- Tufts University School of Medicine, United States
- Dana-Farber Cancer Institute, United States
- Harvard Medical School, United States
- University of Vermont, United States
- University of New England, United States
Figures
Figure 1 with 8 supplements
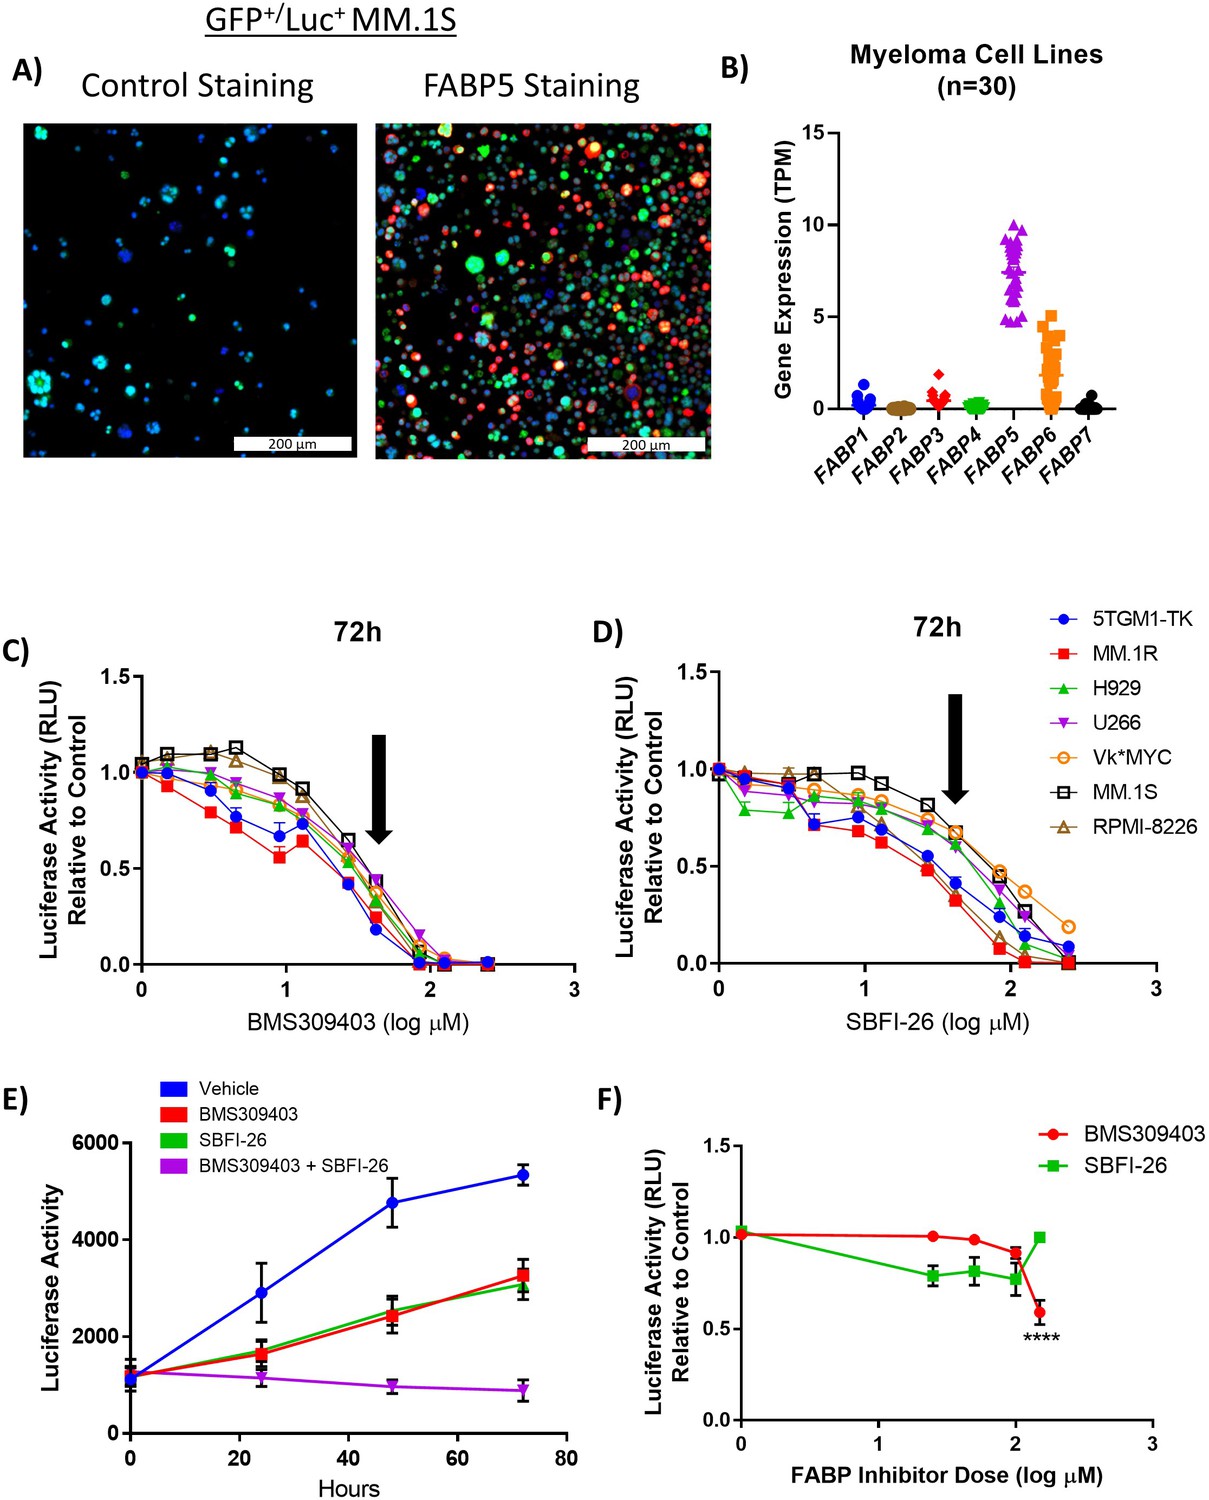
FABPi significantly impair MM cell growth and induces apoptosis.
(A) Confocal overlay immunofluorescence images show FABP5 (red) expressed in cytoplasm of GFP+/Luc+ MM.1S cells. Nuclei identified with DAPI (blue), cells stained with secondary antibody alone (control) or primary plus secondary antibodies (FABP5 staining), scale bar = 200 µm. (B) Comparison of basal gene expression of FABP isoforms in 30 myeloma cell lines. Data extracted from the Cancer Cell Line Encyclopedia (CCLE; DepMap, Broad (2022): DepMap 22Q2 Public. figshare. dataset. https://doi.org/10.6084/m9.figshare.19700056.v2), filtered in excel, and graphs made in Graphpad PRISM (v7.04) using scatter dot plots (mean ± SEM). (C, D) MM cell numbers after being exposed to (C) BMS309403 and (D) SBFI-26 for 72 hr; 50 µM dose (~EC50) indicated by arrows. (E) GFP+/Luc+MM.1S cell numbers after treatment with inhibitors in combination (50 µM each). Vehicle vs BMS309403 (24 hr, *; 48 hr, ****; 72 hr, ****). Vehicle vs SBFI-26 (24 hr, *; 48 hr, ****; 72 hr, ****). Vehicle vs BMS309403 +SBFI-26 (24 hr, ***; 48 hr, ****; 72 hr, ****). BMS309403 vs BMS309403 +SBFI-26 (48 hr, **; 72 hr, ****). SBFI-26 vs BMS309403 +SBFI-26 (48 hr, **; 72 hr, ****). Two-way ANOVA analysis with Tukey’s multiple comparisons test analysis. (F) CellTiter-Glo analysis of human mesenchymal stem cells after treatment with BMS309403 or SBFI-26 for 72 hr. Data are mean ± SEM and represent averages or representative runs of at least three experimental repeats. One-way ANOVA with Dunnett’s multiple comparison test significance shown as *p<0.05. **p<0.01. ***p<0.001. ****p<0.0001. **** p<0.0001. Please see 8 supplements to Figure 1.
Figure 1—figure supplement 1
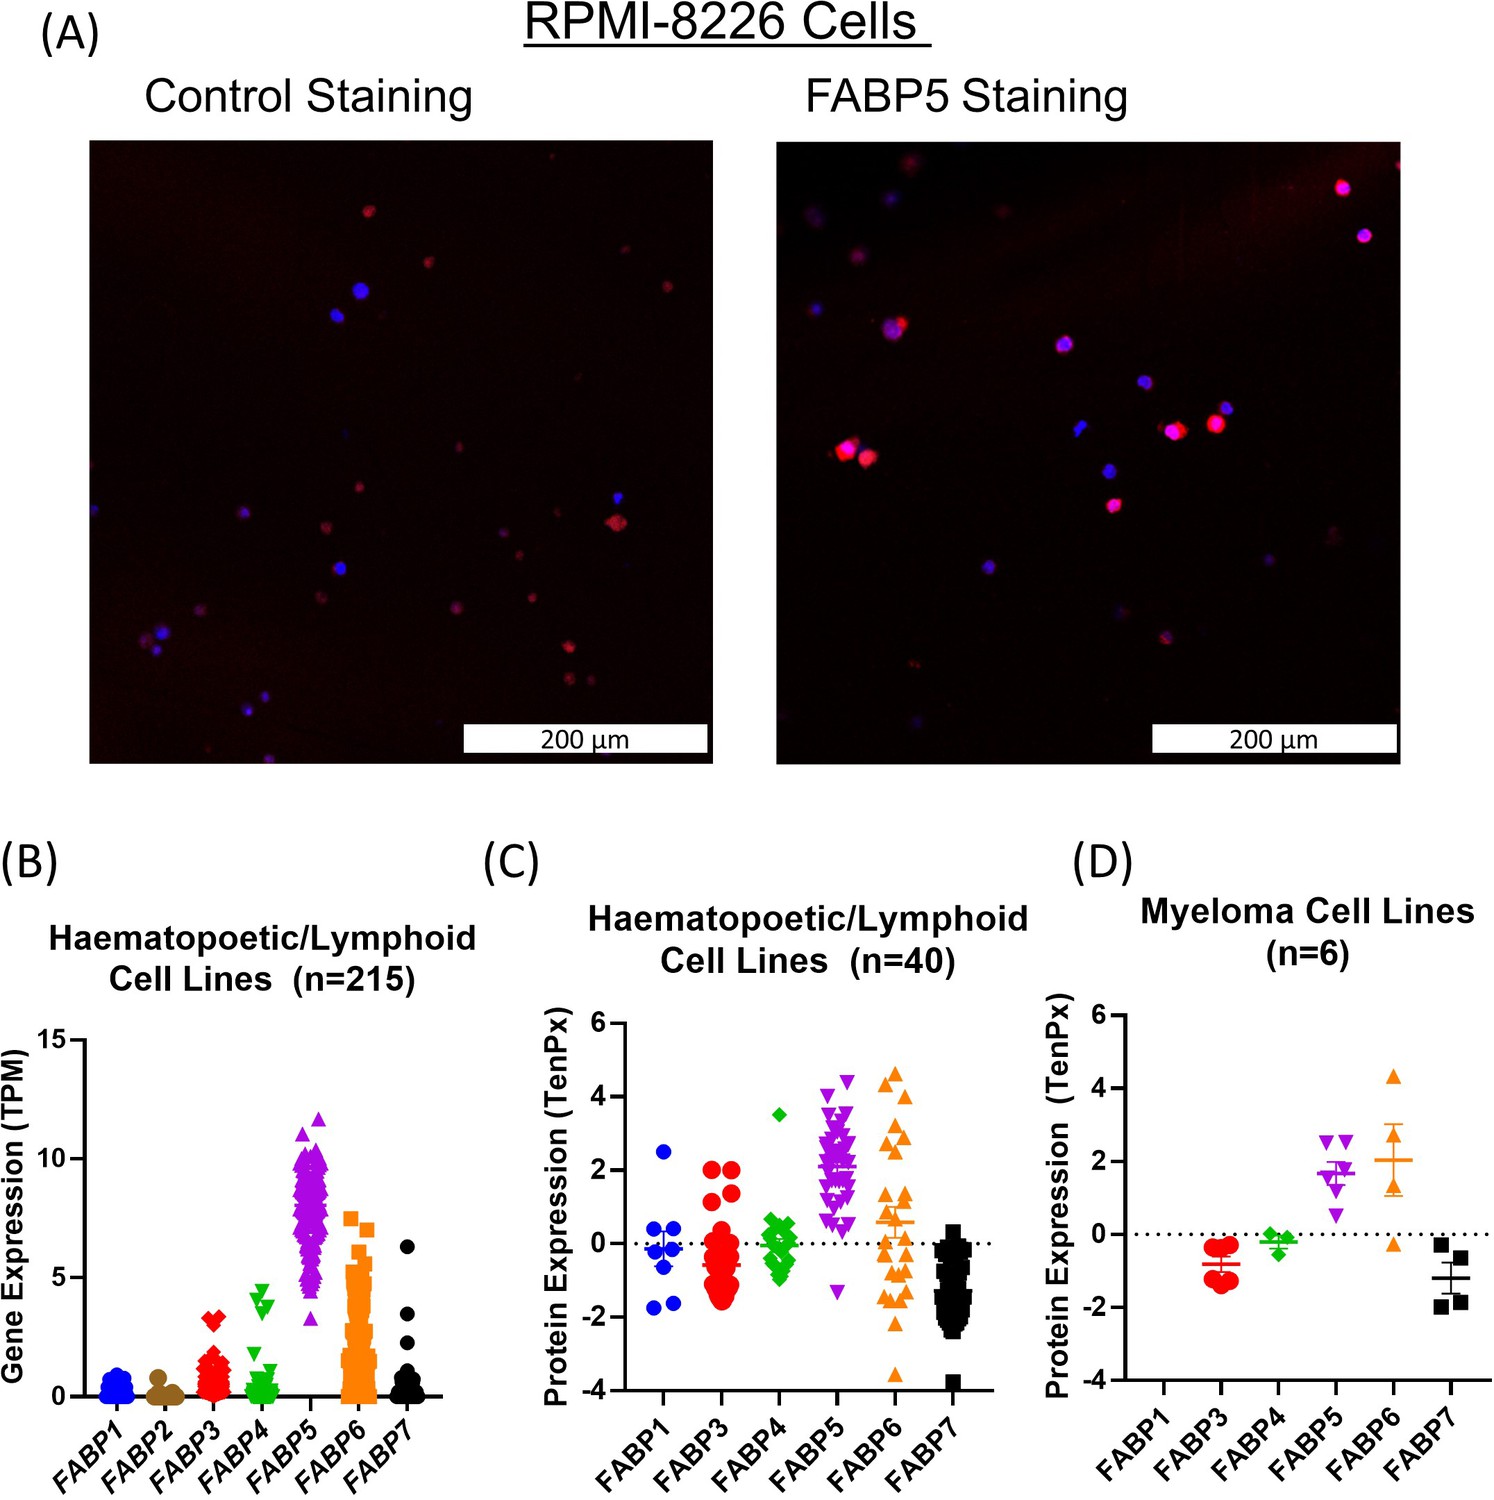
Expression of FABP family members in MM and hematopoetic/lymphoid cell lines.
(A) Confocal overlay immunofluorescence images show FABP5 (red) primarily in cytoplasm. Nuclei identified with DAPI (blue) in RPMI-8226 cells. Cells stained with secondary antibody alone (left) and primary and secondary (right). (B,C) Gene and protein expression of FABP family members in cell lines of haematopoetic and lymphoid lineage. Comparison of basal gene expression of FABP1, FABP2, FABP3, FABP4, FABP5, FABP6, and FABP7 reveals higher expression of FABP5 and FABP6 in 215 cell lines (B). Mass spectrometry proteomics comparing protein expression of FABP1, FABP3, FABP4, FABP5, FABP6, and FABP7 in 40 cell lines of the haematopoetic/lymphoid lineage (C), six of which were myeloma cell lines (D). Data extracted from the Cancer Cell Line Encyclopedia (CCLE; DepMap, Broad (2022): DepMap 22Q2 Public. figshare. Dataset. https://doi.org/10.6084/m9.figshare.19700056.v2), filtered in excel, and graphs made in Graphpad PRISM using scatter dot plots (mean ± SEM) (v7.04).
Figure 1—figure supplement 2
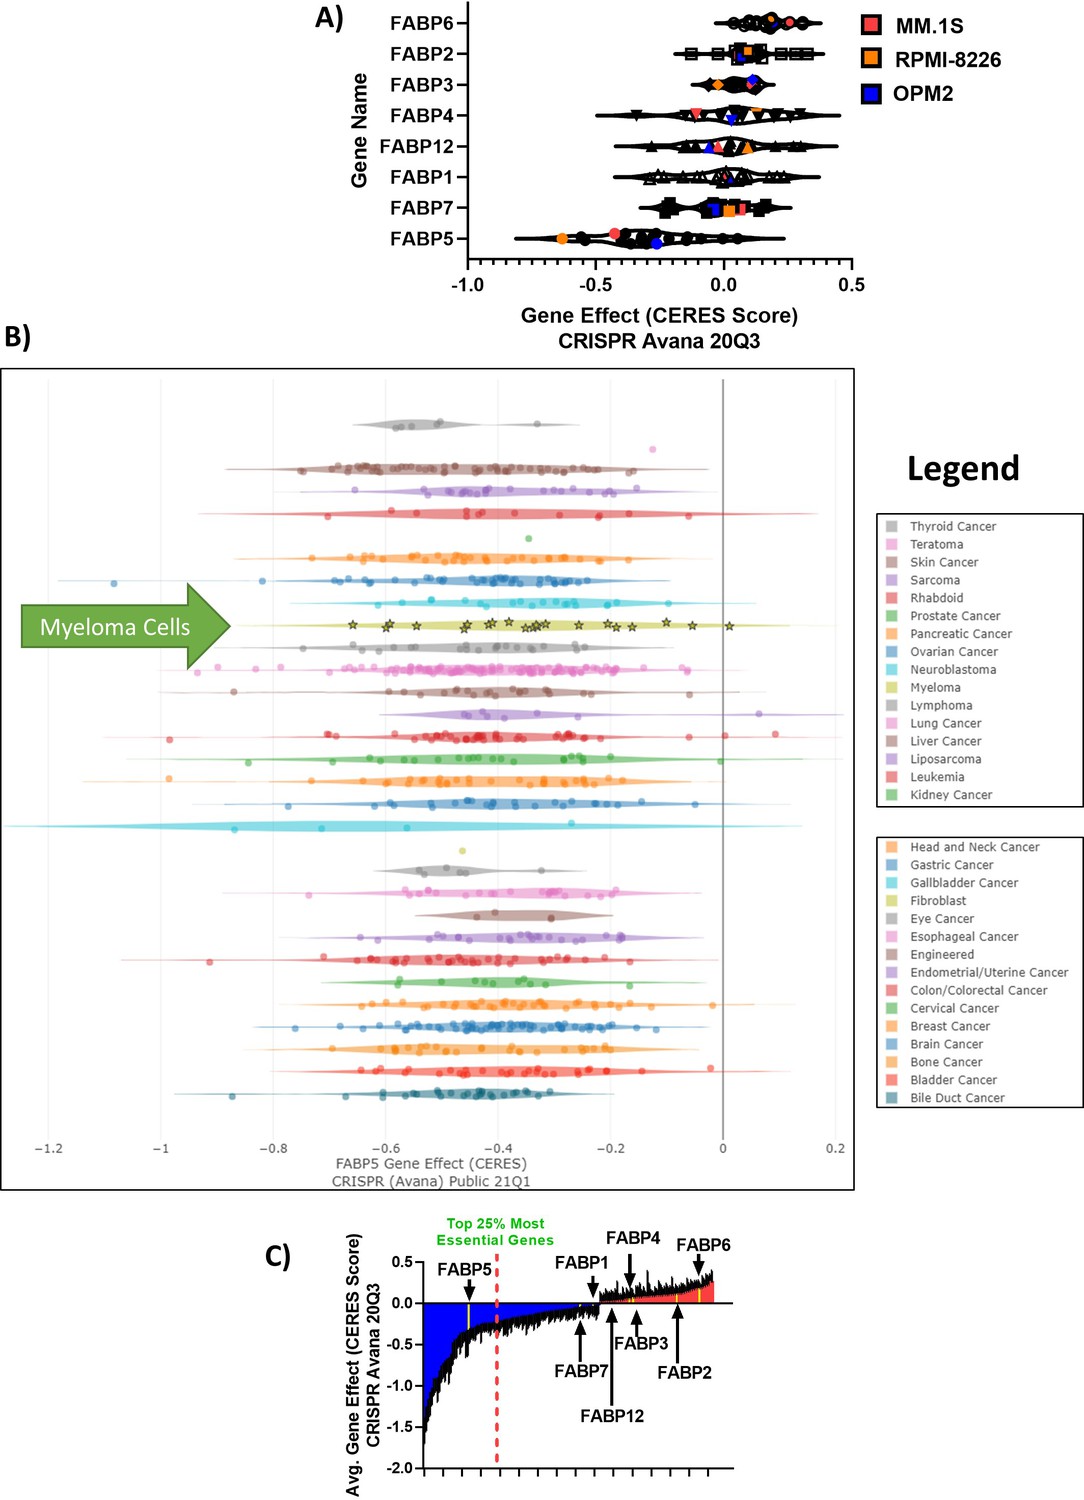
FABP Depmap CERES scores in tumor cells show that FABP proteins are clinically relevant in MM.
(A) CERES DepMap scores for the FABP members labeled with mean scores. (B) Derived from CRISPR Avana Public 21Q1 screen for all tumor cells available in Depmap database. FABP5 showed a negative value for all cancer types, demonstrating a dependency on FABP5 for tumor cell survival. Myeloma cells are highlighted with stars and green arrow. Legend provided is in the same order as the cell lines plotted. (C) Fatty acid metabolism-related genes in the DepMap; genes with negative scores in blue (essential) and positive scores (not essential) in red.
Figure 1—figure supplement 3
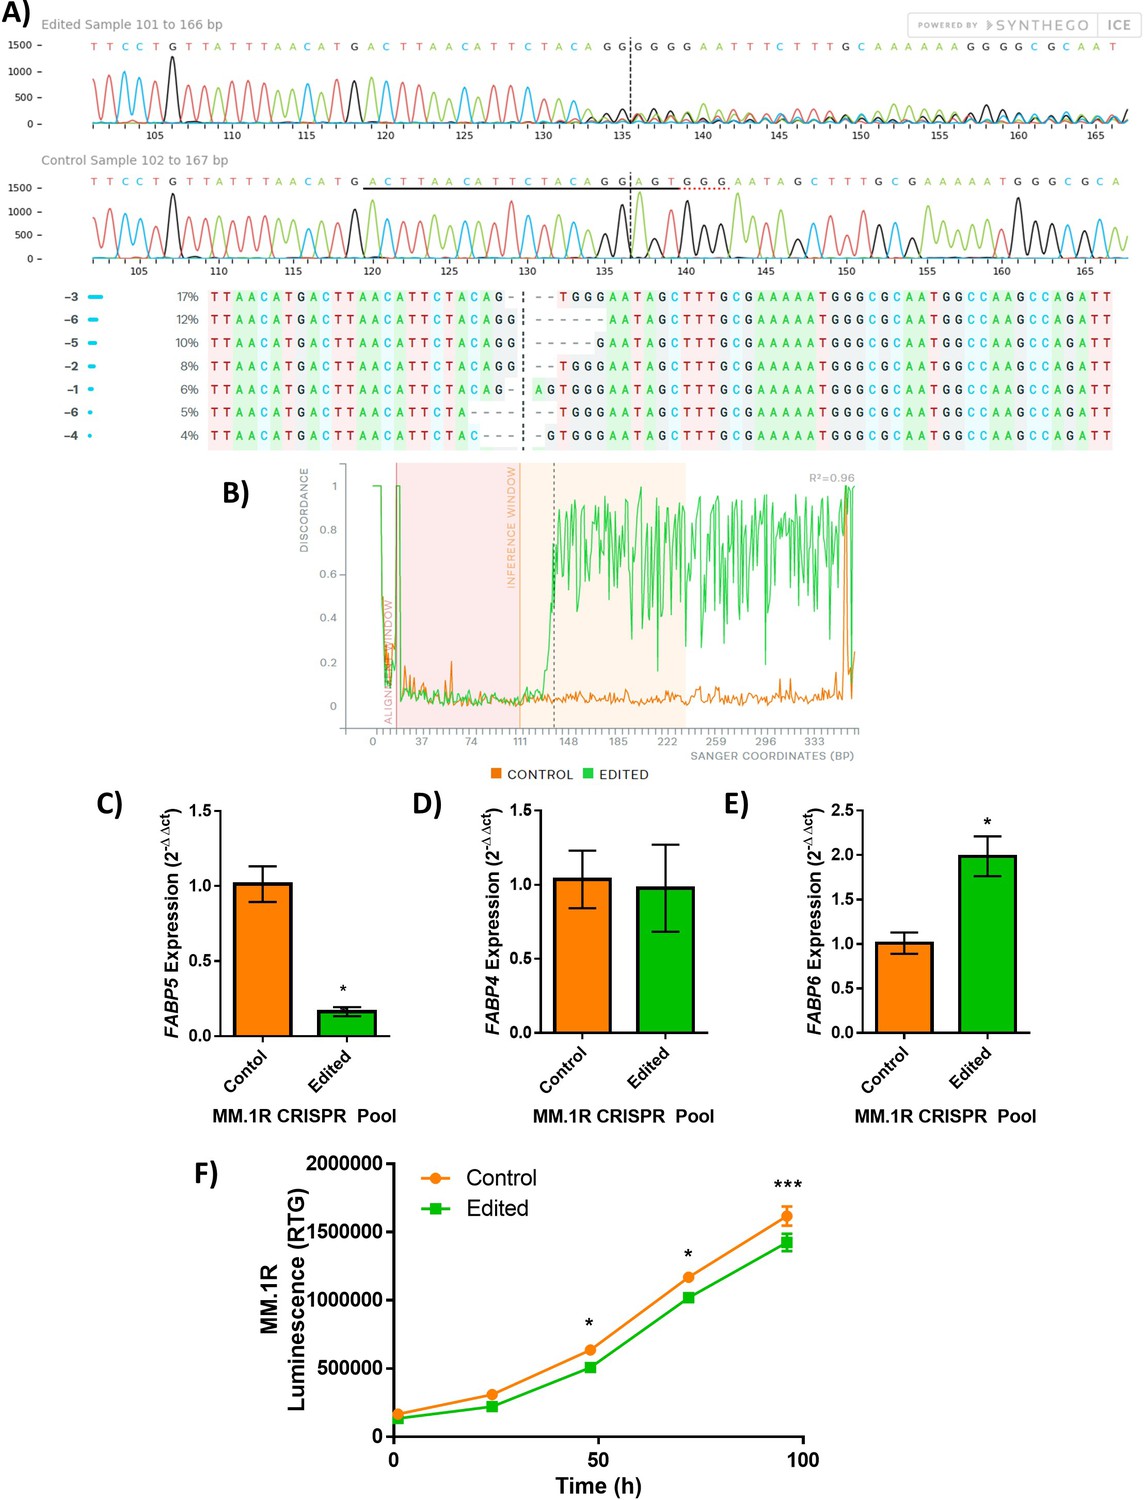
FABP5 knockout (KO) MM.1R myeloma cell line.
FABP5 was genetically targeted by CRISPR-Cas9 in the MM.1R human myeloma cell line (ATCC). (A) Sanger sequencing confirmation of KO (edited) and control (wild type) MM.1R populations including traces (top), and inferred sequences present in MM.1R edited population (middle, wild-type sequence ‘+’, panel). (B) Representation of alignment between the wild type (control, orange) and KO (edited, green) cells. In panels A,B, dotted lines indicate CRISPR-Cas9 cut site; data provided by Synthego. qRT-PCR analysis of the expression of FABP family members in the control (orange) and edited (green) pools: (C) FABP5, (D) FABP4, and (E) FABP6; n=3, data plotted as Mean ± SEM with significance determined by Student’s t-test (*P<0.05). (F) RealTime-Glo analysis of MM.1R cells in FABP5 control (orange) and edited (green) lines over time (n=8 wells per group), significance was determined by two-way ANOVA with Sidak’s multiple comparisons test (*p<0.05, ***p<0.001). Data plotted as Mean ± SEM for one experiment with eight technical wells; representative of two separate experiments.
Figure 1—figure supplement 4
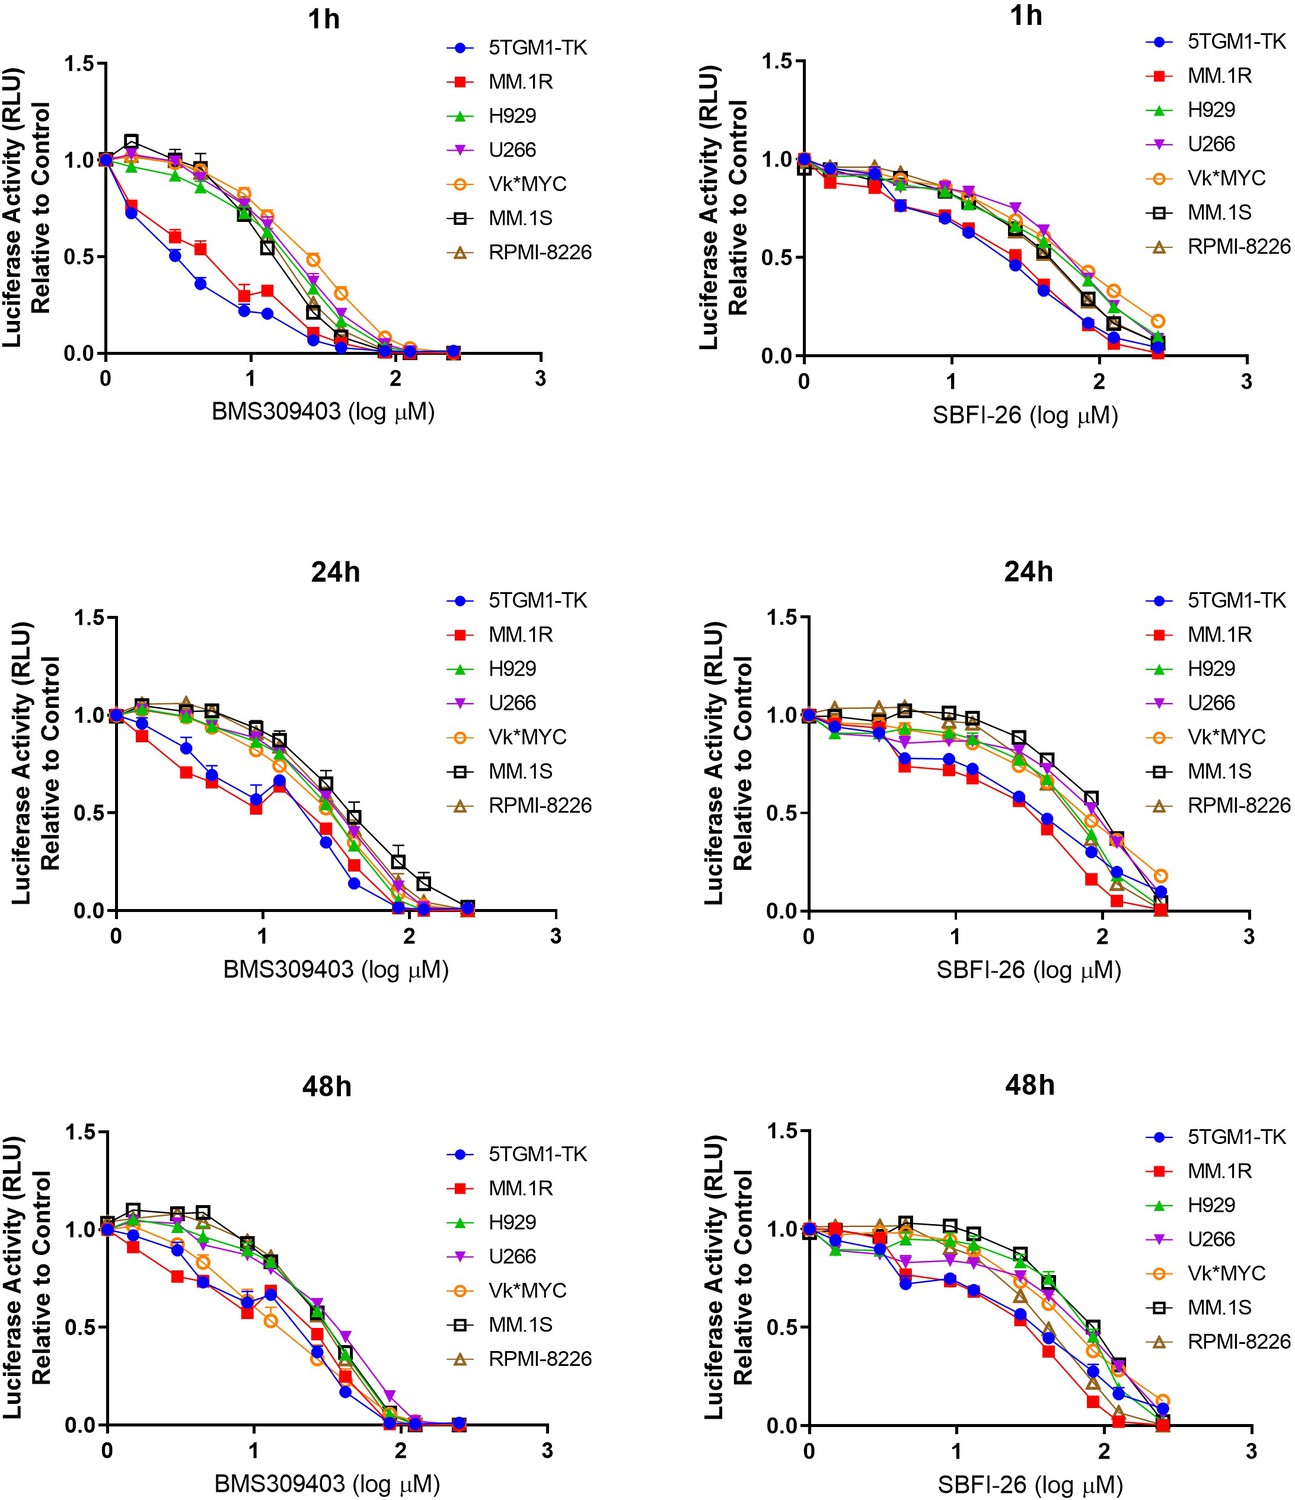
FABP inhibitors exhibit consistent negative effects on cell number in eight myeloma cell lines.
RealTime-Glo analysis of MM cell lines over time with FABP inhibitors demonstrates dose-dependent decreases in luciferase activity. Data represent mean ± SEM from at least three biological repeats. GFP+/Luc+MM.1S were used in these experiments with similar responses observed in ATCC MM.1S (data not shown).
Figure 1—figure supplement 5
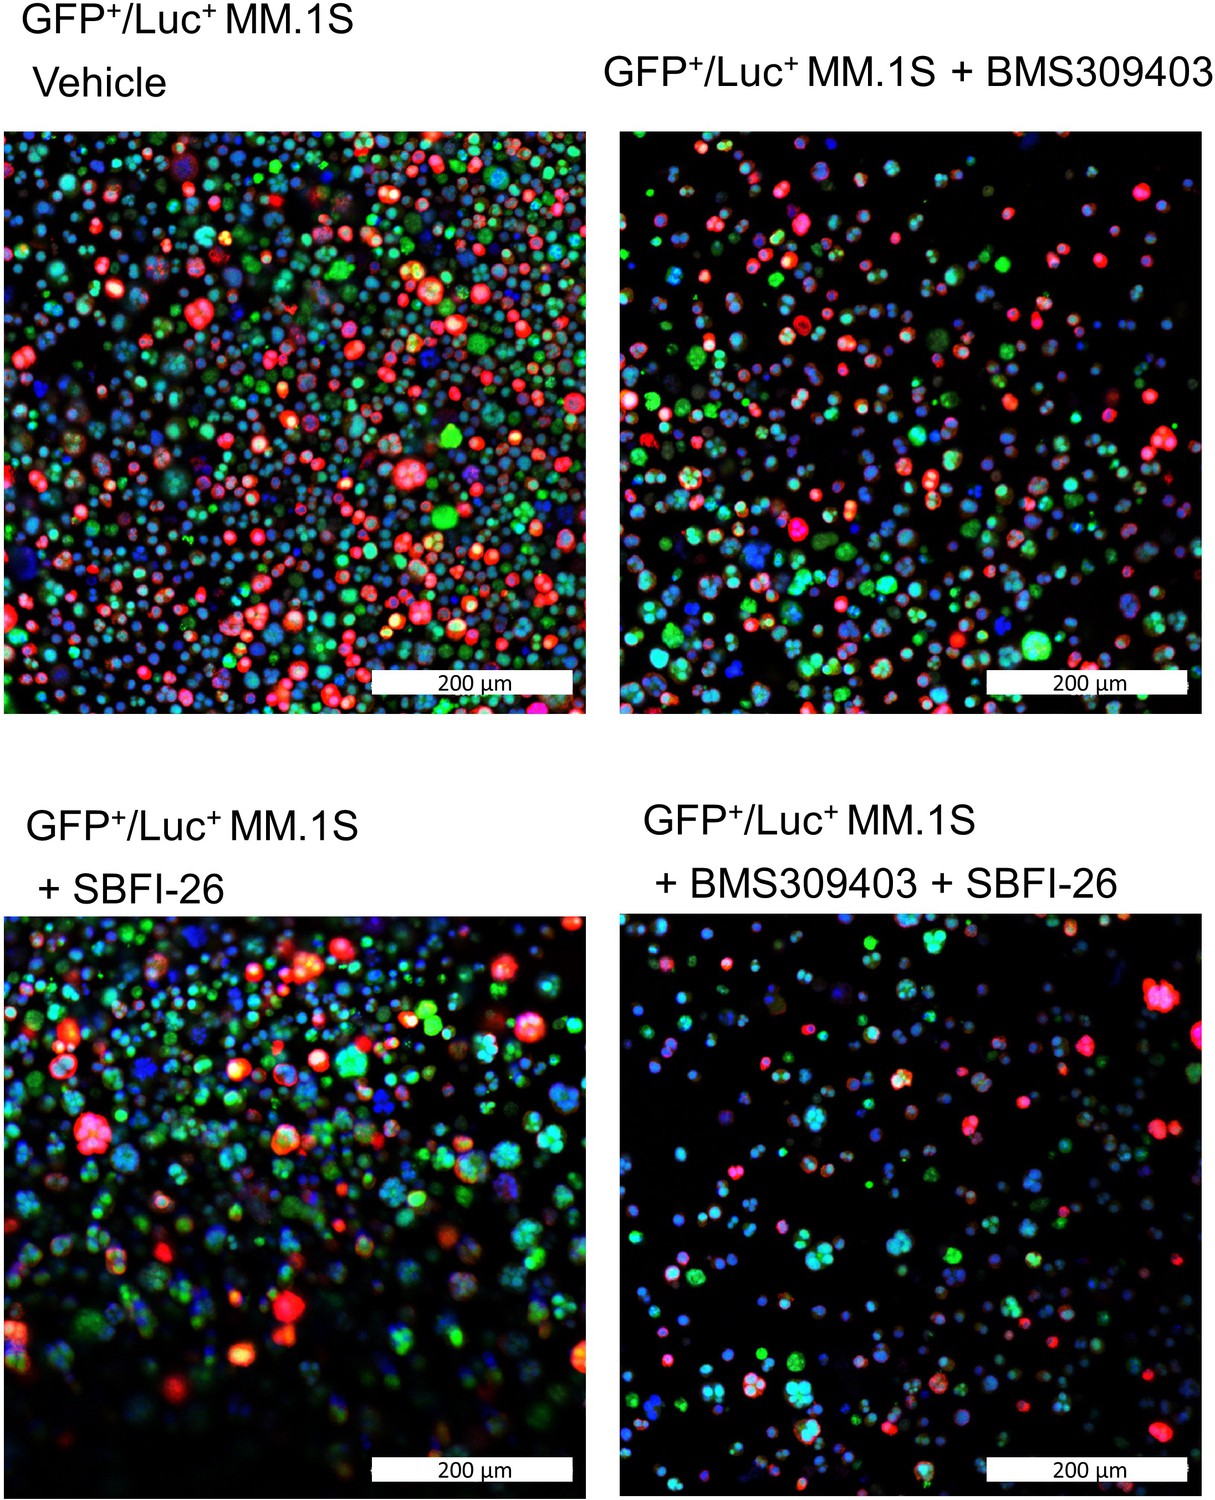
FABP inhibitor treatment did not induce changes in amount or localization of FABP5 in GFP+/Luc+MM.1 S cells.
Immunofluorescence images with confocal overlay show cells stained for nuclei (DAPI, blue) and FABP5 (red) after treatment with vehicle control or FABP inhibitors (50 µM) for 24 hr. Representative confocal images from three wells.
Figure 1—figure supplement 6
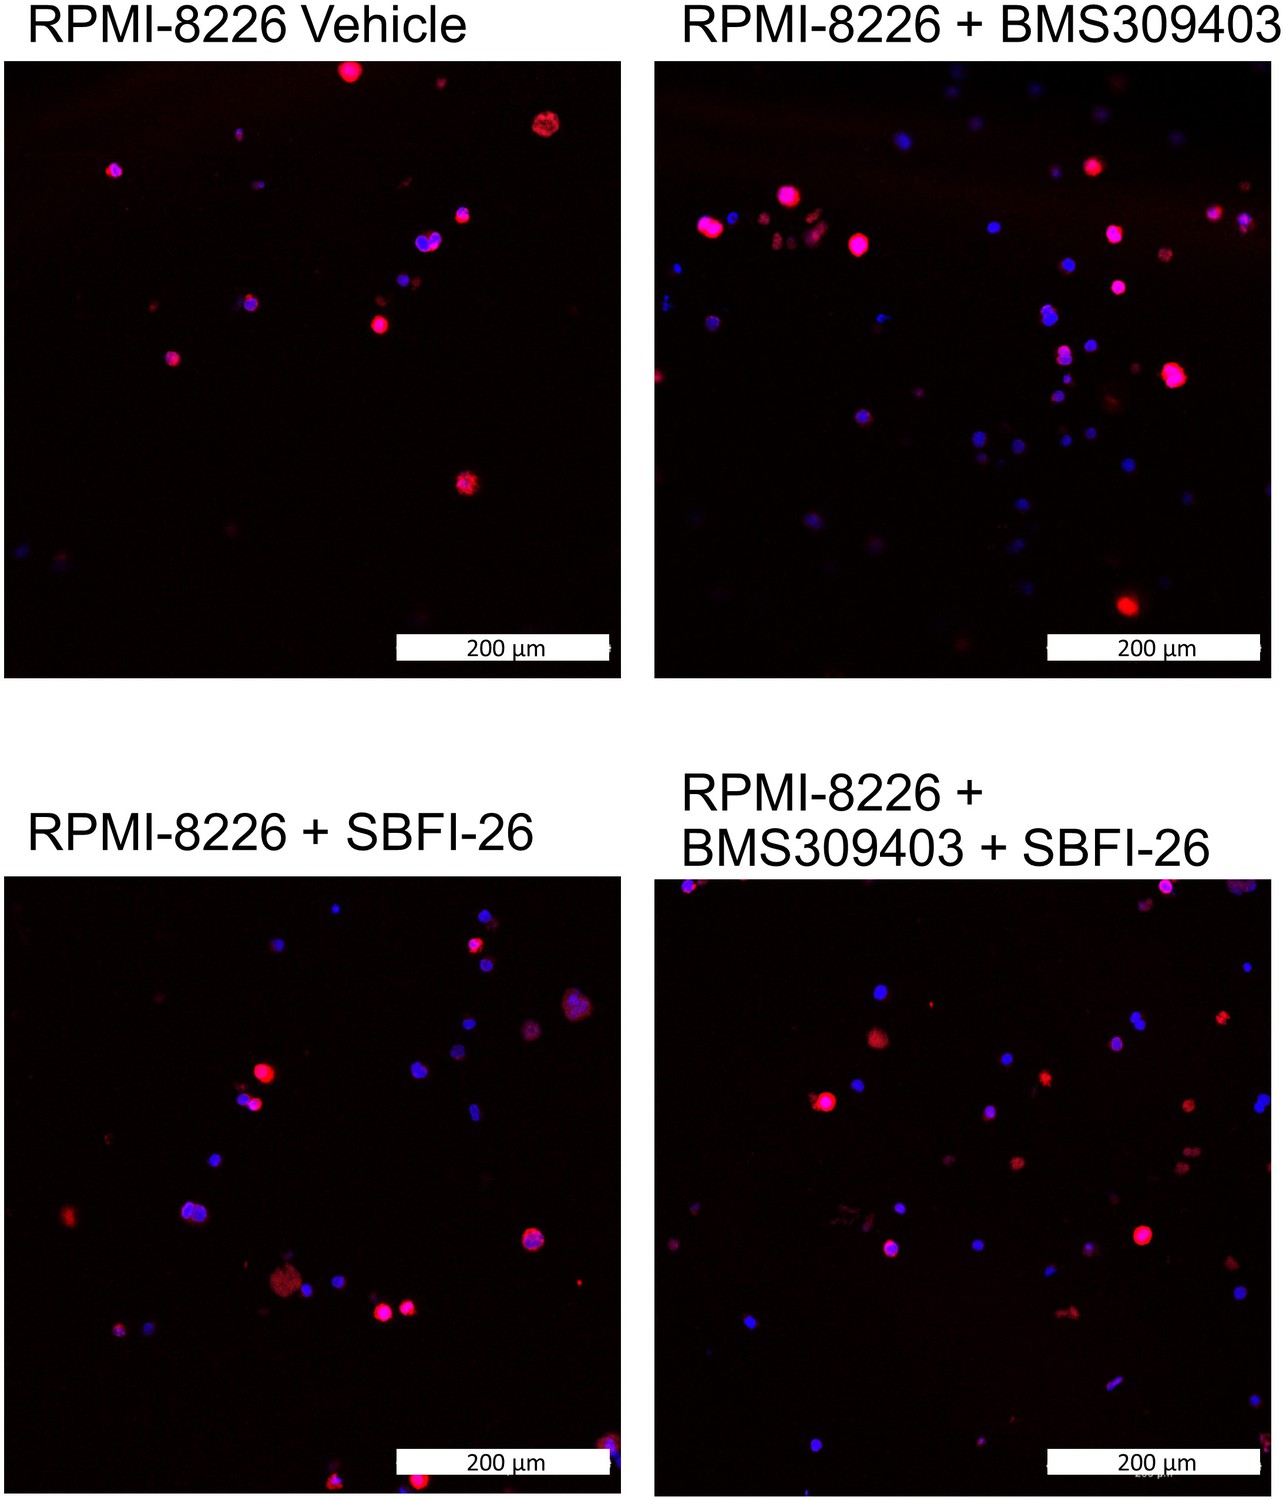
FABP inhibitor treatment did not induce changes in amount or localization of FABP5 in RPMI-8226 myeloma cells.
Immunofluorescence images with confocal overlay show cells stained for nuclei (DAPI, blue) and FABP5 (red) after treatment with vehicle control or FABP inhibitors (50 µM) for 24 hr. Representative confocal images from three wells.
Figure 1—figure supplement 7
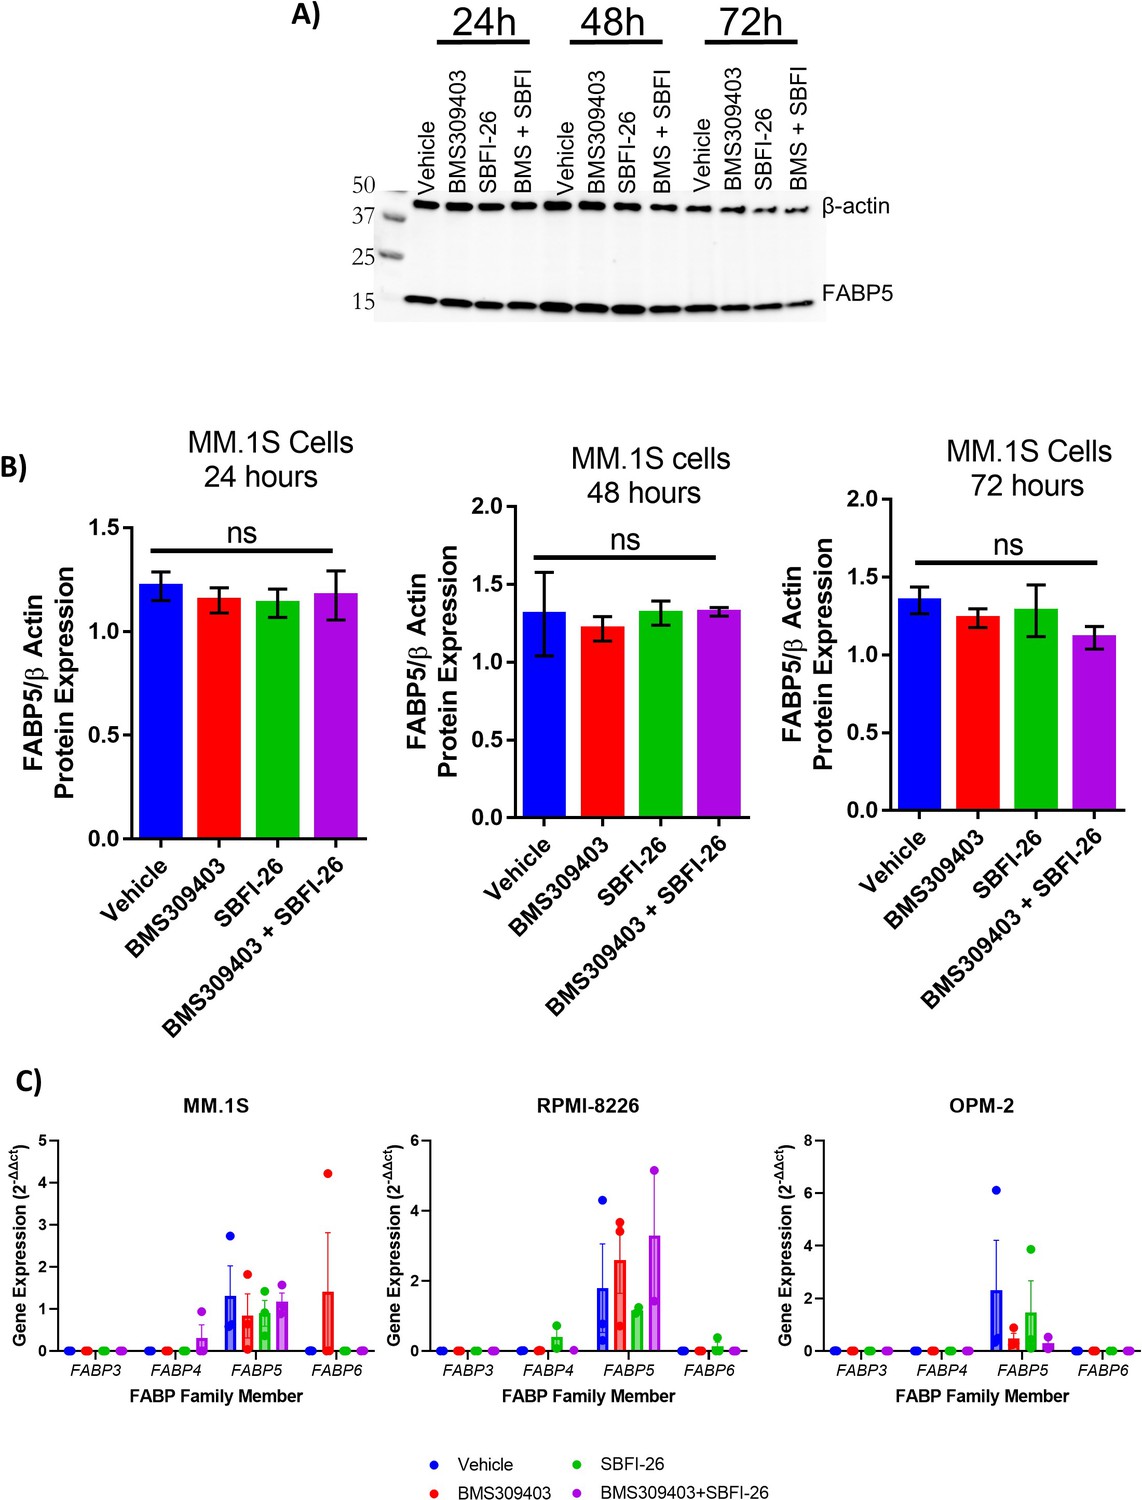
Protein levels of FABP5 are not affected by inhibitors in MM.1S cells.
(A) Representative western blot of B-actin (housekeeping control) and FABP5 protein levels at 24, 48, and 72 hr after treatment with BMS309403 (50 µM), SBFI-26 (50 threeM) or the combination. (B) Quantification of western blots. Data represent Mean ± SEM from three biological repeats, analyzed with one-way ANOVA. (C) qPCR of 4 FABP family members in three human myeloma cell lines 24 hr after treatment with BMS309403 (50 µM), SBFI-26 (50 µM) or the combination; data represent Mean ± SEM from two to three biological repeats, analyzed with one-way ANOVA. All gene expression relative to FABP5 vehicle control. GFP+/Luc +MM.1 S used in panels A and B, ATCC MM.1S used in panel C.
Figure 1—figure supplement 8
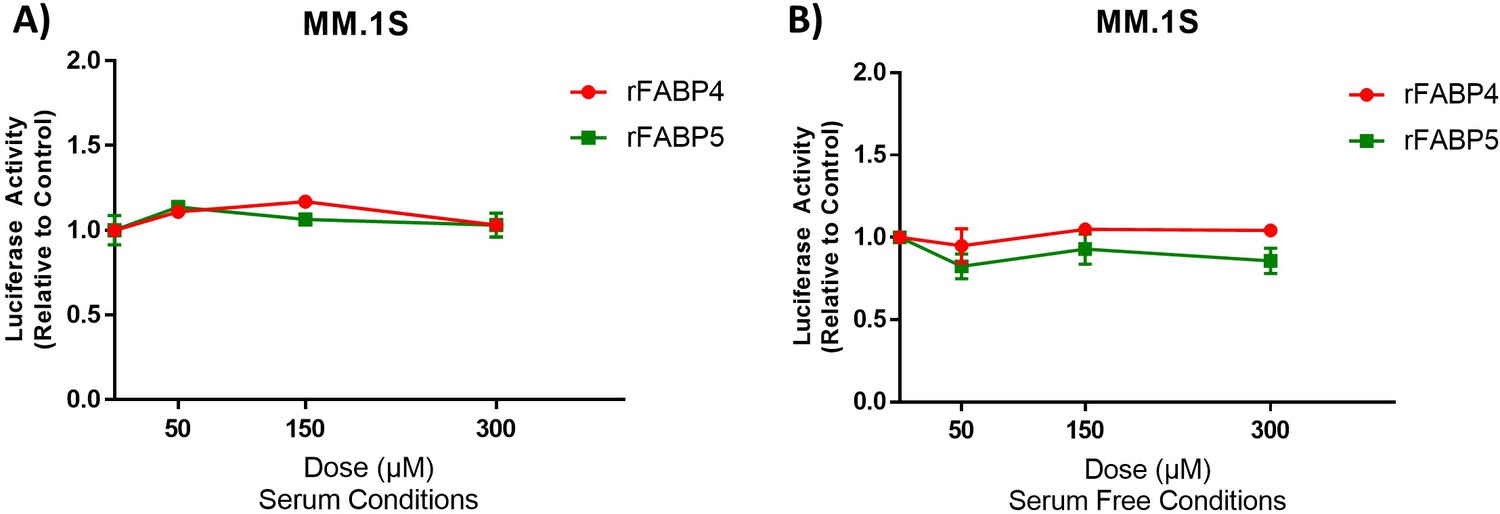
Treatment with recombinant FABP4 or FABP5 has no effect on GFP+/Luc+ MM.1 S cell numbers.
Luciferase activity analysis after 72 hr of recombinant human FABP4 or FABP5 protein treatment in myeloma cells in 10% serum or serum free conditions. (A) Cell growth was monitored with exogenous luciferin after exposure to recombinant FABP4 or 5 (rFABP4 or rFABP5) protein in serum containing or (B) serum free conditions. Data represent n=3, Mean ± SEM, averages of at least three experimental repeats. Statistical analysis was determined with a one-way ANOVA for each recombinant FABP; no significance was observed.
Figure 2 with 3 supplements
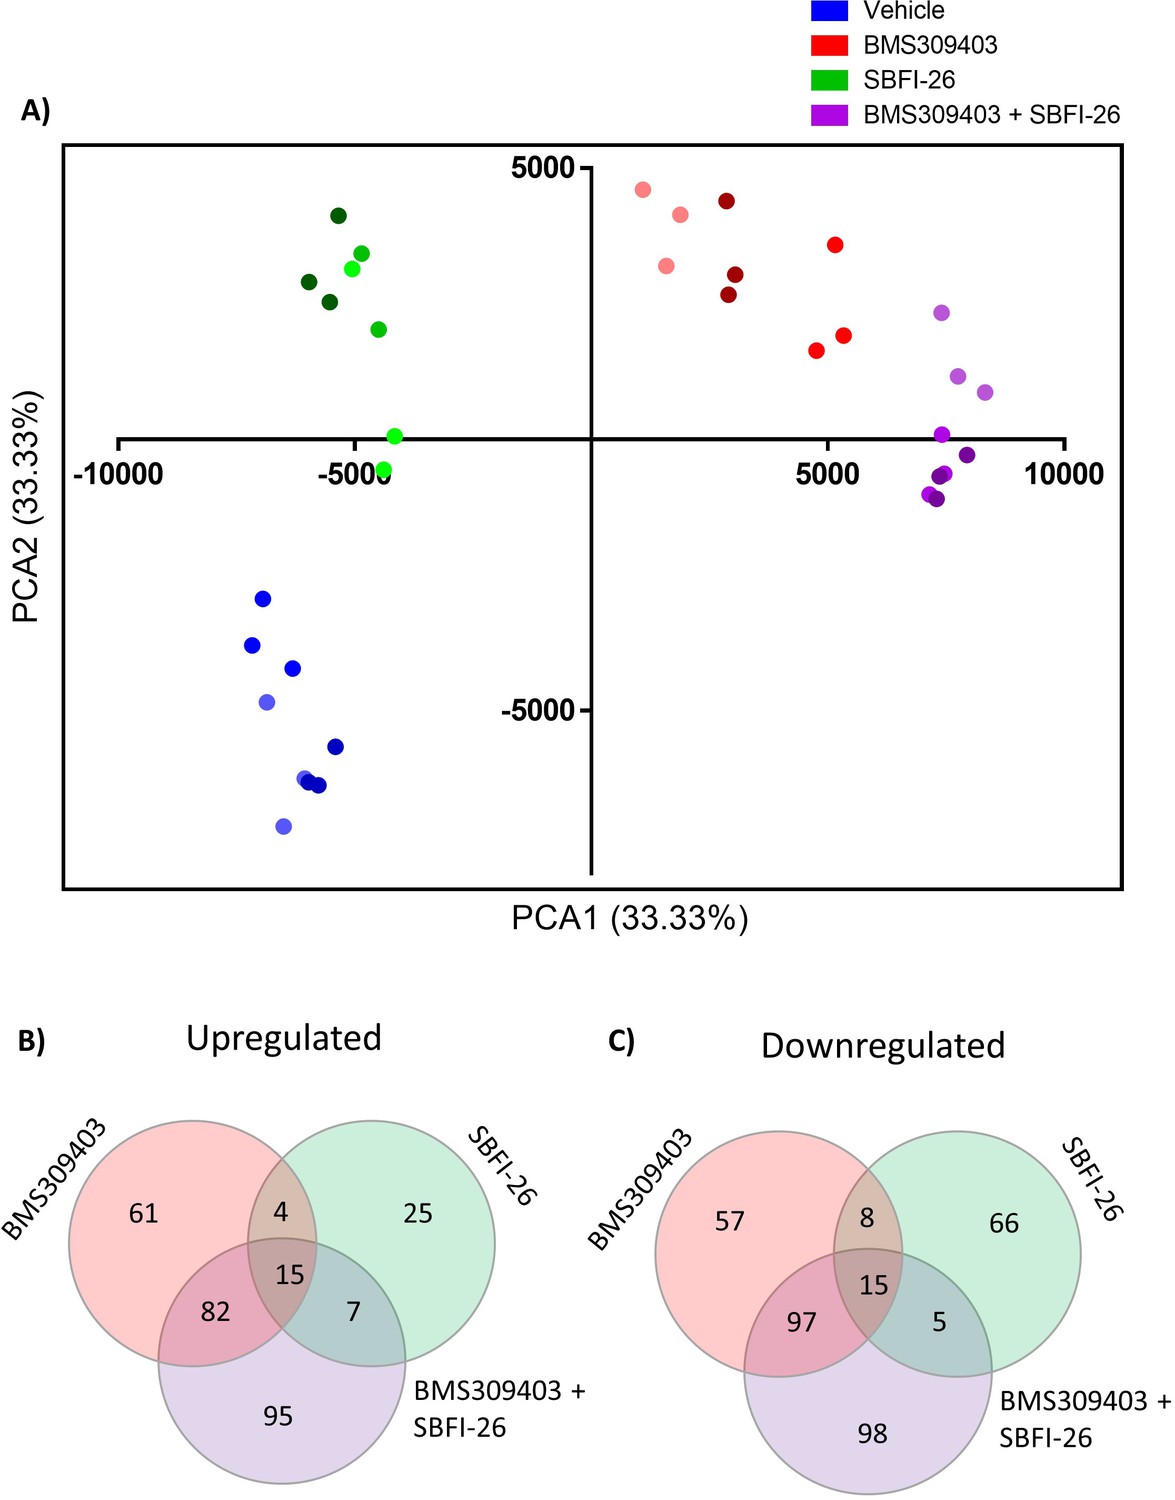
RNA sequencing analysis of MM1S cells treated with FABPi for reveals unique gene expression patterns.
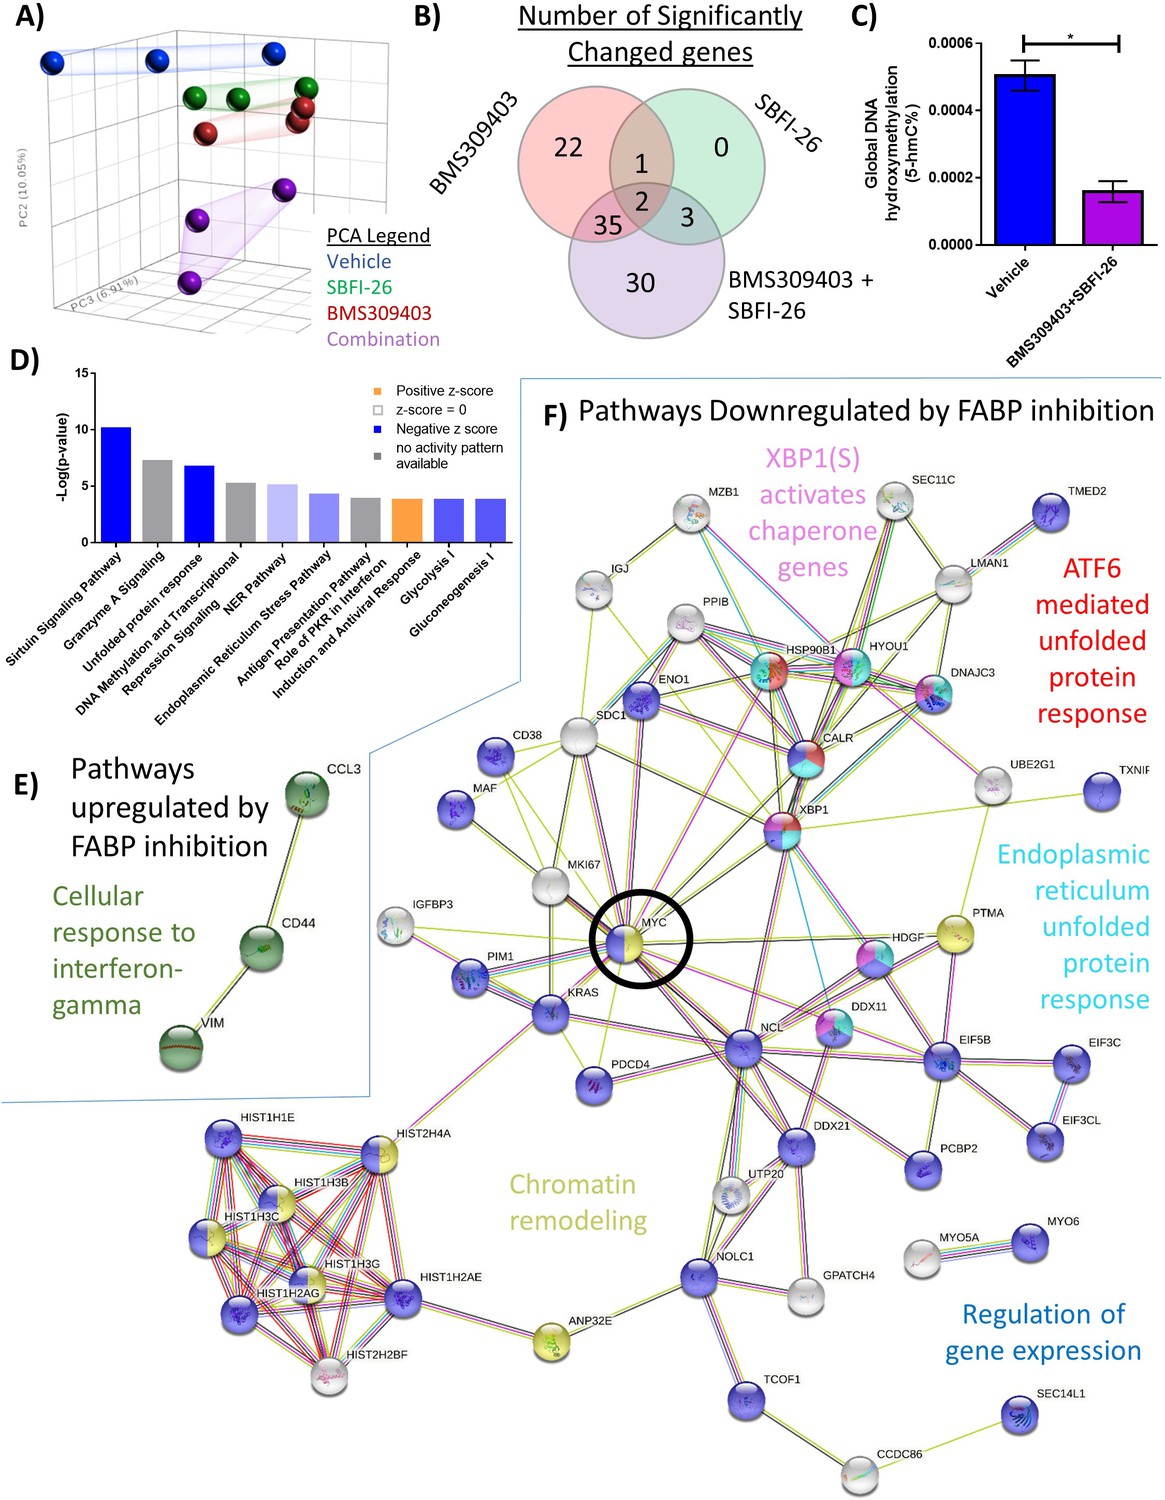
(A) Principal component analysis of cells after 24 hr treatments. (B) Venn diagram displays the overlapping and specific genes dysregulated with FABPi (FDR cutoff of 0.2). (C) Global hydroxymethylation DNA analysis of MM.1S cells after 24 hr of combination treatment. Data represent mean and +/- SEM using n=3 biological repeats, and * p<0.05 using an unpaired, two-tailed Student t-test. (D) Ingenuity pathway analysis of RNA-Seq results (p-value of overlap by Fisher’s exact test, significance threshold value of p<0.05(-log value of 1.3)). Stringdb (FDR cutoff of 0.2) of the combination therapy versus control showing (E) the 1 upregulated pathway and (F) 5 of the many downregulated pathways. MYC, a central node, is circled for emphasis. GFP+/Luc +MM.1 S cells were used for these experiments. Please see 3 supplements to Figure 2.
Figure 2—figure supplement 1
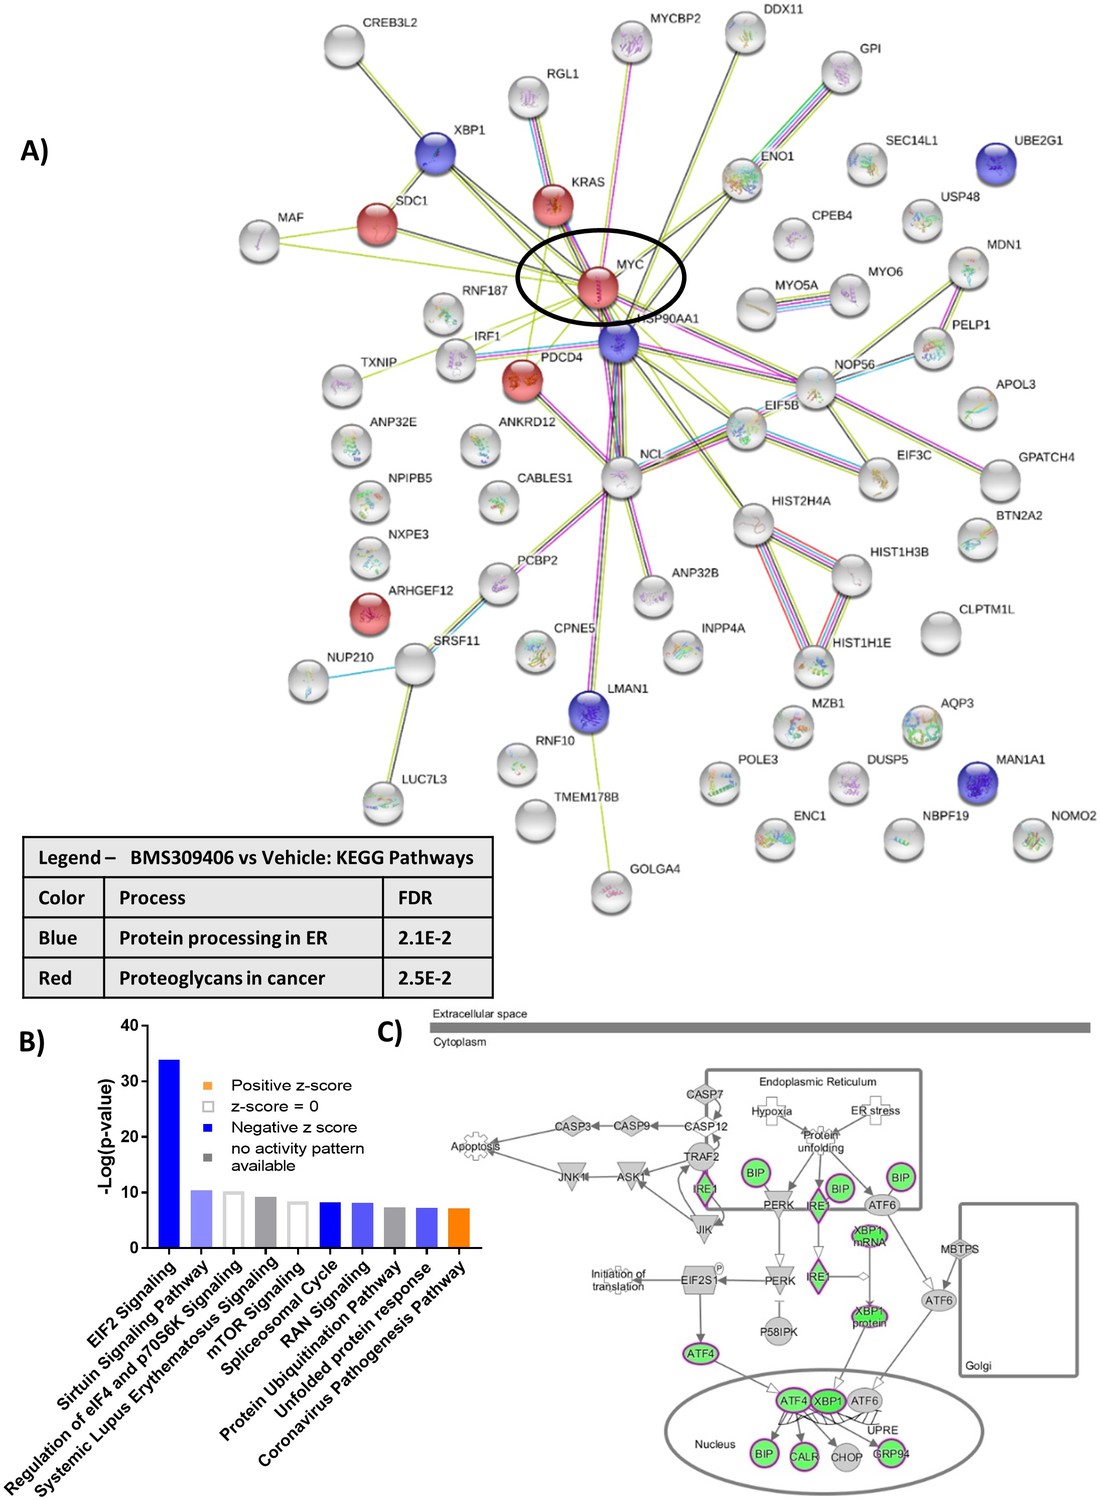
RNA sequencing analysis of GFP+/Luc+MM.1 S cells treated for 24 hr with BMS309403.
(A) String db visualization of significantly altered genes (FDR <0.2) demonstrates importance of MYC as central, connected node (circled). (B) Ingenuity pathway analysis (IPA) reveals altered canonical pathways after BMS309403 treatment compared to control such as endoplasmic reticulum stress pathway (C). IPA canonical pathway analysis utilizes p-value of overlap by Fisher’s exact test, significance threshold value of p<0.05(-log value of 1.3).
Figure 2—figure supplement 2
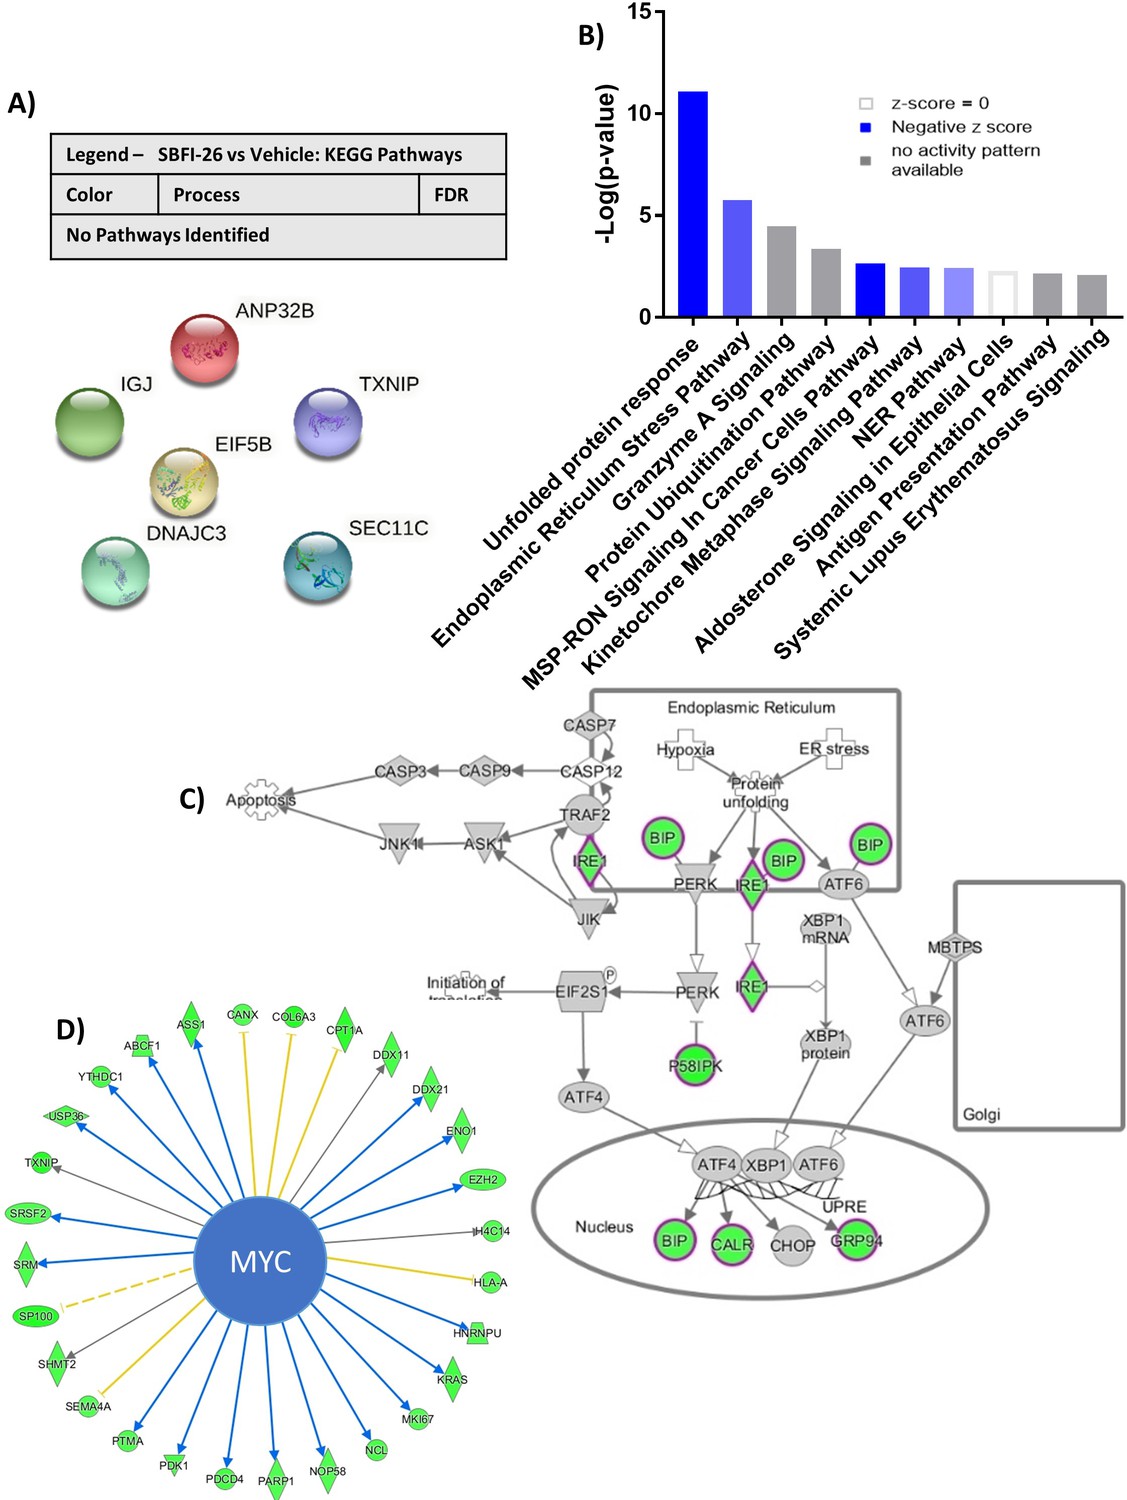
RNA sequencing analysis of GFP+/Luc+MM.1 S cells treated for 24 hr with SBFI-26.
(A) String db visualization and analysis reveals no known connections between 6 significantly altered genes (FDR <0.2) in response to SBFI-26. (B) Ingenuity pathway analysis predictions a reduction in canonical signaling pathways after SFBI-26 treatment compared to control such as (C) endoplasmic reticulum stress pathway and (D) MYC-regulated molecules (arrows indicate expression consistency with predicted patterns blue = consistent, yellow = unknown, orange = inconsistent; color of molecules indicates expression pattern (green = decreased by treatment, red = increased by treatment)). IPA canonical pathway analysis utilizes p-value of overlap by Fisher’s exact test, significance threshold value of p<0.05(-log value of 1.3).
Figure 2—figure supplement 3
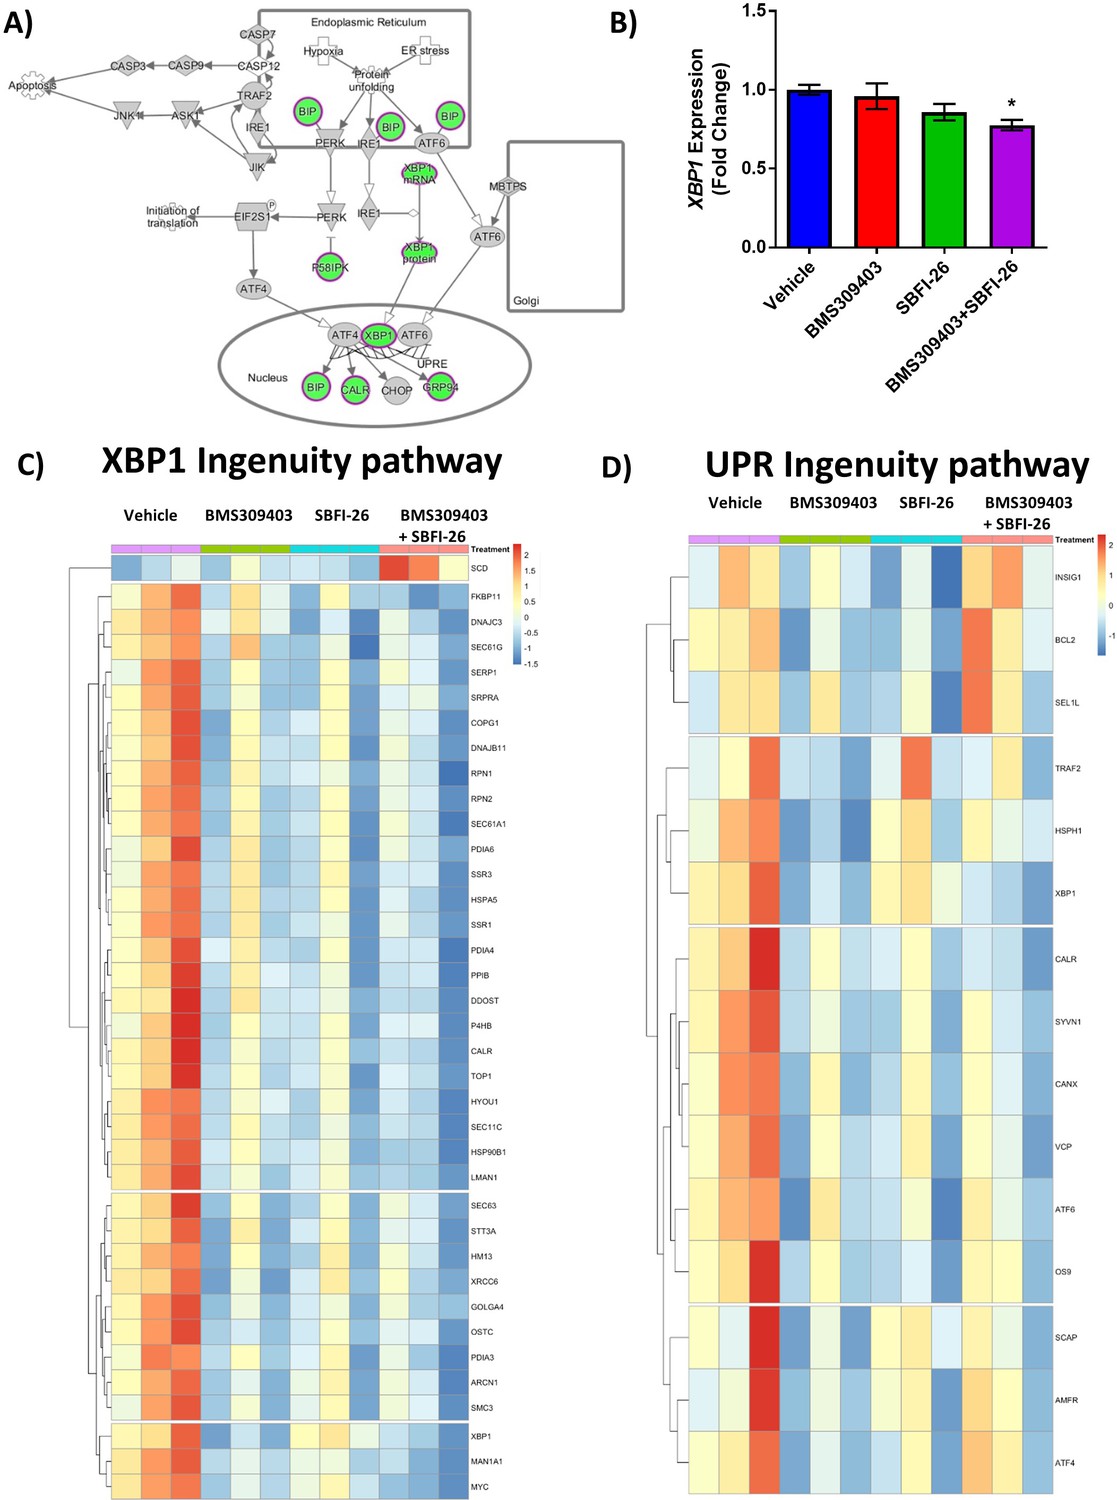
RNA sequencing analysis of GFP+/Luc+MM.1 S cells treated with FABP inhibitors reveals a unique gene expression suggesting endoplasmic reticulum stress.
(A) IPA ER Stress for Co-treatment vs. Vehicle, where green is decreased and grey is not changed. (B) Semi-quantitative RT-PCR assessment of total XBP1 transcripts in MM.1S cells after 24 hr treatments with BMS309403 (50 µM), SBFI-26 (50 µM) or the combination normalized to RPLP0 housekeeping gene. Data represent mean ± SEM from n=3 biological repeats, analyzed with one-way ANOVA with Dunnett’s multiple comparisons test; significance shown as *p<0.05. (C) Heatmap visualization of genes involved in XBP1 signaling (D) and the unfolded protein response (UPR) as determined by Ingenuity Pathway Analysis.
Figure 3 with 7 supplements
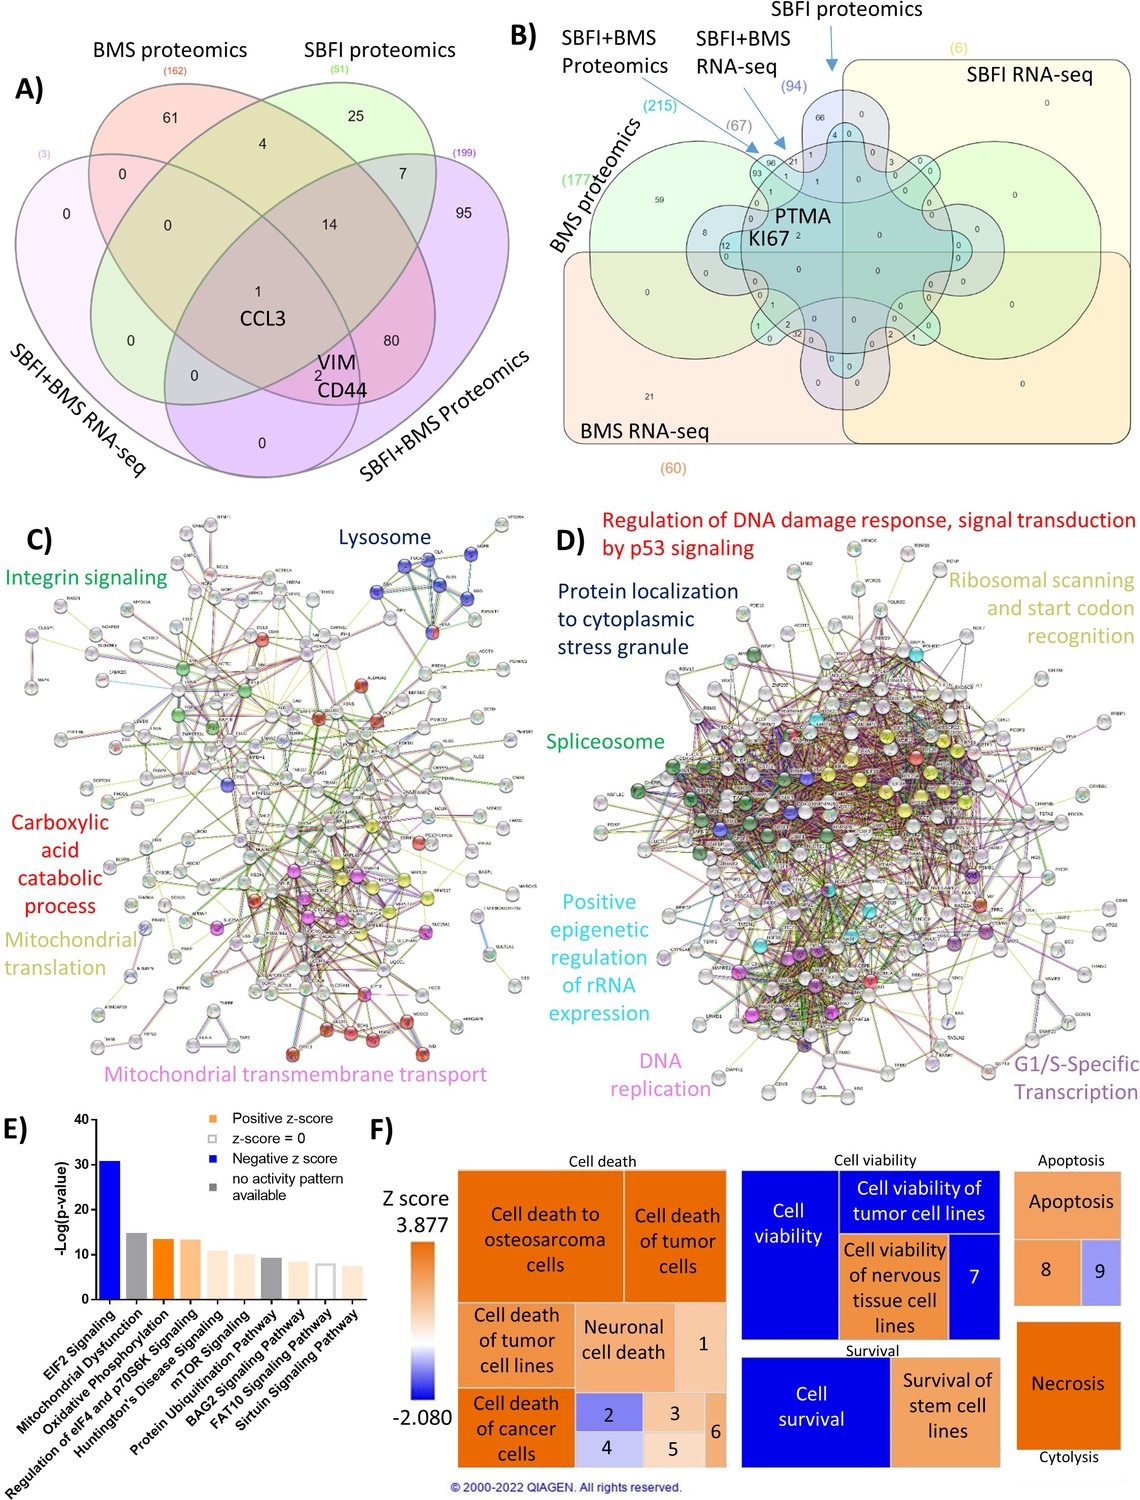
Forty-eight hr proteomic analysis of MM1S cells treated with FABPi reveals a unique protein signature.
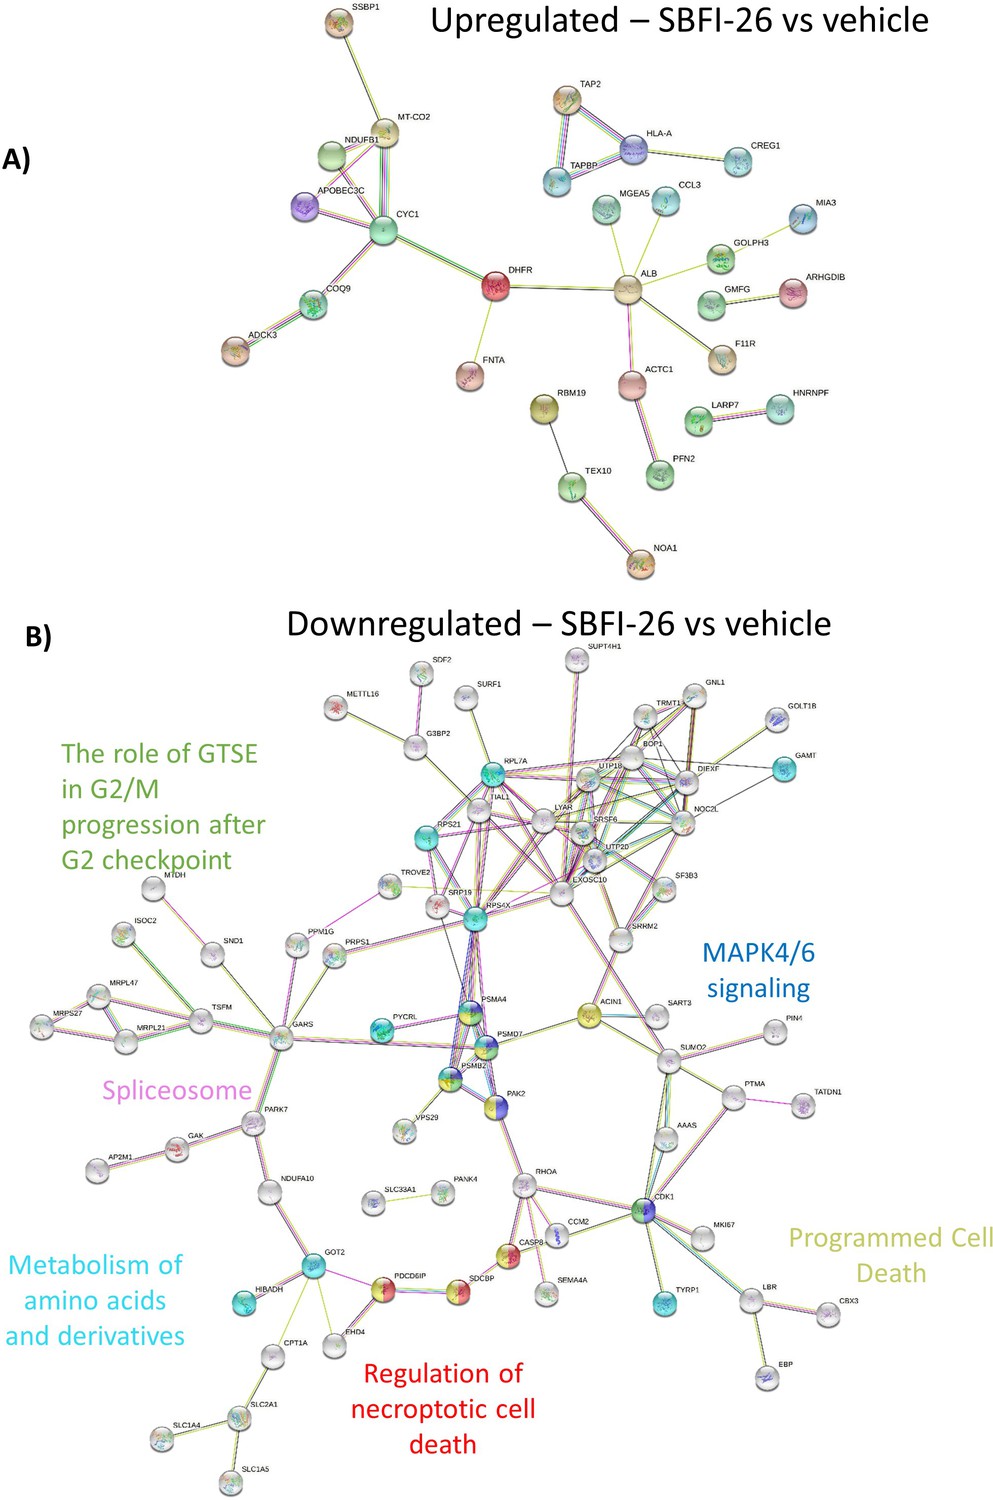
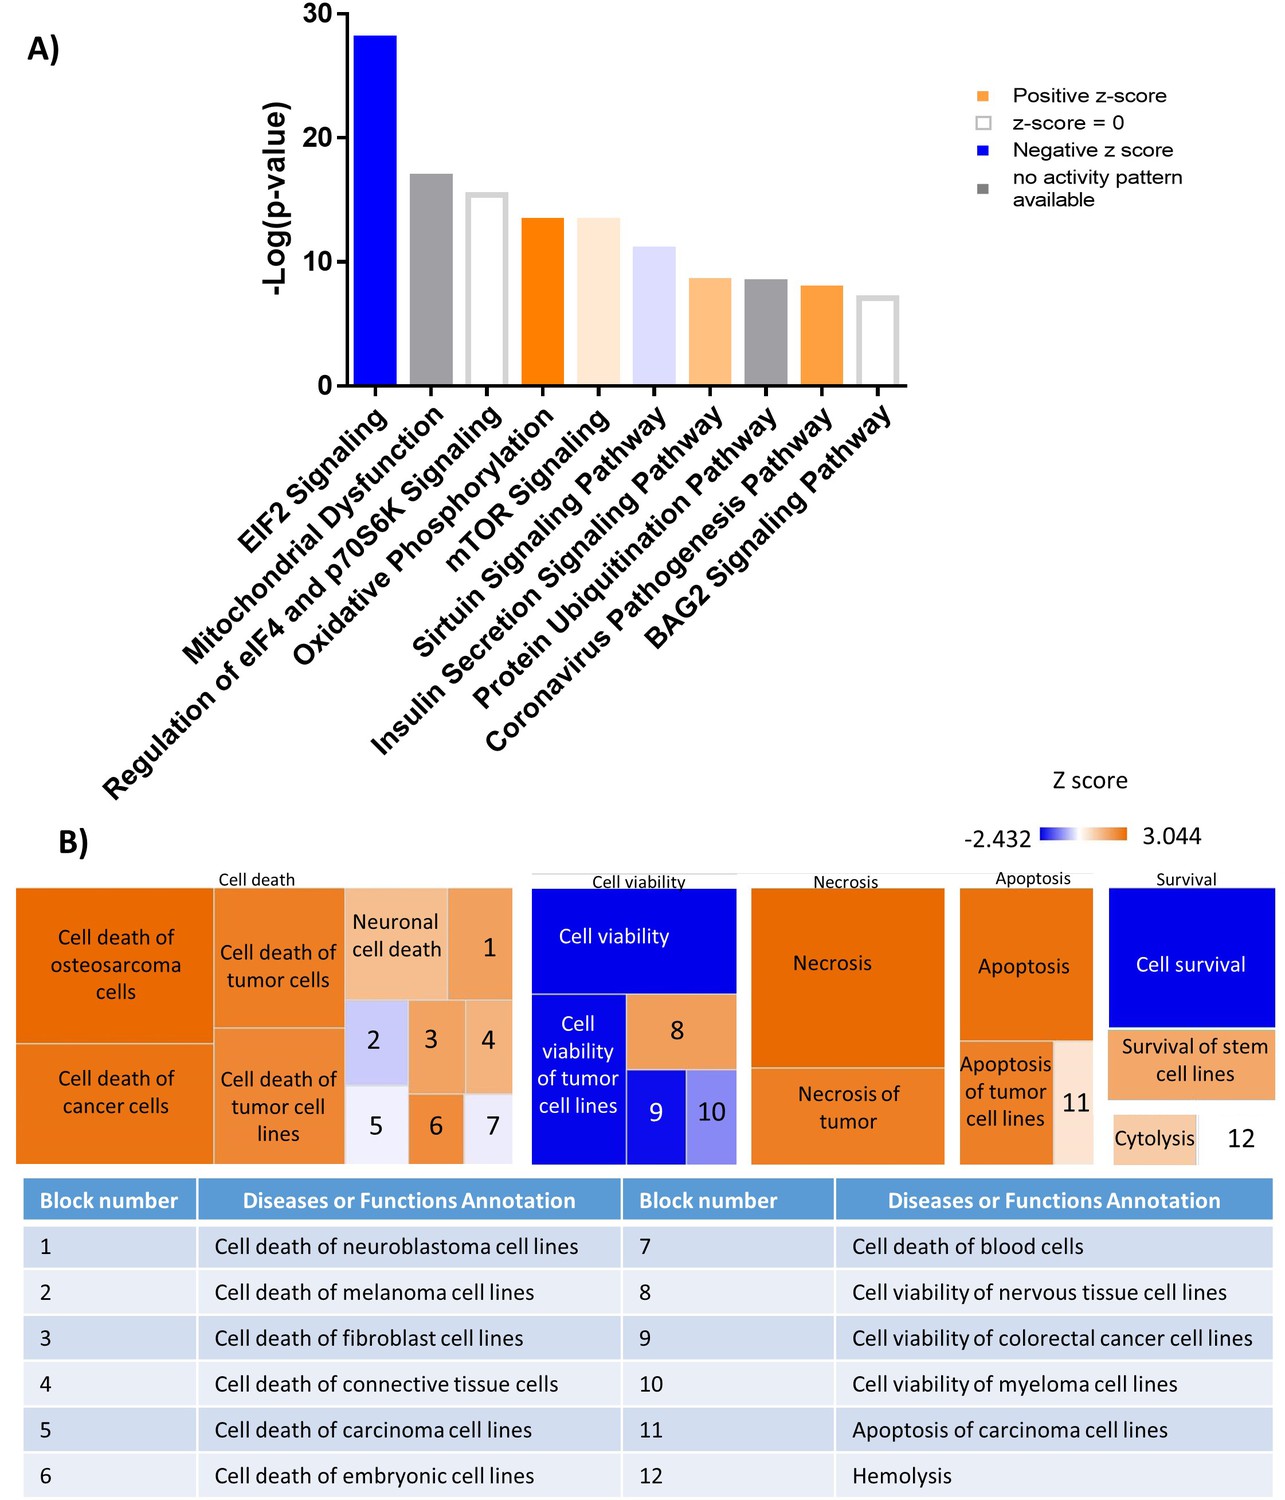
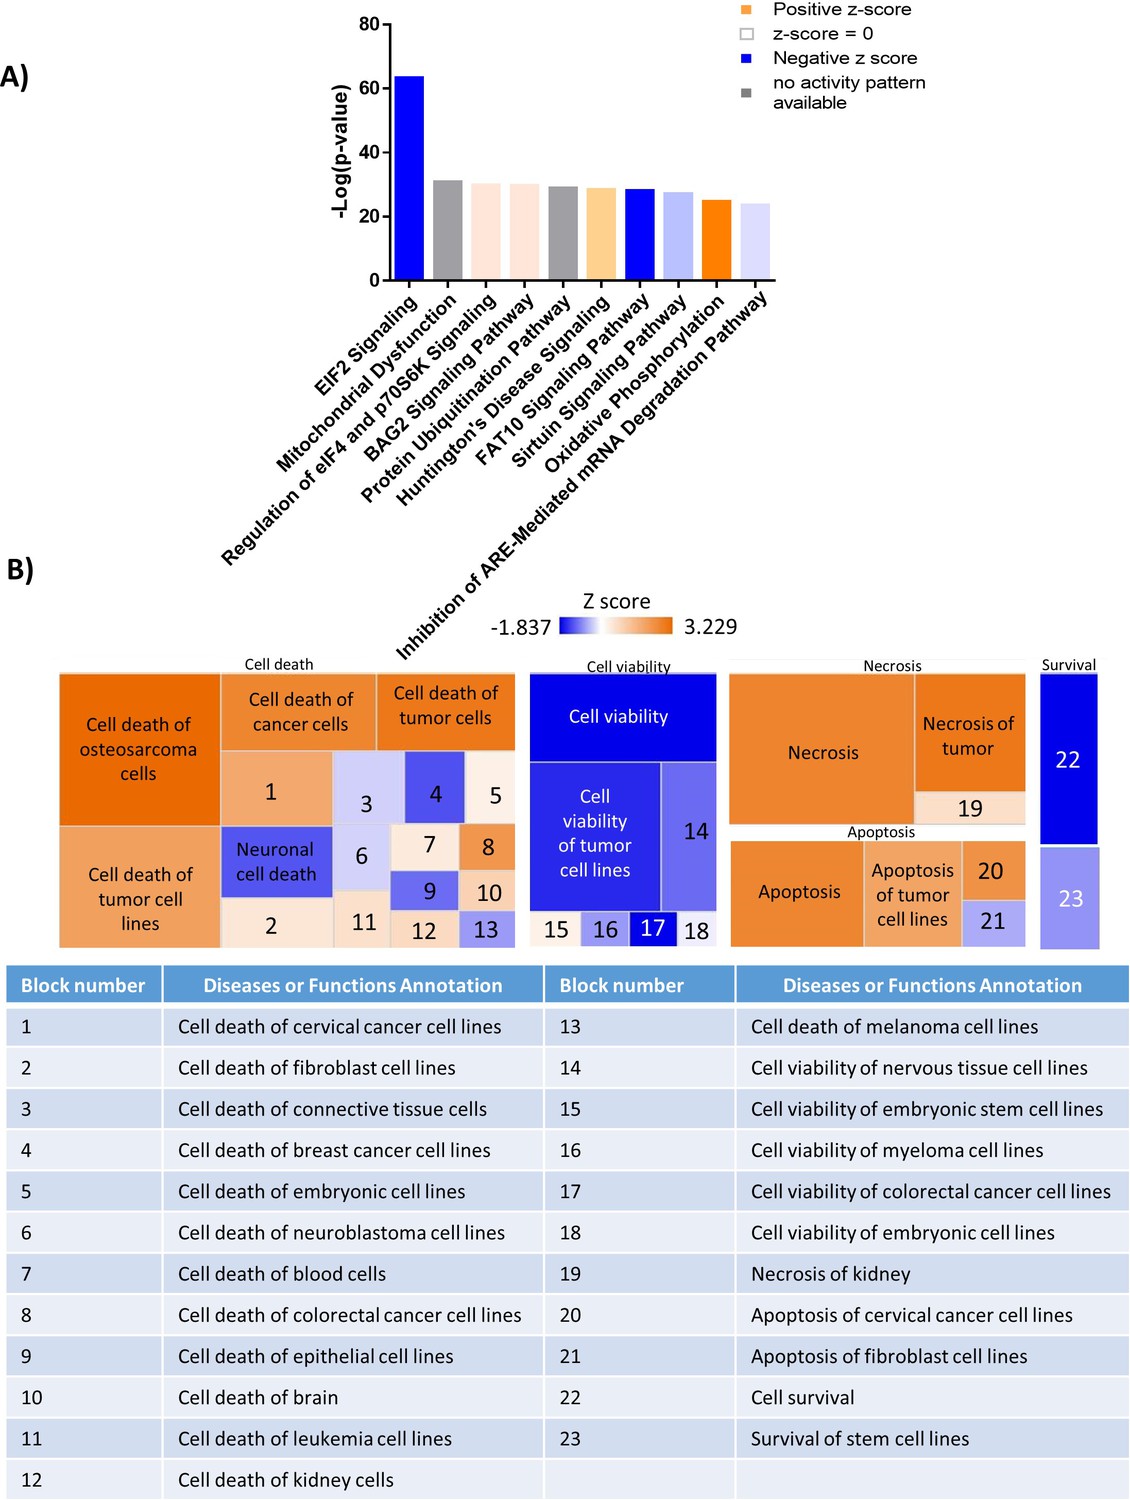
MM.1S cells were assessed by proteomics after 48 hr treatments with BMS309403 (50 µM), SBFI-26 (50 µM) or the combination, and compared to results from RNA-Seq. N=3 biological replicates and three technical replicates Venn diagram comparison of (A) upregulated genes and (B) downregulated proteins in proteomics and RNA-Seq among BMS309403 and SBFI-26 treated cells compared to vehicle. (C–F) Pathway analysis of proteomic data of significantly upregulated or downregulated proteins in MM.1S cells treated with both FABPi (BMS309403 +SBFI-26). (C, D) String analysis of upregulated (C) or downregulated (D) pathways. (E) Top 10 significantly changed pathways with FABP inhibition. For IPA analysis, orange represents positive z-score, blue indicates a negative z-score, gray represents no activity pattern detected and white represents a z-score of 0. (F) Ingenuity pathway analysis of the Cell Death and Survival heatmap. Numbers in boxes represent: (1) Cell death of melanoma lines; (2) Cell death of carcinoma cell lines; (3) Cell death of neuroblastoma cell lines; (4) Cell death of breast cancer cell lines; (5) Cell death of connective tissue cells; (6) Cell death of fibroblast cell lines; (7) Cell viability of myeloma cell lines; (8) Apoptosis of tumor cell lines; (9) Apoptosis of carcinoma cell lines. GFP+/Luc +MM.1 S cells were used for these experiments. Please see 7 supplements to Figure 3.
Figure 3—figure supplement 1
Mass spectrometry analysis revealed 48 hr treatment with FABP inhibitors induces a significant change in proteomic profile.
(A) Principal Component Analysis (PCA) of proteomics data in GFP+/Luc+MM.1S cells after 48 hr treatments with BMS309403 (50 µM), SBFI-26 (50 µM) or the combination, using Pareto Scaling. Shading of color indicates groupings of technical repeats within biological repeats. (B) Venn diagrams of upregulated and (C) downregulated proteins after treatment with FABPi. Data represents three biological replicates, with a significance cut off of p≤0.05 and a fold change of ±1.2. GFP+/Luc +MM.1 S used for these experiments.
Figure 3—figure supplement 2
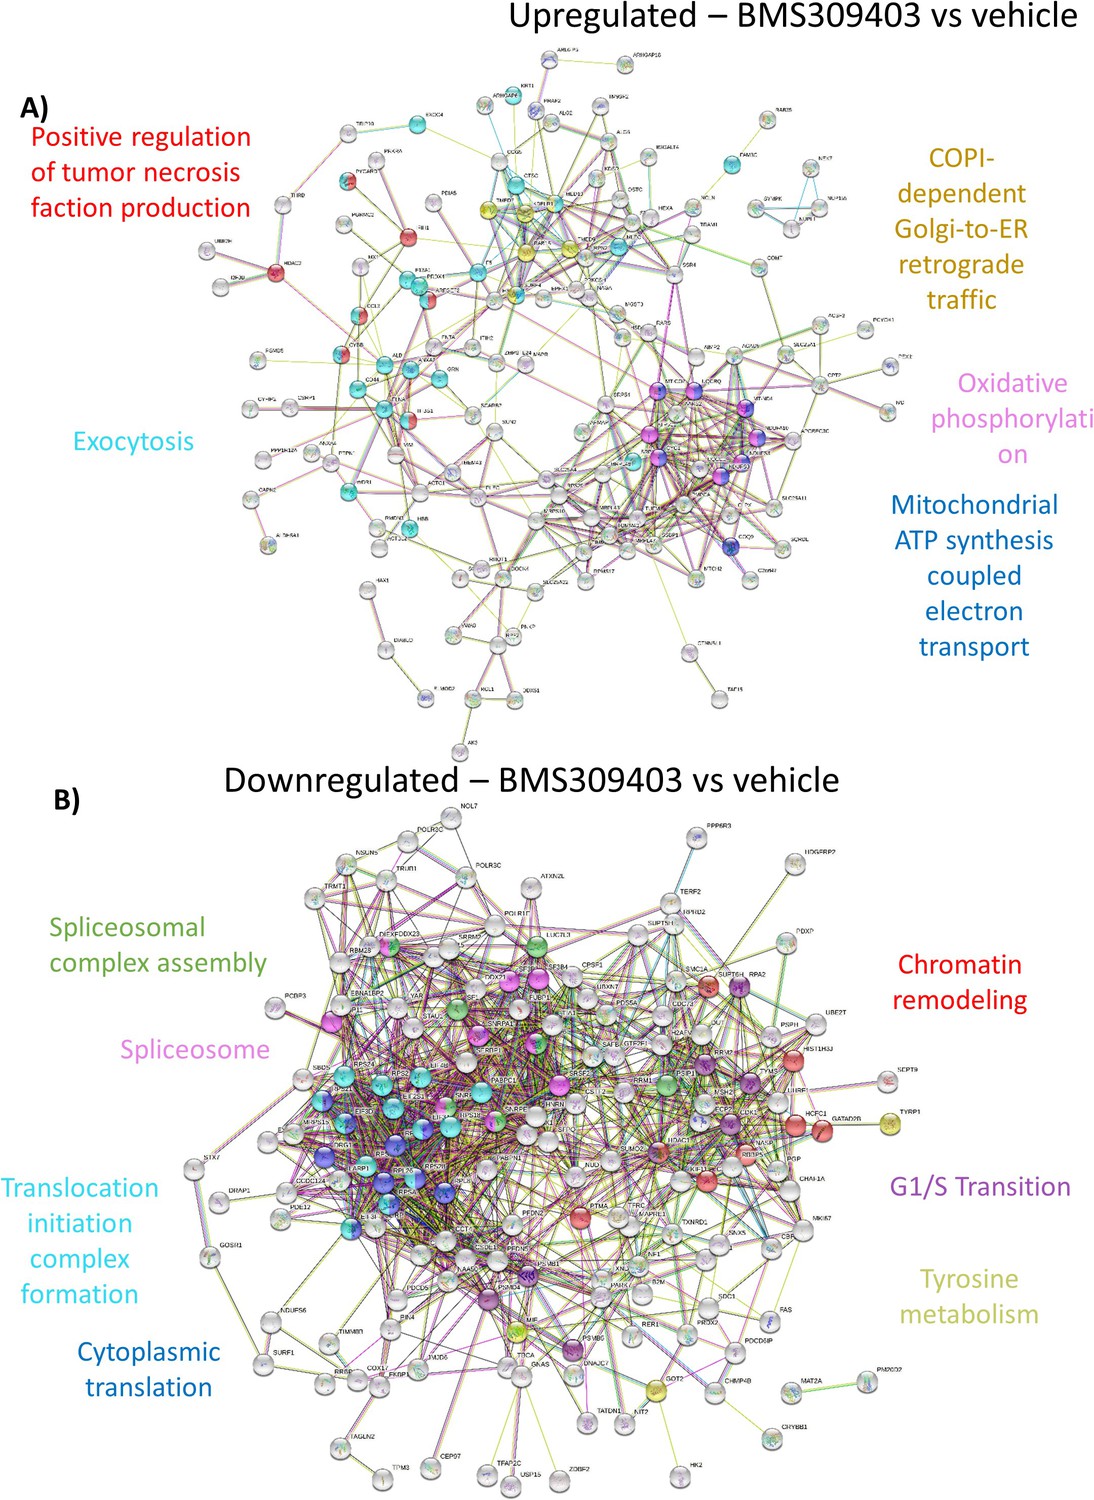
Mass spectrometry analysis reveals a shift in the proteomic profile of GFP+/Luc+ MM.1 S cells treated with BMS309403 for 48 hours: STRING analysis.
(A) String db visualization of significantly upregulated and (B) downregulated proteins with FABP inhibition. Color nodes represent the pathways implicated with treatment.
Figure 3—figure supplement 3
Mass spectrometry analysis reveals a shift in the proteomic profile GFP+/Luc+ MM.1 S cells treated with SBFI-26 for 48 hr: STRING Analysis.
(A) String db visualization of significantly upregulated and (B) downregulated proteins with FABP inhibition. Color nodes represent the pathways implicated with treatment.
Figure 3—figure supplement 4
Mass spectrometry analysis reveals a shift in the proteomic profile of GFP+/Luc+ MM.1 S cells treated with BMS309403 for 48 hr: IPA analysis.
(A) Top 10 significantly changed pathways with FABP inhibition. For IPA analysis, orange represents positive z-score, blue indicates a negative z-score, gray represents no activity pattern detected and white represents a z-score of 0. (B) Ingenuity pathway analysis revealed up- and downregulated pathways that correspond to the Cell Death and Survival heatmap. Z-score scale spans –2.432–3.044.
Figure 3—figure supplement 5
Mass spectrometry analysis reveals a shift in the proteomic profile of GFP+/Luc+ MM.1 S cells treated with SBFI-26 for 48 hr: IPA Analysis.
(A) Top 10 significantly changed pathways with FABP inhibition. For IPA analysis, orange represents positive z-score, blue indicates a negative z-score, gray represents no activity pattern detected and white represents a z-score of 0. (B) Ingenuity pathway analysis revealed up- and downregulated pathways that correspond to the Cell Death and Survival heatmap. Z-score scale spans –1.837–3.229.
Figure 3—figure supplement 6
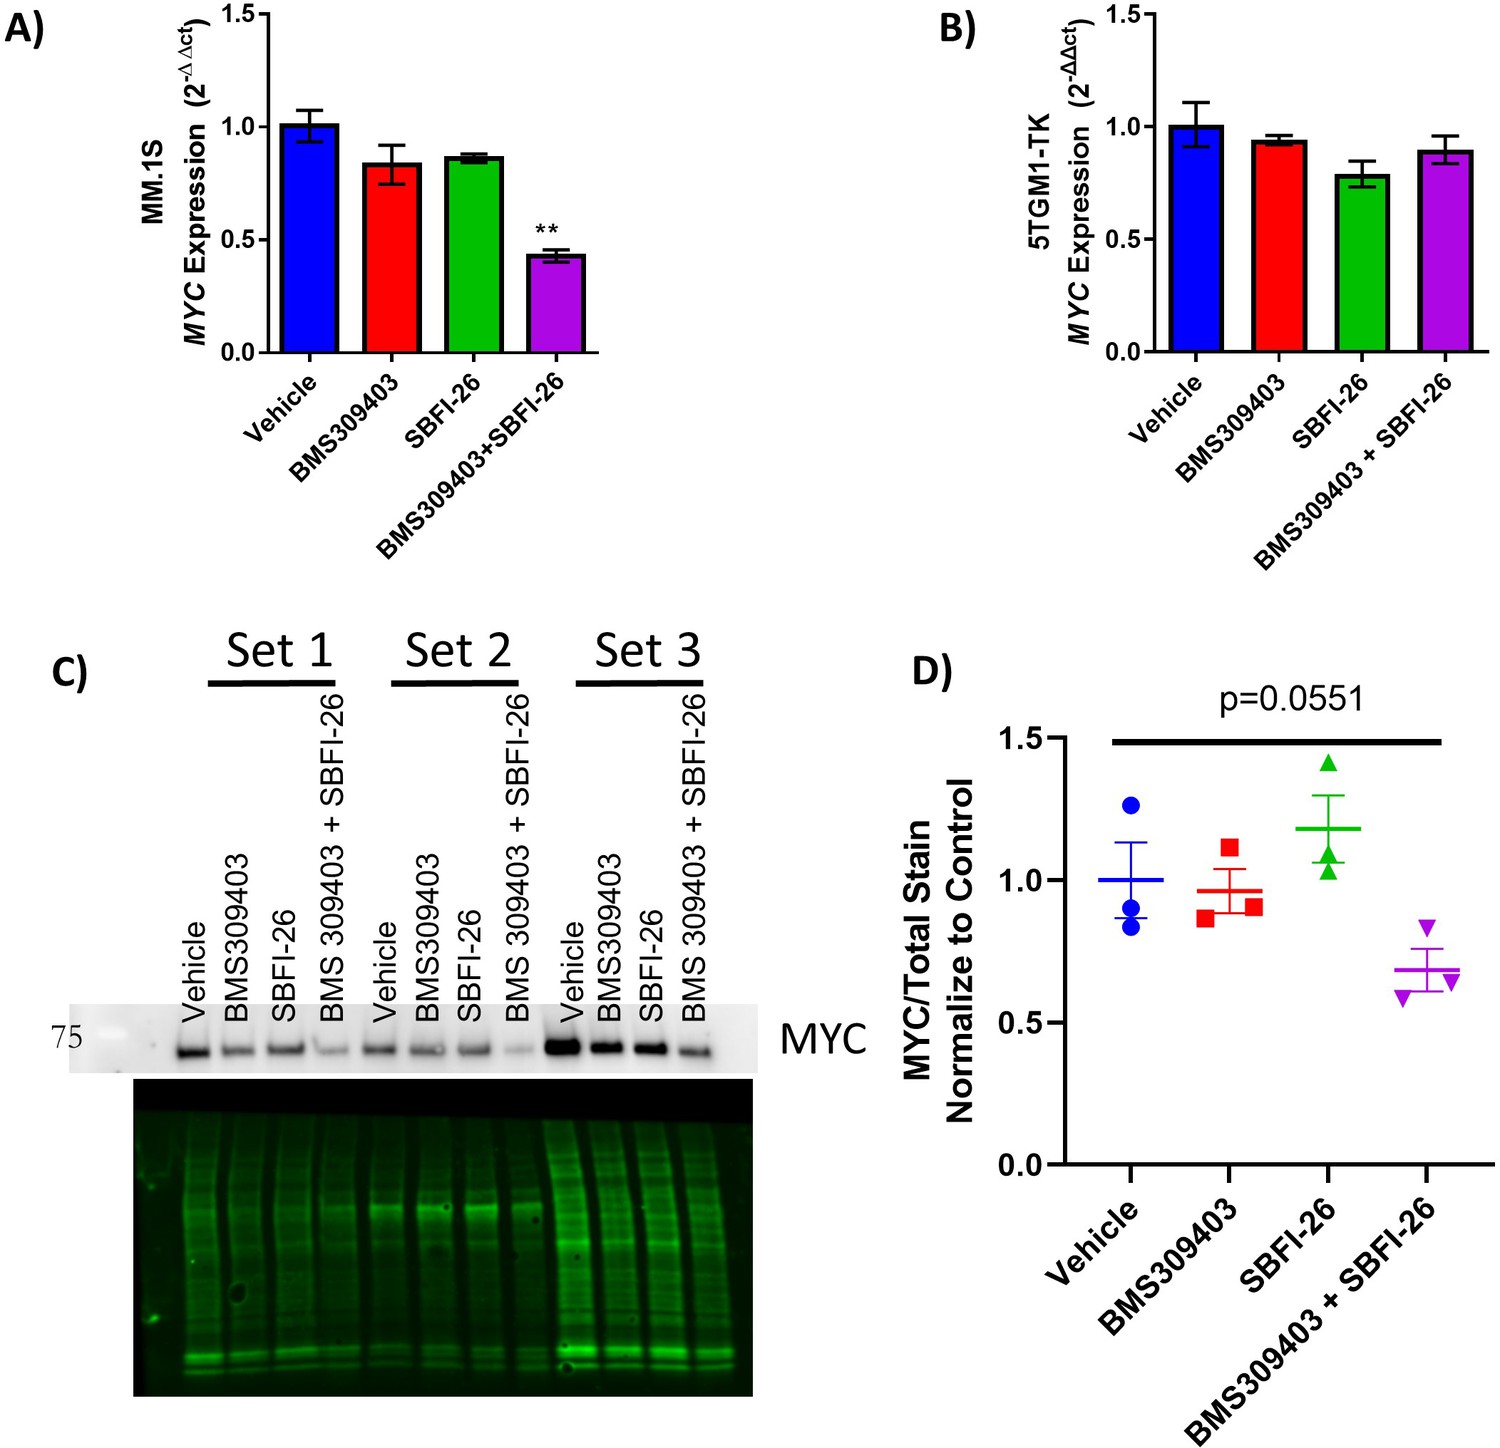
FABP inhibitor treatment alters expression of MYC gene and MYC protein expression and MYC-regulated genes.
(A) qRT-PCR of MYC in GFP+/Luc +MM.1 S and (B) 5TGM1-TK cells after 24 hr treatments with BMS309403 (50 µM), SBFI-26 (50 µM) or the combination normalized to RPLP0 housekeeping gene. (C) Western blot MYC protein (top) in 5TGM1-TK murine myeloma cells from three separate experiments and total protein loaded (bottom) with quantification (D) relative to vehicle control (n=3 biological replicates). Data are plotted as mean ± SEM and analyzed with one-way ANOVA, **p<0.01.
Figure 3—figure supplement 7
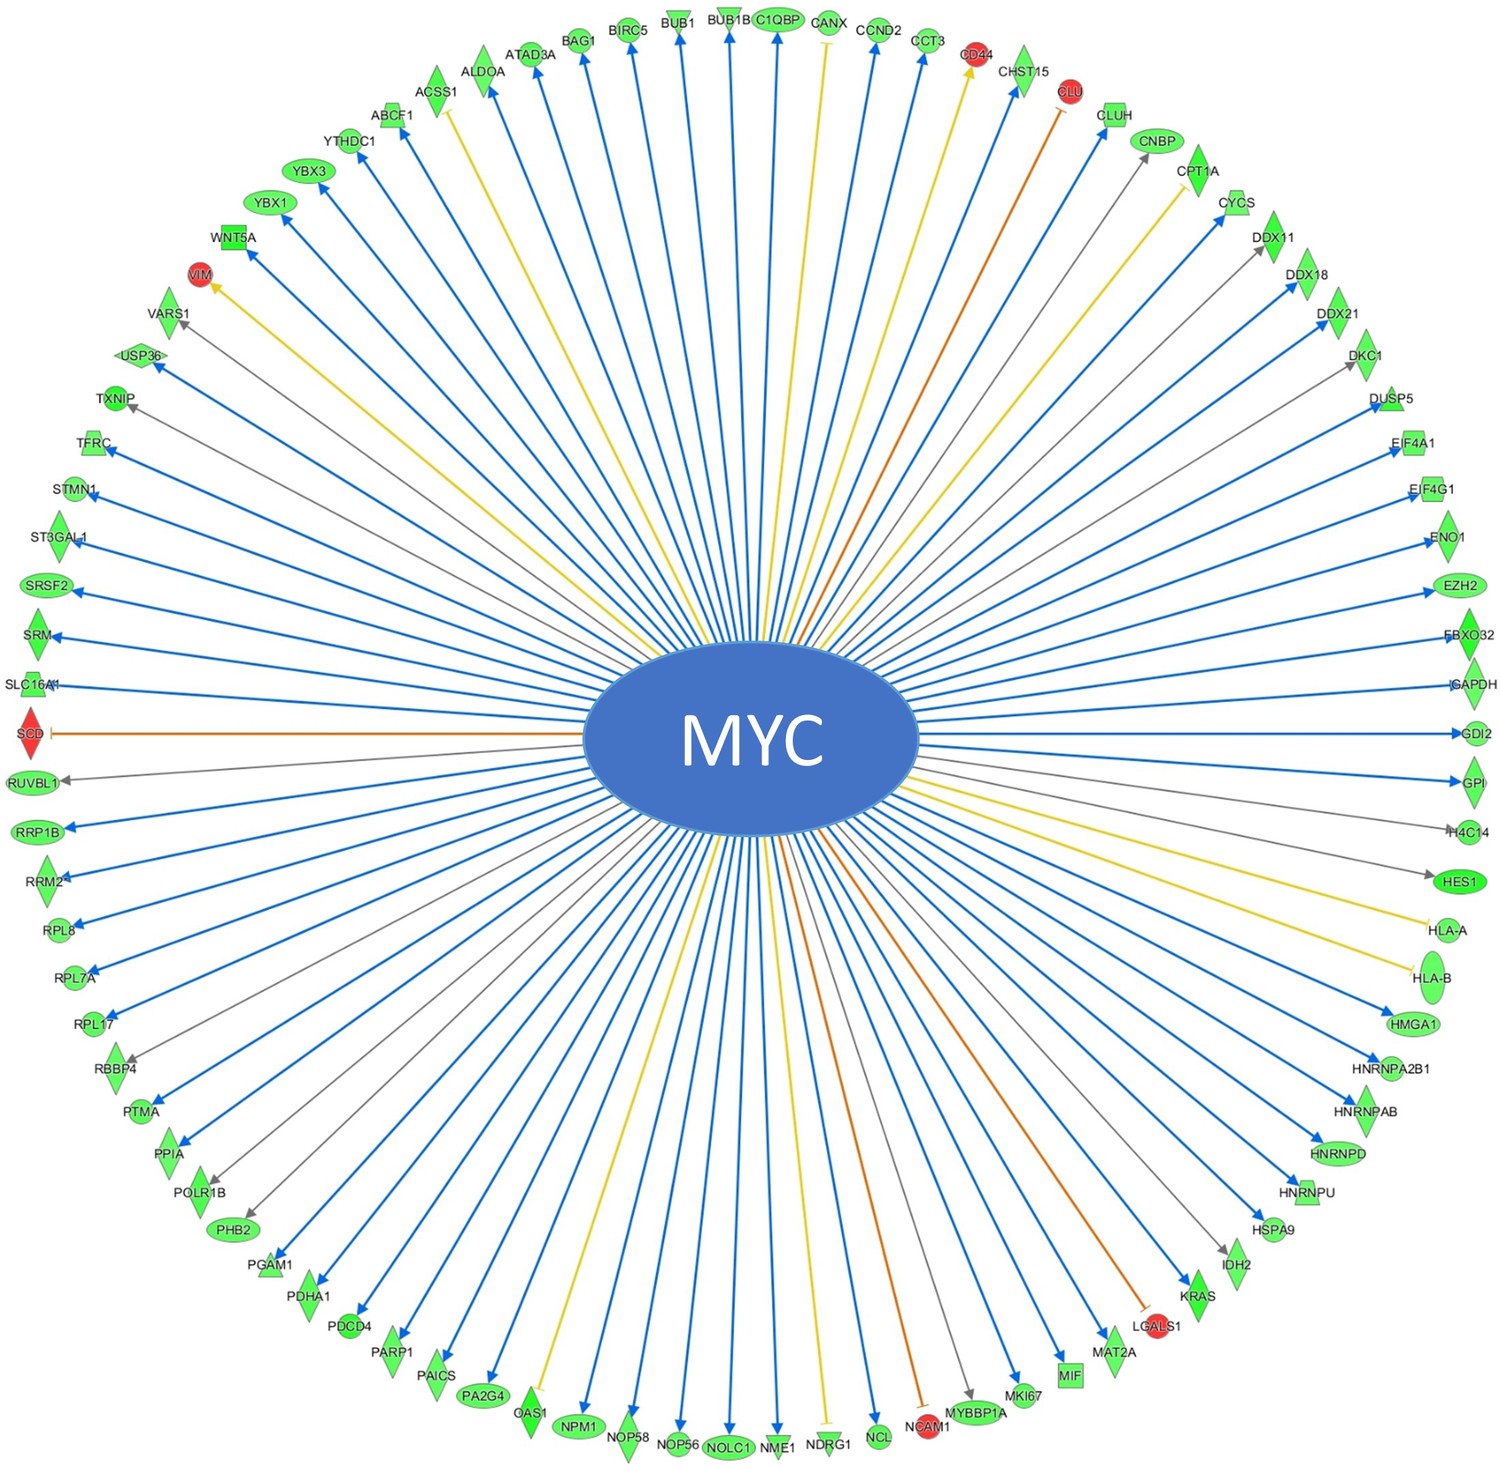
Co-treatment with BMS309403 and SBFI-26 induced changes in 91 genes modulated by MYC in GFP+/Luc+ MM.1 S cells based on RNA-seq data.
Arrows indicate expression consistency with predicted patterns (blue = consistent, yellow = unknown, orange = inconsistent); color of molecules indicates expression pattern (green = decreased in co-treatment, red = increased in co-treatment).
Figure 4 with 1 supplement
FABPi target MYC and the MYC pathway.
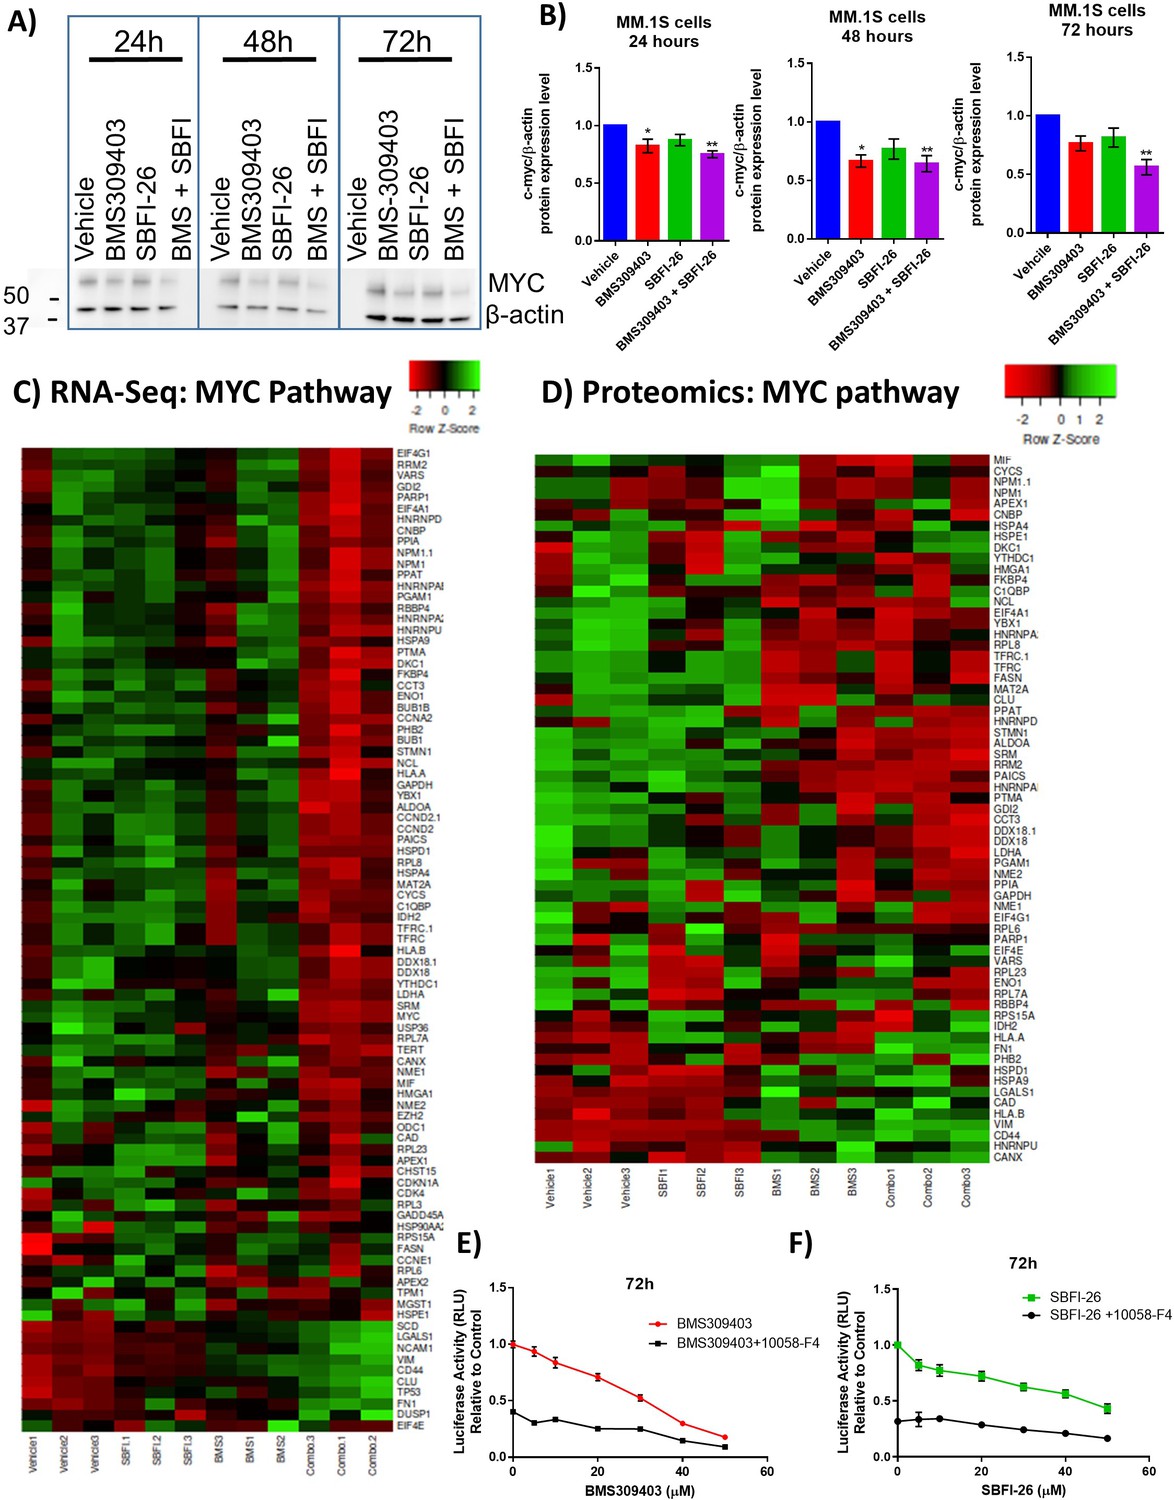
(A) Representative western blot and (B) quantification of MYC protein and β-actin (housekeeping control) at 24, 48, and 72 hr after treatment with BMS309403 (50 µM), SBFI-26 (50 µM), or the combination. (C) RNA-seq and (D) Proteomic analysis of expression of genes/proteins involved in MYC signaling shown as heatmap visualizations. Curated lists are based on IPA MYC Pathway list, known MYC-regulated genes, and proteins present in proteomics. (E) 72 hr BMS309403 dose curve with and without Myc inhibitor 10058-F4 (37.5 µM) in MM.1S cells. (F) 72 hr SBFI-26 dose curve with and without 10058-F4 (37.5 µM) in MM.1S cells. Data represent mean ± SEM from n=3 biological repeats, analyzed with one-way ANOVA with significance shown as *p<0.05. **p<0.01. ****p<0.0001. GFP+/Luc +MM.1 S cells were used for these experiments. Please see 1 supplement to Figure 4.
Figure 4—figure supplement 1
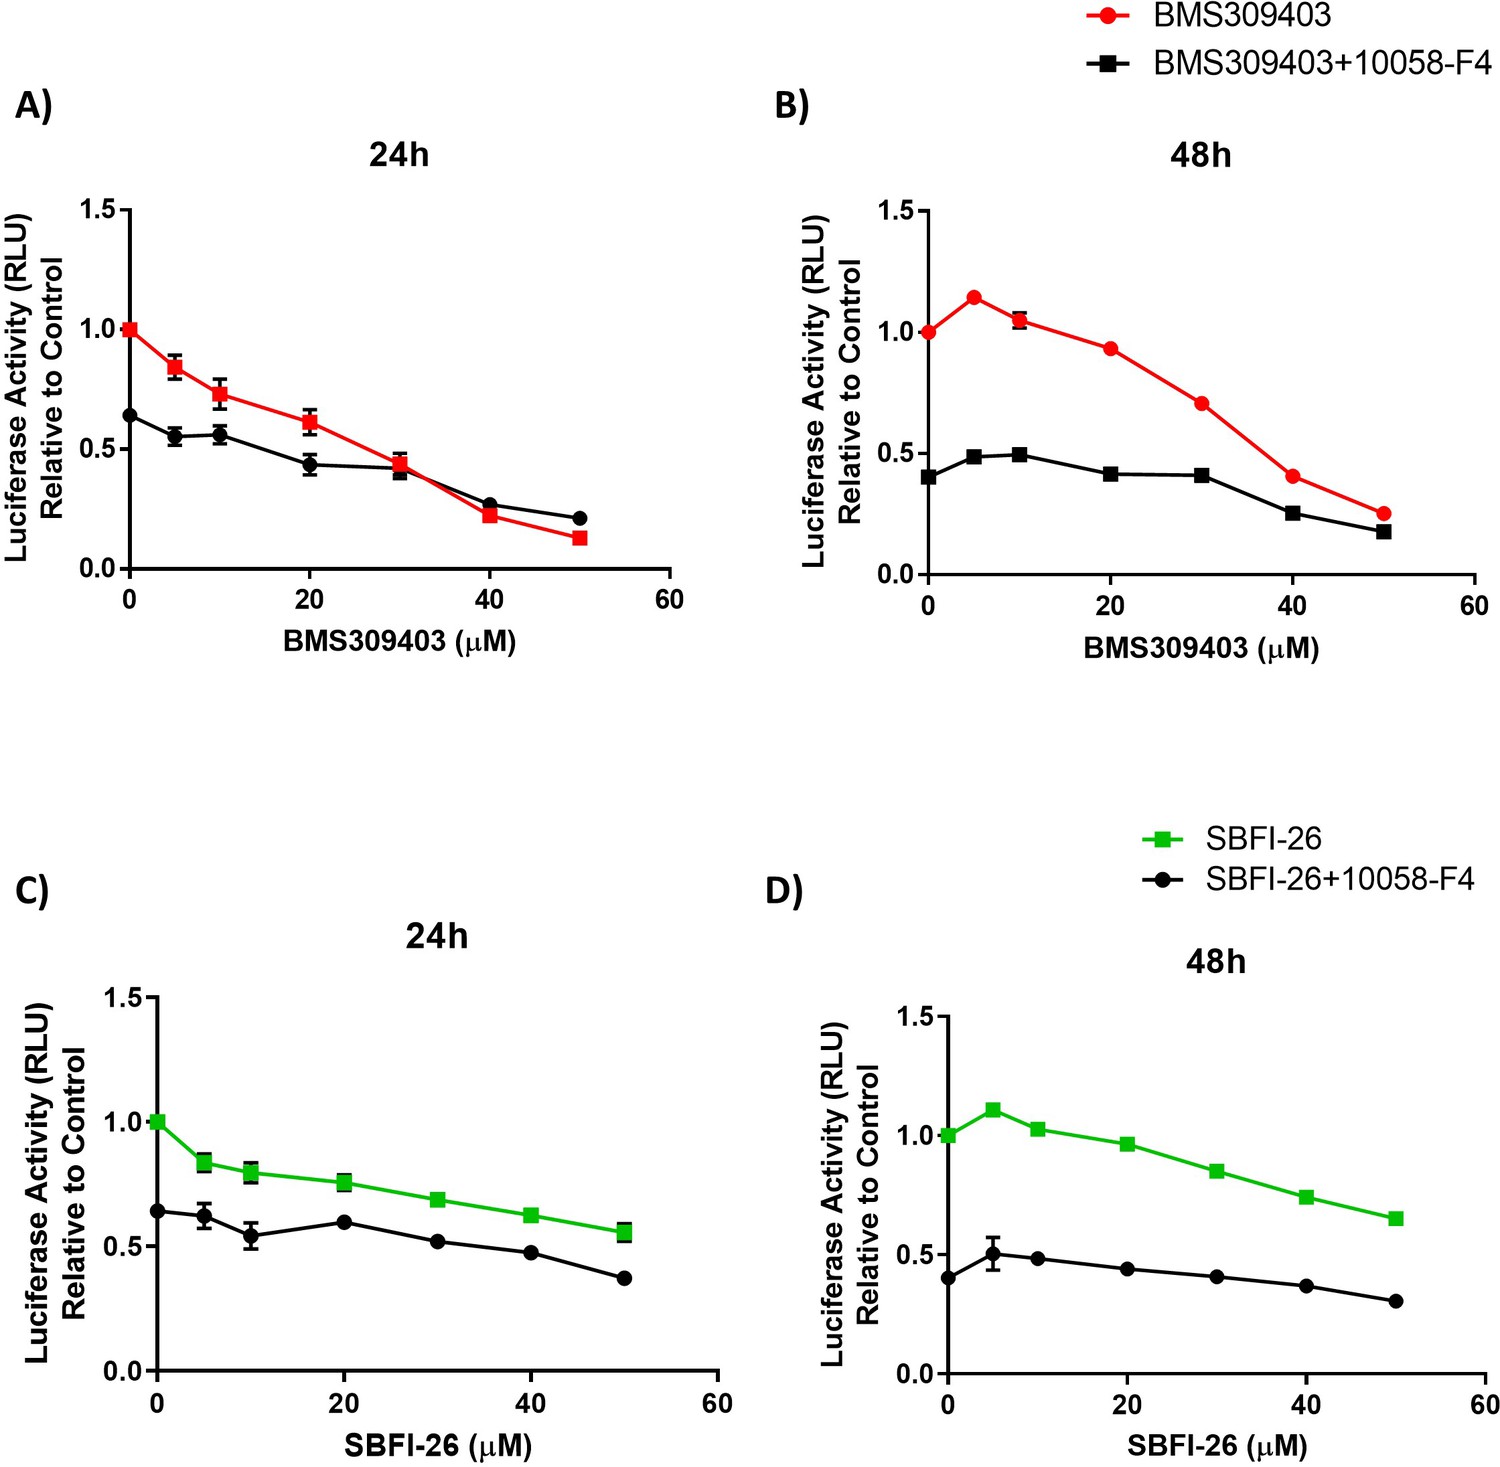
FABP inhibitors do not synergize with MYC inhibitor, 10058-F4, in GFP+/Luc+ MM.1 S cells at 24 and 48 hr.
(A) 24 or (B) 48 hr dose curve of BMS309403 or (C–D) SBFI-26 in combination with 37.5 µM 10058-F4. Data is plotted as mean ± SEM and analyzed with one-way ANOVA, **p<0.01, n=3.
Figure 5 with 10 supplements
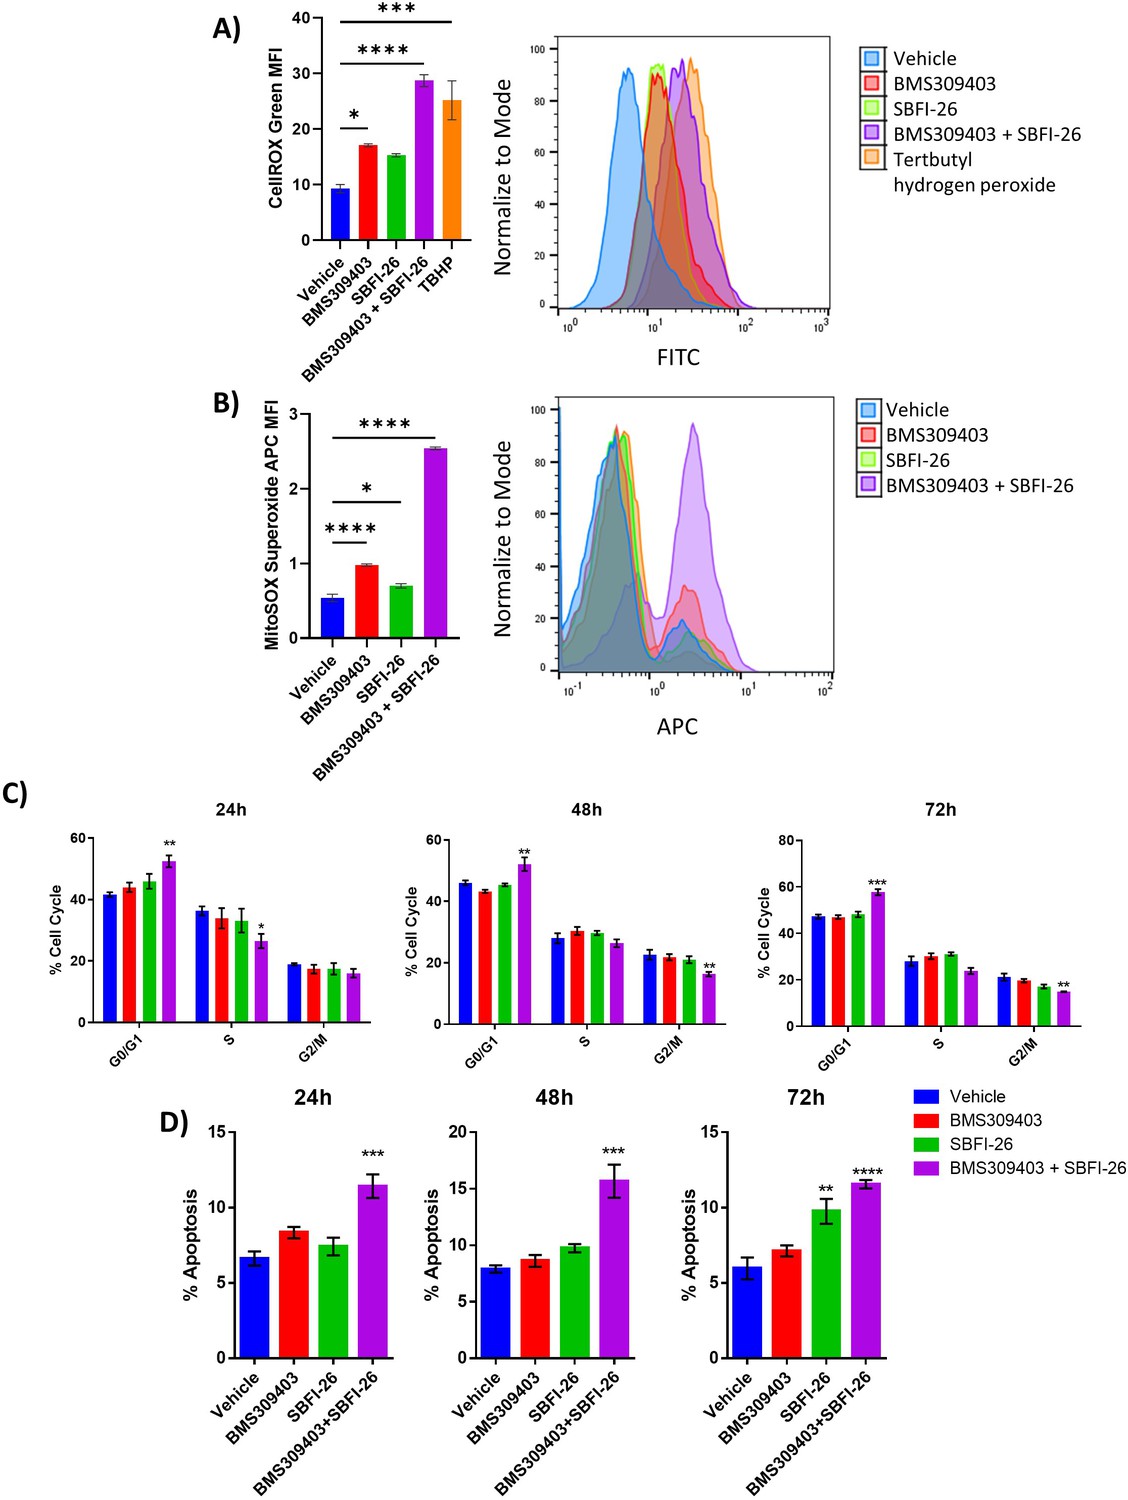
FABPi significantly induce reactive oxygen species, impair MM cell growth and induce apoptosis.
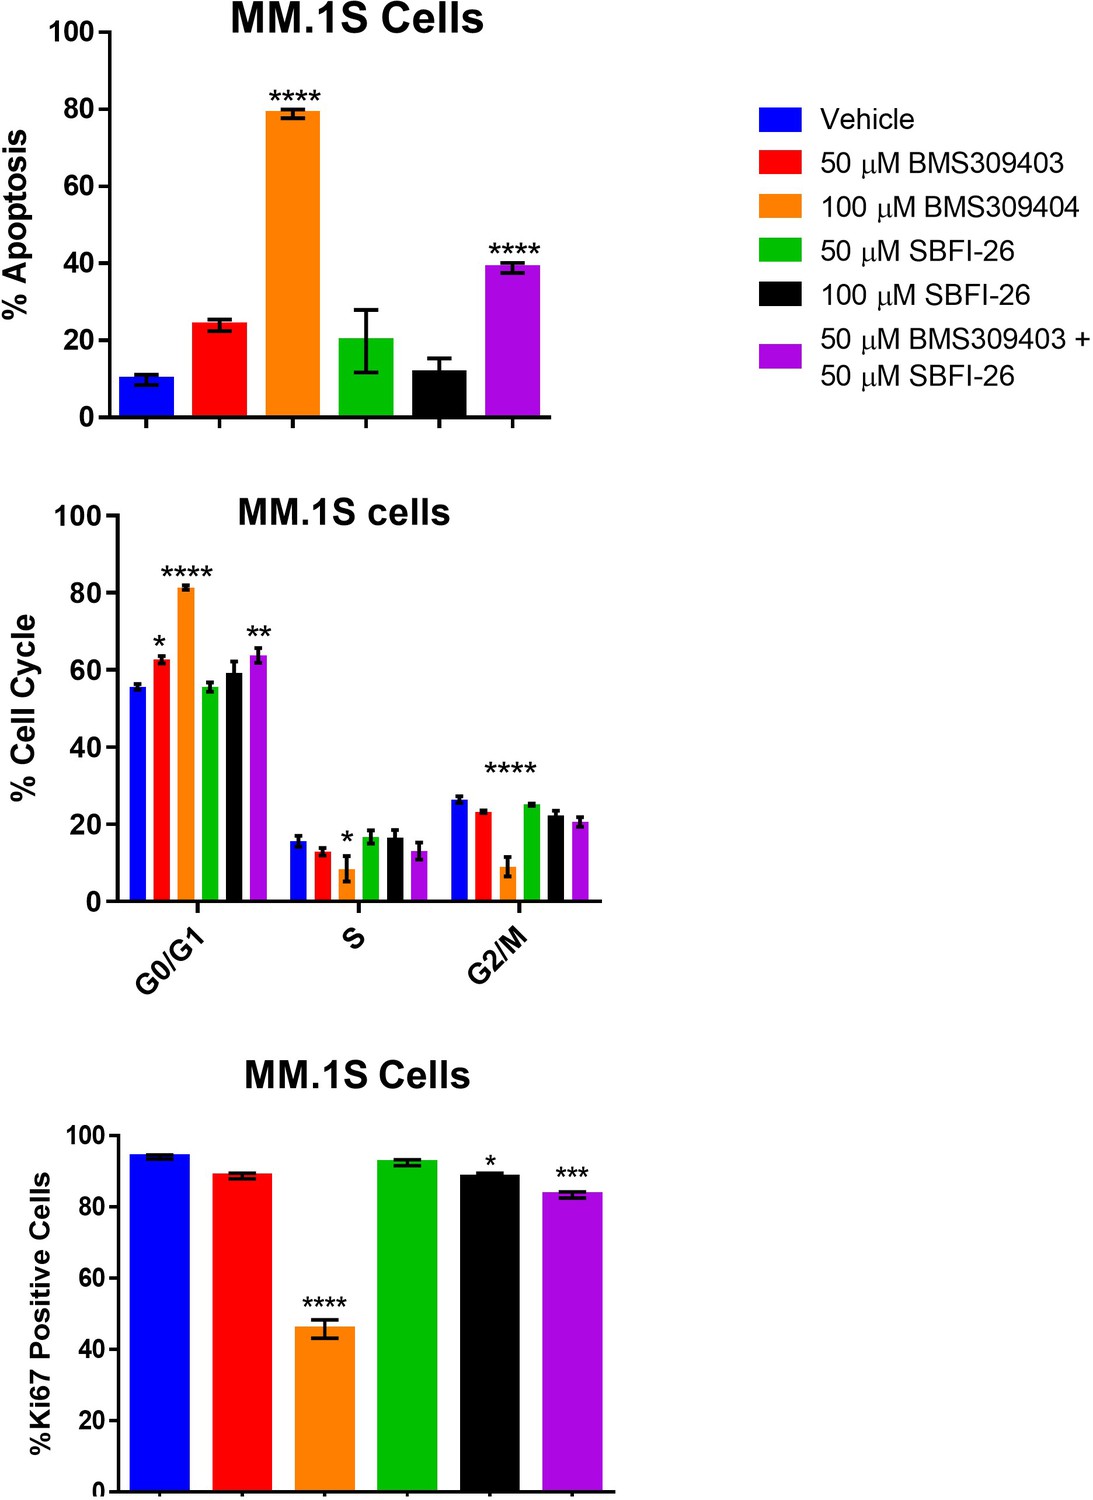
(A) Reactive oxygen species measured by MFI (mean fluorescent intensity) with CellROX Green staining at 72 hr in MM.1S cells. TBHP is positive control. (B) Superoxide levels shown as MFI, determined with MitoSOX staining, at 72 hr in MM.1S cells. (C) MM.1S cell cycle states with the FABPi alone (50 µM) or in combination (50 µM of each). (D) Apoptosis in MM.1S cells with FABPi as in C. Data are mean ± SEM unless otherwise stated and represent averages or representative runs of at least three experimental repeats. One-way ANOVA with Dunnett’s multiple comparison test significance shown as *p<0.05. **p<0.01. ***p<0.001. ****p<0.0001. ATCC MM.1S cells were used for these experiments. Please see 10 supplements to Figure 5.
Figure 5—figure supplement 1
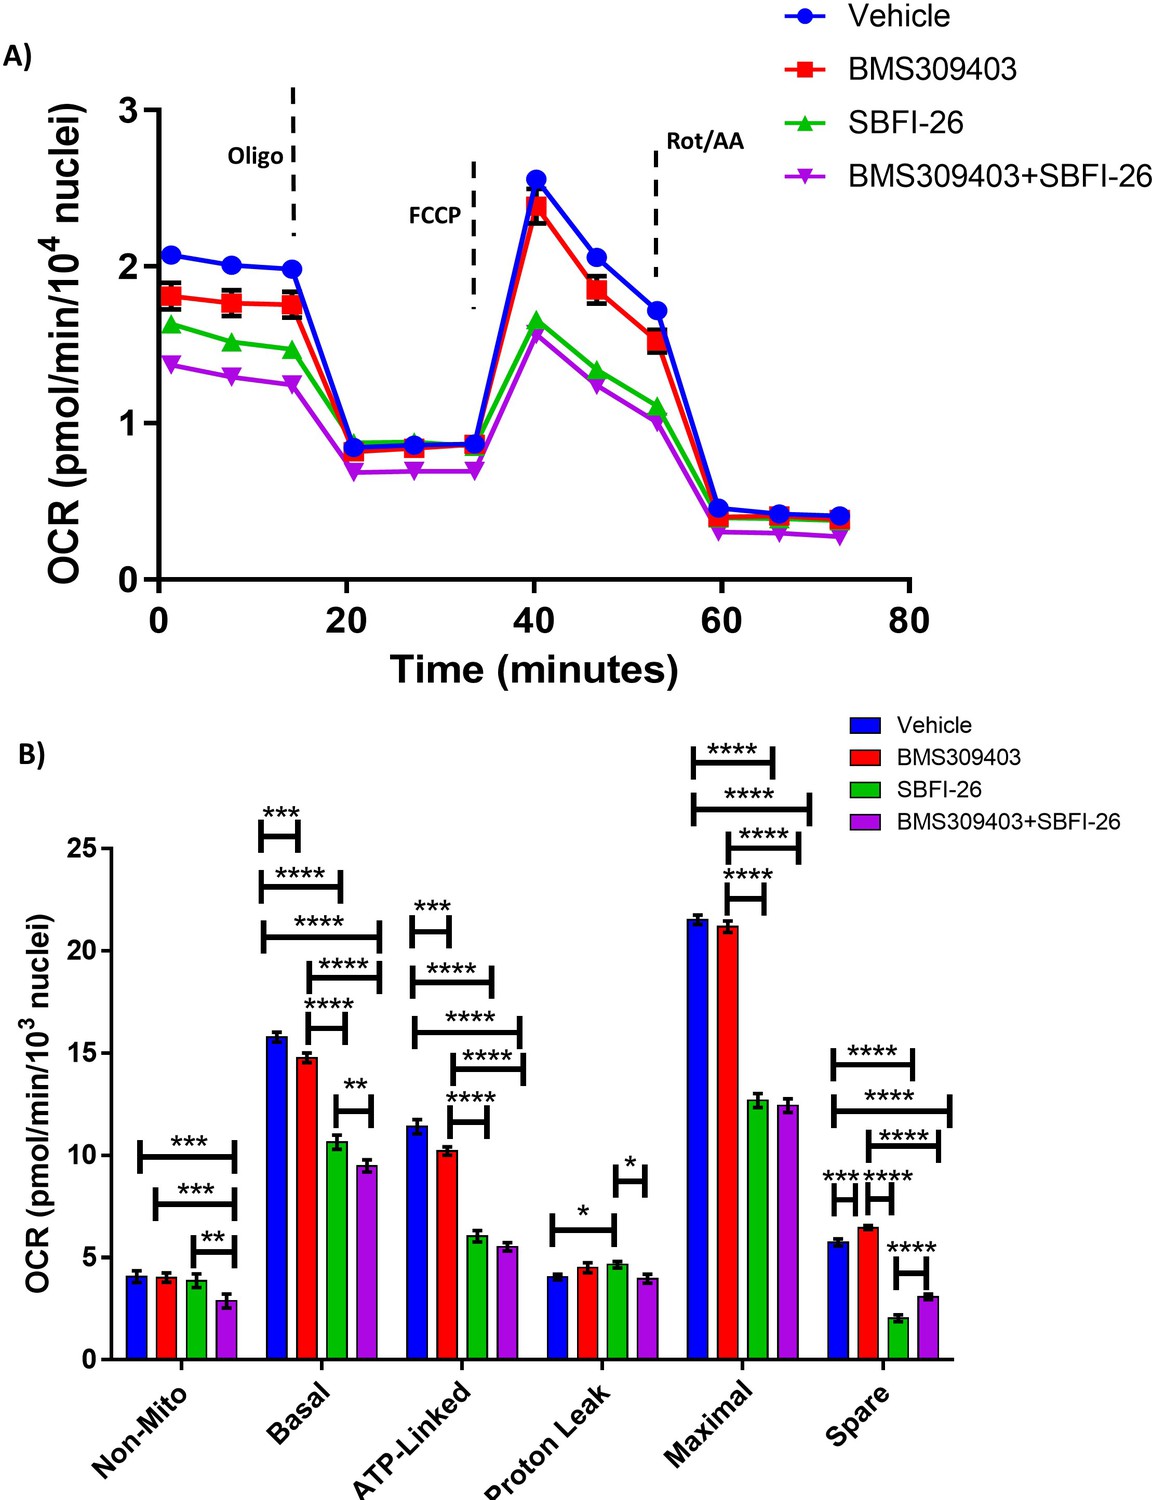
FABP blockade reduces cell metabolism: (A, B) GFP+/Luc+MM.1S cells were cultured for 24 hr with BMS309403 (50 µM), SBFI-26 (50 µM), or both and then plated for Seahorse XF96 analysis in 96-well format.
Oxygen consumption in cells was measured in basal conditions and in response to oligomycin (1.25 µM), FCCP (1 µM), and rotenone and antimycin A (.5 µM). Results represent five independent experiments with 1 representative experiment shown. Data represent Mean ± SEM; two-way ANOVA was used for each parameter with Uncorrected Fisher’s LSD multiple comparison post-hoc testing for significance shown as: *p<0.05, **, p<0.01, ***p<0.005, ****p<0.001. ns = non-significant.
Figure 5—figure supplement 2
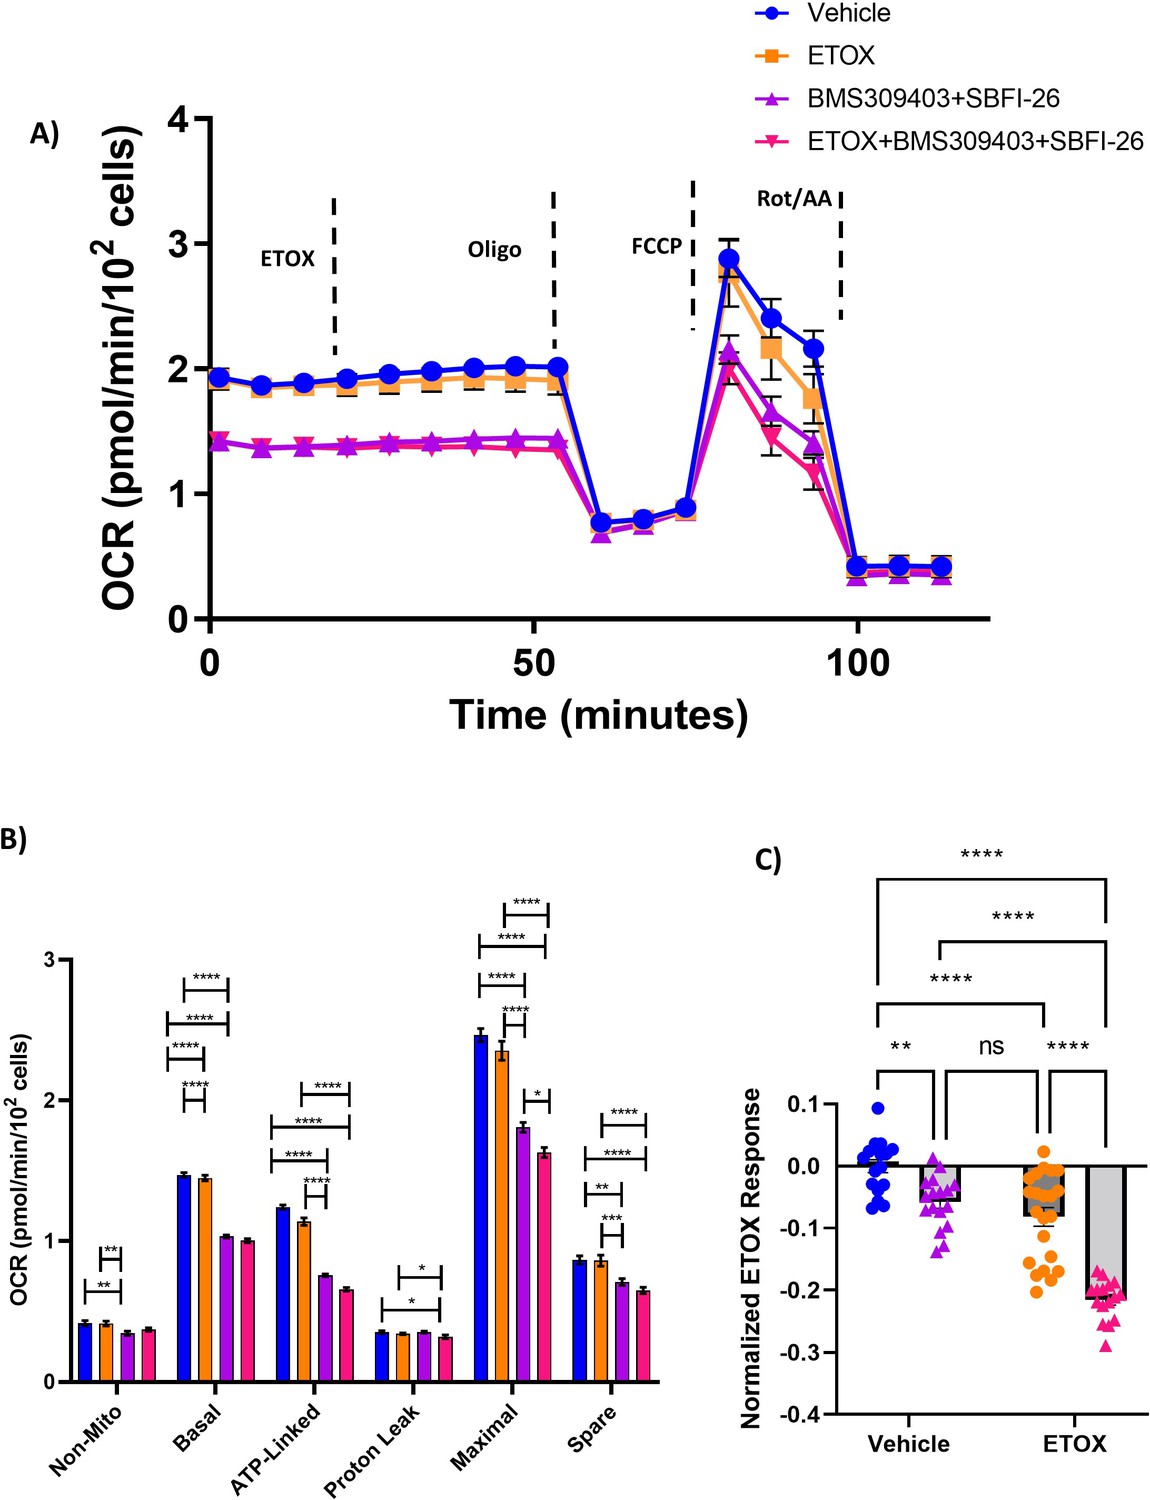
FABP blockade reduces fatty acid oxidation: (A,B) GFP+/Luc+MM.1S cells were cultured for 24 hr with BMS309403 (50 µM) plus SBFI-26 (50 µM) and then plated for Seahorse XF96 analysis in 96-well format.
Oxygen consumption in cells was measured in basal conditions and in response to oligomycin (1.25 µM), FCCP (1 µM), and rotenone and antimycin A (.5 µM). Etomoxir or vehicle were added at the time point indicated at a final concentration of 4 µM prior to subjecting the cells to the mitochondrial stress test. (C) ETOX response data normalized to MM.1S Vehicle control cells. Data represent Mean ± SEM; two-way ANOVA was used for each parameter with Uncorrected Fisher’s LSD multiple comparison post-hoc testing for significance shown as: *p<0.05, **, p<0.01, ***p<0.005, ****p<0.001. ns = non-significant. Results represent two independent experiments with one representative experiment shown.
Figure 5—figure supplement 3
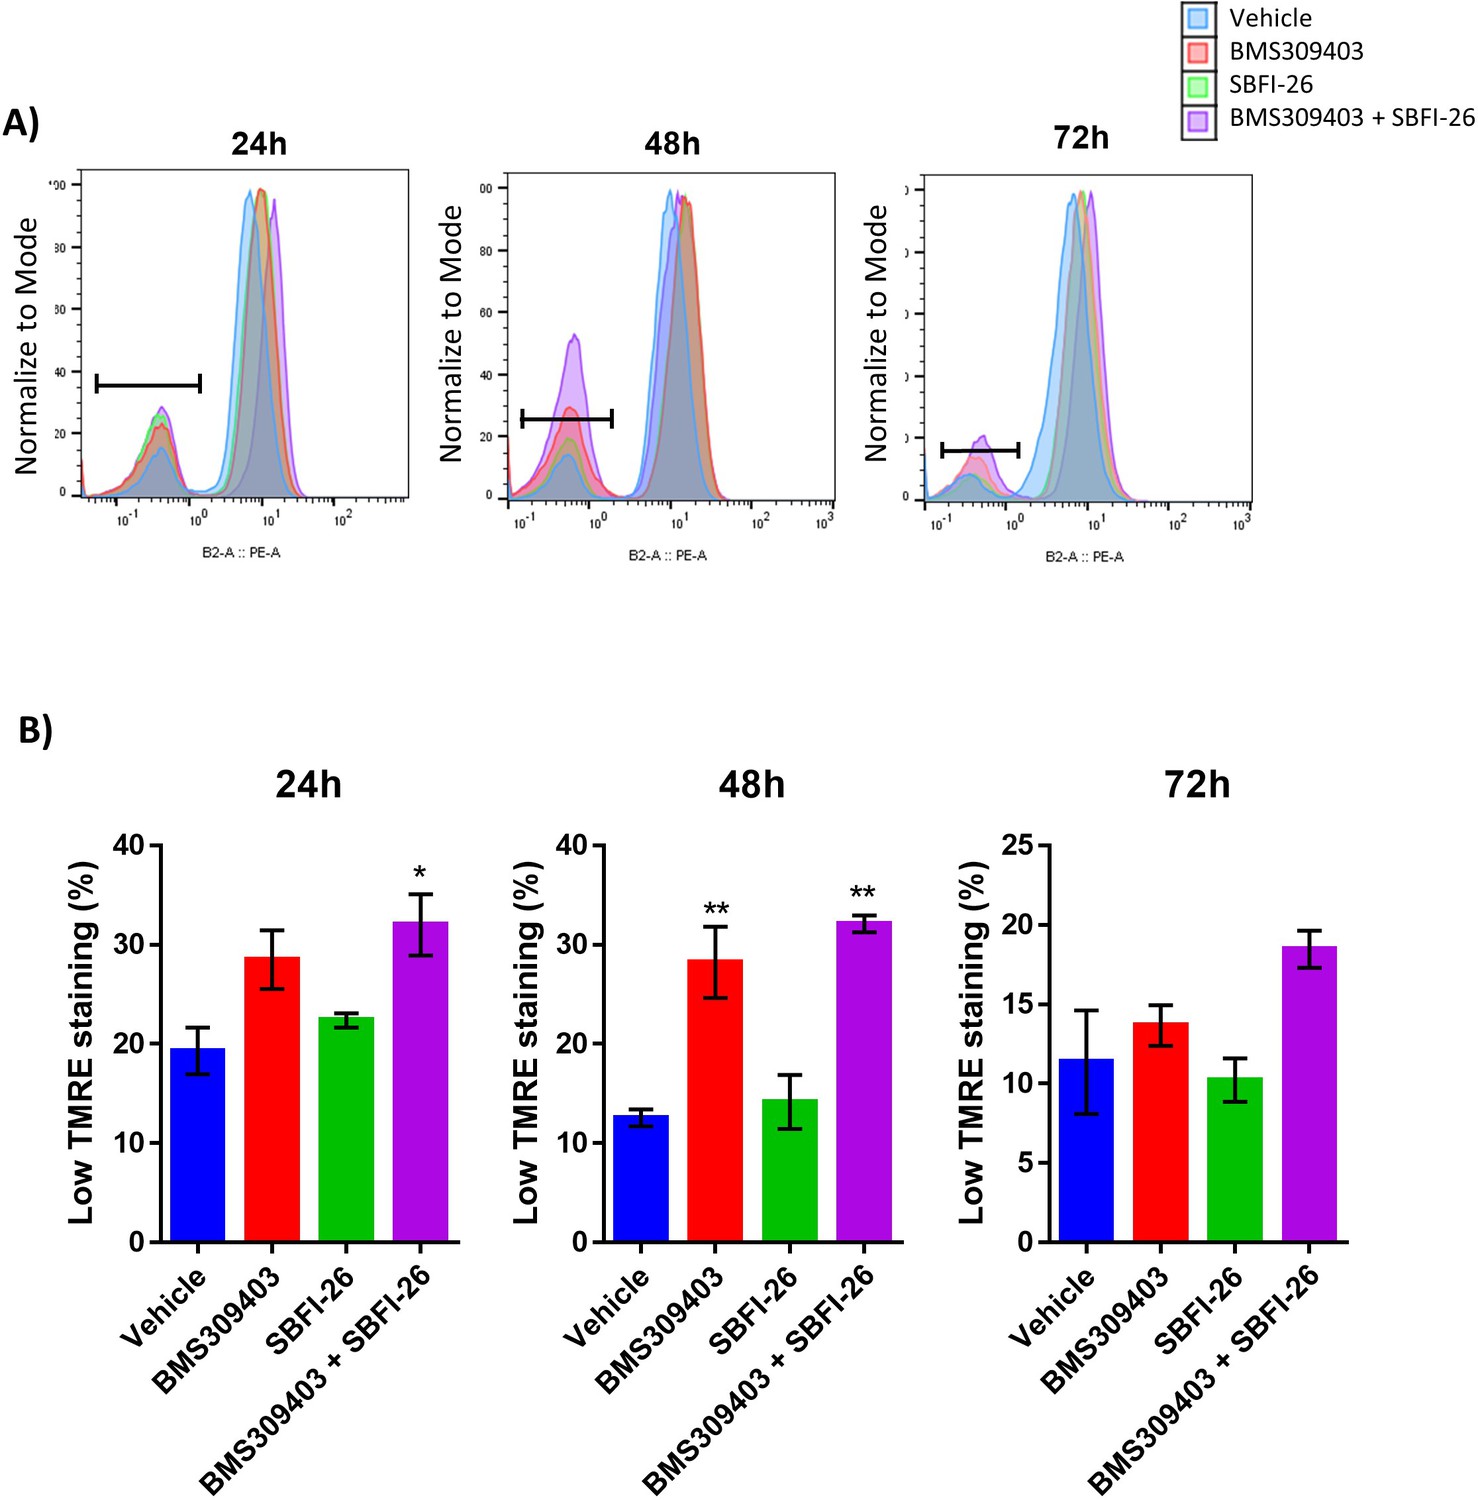
TMRE staining reveals compromised mitochondria in response to BMS309403 and the combination treatment.
GFP+/Luc+ MM.1S cells were treated with vehicle (DMSO), BMS309403, SBFI-26, or the combination treatment for 24, 48, or 72 hr prior to staining with tetramethylrhodamine, ethyl ester (TMRE). Representative TMRE staining and flow cytometry gating (A) demonstrated an increase in TMRE (low) stained cells with BMS309403 or the combination treatment relative to vehicle. Low TMRE stained cells are quantified in panel B; plotted as mean ± SEM and analyzed with one-way ANOVA, **p<0.01, n=3.
Figure 5—figure supplement 4
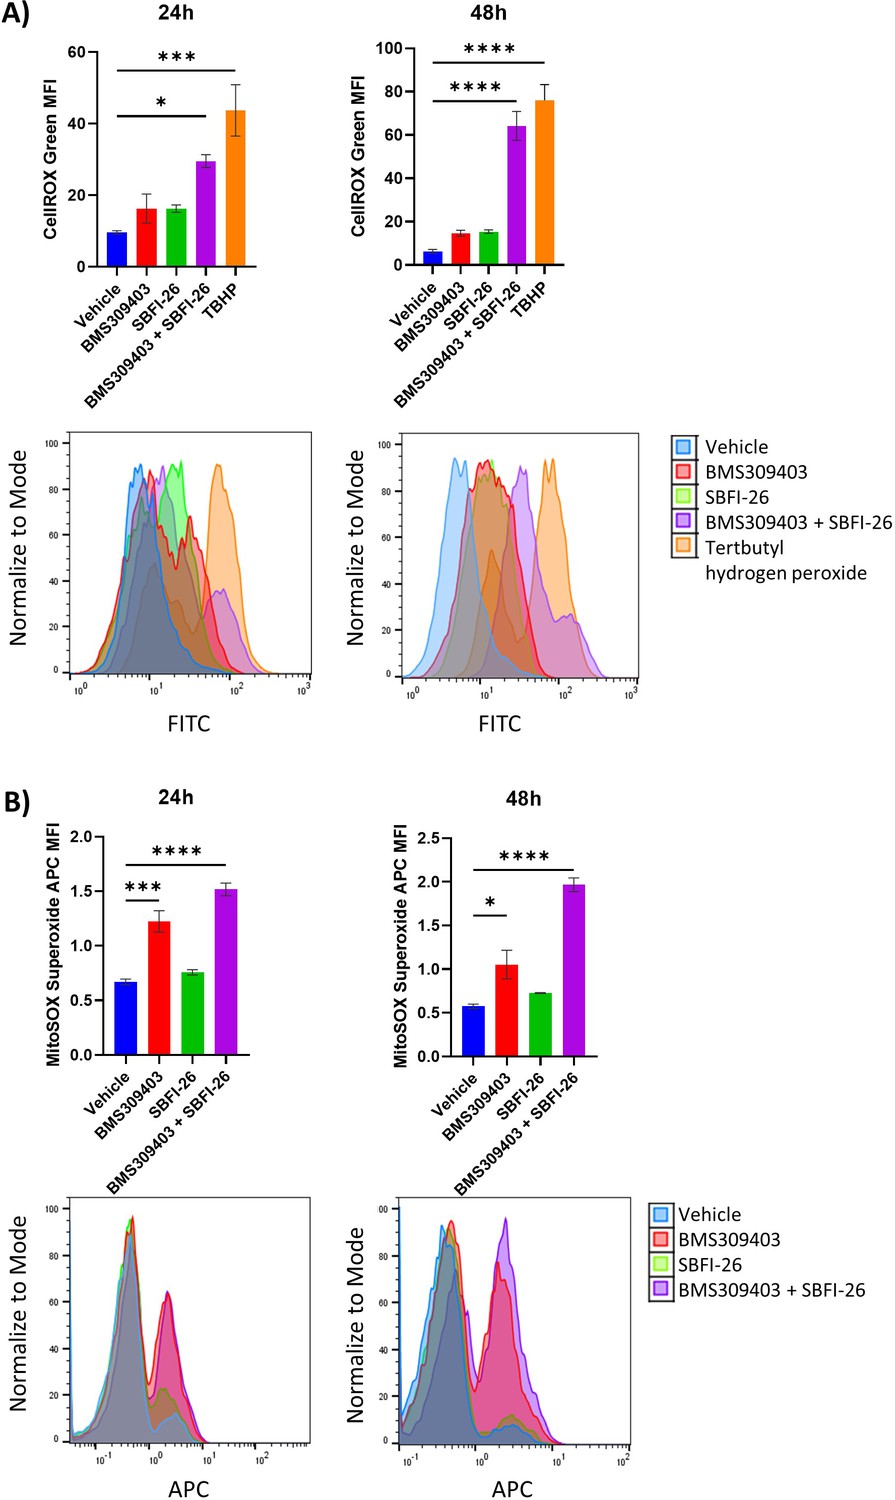
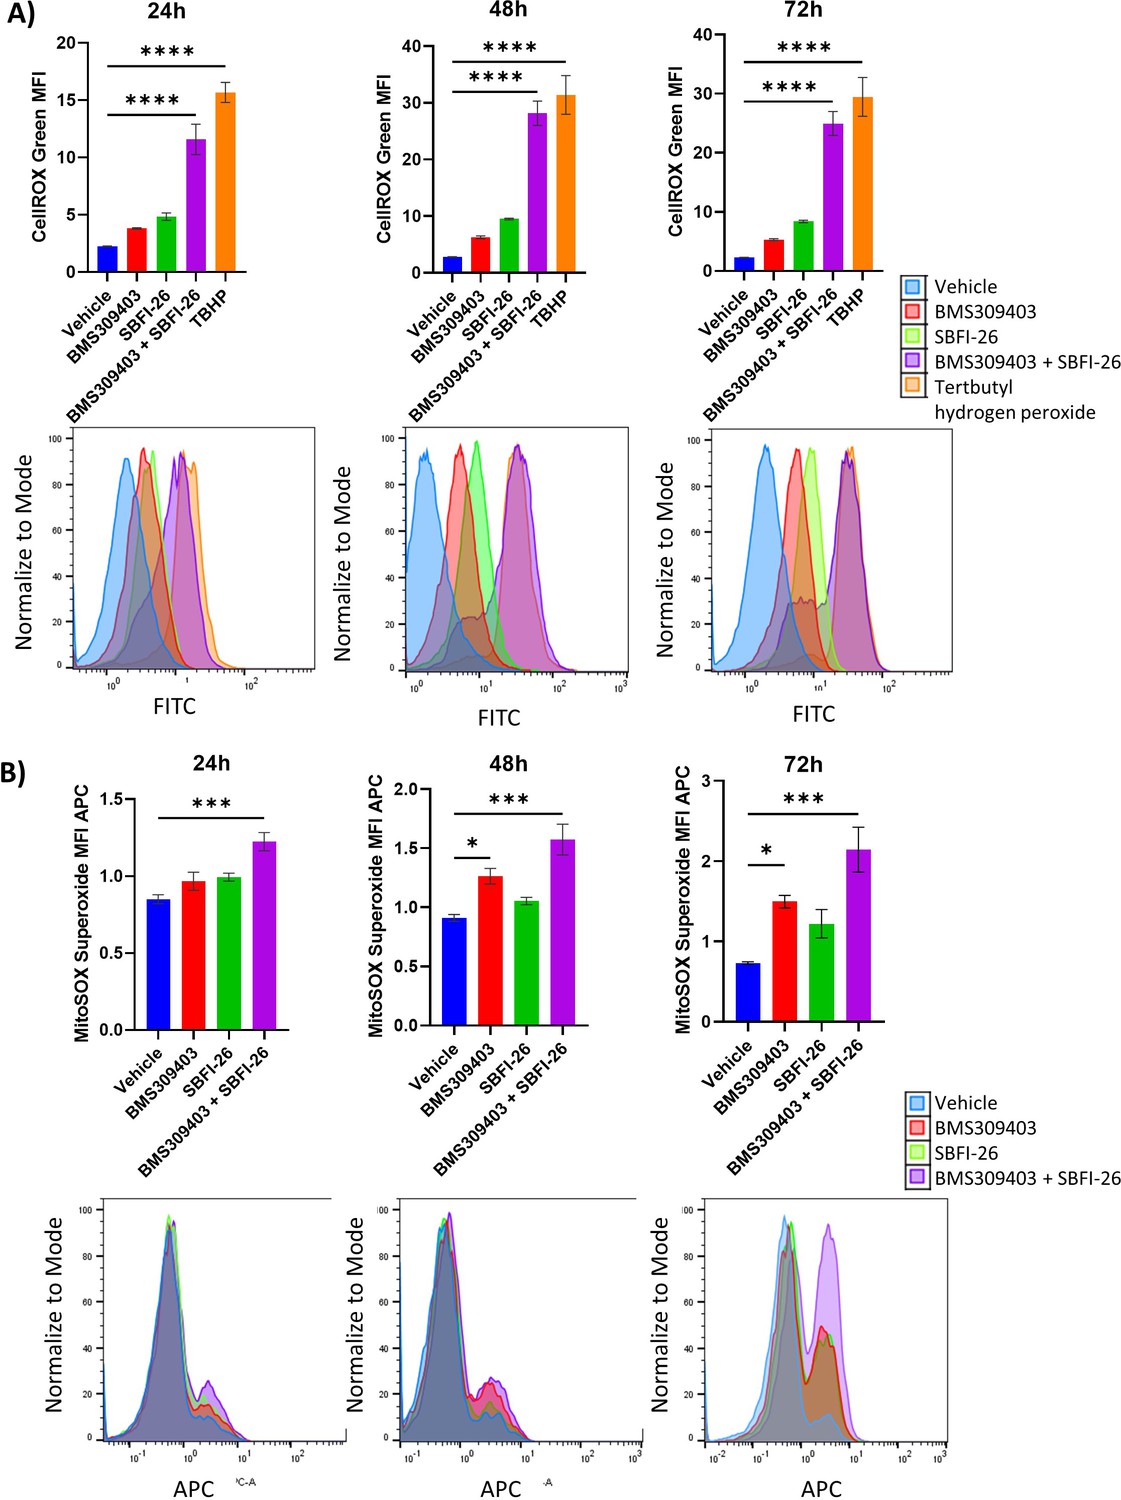
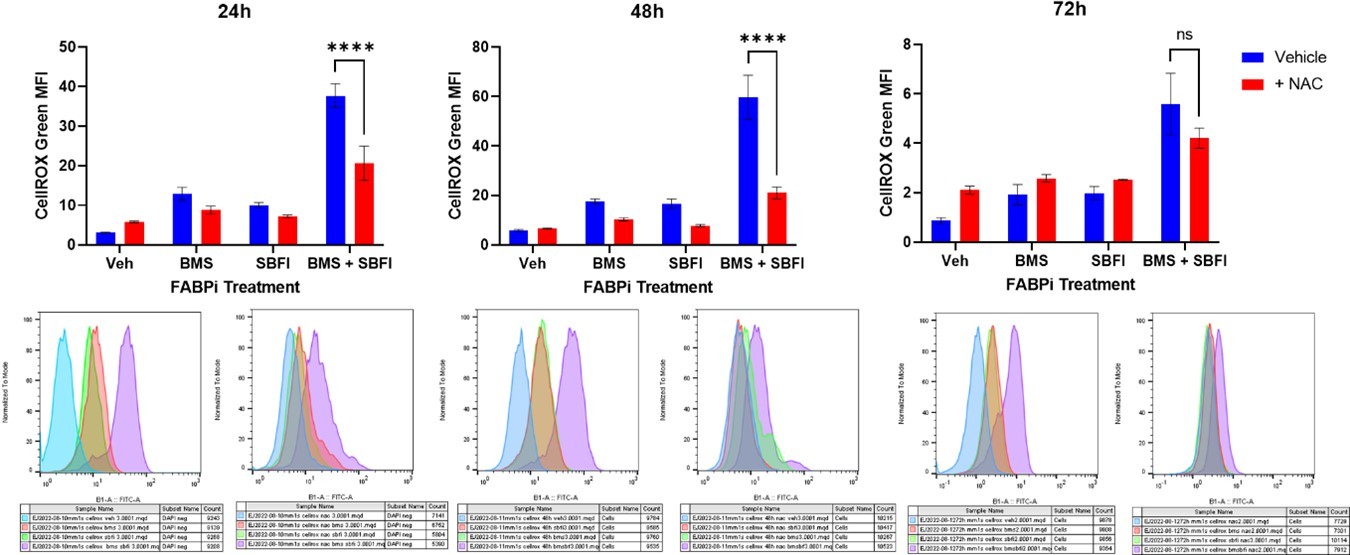
CellROX and Mitosox staining reveals an increase in total ROS and superoxide over 48 hr treatment with BMS309403 and combination therapy in MM.1S cells.
ATCC MM.1S cells were treated with vehicle (DMSO), BMS309403, SBFI-26, or the combination treatment for 24 or 48 hr prior to staining with CellROX (A) or MitoSOX (B). Representative histograms for each timepoint demonstrate a shift with FABP inhibitor treatment. Plotted as mean ± SEM and analyzed with one-way ANOVA, *p<0.05, **p<0.01, ***p<0.001, ****p<0.0001, n=3.
Figure 5—figure supplement 5
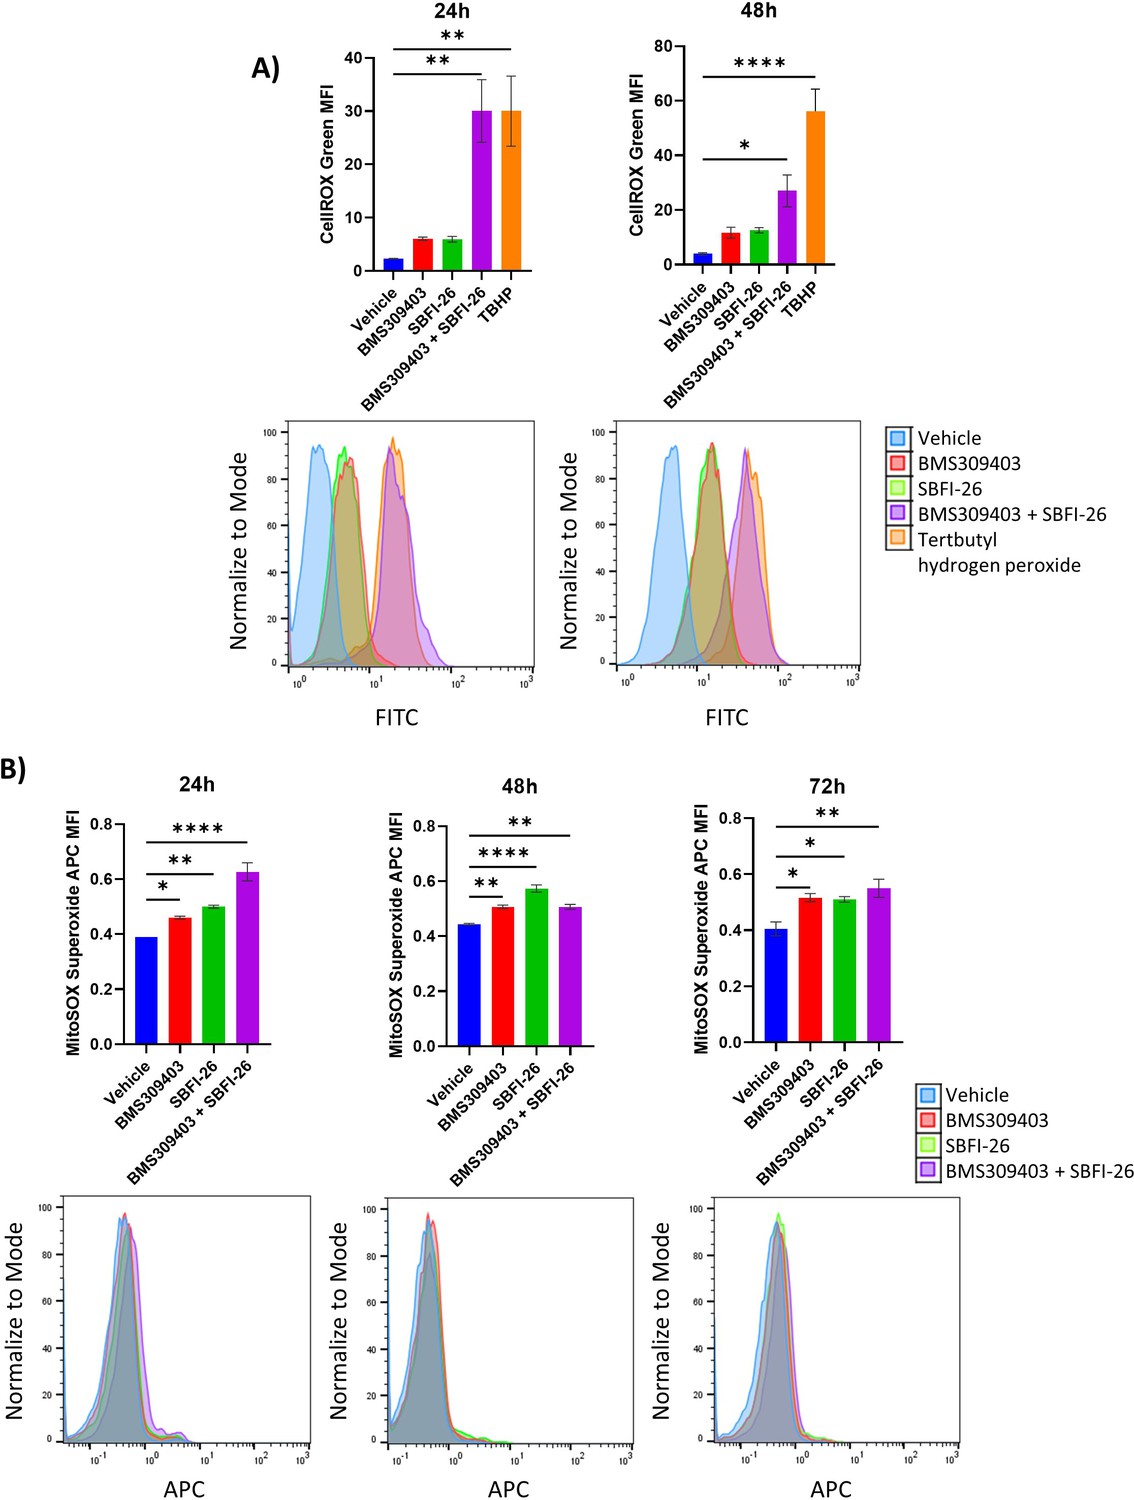
CellROX and Mitosox staining reveals an increase in total ROS and superoxide over 72 hr treatment with BMS309403 and combination therapy in U266 cells.
ATCC U266 cells were treated with vehicle (DMSO), BMS309403, SBFI-26, or the combination treatment for 24, 48, or 72 hr prior to staining with CellROX (A) or MitoSOX (B). Representative histograms for each timepoint demonstrate a shift with FABP inhibitor treatment. Plotted as mean ± SEM and analyzed with one-way ANOVA, *p<0.05, **p<0.01, ***p<0.001, ****p<0.0001 n=3.
Figure 5—figure supplement 6
CellROX and Mitosox staining reveals an increase in total ROS and superoxide over 72 hr treatment with BMS309403 and combination therapy in OPM2 cells.
DSMZ OPM2 cells were treated with vehicle (DMSO), BMS309403, SBFI-26, or the combination treatment for 24 or 48 hr prior to staining with CellROX (A) or for 24, 48, or 72 hr prior to staining with MitoSOX (B). Representative histograms for each timepoint demonstrate a shift with FABP inhibitor treatment. Plotted as mean ± SEM and analyzed with one-way ANOVA, *p<0.05, **p<0.01, ***p<0.001, ****p<0.0001 n=3.
Figure 5—figure supplement 7
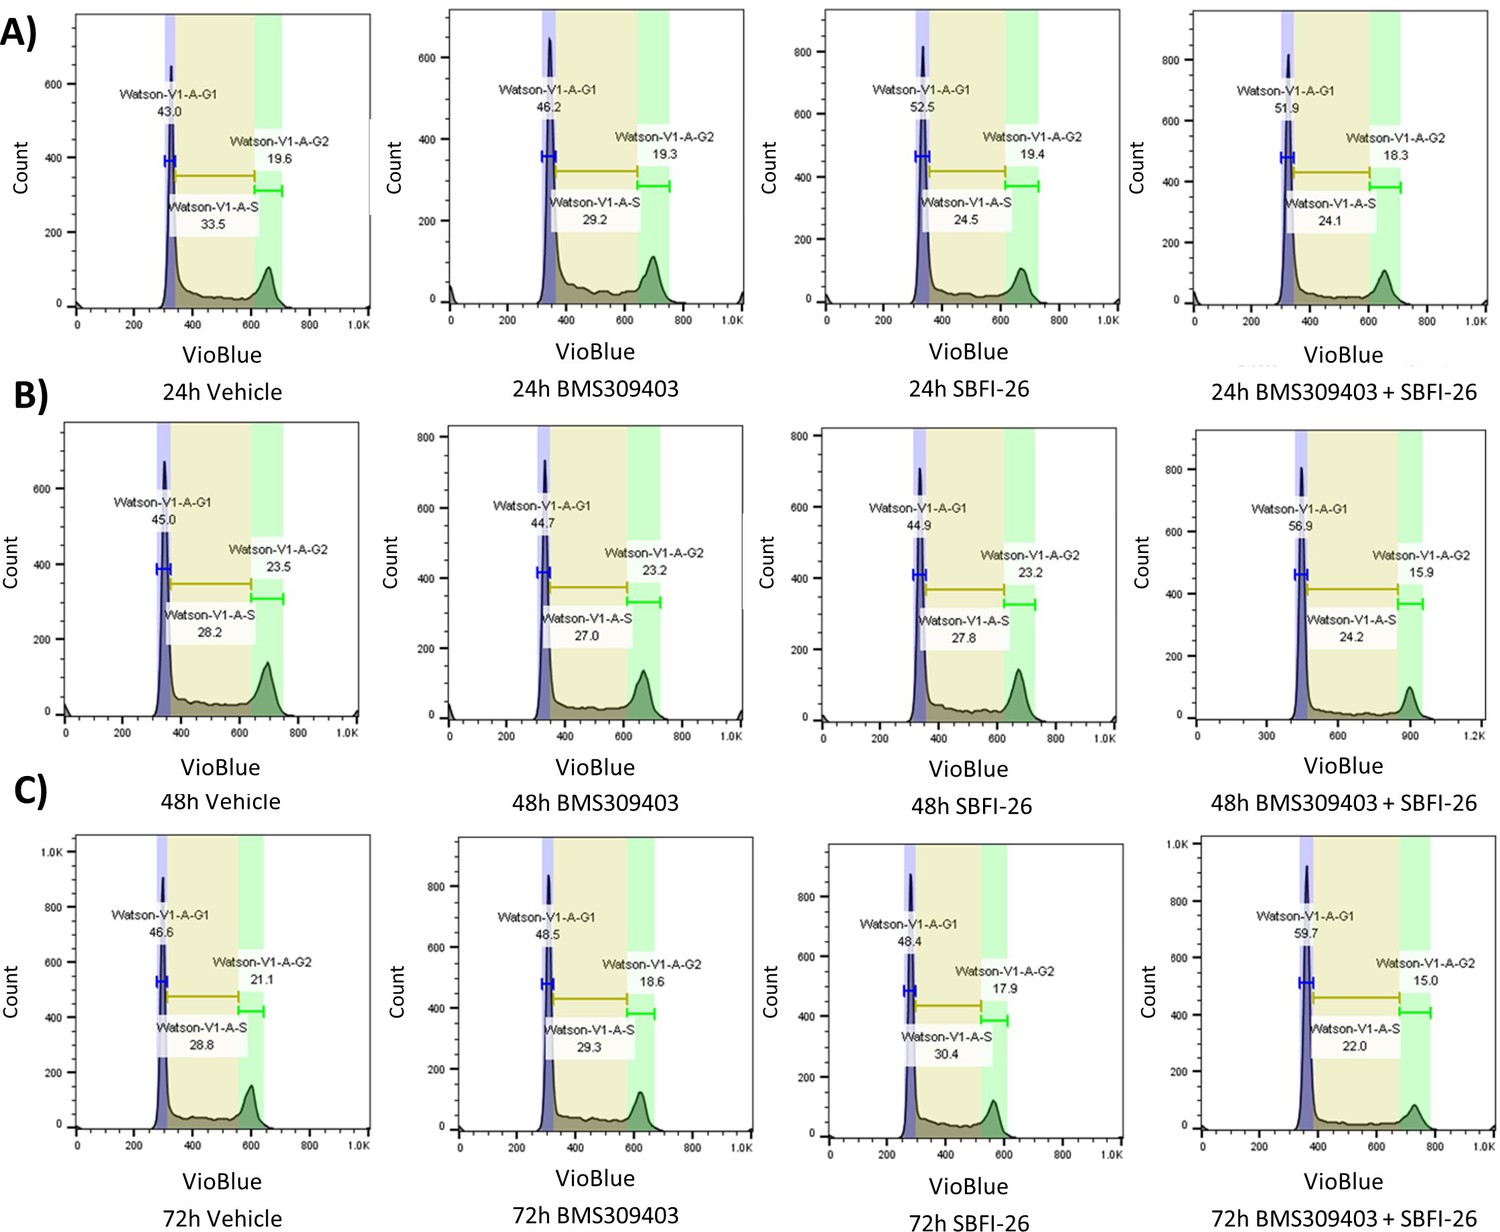
MM.1S cell cycle gating after FABP inhibitor treatment.
GFP+/Luc+ MM.1S cells were treated with either 50 µM BMS309403, 50 µM SBFI-26, or a combination of both at 24 (A), 48 (B), and 72 (C) hr. The phases of the cell cycle were determined using the Watson Pragmatic algorithm via FlowJo software.
Figure 5—figure supplement 8
Apoptosis, cell cycle arrest and reduction in Ki67 expression is induced in GFP+/Luc+ MM.1 S cells through inhibition of FABP proteins at 72 hr.
Data represent Mean ± SEM of least three experimental repeats with at least two technical samples per experiment. One-way ANOVA and Dunnett’s Multiple comparison testing was used; *p<0.05, **, p<0.01, ***p<0.005, ****p<0.001.
Figure 5—figure supplement 9
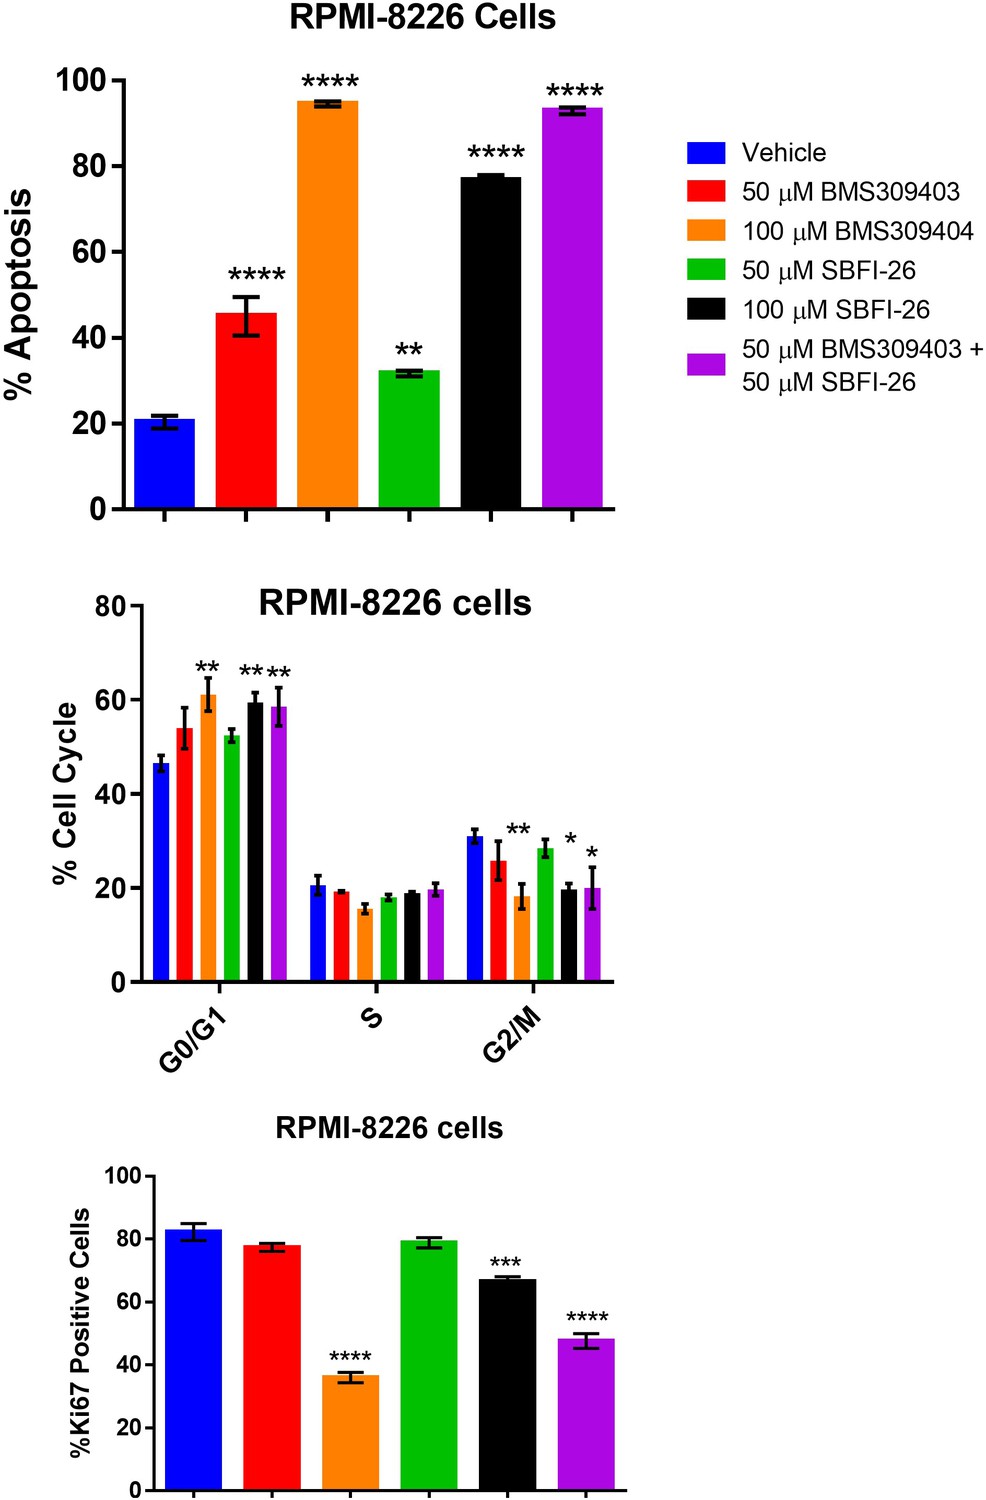
Apoptosis, cell cycle arrest and reduction in Ki67 expression is induced in RPMI-8226 cells through inhibition of FABP proteins at 72 hr.
Data represent Mean ± SEM of least three experimental repeats with at least two technical samples per experiment. One-way ANOVA and Dunnett’s Multiple comparison testing was used; *p<0.05, **, p<0.01, ***p<0.005, ****p<0.001.
Figure 5—figure supplement 10
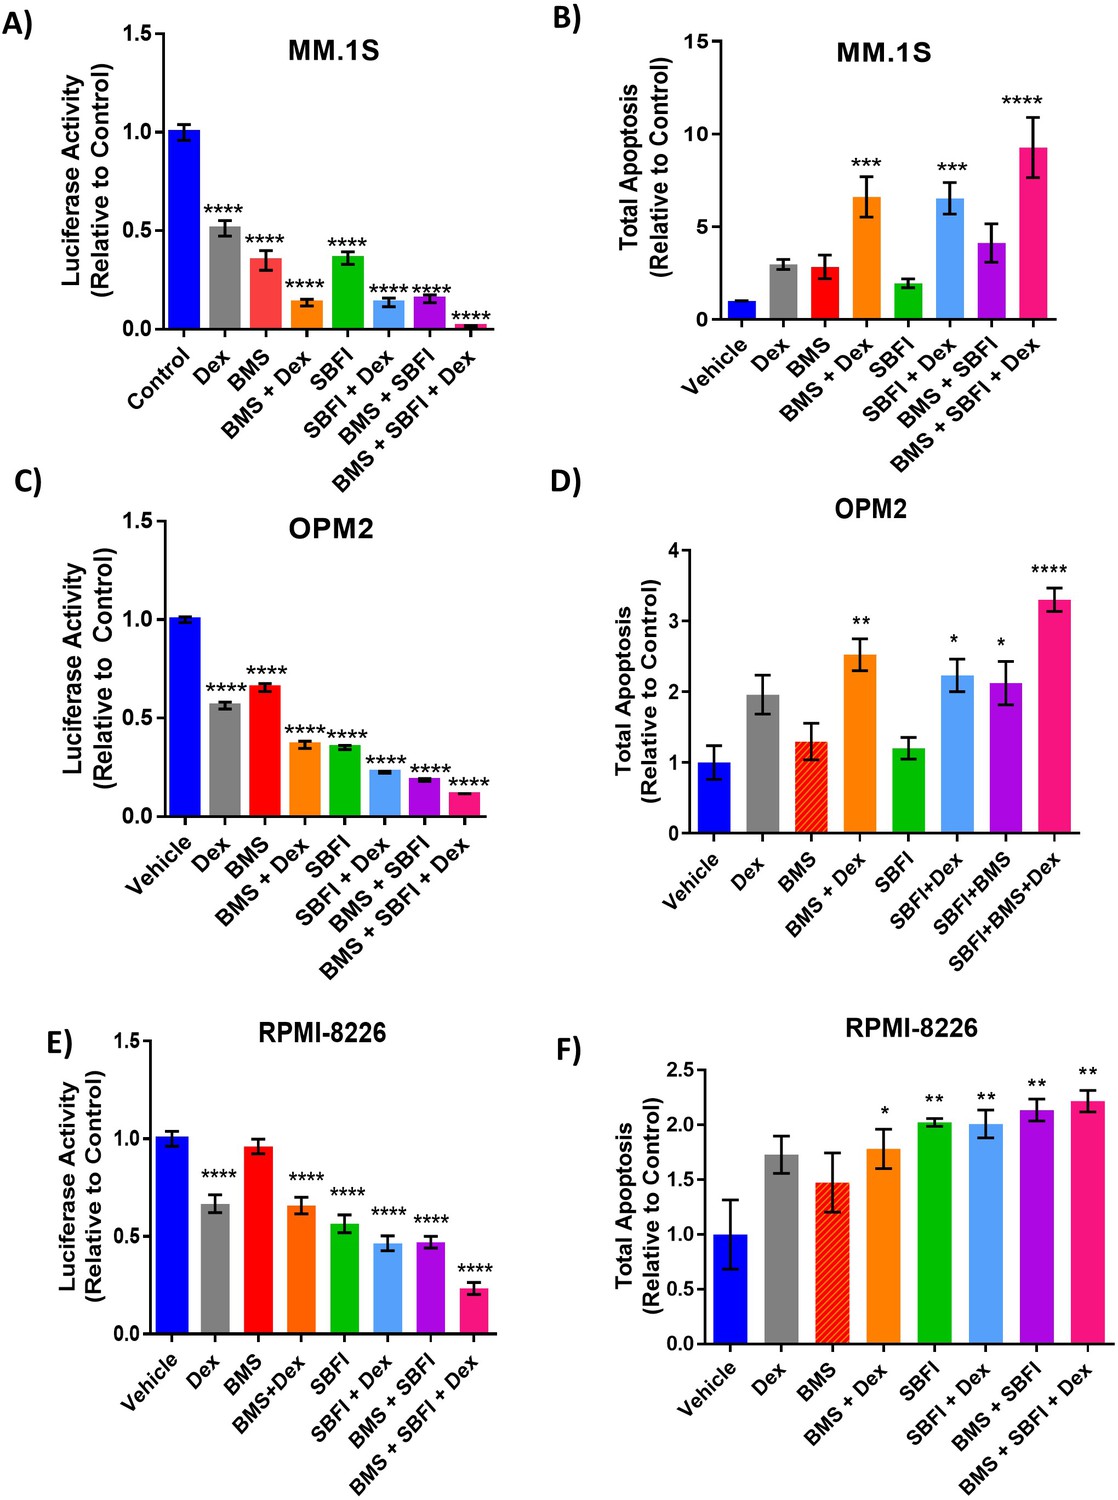
The effects of FABP inhibitors combined with dexamethasone after 72 hr in vitro.
Combination of inhibitor treatment with dexamethasone results. Cell numbers in GFP+/Luc +MM.1 S (A, n=3) and OPM-2 (C, n=4) as assessed by luciferin spike-in, and RPMI-8226 as assessed by CellTiter-Glo (E, n=3), normalized to control. Apoptosis results in GFP+/Luc +MM.1 S (B, n=3), OPM-2 (D, n=3) and RPMI8226 (F, n=3). All graphs represent mean ± SEM and significance compared to the control is determined by one-way ANOVA with Dunnett’s multiple comparisons test. *p<0.05, **, p<0.01, ***p<0.005, ****p<0.001.
Figure 6 with 2 supplements
FABPi do not consistently increase survival or decrease tumor burden in myeloma xenograft (cohort 1) and syngeneic mouse models.
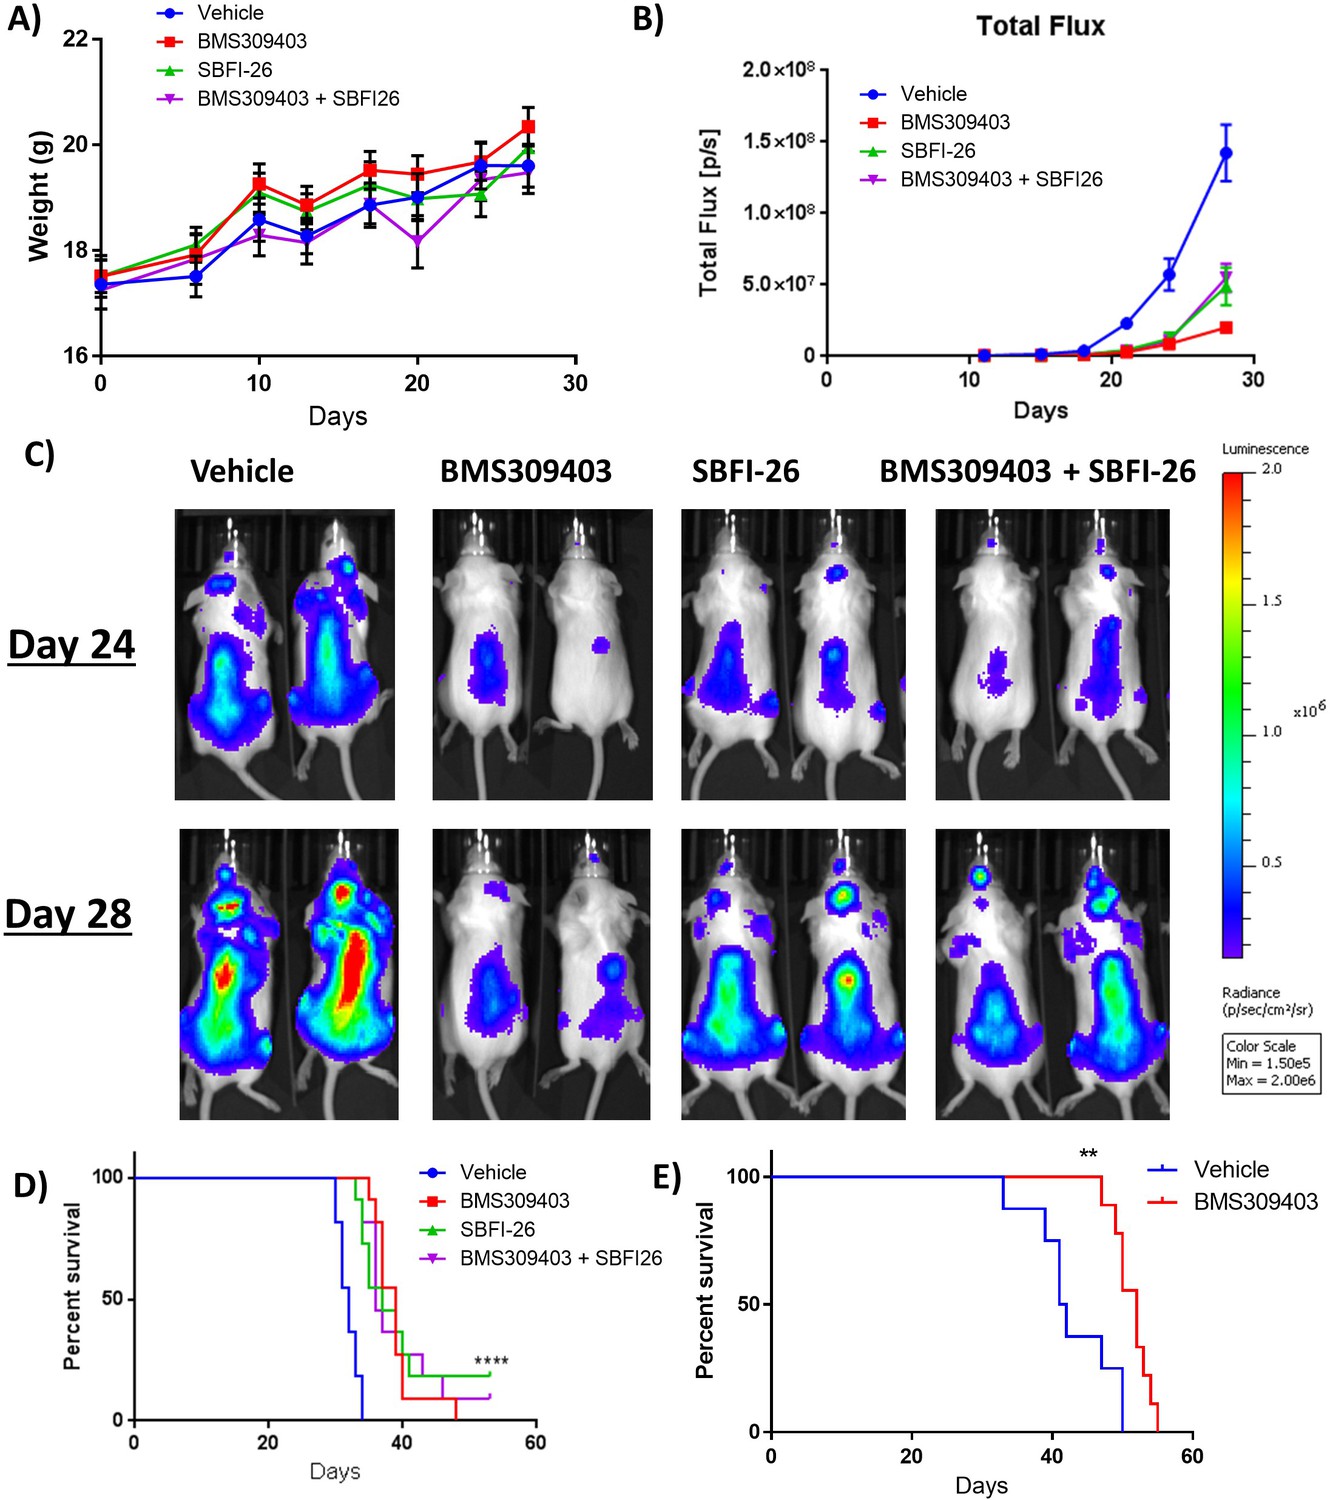
(A) Mouse weights from the first cohort of SCID-beige- GFP+/Luc +MM.1 S mice treated with BMS309403, SBFI-26, or the combination from day of injection plotted as Mean ± SEM. (B) Tumor burden from cohort 1 of SCID-beige GFP+/Luc +MM.1 S mice assessed by bioluminescence imaging (BLI) in MM.1S model. In panel B, One-way ANOVA with Dunnett’s multiple comparison test significance shown as *p<0.05. **p<0.01. ***p<0.001. ****p<0.0001. Vehicle vs BMS309403 (24 days, ****; 28 days, ****). Vehicle vs SBFI-26 (24 days ****; 28 days, ****). Vehicle vs BMS309403 +SBFI-26 (24 hr, ****; 28 days, ****). BMS309403 vs BMS309403 +SBFI-26 (24 days NS; 28 days, ***). SBFI-26 vs BMS309403 +SBFI-26 (24 and 28 days, NS). BMS309403 vs SBFI-26 (24 hr, NS 28 days, **). (C) Representative BLI images from cohort 1 of SCID-Beige MM.1Sgfp+luc+ mice at days 24 and 28. (D) Survival of SCID-Beige MM.1Sluc+ mice from first cohort; analysis performed by Kaplan-Meier Survival Analysis, Log-Rank (Mantel-Cox) test, p<0.0001, n=11. (E) Survival of KaLwRij mice injected with 5TGM1 cells. Survival analysis performed by Kaplan-Meier Survival Analysis, Log-Rank (Mantel-Cox) test, p=0.0023, Vehicle n=8, BMS309403 n=9. Please see 2 supplements to Figure 6.
Figure 6—figure supplement 1
SCID-Beige-GFP+/Luc +MM.1 S in vivo characterization.
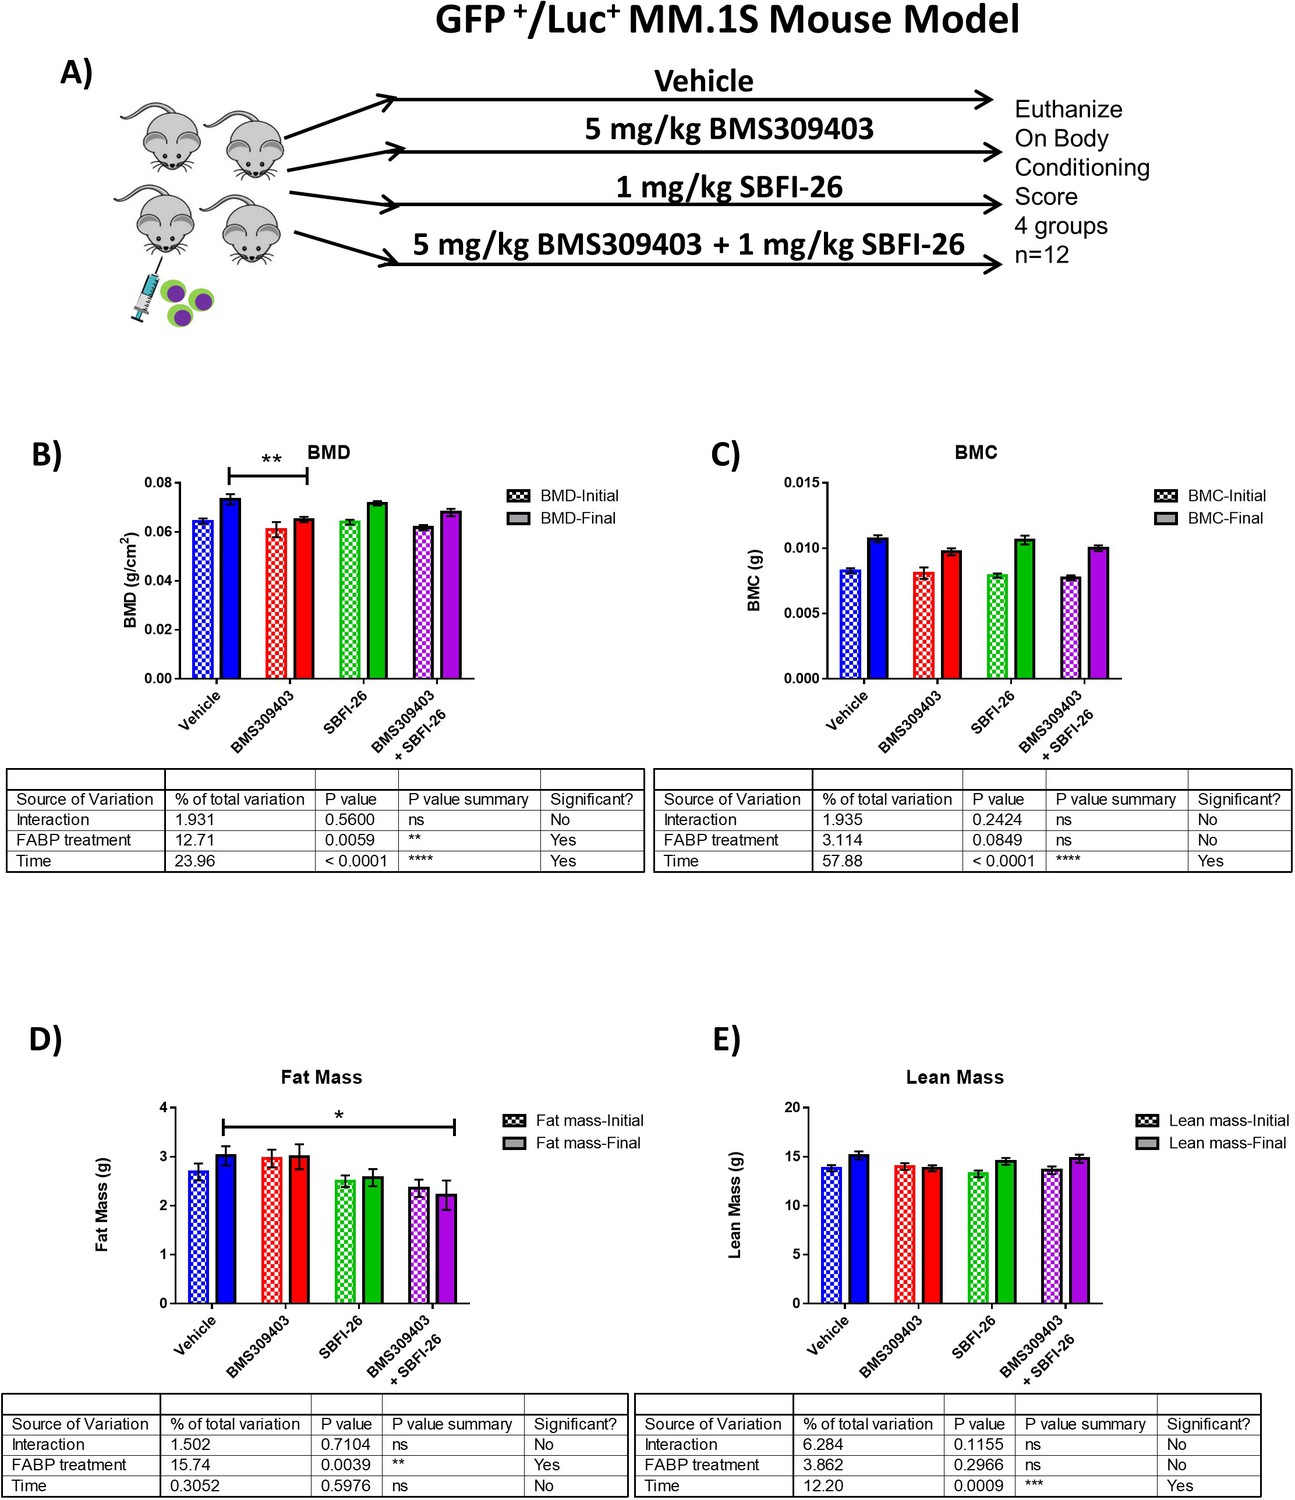
(A) In vivo model experimental flow chart. (B–E) Piximus DEXA analysis at day 1 (initial) and day 30 (final) after tumor cell inoculation. BMD (bone mineral density) and BMC (bone mineral content). Data are plotted as mean ± SEM and analyzed with two-way ANOVA with Dunnett’s multiple comparison post-hoc test; n=8–12.
Figure 6—figure supplement 2
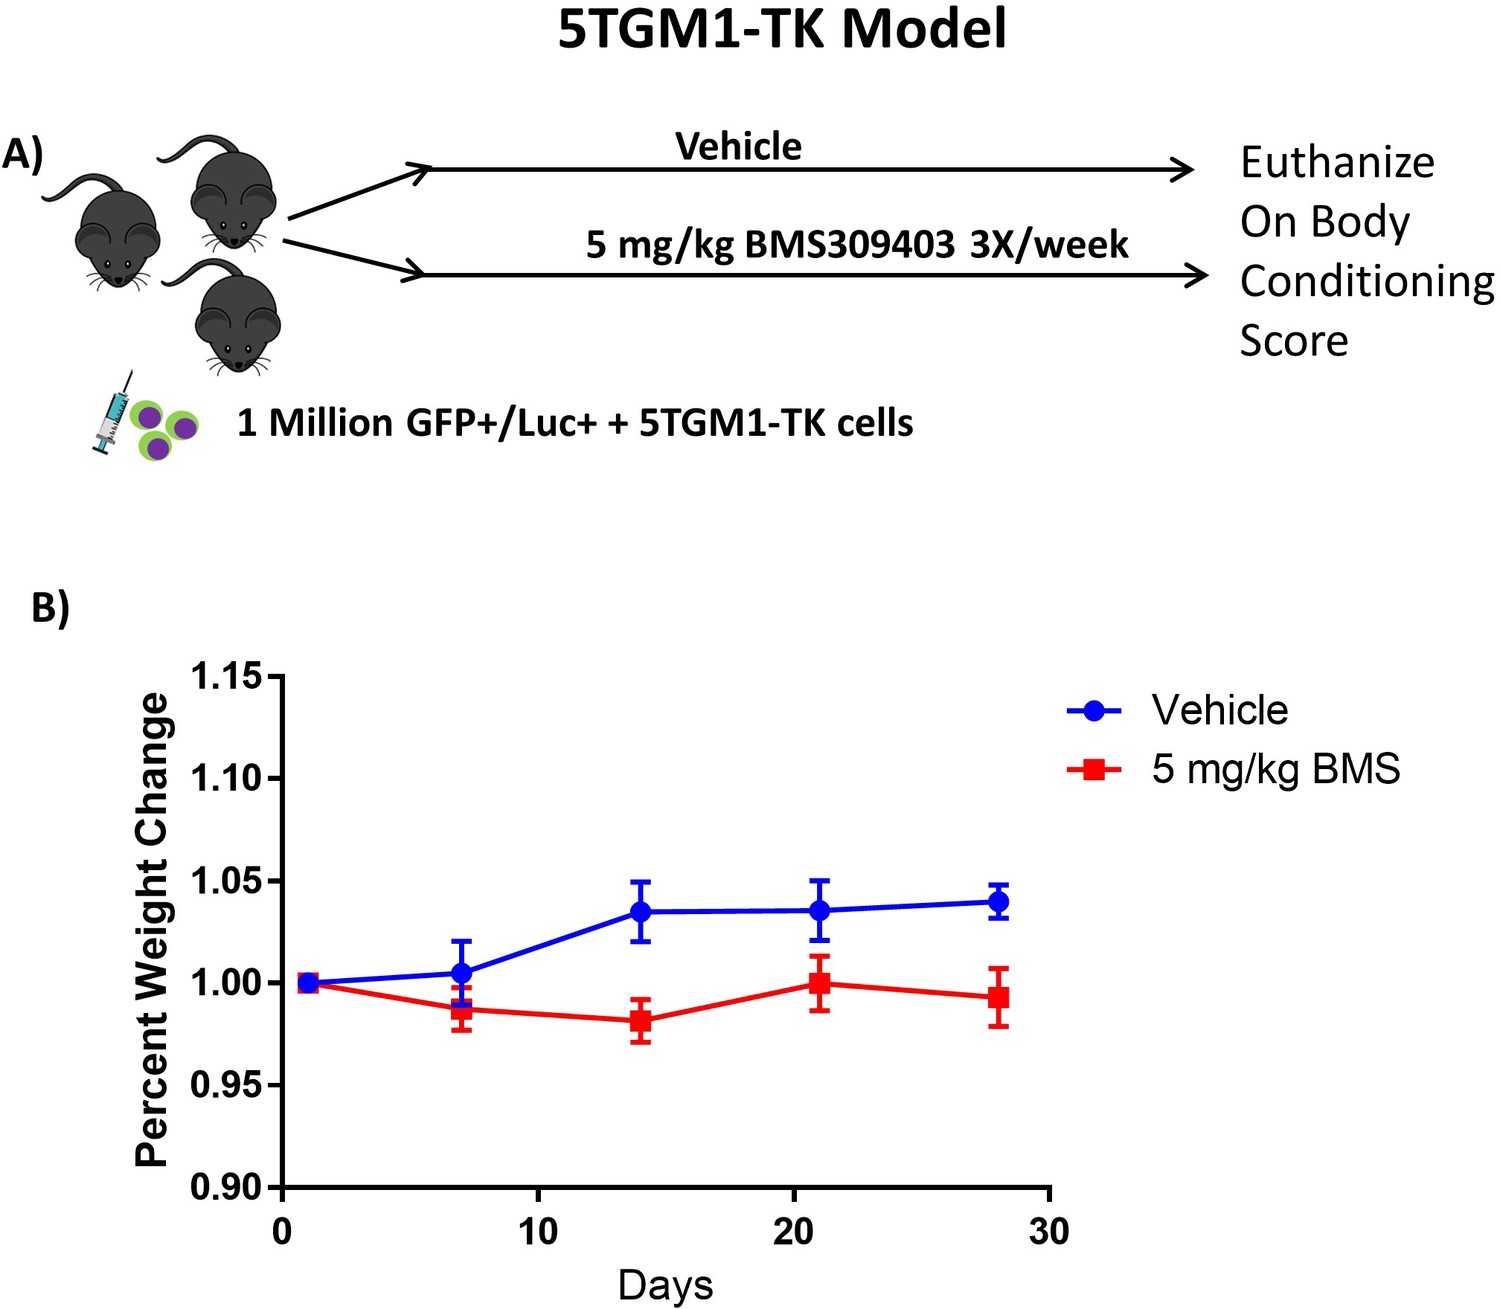
GFP+/Luc+ 5TGM1-TK/KaLwRij syngeneic model.
(A) In vivo model experimental flow chart. (B) Mouse weights normalized to day 0 for each group, from day of injection plotted as Mean ± SEM. Vehicle, n=8; BMS309403, n=9.
Figure 7
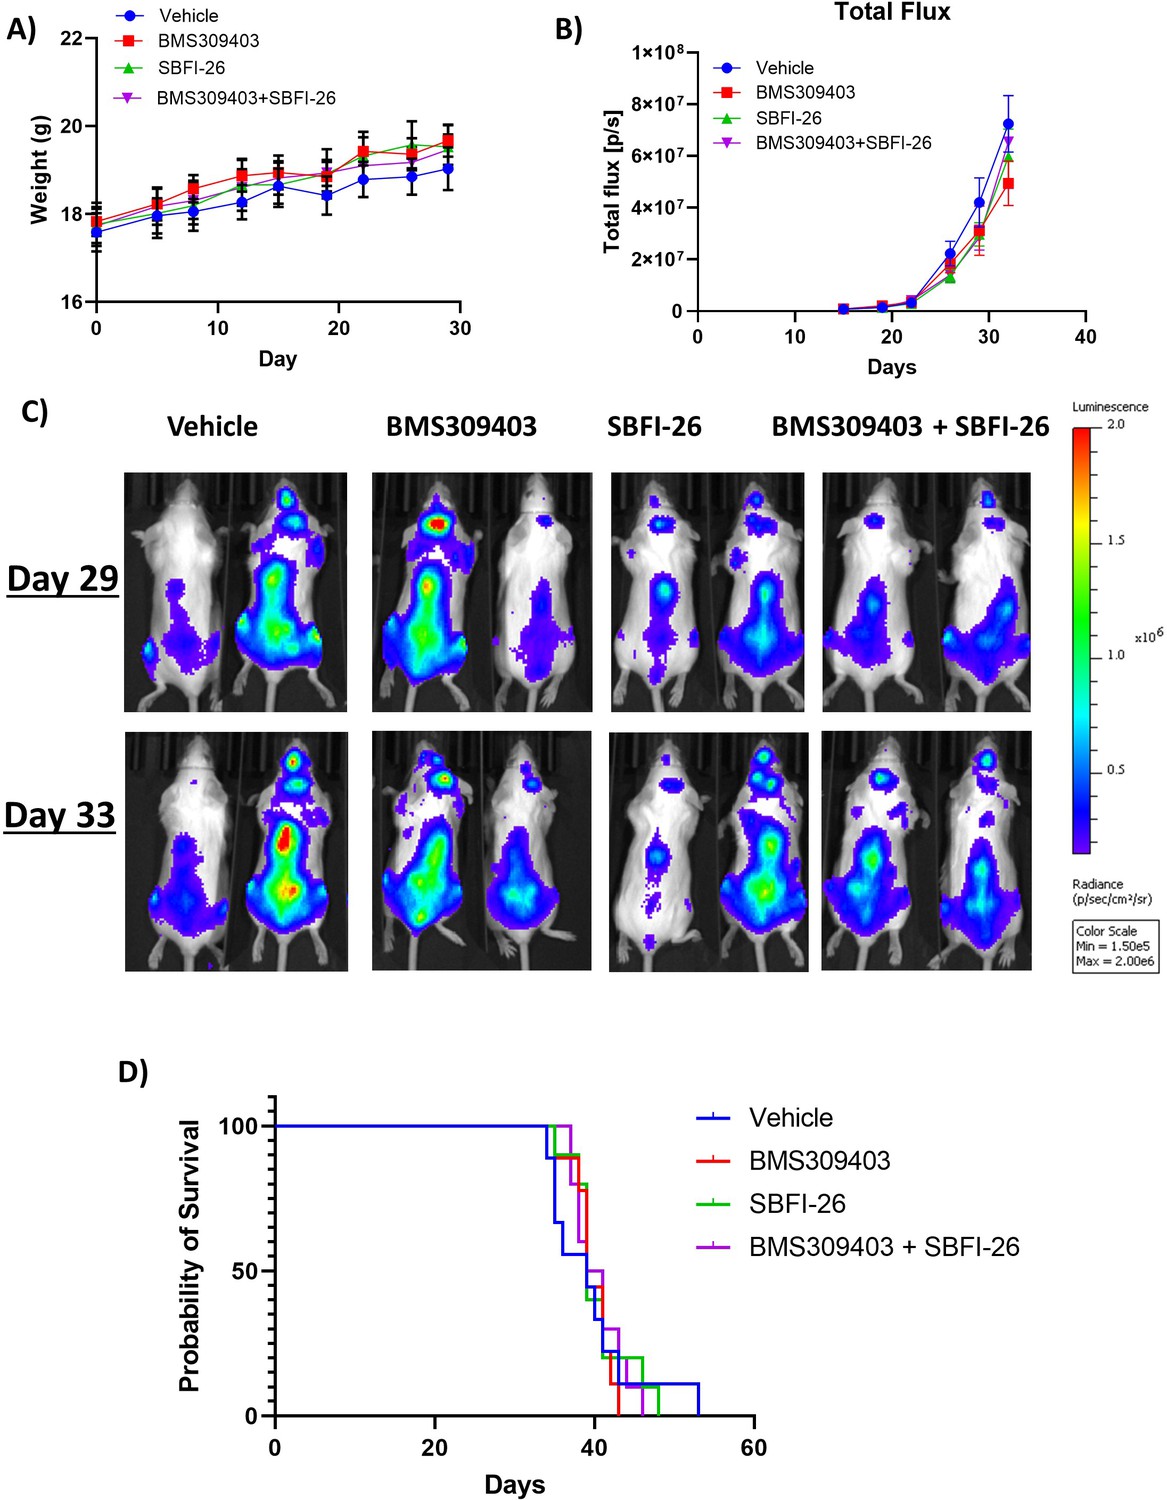
FABPi do not consistently increase survival or decrease tumor burden in myeloma xenograft mice (cohort 2).
(A) Mouse weights from the second cohorts of SCID-beige- GFP+/Luc +MM.1 S mice treated with BMS309403, SBFI-26, or the combination from day of injection plotted as Mean ± SEM. (B) Tumor burden from two separate cohorts of SCID-beige GFP+/Luc +MM.1 S assessed by bioluminescence imaging (BLI) in MM.1S model. No significance detected with One-way ANOVA with Dunnett’s multiple comparison test. (C) Representative BLI images from second cohort of SCID-Beige MM.1Sluc+ mice at days 29 and 33. (D) Survival of SCID-Beige GFP+/Luc +MM.1 S mice from second cohort- no significance observed. Analysis performed by Kaplan-Meier Survival Analysis, Log-Rank (Mantel-Cox) test, no significance in panel D, n=10.
Figure 8 with 2 supplements
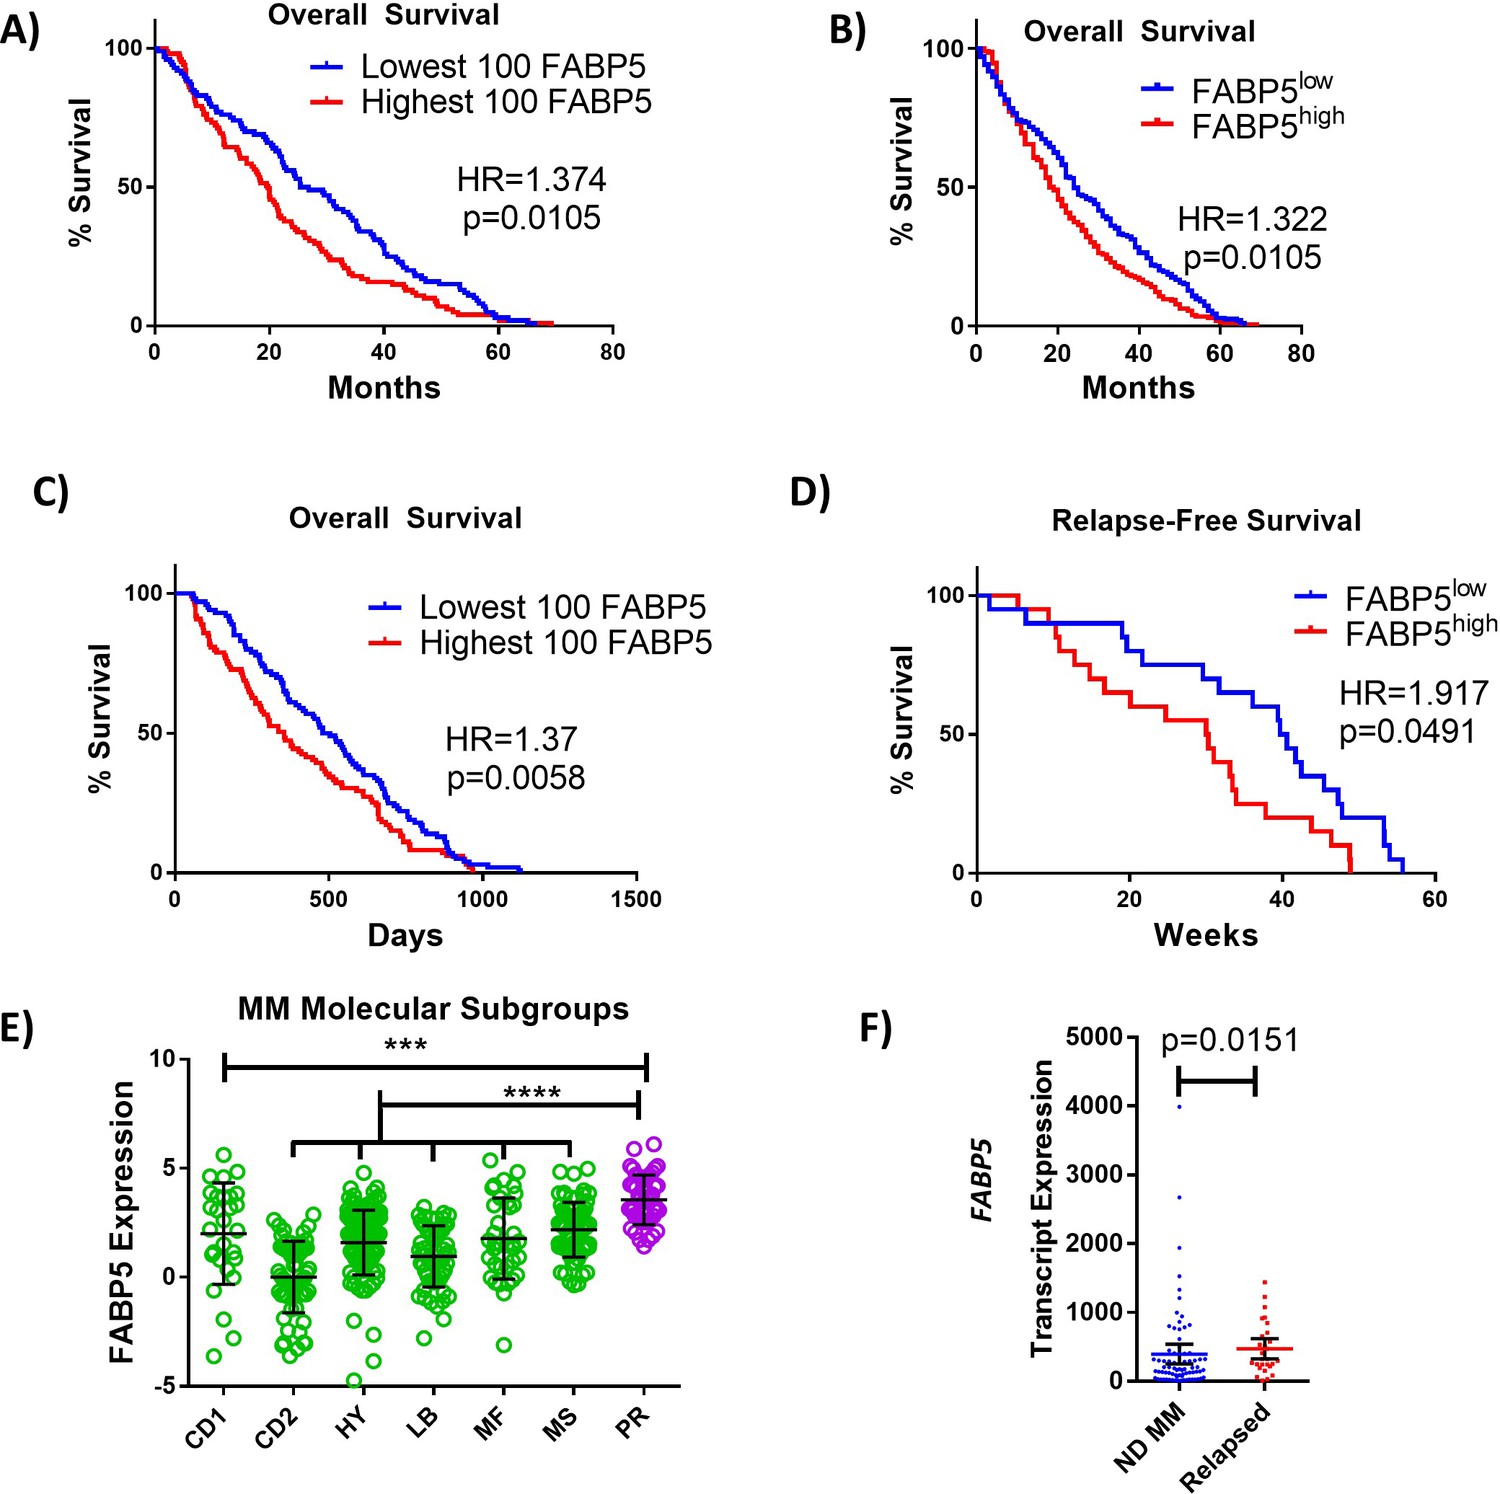
FABP proteins are clinically relevant in MM.
(A, B) Kaplan-Meier analysis of overall survival (OS) of MM patients in Zhan et al. dataset stratified as top (n=100) or bottom (n=100) FABP5 expressing, or all patients above (n=207) or below (n=207) the median. (C) Kaplan–Meier analysis of relapse-free survival of MM patient groups in Mulligan et al. dataset stratified as top (n=100) or bottom (n=100) FABP5 expressing. (D) Kaplan–Meier analysis of relapse-free survival of MM patient groups in Carrasco et al. dataset: high (n=20) and low (n=20) FABP5 relative to median. (E) Molecular subtypes of MM cells were analyzed for FABP5 expression and significance between all groups and the highly aggressive subtype (PR) was observed using a one-way ANOVA with Dunnett’s multiple comparison testing. (CD1 or CD2 of cyclin D translocation; HY: hyperdiploid; LB: low bone disease; MF or MS with activation of MAF, MAFB, or FGRF3/MMSET; PR: proliferation. From reference Zhan et al., 2006). (F) Data from Chng et al. dataset from newly-diagnosed (ND) (n=73) and relapsed MM patients (n=28) as mean with 95% confidence interval (CI), with statistical analysis performed using a Mann Whitney test. Data are mean ± SD unless otherwise stated. *p<0.05. **p<0.01. ***p<0.001. ****p<0.0001. Please see 2 supplements to Figure 8.
Figure 8—figure supplement 1
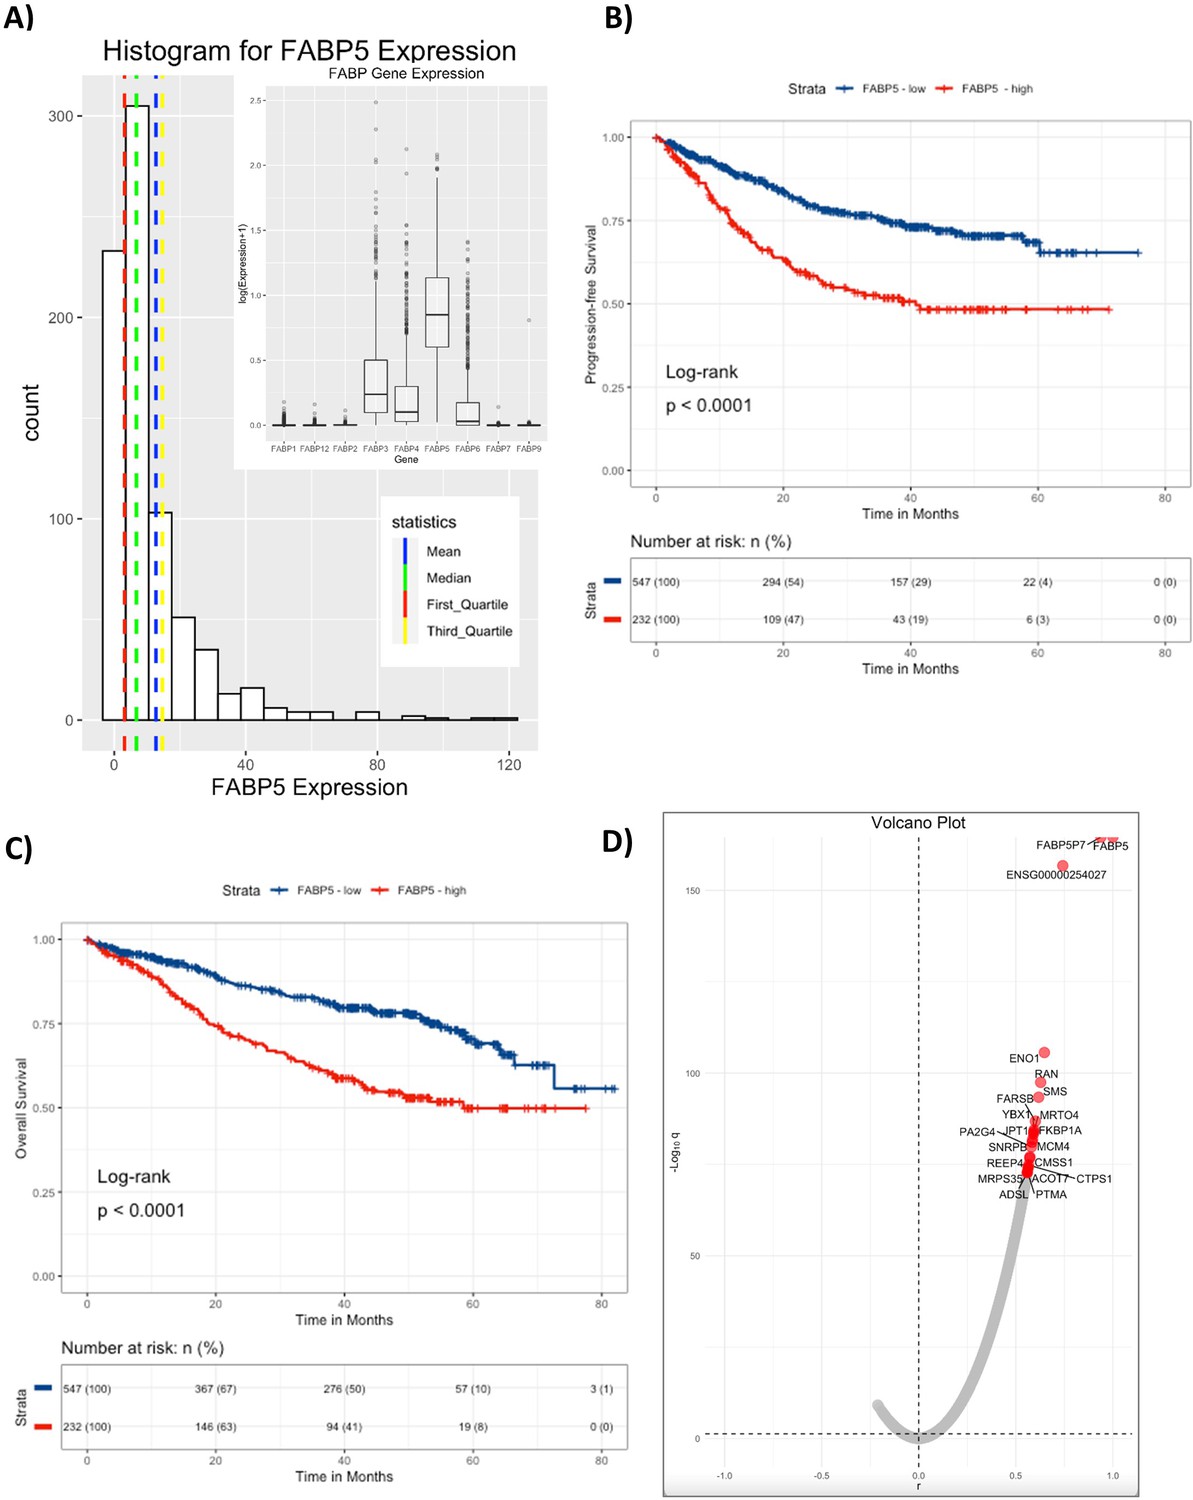
CoMMpass Dataset analysis of FABP5 demonstrates decreased progression-free survival and overall-survival in MM patients with high FABP5 expression in MM cells.
(A) Histogram of FABP5 in full dataset. Mean, Median, 1st quartile and 3rd quartile are marked. 779 cases total. Insert: Gene expression levels of all FABP genes in CoMMpass dataset. (B) Progression-free survival was significantly shorter for MM patients with high expression of FABP5, with a hazard ratio of 1.64 (95% confidence interval 1.34–2.0). (C) Overall survival was also significantly shorter for MM patients with high expression of FABP5, with a hazard ratio of 2.19 (95% confidence interval 1.66–2.88). (D) Volcano plot of correlation analysis shows correlation between FABP5 and other genes in the CoMMpass dataset. A bias towards positively correlated genes was observed. Volcano plot was made by plotting the negative logarithm of the Benjamini-Hochberg adjusted p values (q) from a Pearson’s correlation test, which tested for correlation between FABP5 versus all other genes, with the top 20 genes highlighted in red.
Figure 8—figure supplement 2
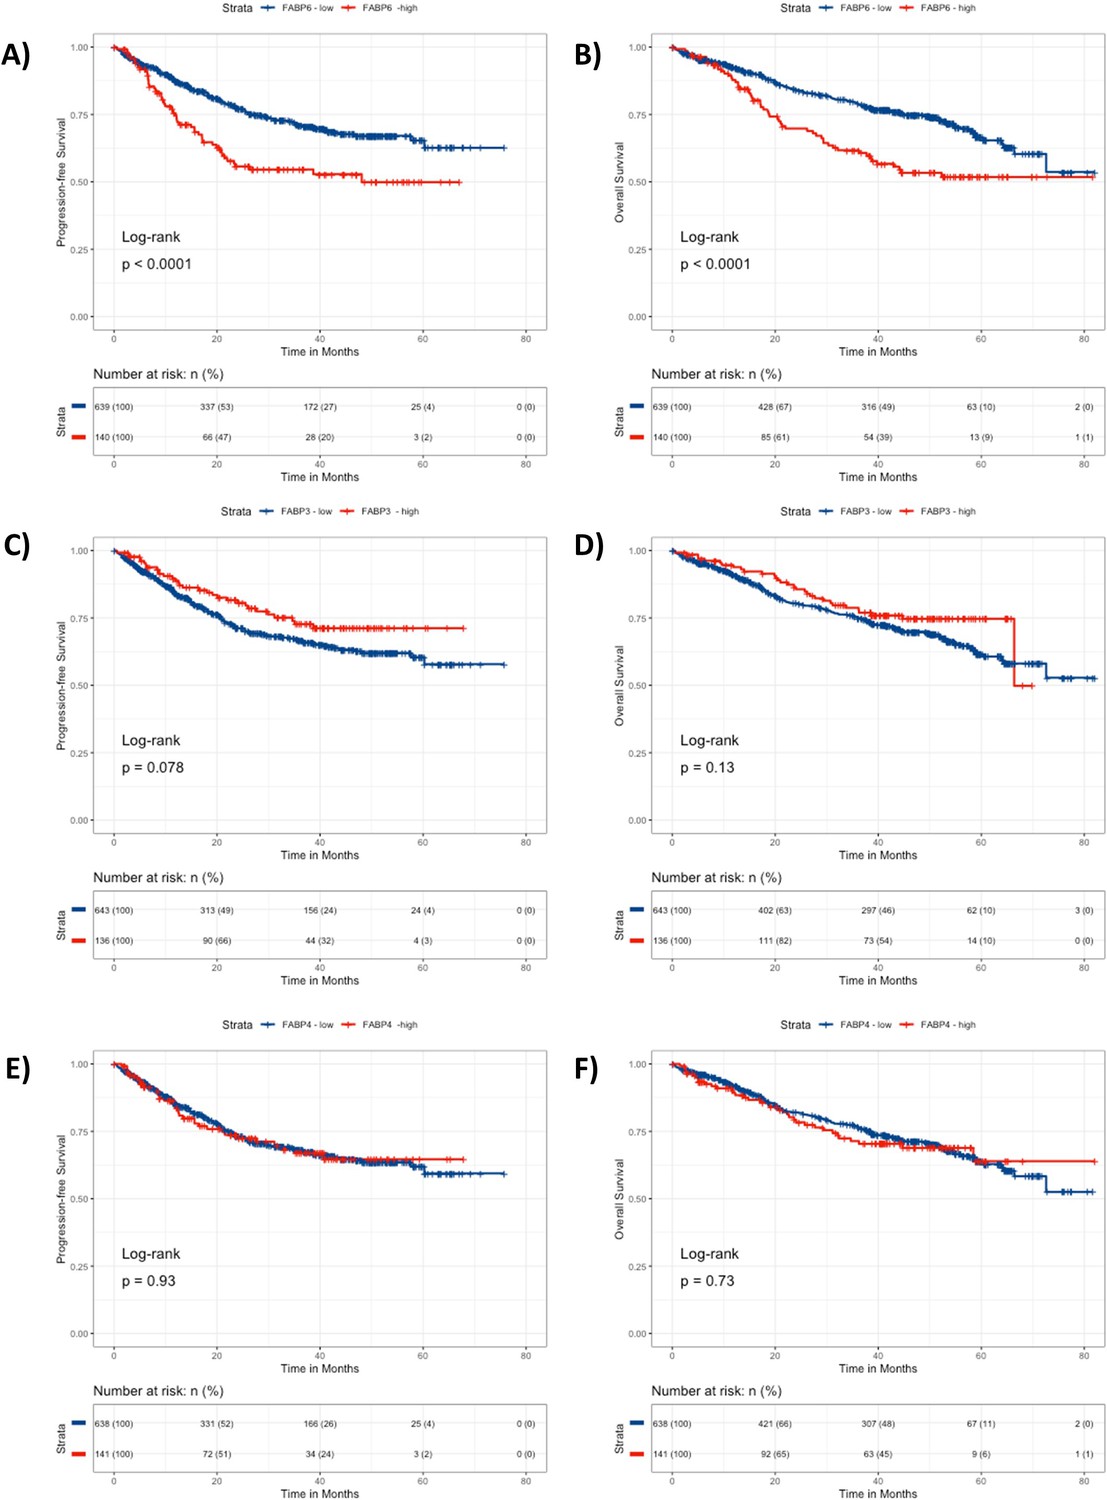
CoMMpass Dataset analysis of FABP6, 3, and 4 demonstrates decreased survival and overall-survival in MM patients with high FABP6 expression in MM cells.
(A). 779 cases total. (A) Progression free survival and (B) Overall survival were significantly shorter for MM patients with high expression of FABP6, with a hazard ratios of 1.48 (95% confidence interval 1.172–1.869) and 1.837 (95% confidence interval 1.347–2.504), respectively. (C) Progression-free survival and (D) Overall survival for MM patients with high vs low expression of FABP3 were not significant. (E) Progression-free survival and (F) Overall survival for MM patients with high vs low expression of FABP4 were not significant.
Author response image 1
Additional files
-
Supplementary file 1
RNAseq values for FABP genes in MM.1S and RPMI8226 cells demonstrated that FABP5 (italic) is the most highly expressed.
- https://cdn.elifesciences.org/articles/81184/elife-81184-supp1-v3.xlsx
-
Supplementary file 2
IC50 of myeloma cell lines treated with various doses overtime with BMS309403.
Data includes the μM and logμM of human and mouse myeloma cell lines at 1, 24, 48, 72 hour timepoints.
- https://cdn.elifesciences.org/articles/81184/elife-81184-supp2-v3.xlsx
-
Supplementary file 3
IC50 of myeloma cell lines treated with various doses overtime with SBFI-26.
Data includes the μM and log μM of human and mouse myeloma cell lines at 1, 24, 48, 72 hour timepoints.
- https://cdn.elifesciences.org/articles/81184/elife-81184-supp3-v3.xlsx
-
Supplementary file 4
List of genes changed by FABP inhibitors in MM.1S cells determined with RNA sequencing.
(A) BMS309403, SBFI-26, and the combination alter gene expression levels. DEGs were determined using a false discovery rate of 0.2.
- https://cdn.elifesciences.org/articles/81184/elife-81184-supp4-v3.xlsx
-
Supplementary file 5
List of canonical pathways changed by FABP inhibitors in MM.1S cells determined by Ingenuity Pathway Analysis (IPA).
The fifteen pathways below were commonly dysregulated in all three treatment groups (BMS309403, SBFI-26, and the combination) compared to vehicle. Significance was determined in each treatment compared to vehicle using IPA default p-value cutoff (P<0.05) and lists of canonical pathways for each treatment group were cross-referenced with one another in Microsoft excel to generate this list.
- https://cdn.elifesciences.org/articles/81184/elife-81184-supp5-v3.xlsx
-
Supplementary file 6
List of upregulated pathways after FABP inhibitor treatment in MM.1S cells determined with RNA sequencing.
(A) STRING revealed biological pathways upregulated after BMS309403, SBFI-26, and the combination treatment. Data filtered based on false discovery rate.
- https://cdn.elifesciences.org/articles/81184/elife-81184-supp6-v3.xlsx
-
Supplementary file 7
List of downregulated pathways after FABP inhibitor treatment in MM.1S cells determined by RNA sequencing.
(A) STRING analysis revealed biological processes downregulated by combination treatment. Data filtered based on false discovery rate.
- https://cdn.elifesciences.org/articles/81184/elife-81184-supp7-v3.xlsx
-
Supplementary file 8
RNA sequencing reveals top 10 downregulated genes with BMS309403 and SBFI-26 treatment.
Data filtered based on false discovery rate.
- https://cdn.elifesciences.org/articles/81184/elife-81184-supp8-v3.xlsx
-
Supplementary file 9
Protein expression changes due to 48 hour exposure to FABP inhibitors in MM.1S cells determined with mass spectrometry.
(A) BMS309403, SBFI-26, and the combination alter gene expression levels. Data determined using |fold change|>1.2, and P-value ≥0.05.
- https://cdn.elifesciences.org/articles/81184/elife-81184-supp9-v3.xlsx
-
Supplementary file 10
List of 162 upregulated proteins after 48 hour exposure to BMS309403 in MM.1S cells determined with mass spectrometry proteomic analysis.
Data determined using |fold change|>1.2, and P-value ≥0.05.
- https://cdn.elifesciences.org/articles/81184/elife-81184-supp10-v3.xlsx
-
Supplementary file 11
List of 51 upregulated proteins after 48 hour exposure to SBFI-26 in MM.1S cells determined with mass spectrometry proteomic analysis.
Data determined using |fold change|>1.2, and P-value ≥0.05.
- https://cdn.elifesciences.org/articles/81184/elife-81184-supp11-v3.xlsx
-
Supplementary file 12
List of 199 upregulated proteins after 48 hour exposure to BMS309403 and SBFI-26 in MM.1S cells determined with mass spectrometry proteomic analysis.
(A) BMS309403, SBFI-26, and the combination alter protein expression levels. Data determined using |fold change|>1.2, and P-value ≥0.05.
- https://cdn.elifesciences.org/articles/81184/elife-81184-supp12-v3.xlsx
-
Supplementary file 13
List of 177 downregulated proteins after 48 hour exposure to BMS309403 in MM.1S cells determined with mass spectrometry proteomic analysis.
Data determined using |fold change|>1.2, and P-value ≥0.05.
- https://cdn.elifesciences.org/articles/81184/elife-81184-supp13-v3.xlsx
-
Supplementary file 14
List of 94 downregulated proteins after 48 hour exposure to SBFI-26 in MM.1S cells determined with mass spectrometry proteomic analysis.
Data determined using |fold change|>1.2, and P-value ≥0.05.
- https://cdn.elifesciences.org/articles/81184/elife-81184-supp14-v3.xlsx
-
Supplementary file 15
List of 215 downregulated proteins after 48 hour exposure to BMS309403 and SBFI-26 in MM.1S cells determined with mass spectrometry proteomic analysis.
Data determined using |fold change|>1.2, and P-value ≥0.05.
- https://cdn.elifesciences.org/articles/81184/elife-81184-supp15-v3.xlsx
-
Supplementary file 16
List of commonly upregulated proteins after 48 hour exposure to FABP inhibitors in MM.1S cells determined with mass spectrometry proteomics.
Data determined using |fold change|>1.2, and P-value ≥0.05.
- https://cdn.elifesciences.org/articles/81184/elife-81184-supp16-v3.xlsx
-
Supplementary file 17
List of commonly downregulated proteins after 48 hour exposure to FABP inhibitors in MM.1S cells determined with mass spectrometry proteomics.
Data determined using |fold change|>1.2, and P-value ≥0.05.
- https://cdn.elifesciences.org/articles/81184/elife-81184-supp17-v3.xlsx
-
Supplementary file 18
List of top 10 most significant upstream regulators predicted from IPA analysis of proteomic data in MM.1S cells exposed to BMS309403.
- https://cdn.elifesciences.org/articles/81184/elife-81184-supp18-v3.xlsx
-
Supplementary file 19
List of top 10 most significant upstream regulators predicted from IPA analysis of proteomic data in MM.1S cells exposed to SBFI-26.
- https://cdn.elifesciences.org/articles/81184/elife-81184-supp19-v3.xlsx
-
Supplementary file 20
List of top 10 most significant upstream regulators predicted from IPA analysis of proteomic data in MM.1S cells exposed to BMS309403 +SBFI-26.
- https://cdn.elifesciences.org/articles/81184/elife-81184-supp20-v3.xlsx
-
Supplementary file 21
171 Molecules dysregulated by MYC with BMS309403 as identified by Ingenuity Pathway Analysis from RNAseq data.
- https://cdn.elifesciences.org/articles/81184/elife-81184-supp21-v3.xlsx
-
Supplementary file 22
Pearson Correlation Table of FABP5 correlation with other genes in the CoMMpass MMRF dataset.
Only top 30 genes shown.
- https://cdn.elifesciences.org/articles/81184/elife-81184-supp22-v3.xlsx
-
Supplementary file 23
Antibody staining for western blotting.
CST (Cell Signaling Technologies).
- https://cdn.elifesciences.org/articles/81184/elife-81184-supp23-v3.xlsx
-
Supplementary file 24
Primers used for reverse-transcriptase PCR.
Forward (Fwd), Reverse (Rev); citation used if applicable.
- https://cdn.elifesciences.org/articles/81184/elife-81184-supp24-v3.xlsx
-
MDAR checklist
- https://cdn.elifesciences.org/articles/81184/elife-81184-mdarchecklist1-v3.pdf
-
Source data 1
Western blot raw data for MM1S stained for FABP5 or Myc, and 5TGM1-TK cells stained for Myc as labeled.
- https://cdn.elifesciences.org/articles/81184/elife-81184-data1-v3.zip
Download links
A two-part list of links to download the article, or parts of the article, in various formats.
Downloads (link to download the article as PDF)
Open citations (links to open the citations from this article in various online reference manager services)
Cite this article (links to download the citations from this article in formats compatible with various reference manager tools)
Targeting the fatty acid binding proteins disrupts multiple myeloma cell cycle progression and MYC signaling
eLife 12:e81184.
https://doi.org/10.7554/eLife.81184


