Mobilome-driven segregation of the resistome in biological wastewater treatment
- Systems Ecology Group, Luxembourg Centre for Systems Biomedicine, University of Luxembourg, Luxembourg
- Bioinformatics Core, Luxembourg Centre for Systems Biomedicine, University of Luxembourg, Luxembourg
- Department of Life Sciences and Medicine, Faculty of Science, Technology and Medicine, University of Luxembourg, Luxembourg
Figures
Figure 1 with 1 supplement
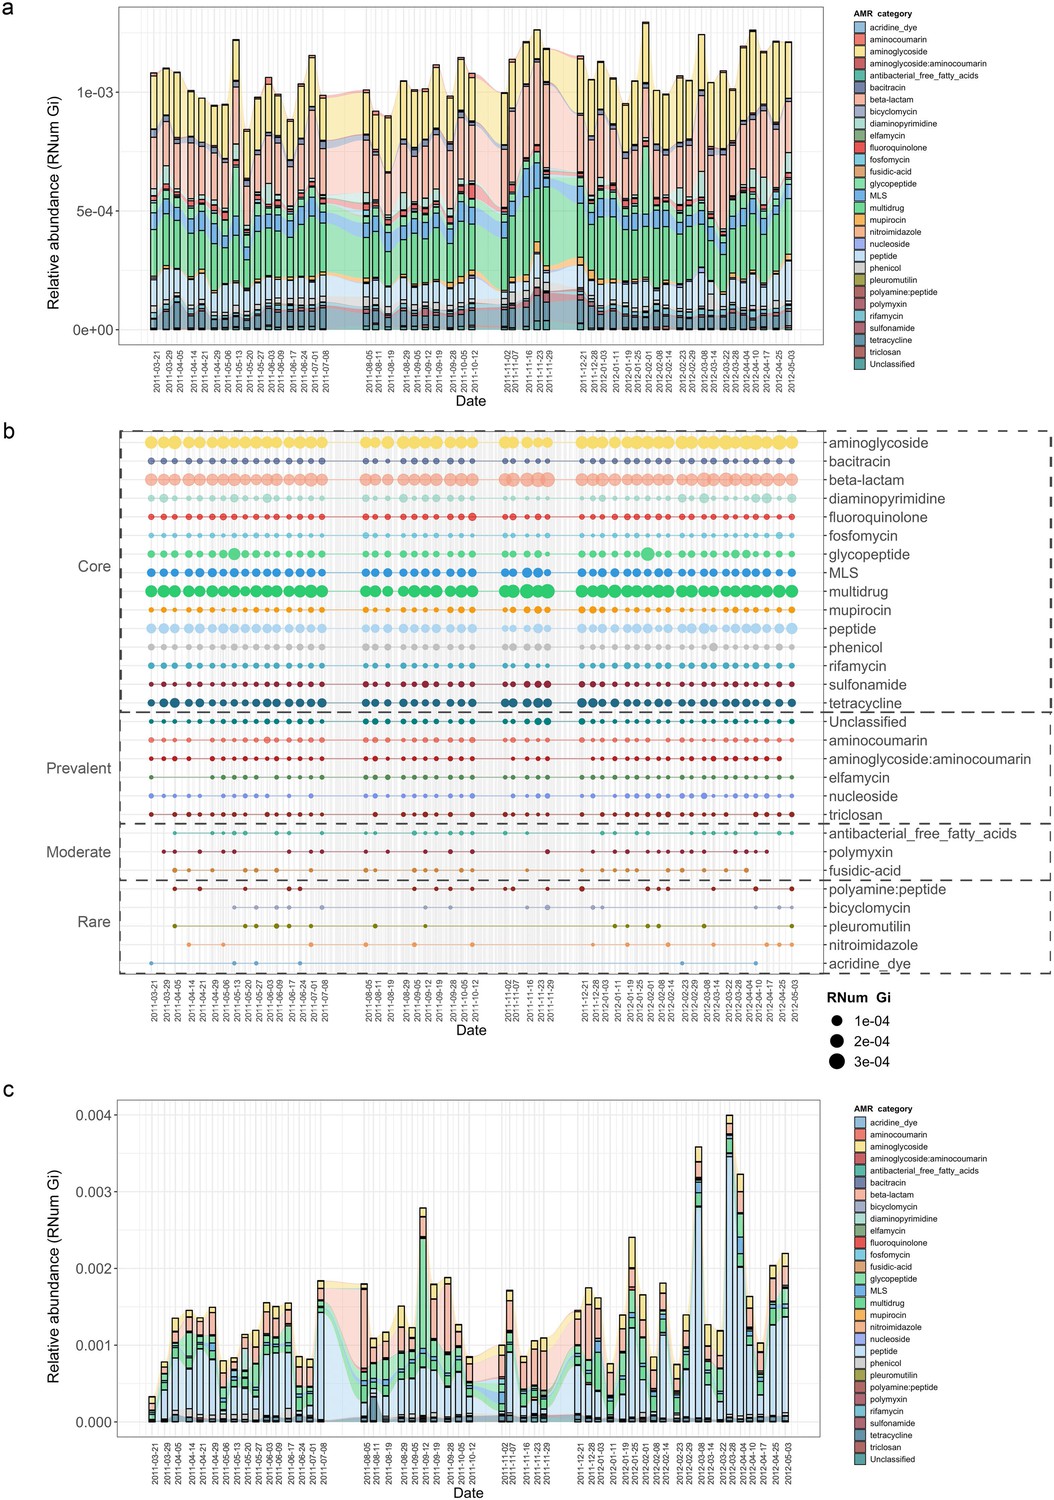
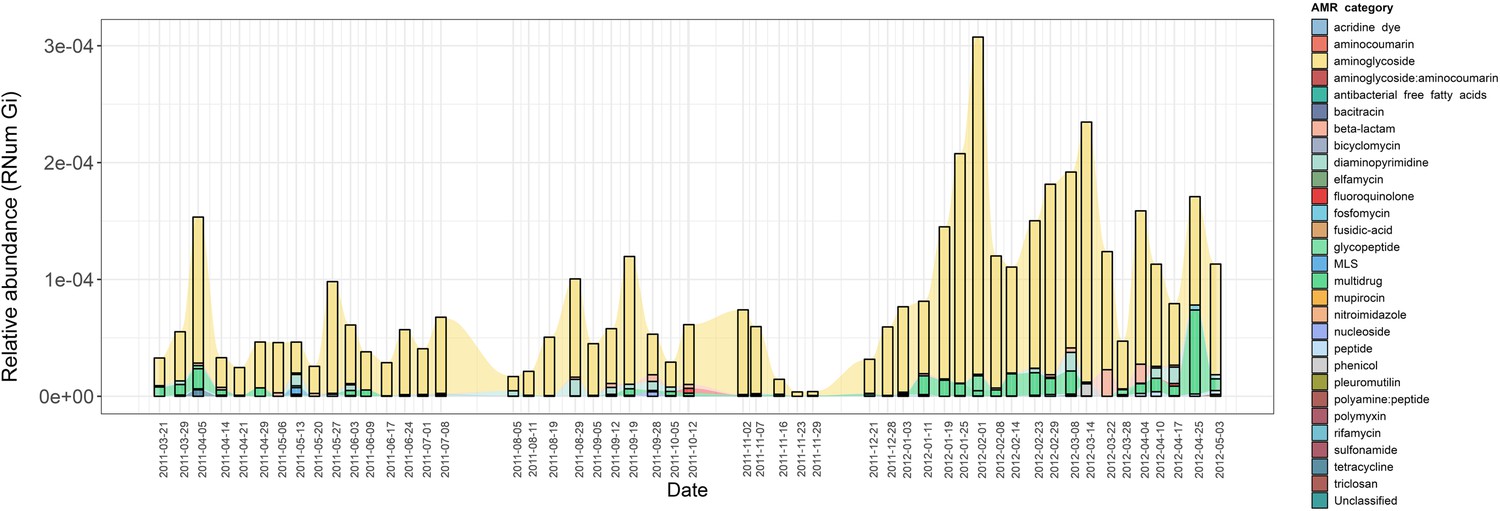
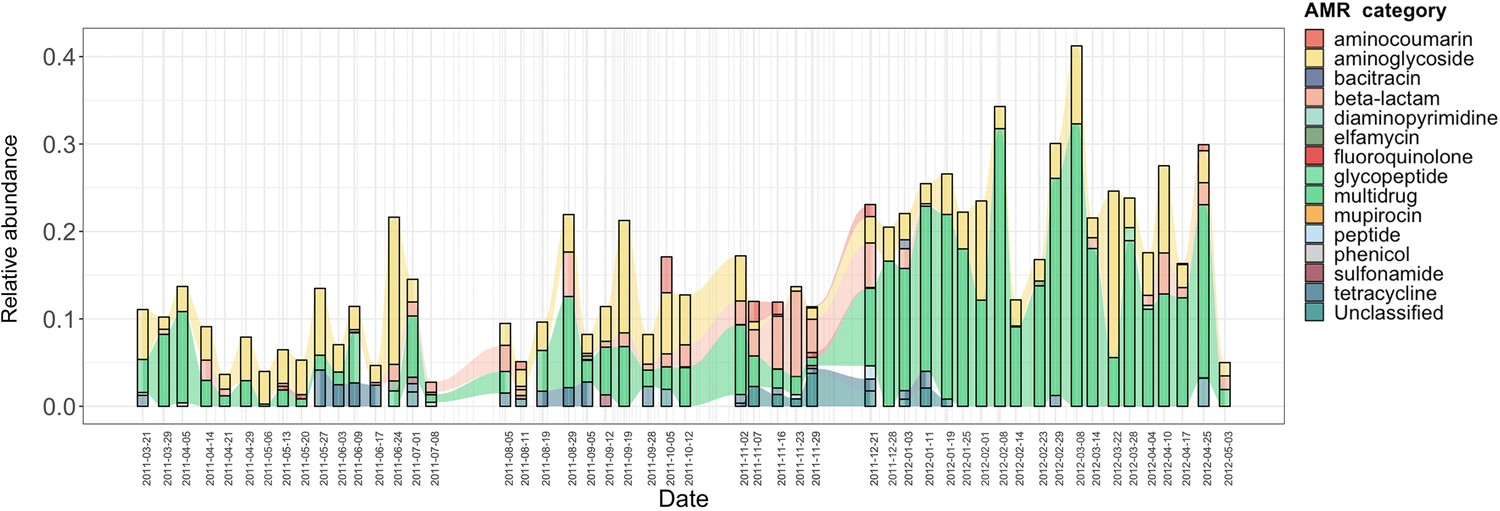
Longitudinal metagenomic and metatranscriptomic assessment of AMR.
(a) ARG relative abundances over time within the BWWTP. (b) AMR categories at various timepoints categorized in four distinct groups based on presence/absence: Core (all timepoints), Prevalent (>75% of timepoints), Moderate (50–75% of timepoints), and Rare (<50% of all timepoints). (c) Relative abundance levels of expressed AMR categories over time within the BWWTP. Colors of all panels correspond to the AMR categories.
Figure 1—figure supplement 1
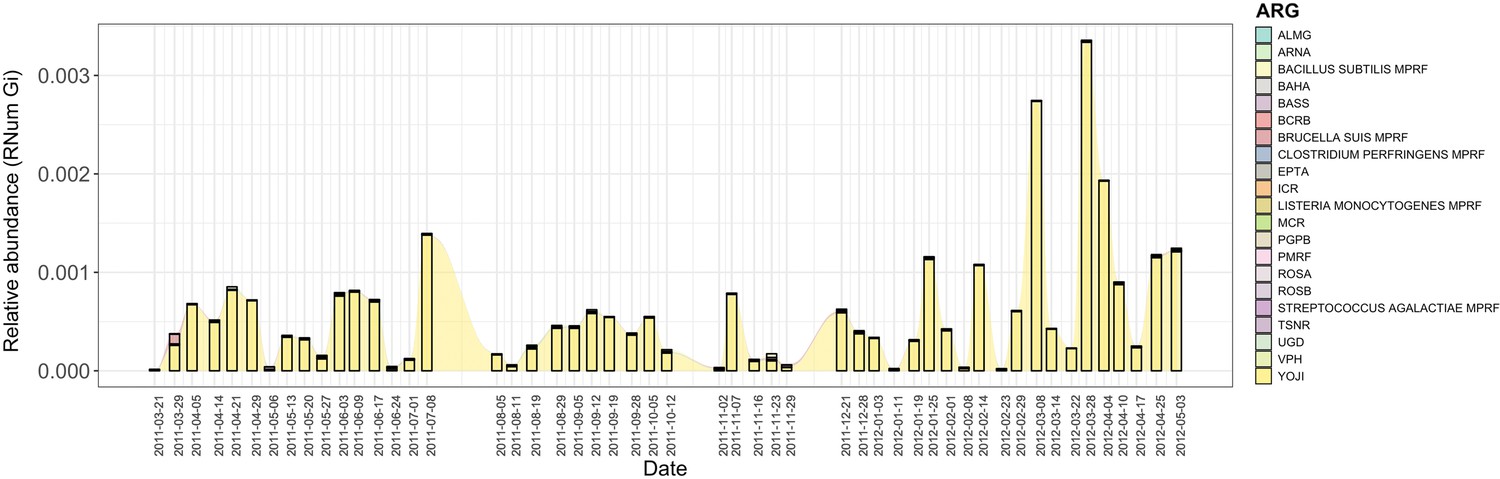
Expression levels of individual ARGs.
Expression levels of individual ARGs contributing to peptide resistance over time within the BWWTP, with colors corresponding to the individual ARGs.
Figure 2 with 2 supplements
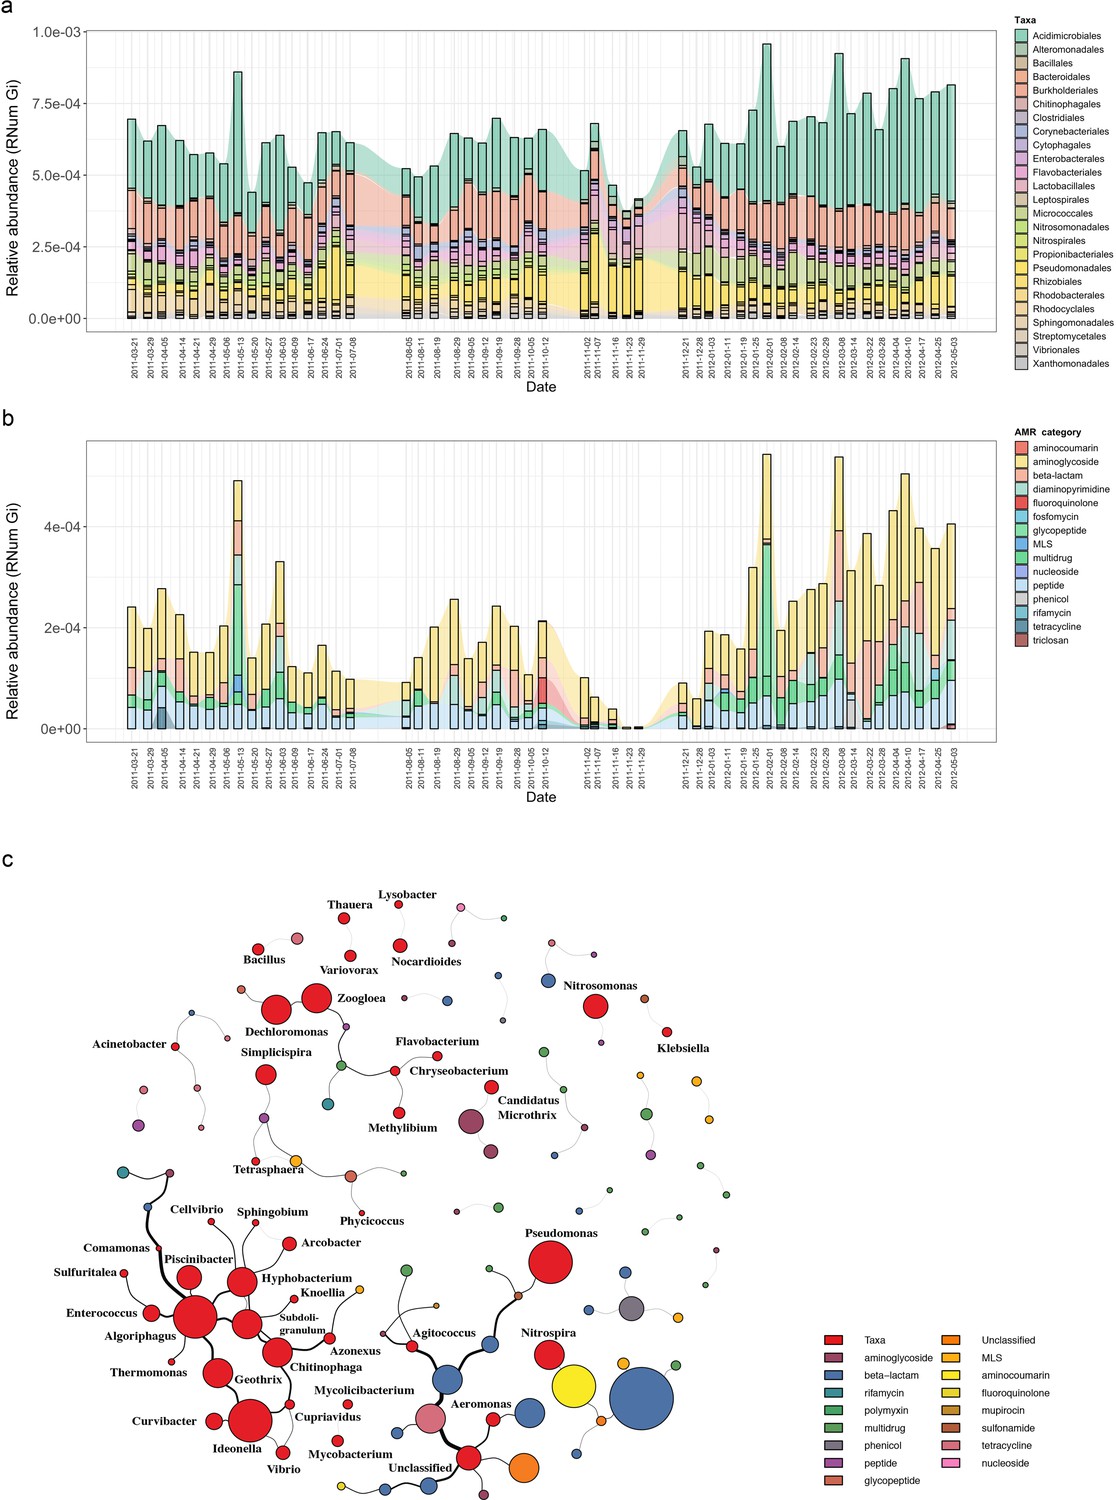
Microbial population-linked AMR.
(a) Longitudinal ARG relative abundance levels linked to their corresponding microbial taxa (order level). Colors correspond to AMR categories. (b) Relative abundance of AMR categories linked to Candidatus Microthrix parvicella with colors corresponding to AMR categories. (c) Association network depicting co-occurrence patterns of individual antimicrobial resistance genes (ARGs) and microbial taxa on genus level. Nodes represent taxa or ARG with the node size representing the number of edges. The size of the edges represent the strength of interaction between the nodes.
Figure 2—figure supplement 1
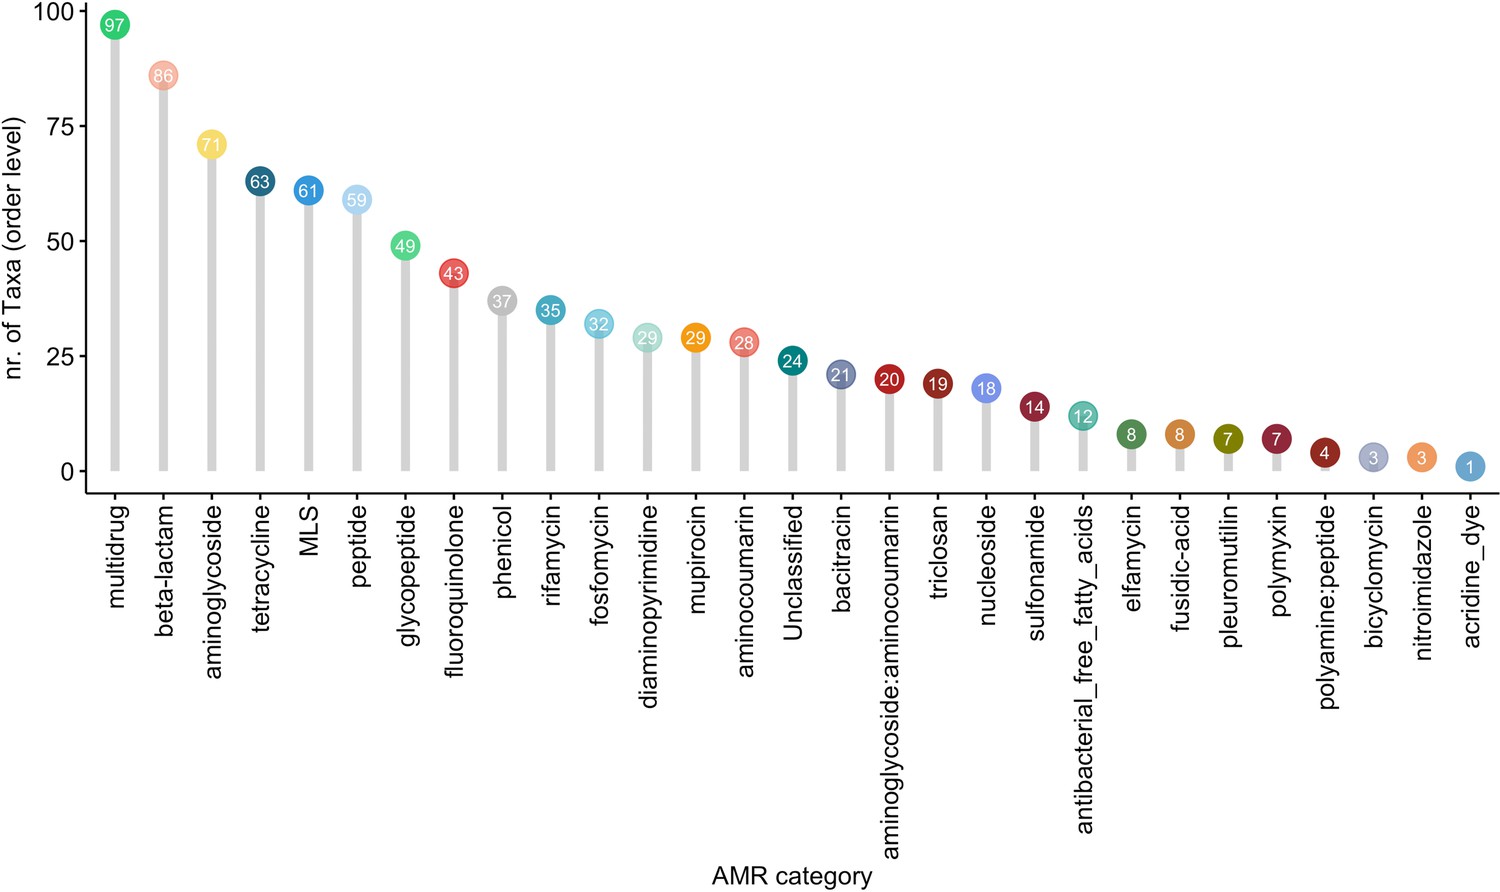
Taxonomic diversity of AMR.
The plot indicates the number of taxa (order level) in which the corresponding AMR categories are identified. Numbers of taxa are highlighted at the top of each bar, with colors corresponding to the AMR categories, as visualized by the same colors in all figures, on the x-axis.
Figure 2—figure supplement 2
Expressed AMR categories of Candidatus Microthrix parvicella.
Expression levels of AMR categories linked to Candidatus Microthrix parvicella over time. Colors correspond to the AMR categories.
Figure 3
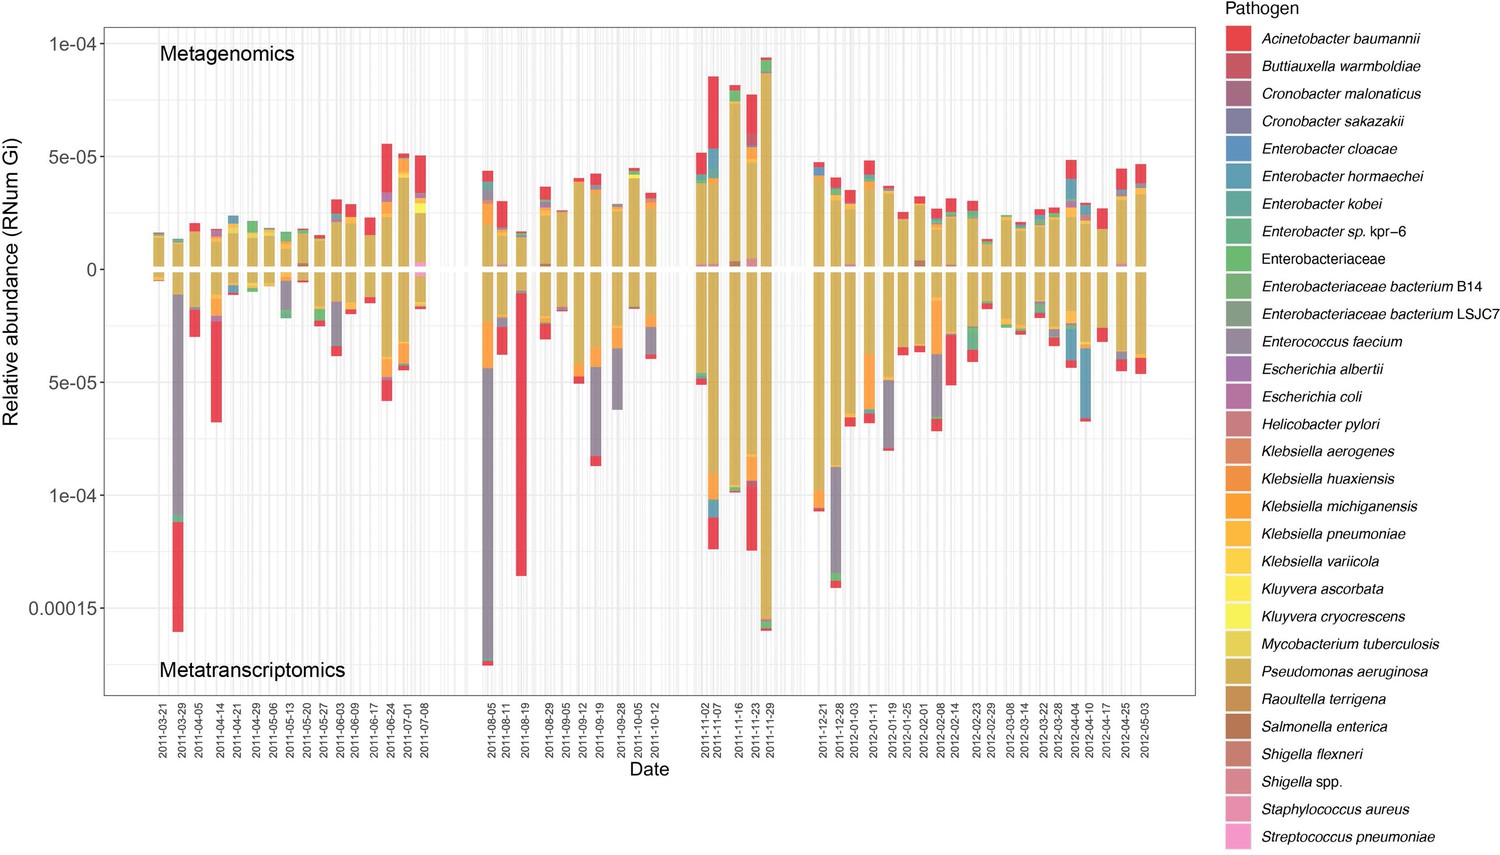
Assessment of AMR associated with clinical pathogens.
ARG relative abundances encoded and expressed by clinical pathogens over time within the BWWTP, with colors corresponding to the identified pathogens.
Figure 4 with 2 supplements
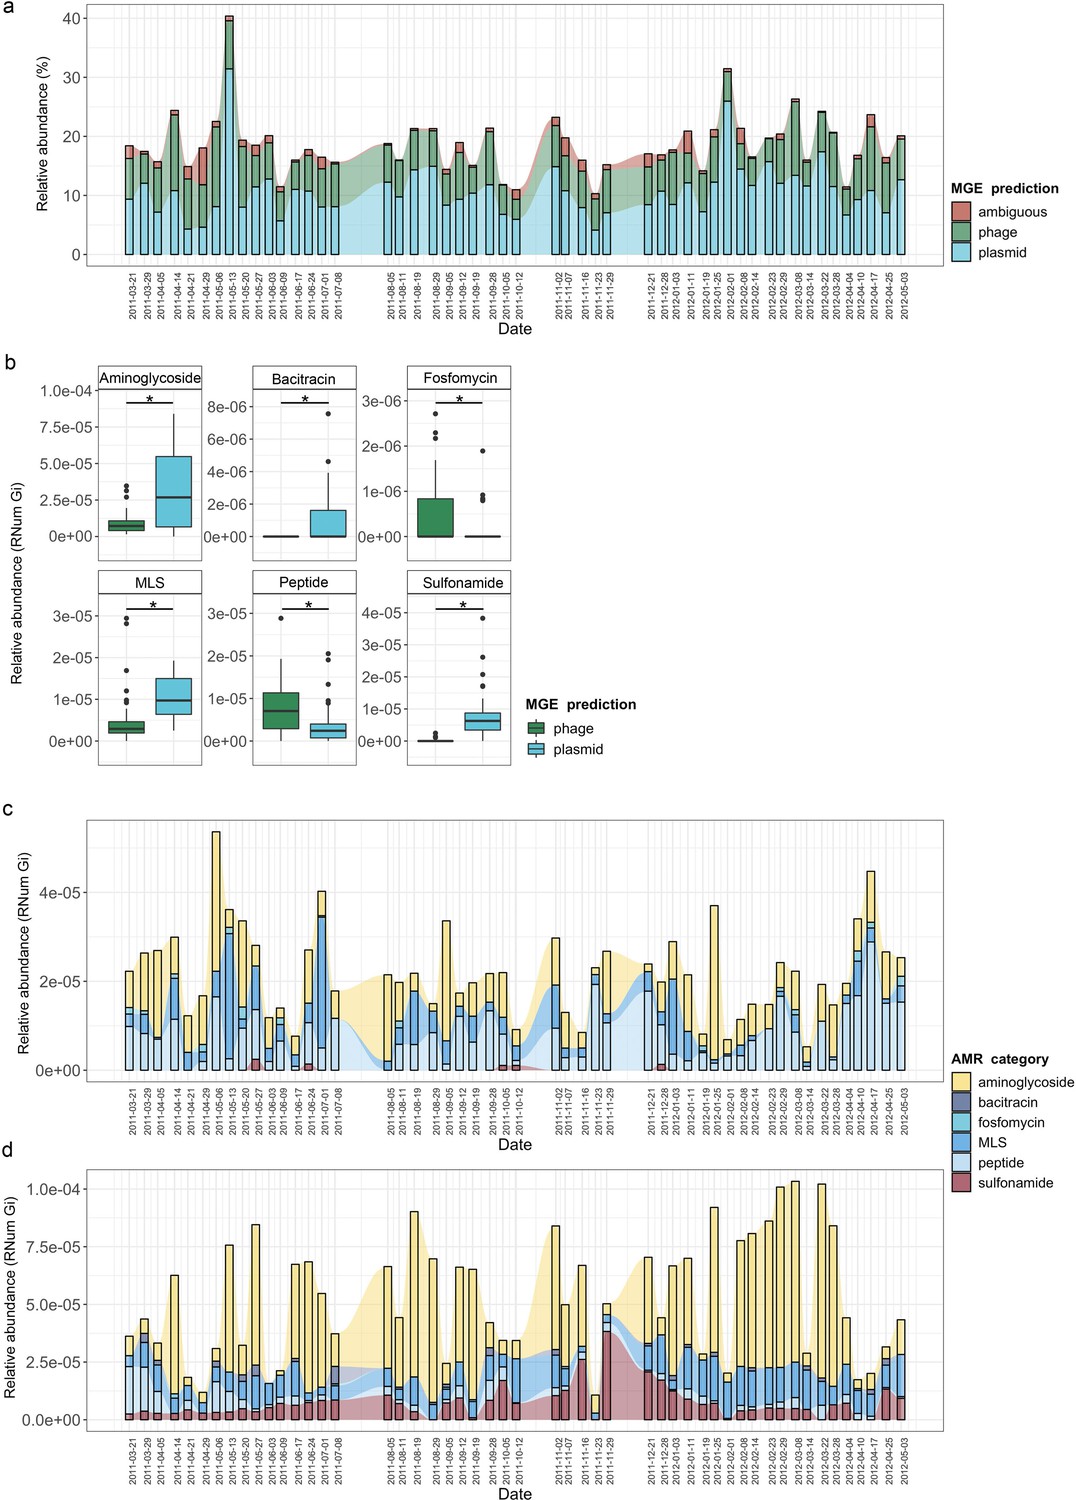
MGE-derived AMR within the BWWTP resistome.
(a) Overall relative abundance of MGEs encoding ARGs. Contribution of plasmids to AMR (average of 10.8% of all ARGs) was found significantly increased compared to phages (average of 6.8% of all ARGs) (adj.p <0.05, One-way ANOVA). Colors depict the different MGE predictions (phage, plasmid, ambiguous) (b) Boxplots depicting significant (adj.p < 0.05, Two-way ANOVA) differential abundances of ARGs encoded by plasmids (blue) vs phages (green). (c) Relative abundance of the six significantly different AMR categories encoded on phages over time, with colors corresponding to AMR categories. (d) Relative abundance of the six significantly different AMR categories encoded on plasmids over time, with colors corresponding to AMR categories.
Figure 4—figure supplement 1
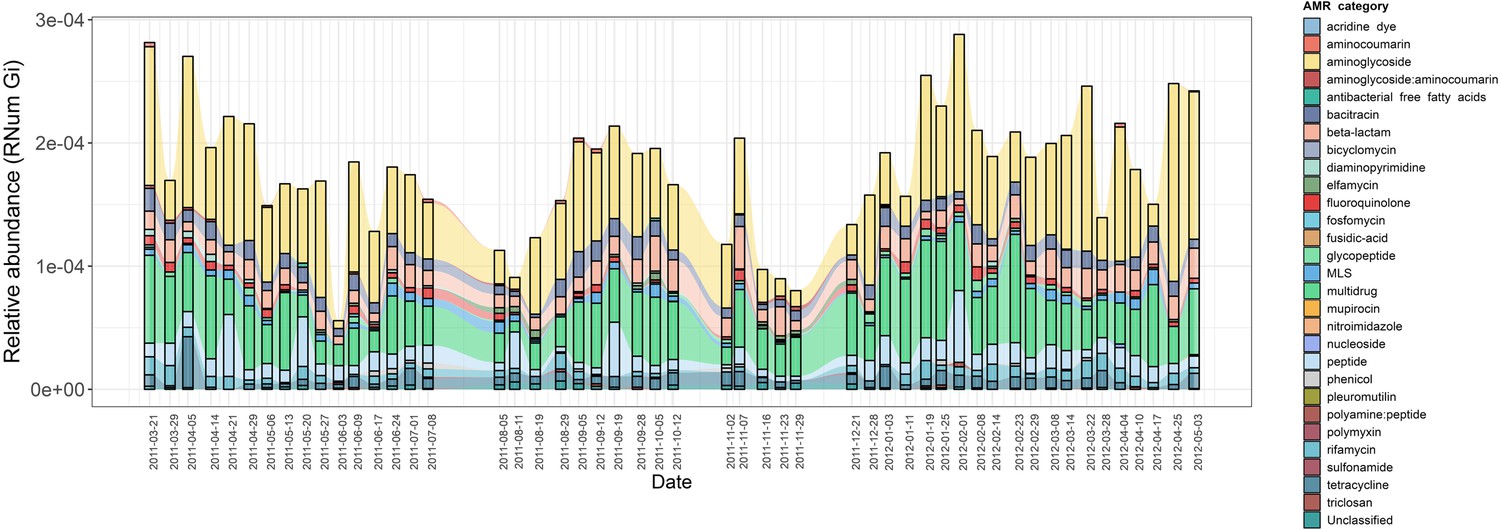
Partitioning of MGEs through AMR.
Alluvial plot depicting relative abundances of chromosomally encoded ARGs over time, with colors depicting the AMR categories.
Figure 4—figure supplement 2
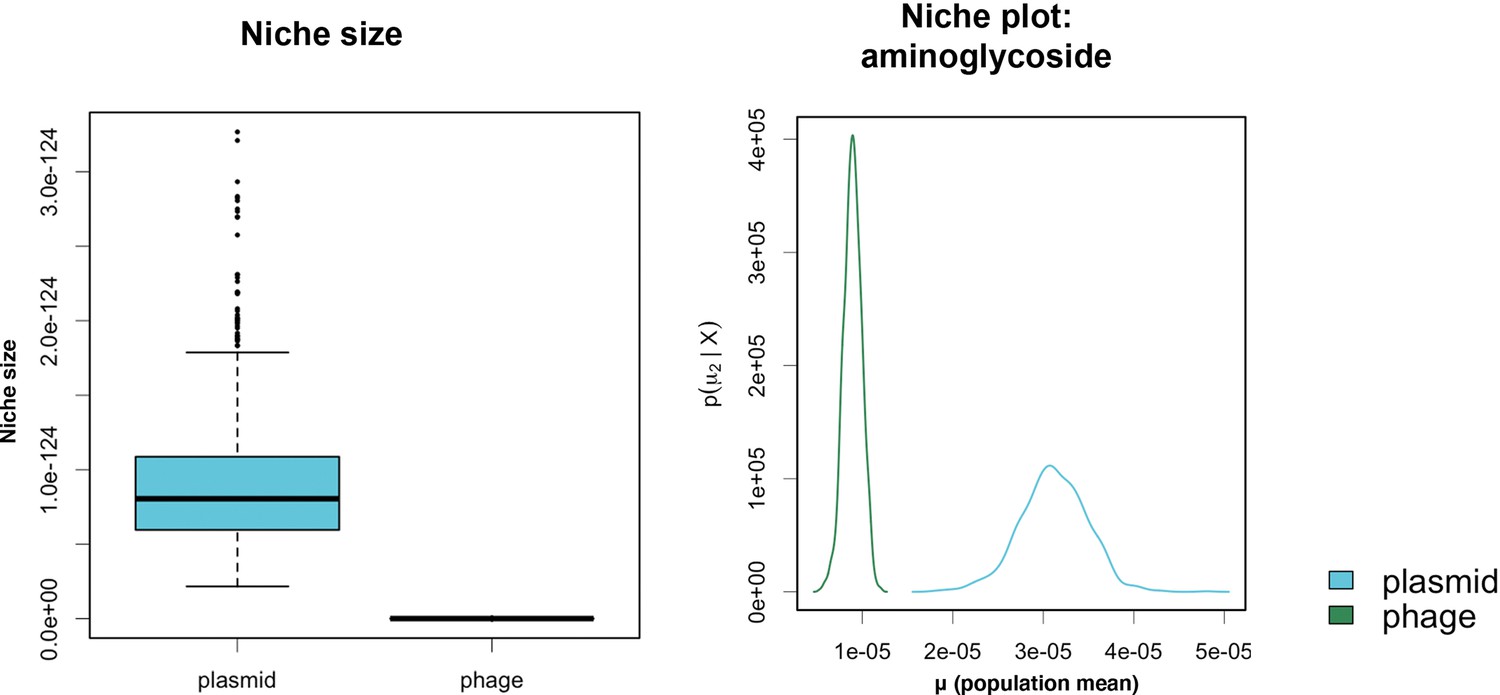
Chromosomal-derived AMR.
The boxplots indicate the niche sizes (left) for the MGEs (plasmids and phages) based on metagenomic data. Niche plots (right) reveal that plasmids (blue) tend to differentiate from phages (green) based on their capacity to encode for aminoglycoside resistance (n=51 per group).
Figure 5 with 2 supplements
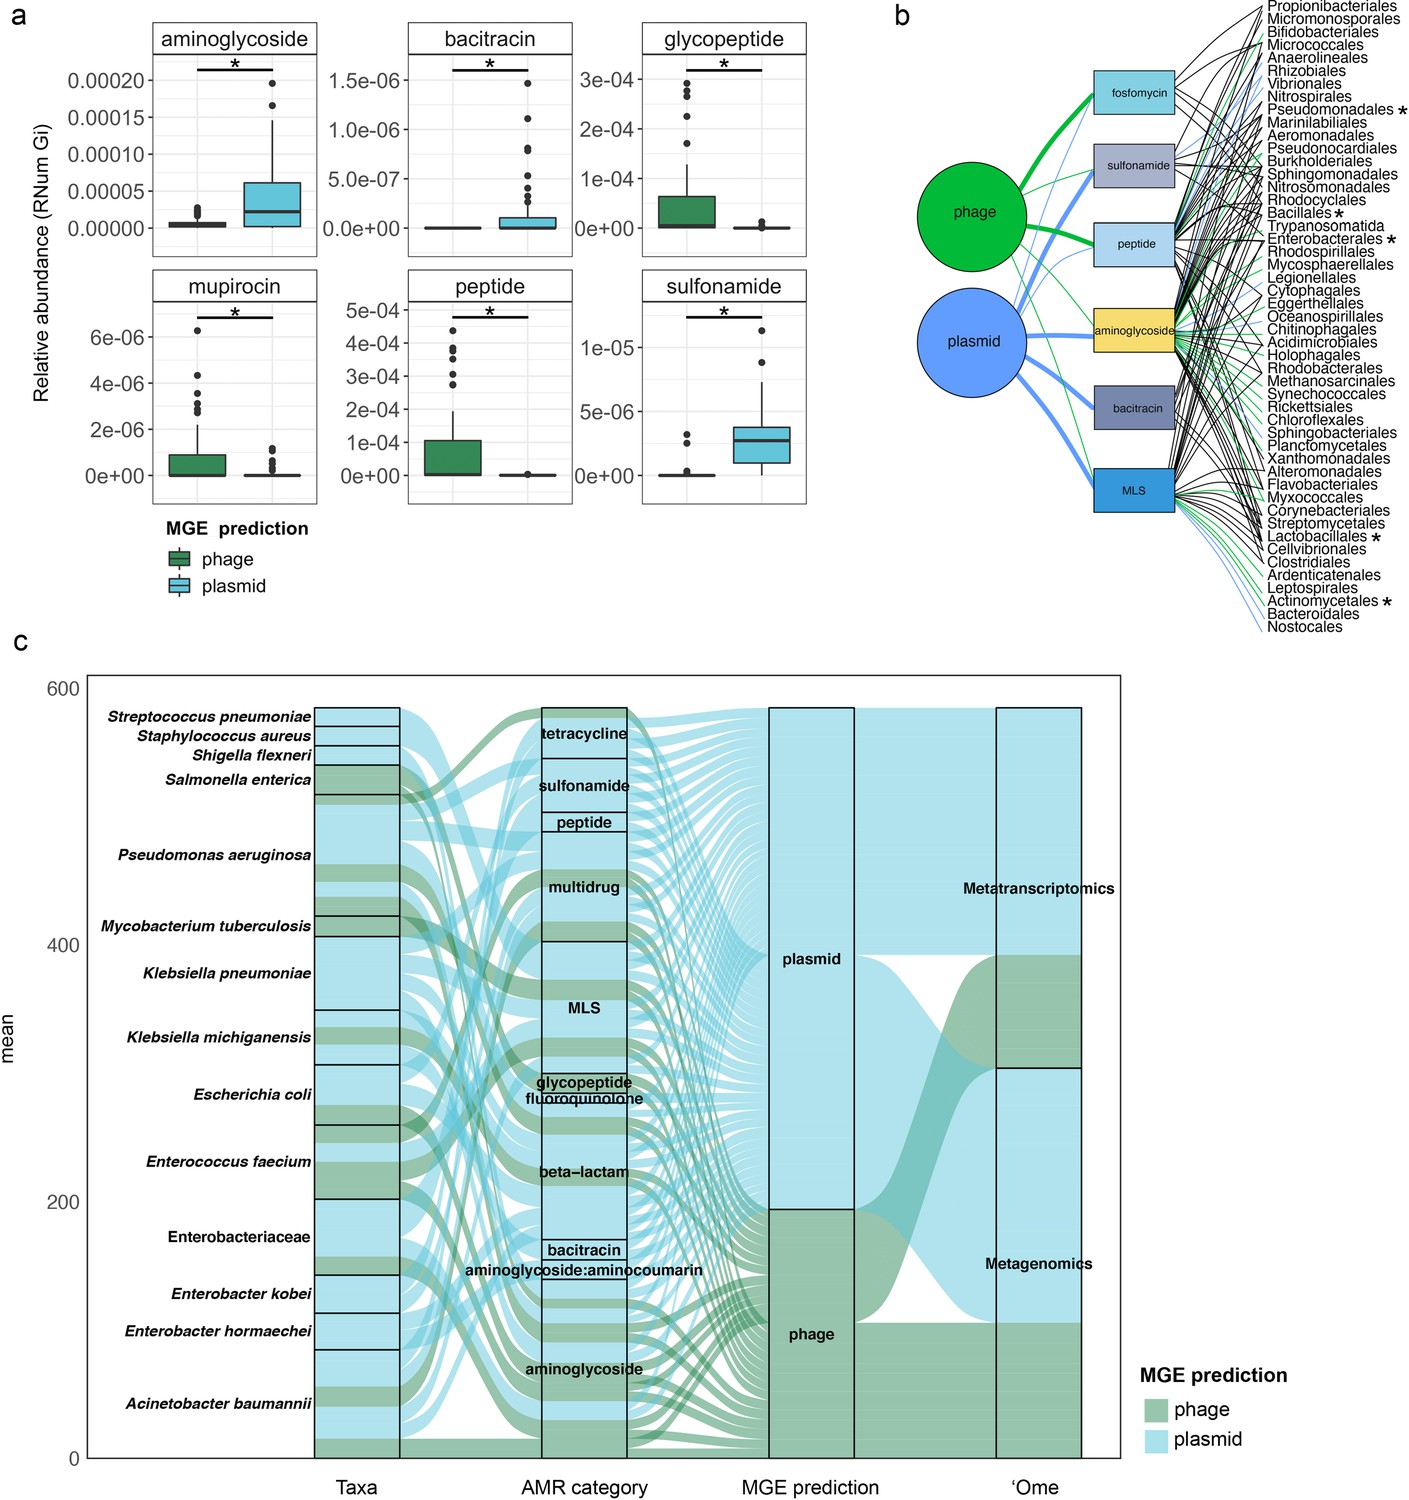
Taxonomic affiliations of MGE-derived resistance genes.
(a) Boxplot depicting significant differential abundance (n=51 per group, adj.p <0.05, Two-way ANOVA) of ARGs expressed in plasmids vs phages. (b) Tripartite network assessing the association of MGE-derived ARGs with the microbial taxa. Thickness of the lines representing potential niche-partitioning of the AMR category to one MGE over the other. Color of the line representing which MGE the AMR is linked to: green (phage), blue (plasmid) or black (both phage and plasmid). Asterisk denominates taxonomic orders which include known clinical pathogens. (c) Alluvial plot depicting the mean abundance (log10) of MGE-derived ARGs encoded (metagenome) and/or expressed (metagenome) by clinical pathogens. Colors of all panels correspond to the MGEs and AMR categories.
Figure 5—figure supplement 1
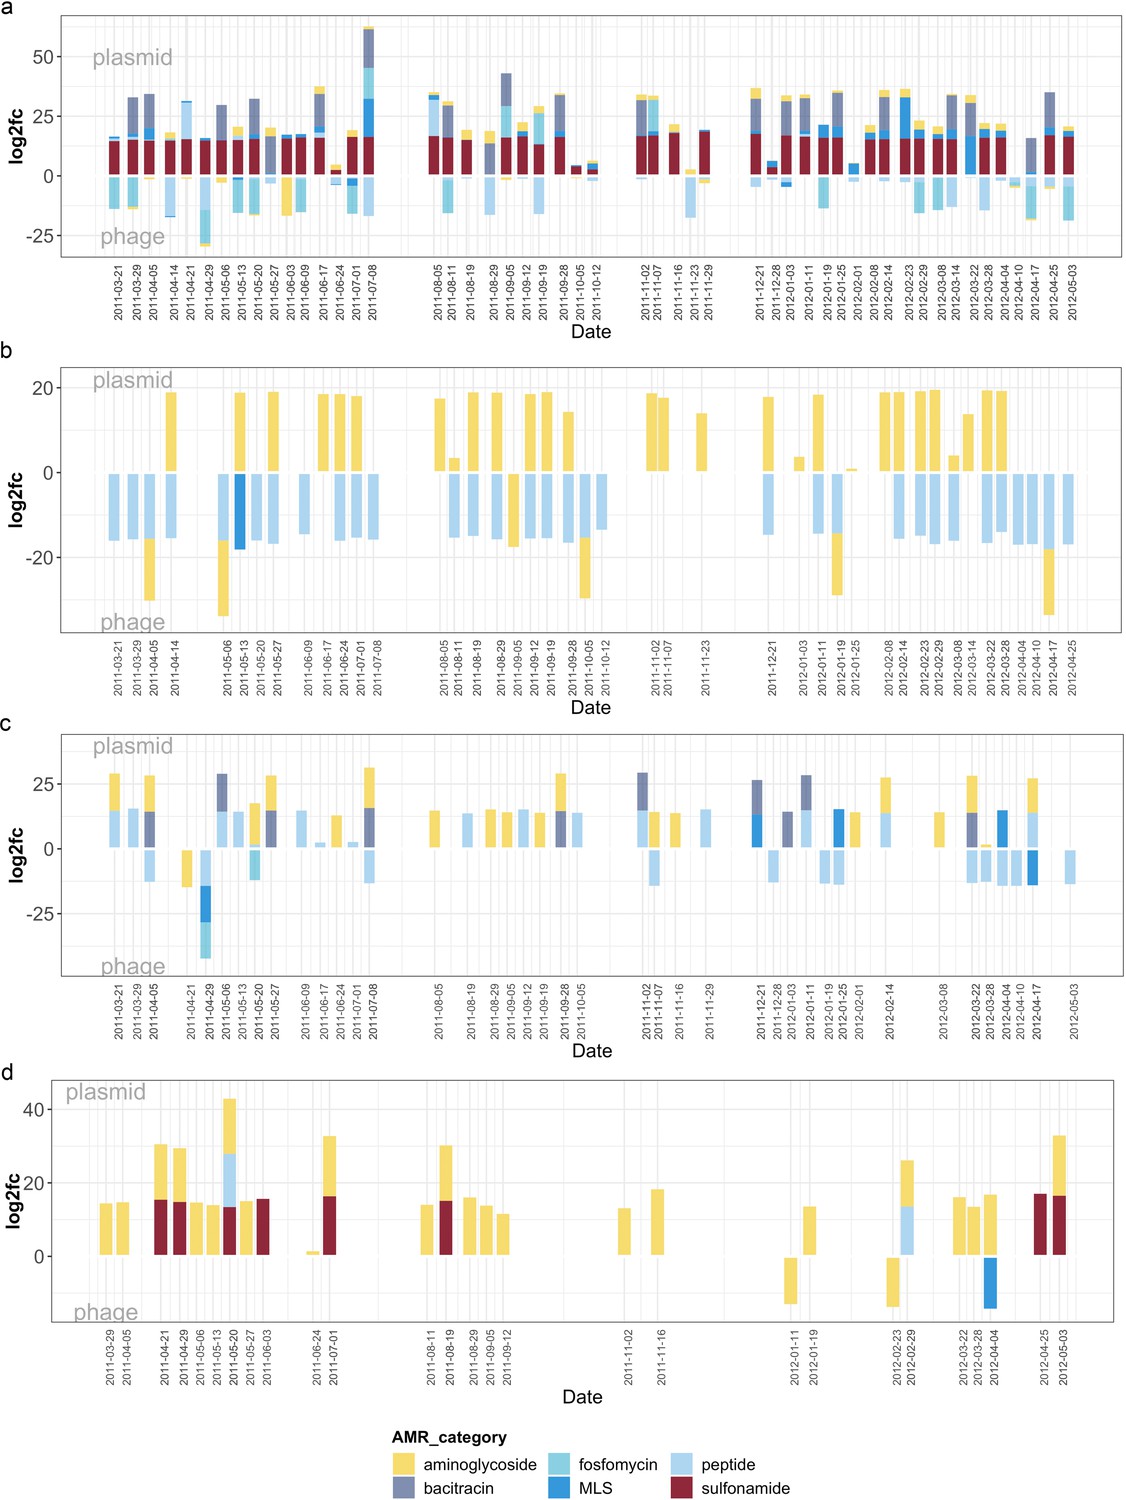
Differential ARG abundance in MGEs.
The barplot reports the log2 fold change (log2fc) of the relative abundance of AMR categories over time in MGEs (plasmid versus phage) in: (a) the general microbial population, (b) M. parvicella, (c) Pseudomonas spp. And (d) Comamonas spp. Colors of all panels correspond to the AMR categories.
Figure 5—figure supplement 2
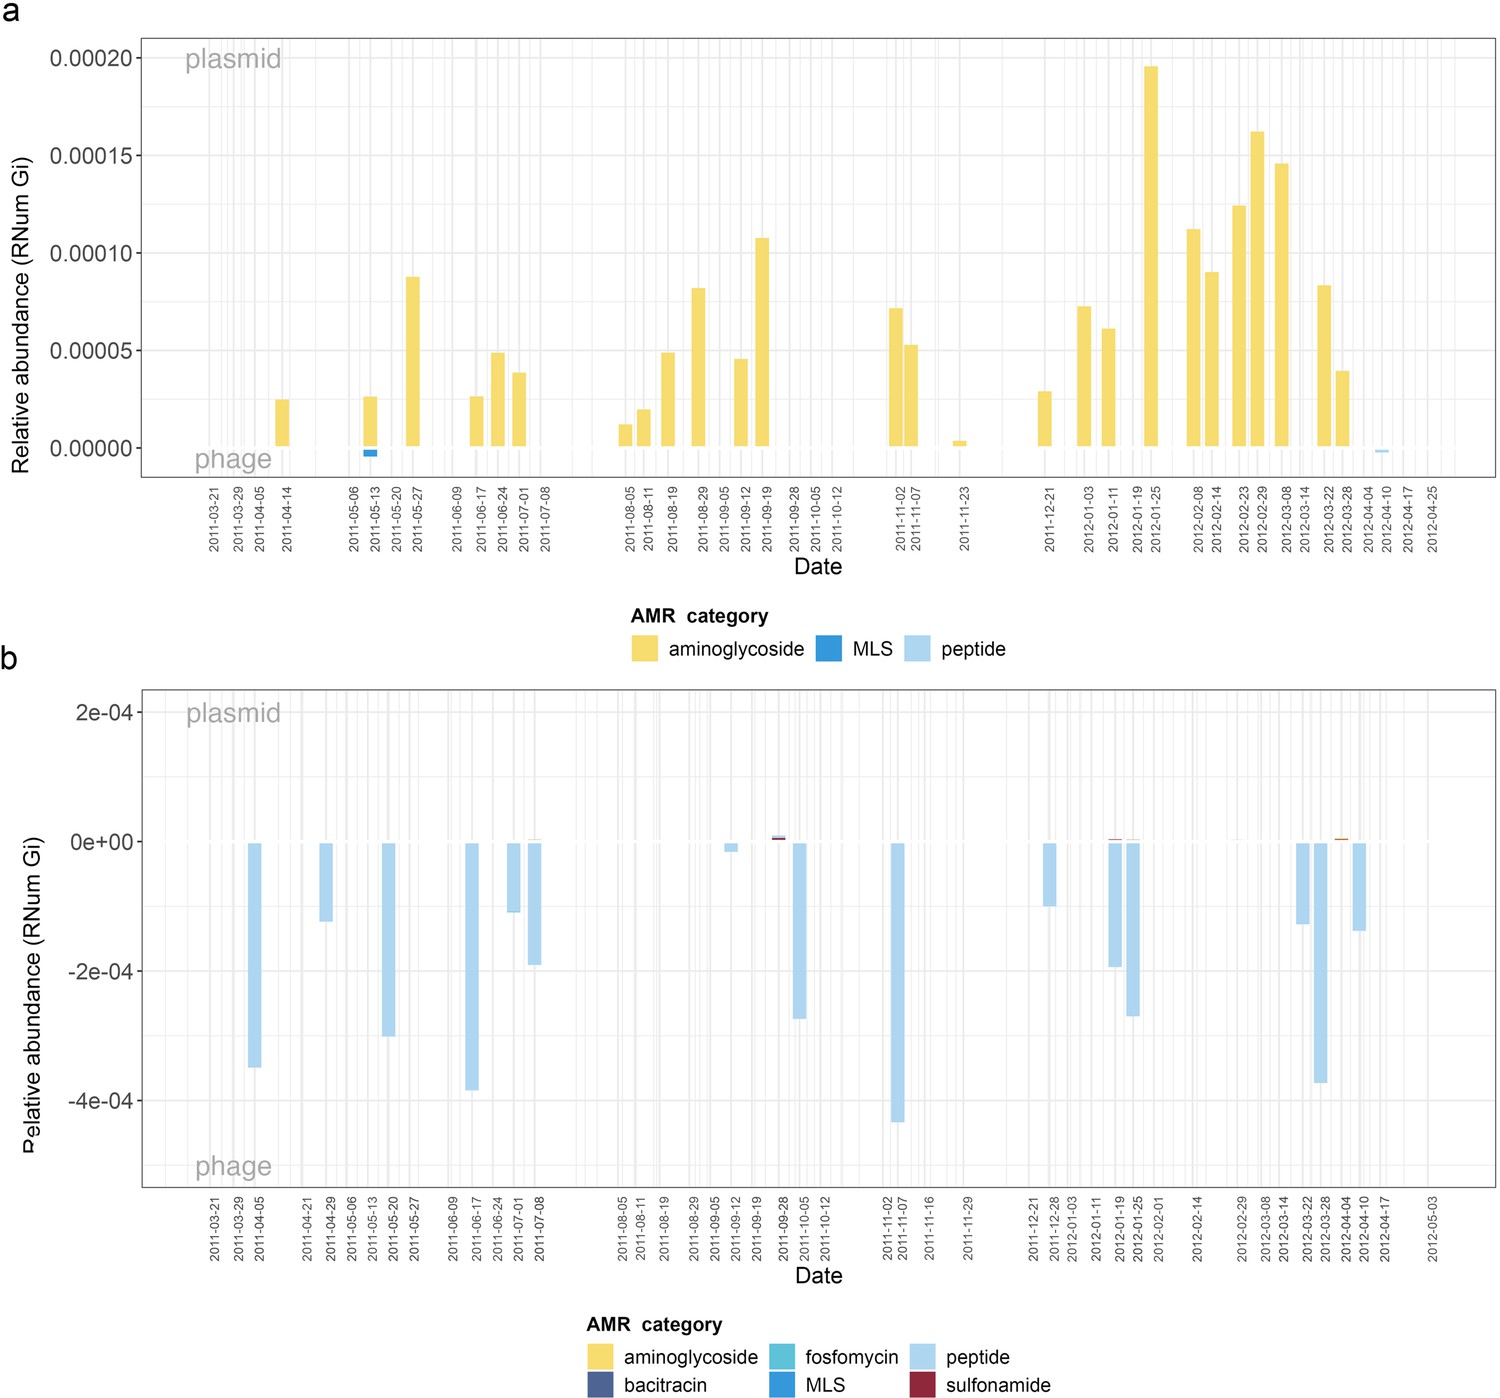
Expression of AMR categories in MGEs.
The barplot reports the expression levels of AMR categories over time in MGEs (plasmid versus phage) in: (a) Acidimicrobiales, and (b) Burkholderiales. Colors of all panels correspond to the AMR categories.
Figure 6 with 1 supplement
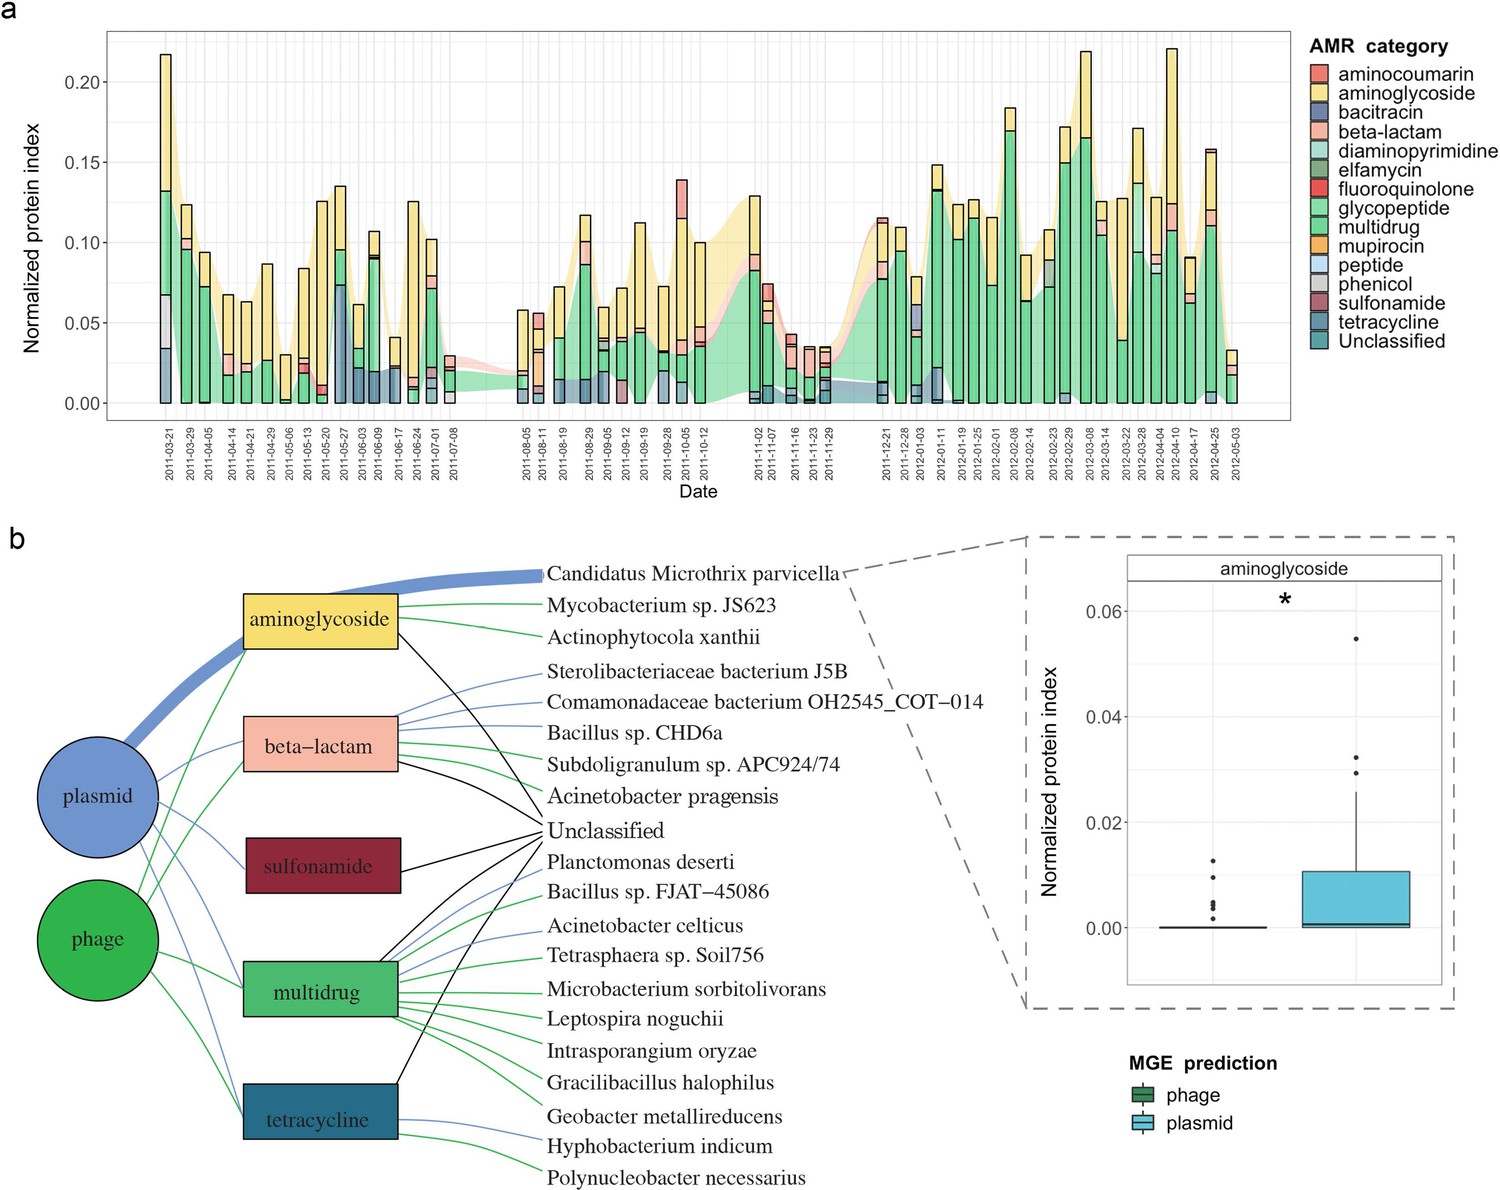
Integrative multi-omic assessment of AMR.
(a) Metagenomic and metatranscriptomic normalized protein levels linked to AMR within the WTTP over time. (b) Tripartite network assessing the normalized protein levels derived from MGEs and associated taxa. Boxplots depicting significant differential (n=51 per group, adj.p <0.05, Two-way ANOVA) abundance of aminoglycoside resistance in plasmid versus phage in Candidatus Microthrix parvicella as well as overall. Colors of all panels correspond to the MGEs and AMR categories.
Figure 6—figure supplement 1
AMR protein abundances.
Barplot depicting protein abundances of various AMR categories over time. Colors correspond to the AMR categories.
Figure 7
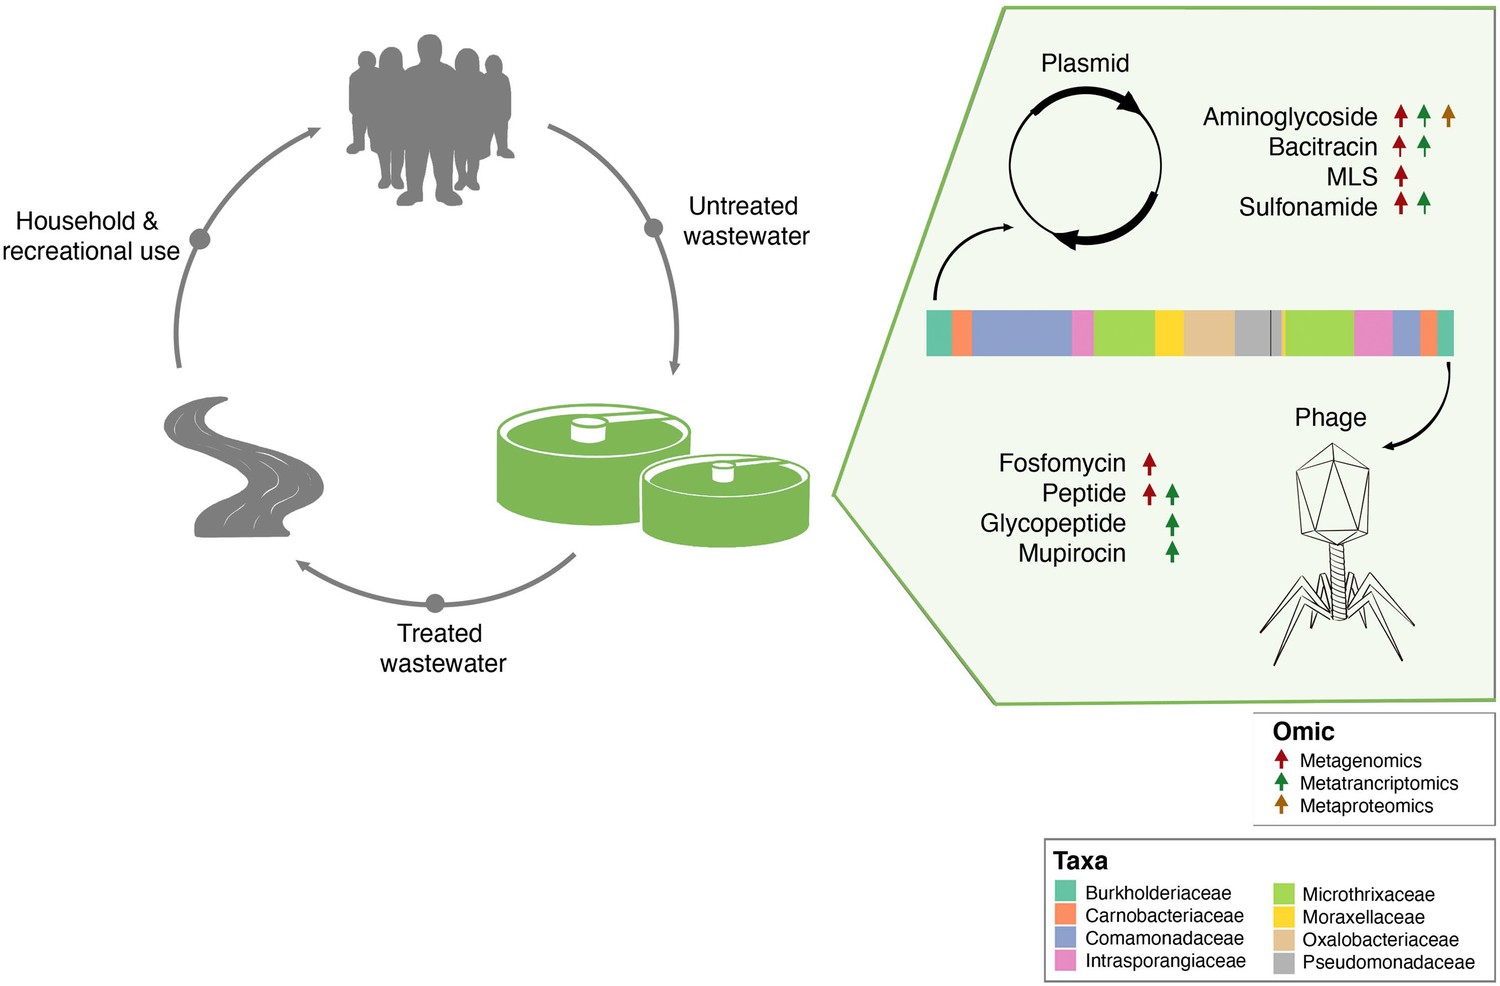
Separation of MGE-derived AMR within the BWWTP.
A graphical summary highlighting AMR categories found significantly increased in phage versus plasmid in all three omes.
Figure 8
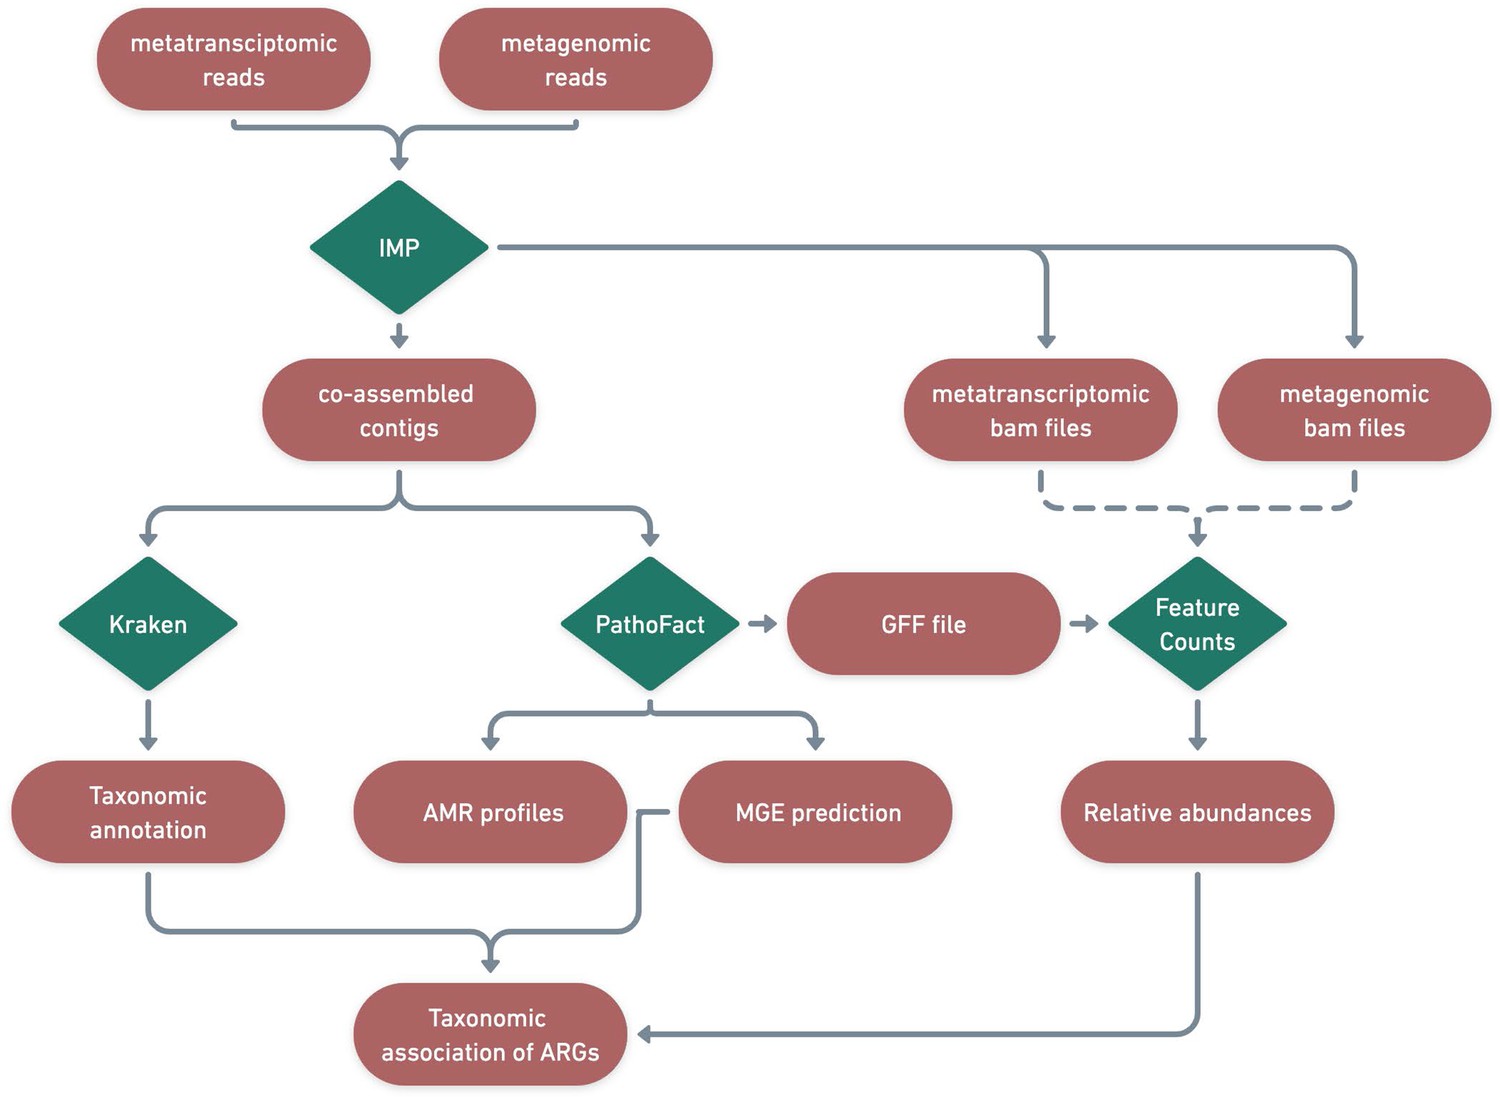
Identification of ARGs and contextualization of MGEs in relation to taxa.
A schematic diagram depicting the bioinformatic workflow to identify ARGs and the subsequent contextualization of MGEs in relation to microbial taxa. The green features represent the different tools and pipelines used while the red features highlight the data used and generated in this process.
Tables
Table 1
WHO priority list for research and development of new antibiotics for antibiotics-resistant bacteria (Tacconelli et al., 2018).
| Bacteria | Priority | Organism detected | Resistance detected |
|---|---|---|---|
| Acinetobacter baumannii | Critical | + | + |
| Pseudomonas aeruginosa | Critical | + | + |
| Enterobacteriaceae | Critical | + | + |
| Enterococcus faecium | High | + | + |
| Staphylococcus aureus | High | + | + |
| Helicobacter pylori | High | + | + |
| Campylobacter spp | High | + | - |
| Salmonella spp | High | + | + |
| Neisseria gonorrhoeae | High | + | - |
| Streptococcus pneumoniae | Medium | + | + |
| Haemophilus influenzae | Medium | + | - |
| Shigella spp | Medium | + | + |
Additional files
Download links
A two-part list of links to download the article, or parts of the article, in various formats.
Downloads (link to download the article as PDF)
Open citations (links to open the citations from this article in various online reference manager services)
Cite this article (links to download the citations from this article in formats compatible with various reference manager tools)
Mobilome-driven segregation of the resistome in biological wastewater treatment
eLife 11:e81196.
https://doi.org/10.7554/eLife.81196


