Metformin protects trabecular meshwork against oxidative injury via activating integrin/ROCK signals
- State Key Laboratory of Ophthalmology, Optometry and Visual Science, National Clinical Research Center for Ocular Diseases, Eye Hospital, Wenzhou Medical University, Wenzhou, China
Figures
Figure 1

Topical ocular DEX-induced OHT in mice.
(A) Elevated IOP in DEX-treated C57BL/6J mice was induced significantly at 4 weeks (p < 0.01). (B) The body weight comparison between the DEX-treated mice and control. (C) HE staining of OHT models. Scale bar, 50 µm. (D) α-SMA and TGF-β staining in the representative OHT models. Scale bar, 20 µm, (E, F) Quantification of α-SMA and TGF-β of the models. *p < 0.05, **p < 0.01, ns: non-significance, DEX: dexamethasone, PBS: phosphate-buffered saline, HE: haematoxylin and eosin, IOP: intraocular pressure, OHT: ocular hypertension, BW: body weight, TM: trabecular meshwork, SC: Schlemm’s canal, CB: ciliary body, α-SMA: α-smooth muscle actin, TGF-β: transforming growth factor-β.
Figure 2
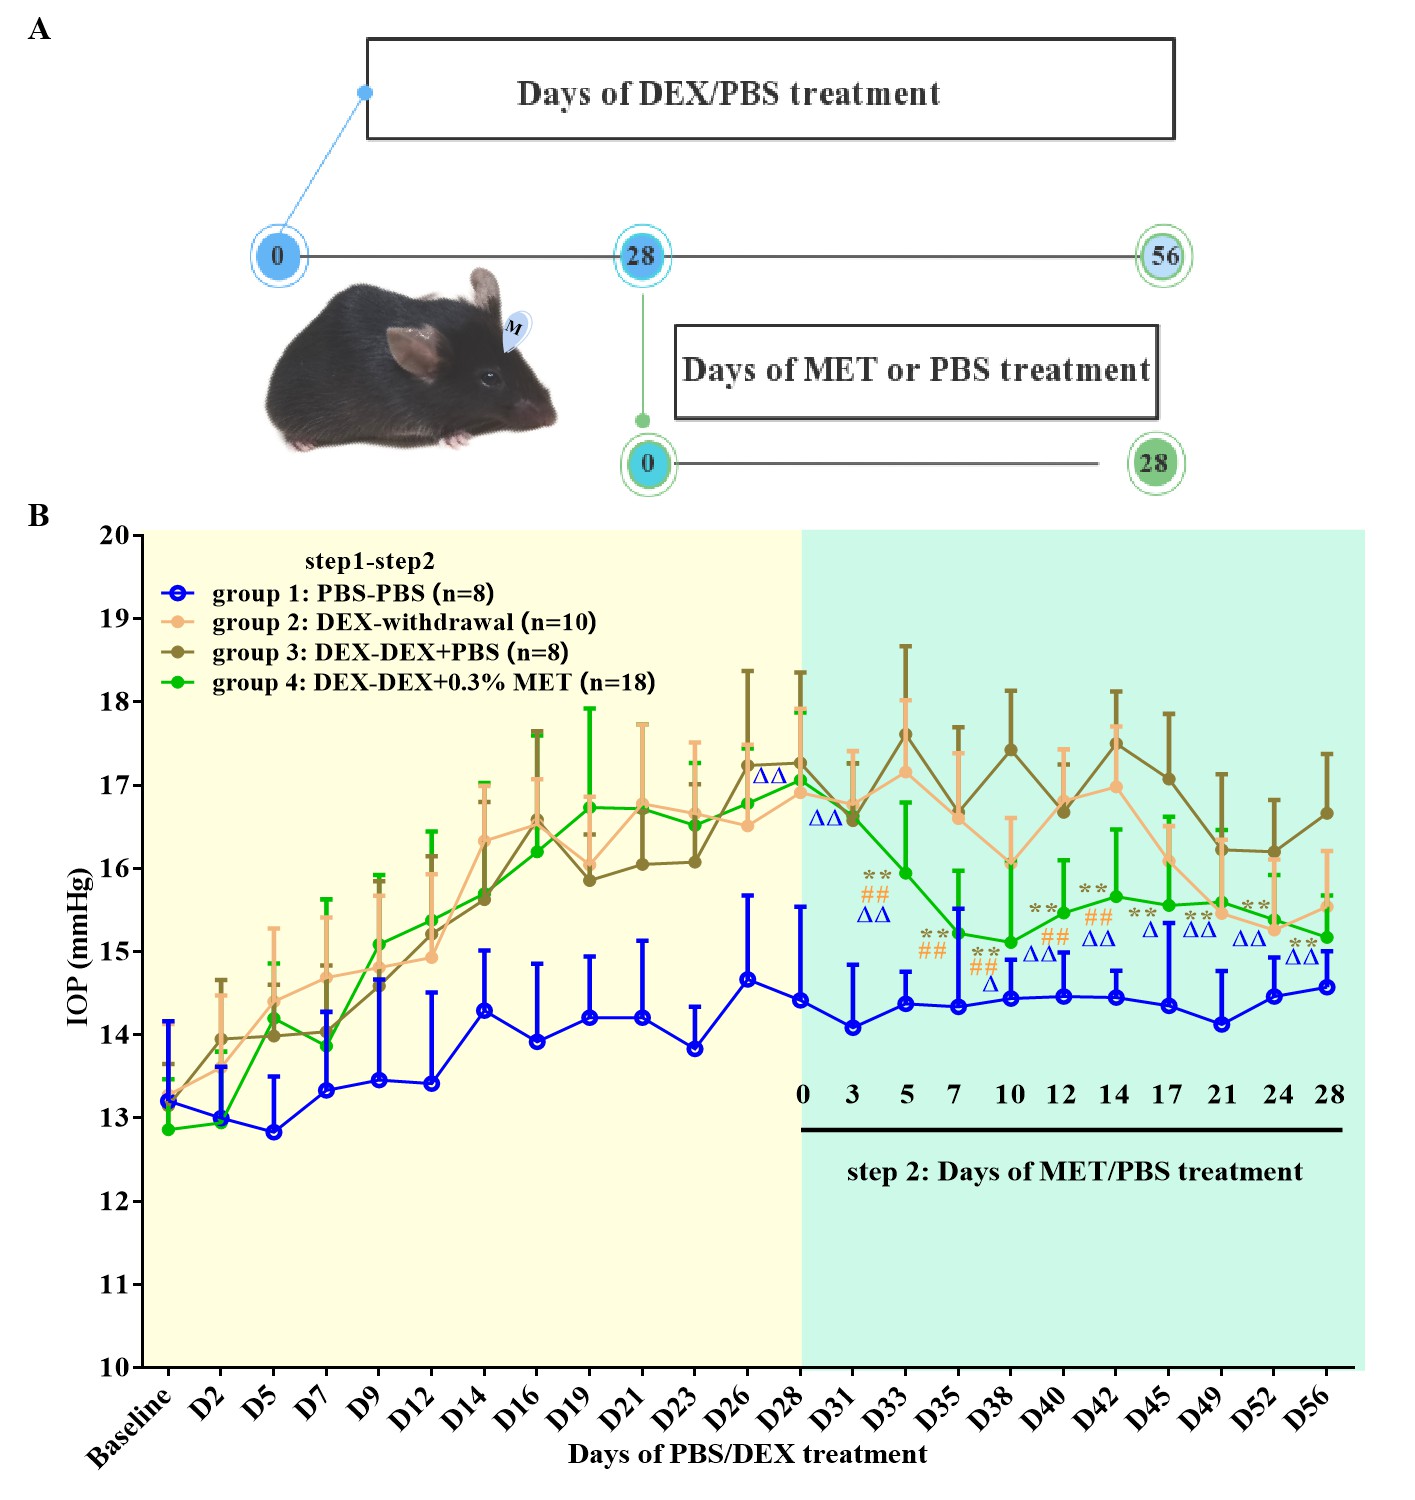
Effect of MET on OHT mouse models.
(A) Experimental process overview. (B) MET effectively reversed the IOP in steroid-induced OHT mouse models. **p < 0.01 (comparison between groups 3 and 4), ##p < 0.01 (comparison between groups 2 and 4), △p < 0.05, and △△p < 0.01 (comparison between groups 1 and 4). DEX: dexamethasone, MET: metformin, PBS: phosphate-buffered saline, IOP: intraocular pressure, OHT: ocular hypertension.
Figure 3
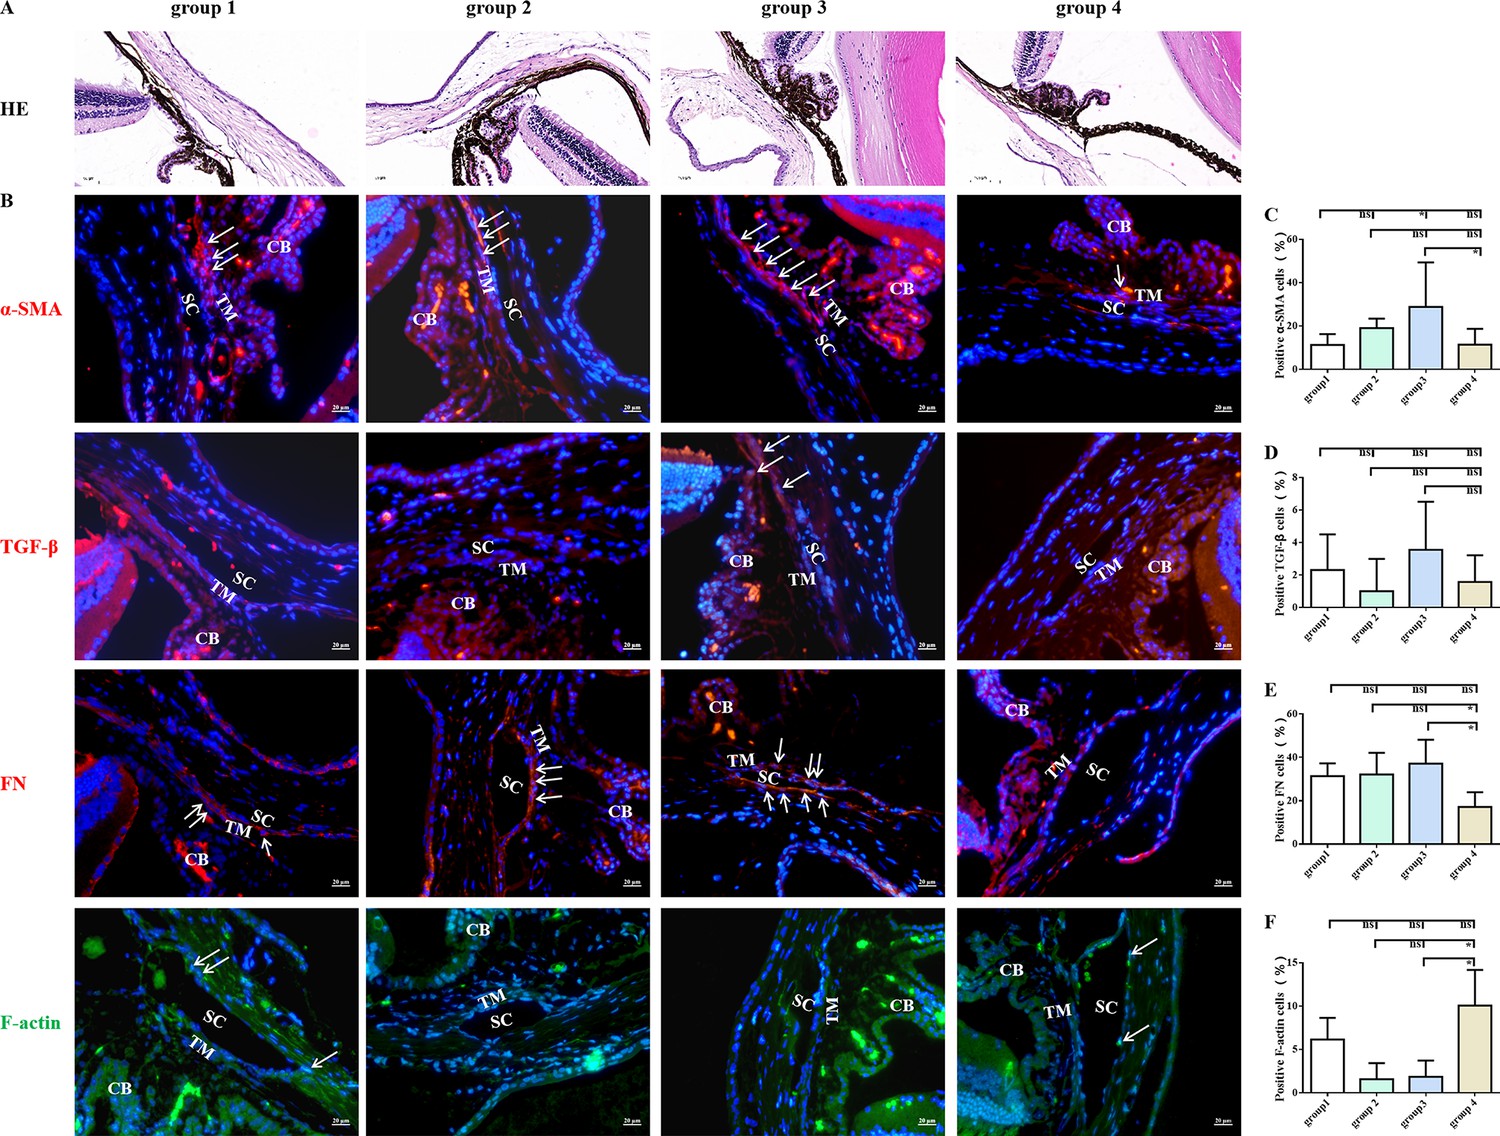
MET decreased the expression of fibrotic markers in steroid-induced trabecular meshwork stiffening in mice.
Representative images of HE (A) and fibrotic markers (B). Scale bar, 20 µm, (C) Quantification of α-SMA of the models. (D) Quantification of TGF-β of the models after 4 weeks of DEX withdrawal or MET/PBS treatment. (E) Quantification of fibronectin (FN) of the models after 4 weeks of DEX withdrawal or MET/PBS treatment. (F) Quantification of F-actin of the models after 4 weeks of DEX withdrawal or MET/PBS treatment. *p < 0.05, ns: non-significance, DEX: dexamethasone, HE: haematoxylin and eosin, MET: metformin, PBS: phosphate-buffered saline, α-SMA: α-smooth muscle actin, TGF-β: transforming growth factor-β. White arrows indicate the representative positive cells.
Figure 4 with 1 supplement

Low dose of MET reversed the disarranged morphology of HTMCs.
(A) HTMCs were treated with MET for 24 hr with or without pre-treatment of tBHP for 1 hr. Representative images of cell distribution and morphology photographed by inverted microscopy. Scale bar, 50 µm, (B) The expression of myocilin after DEX treatment in HTMCs. (C, D) The relative HTMC viability after exposure to MET with different concentrations. Cell proliferation was measured using the CCK8 assay. (E, F) The relative ROS levels were assayed via flow cytometry, and the results showed that MET reduced the ROS production of HTMC induced by tBHP. *p < 0.05, **p < 0.01. DEX: dexamethasone, HTMCs: human trabecular meshwork cells, MET: metformin, ROS: reactive oxygen species, tBHP: tert-butyl hydroperoxide, TM: trabecular meshwork.
Figure 4—figure supplement 1
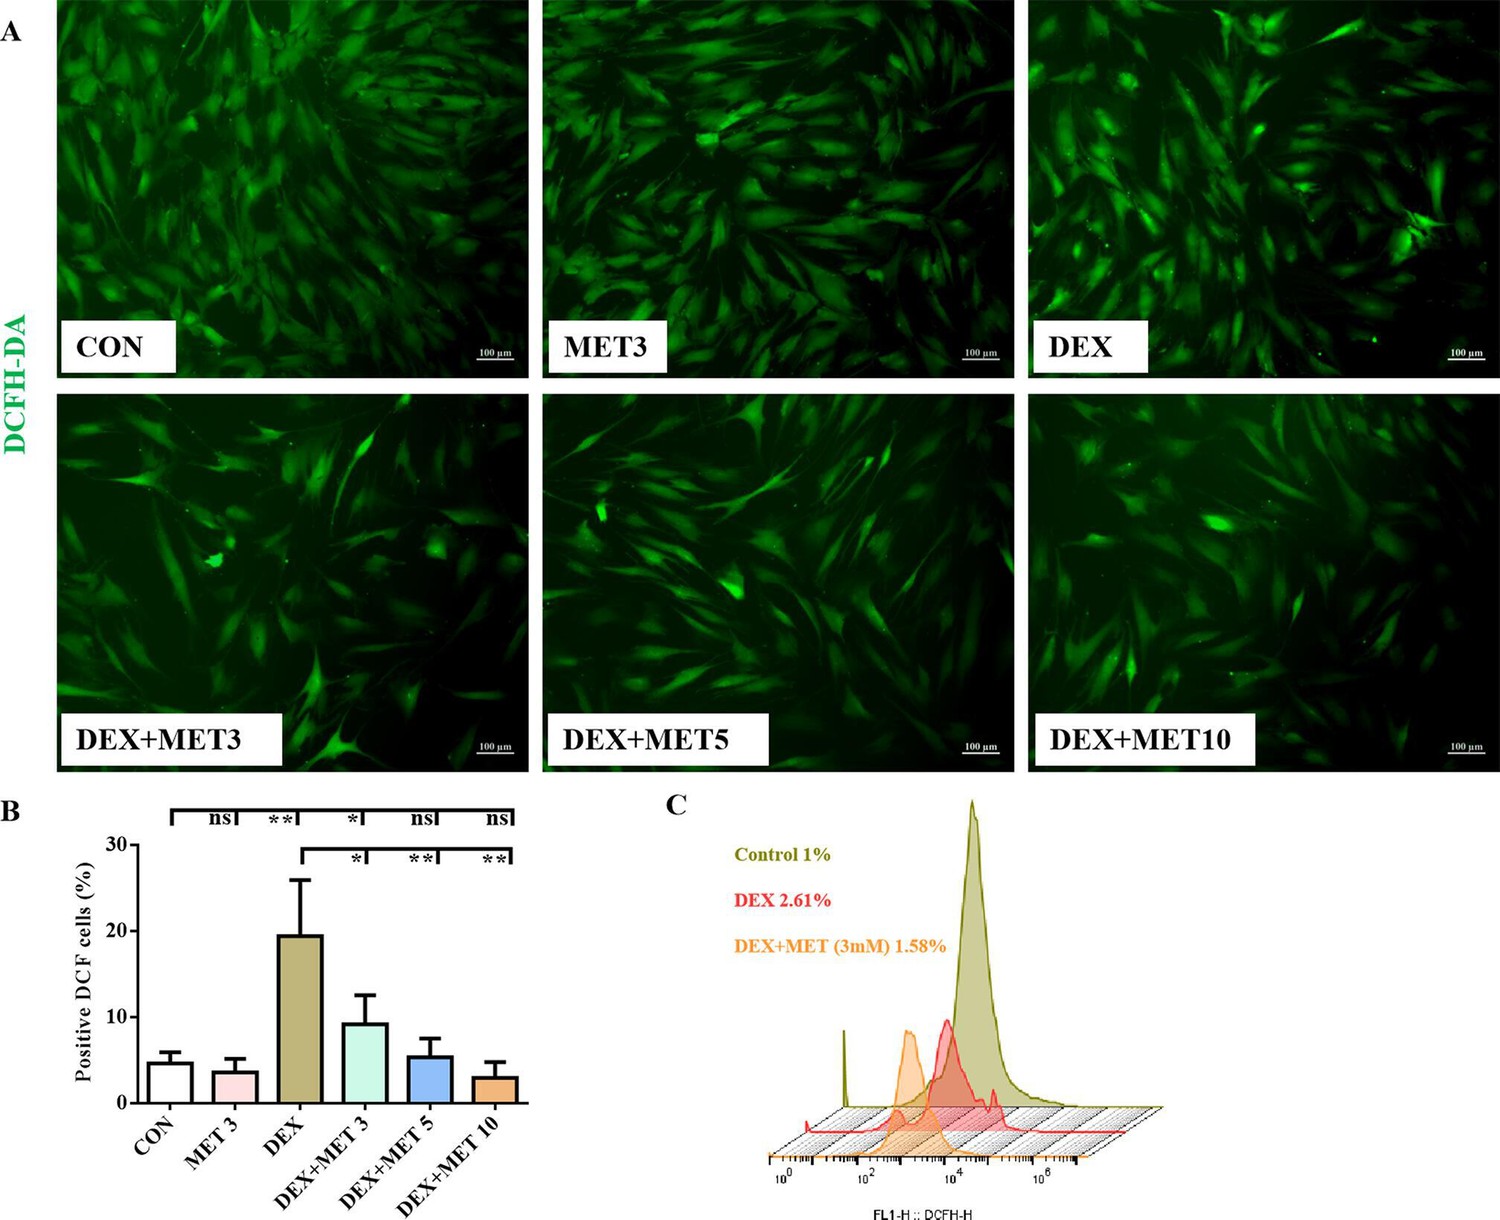
L-MET attenuated the ROS production in HTMCs induced by DEX treatment.
(A) ROS signals of HTMCs were determined by labelling cells with 2′,7′-dichlorofluorescein diacetate (DCFH-DA) and photographed by an inverted phase-contrast microscopy. Scale bar, 100 µm, (B) Quantification of DCF-positive cells in A. (C) The relative ROS levels assayed by flow cytometry showed that 3 mM MET reduced the ROS production of HTMC induced by DEX. **p < 0.01, *p < 0.05, ns: non-significance, DEX: dexamethasone, MET: metformin, ROS: reactive oxygen species, HTMCs: human trabecular meshwork cells, L-MET: low doses of metformin (<10 mM).
Figure 5
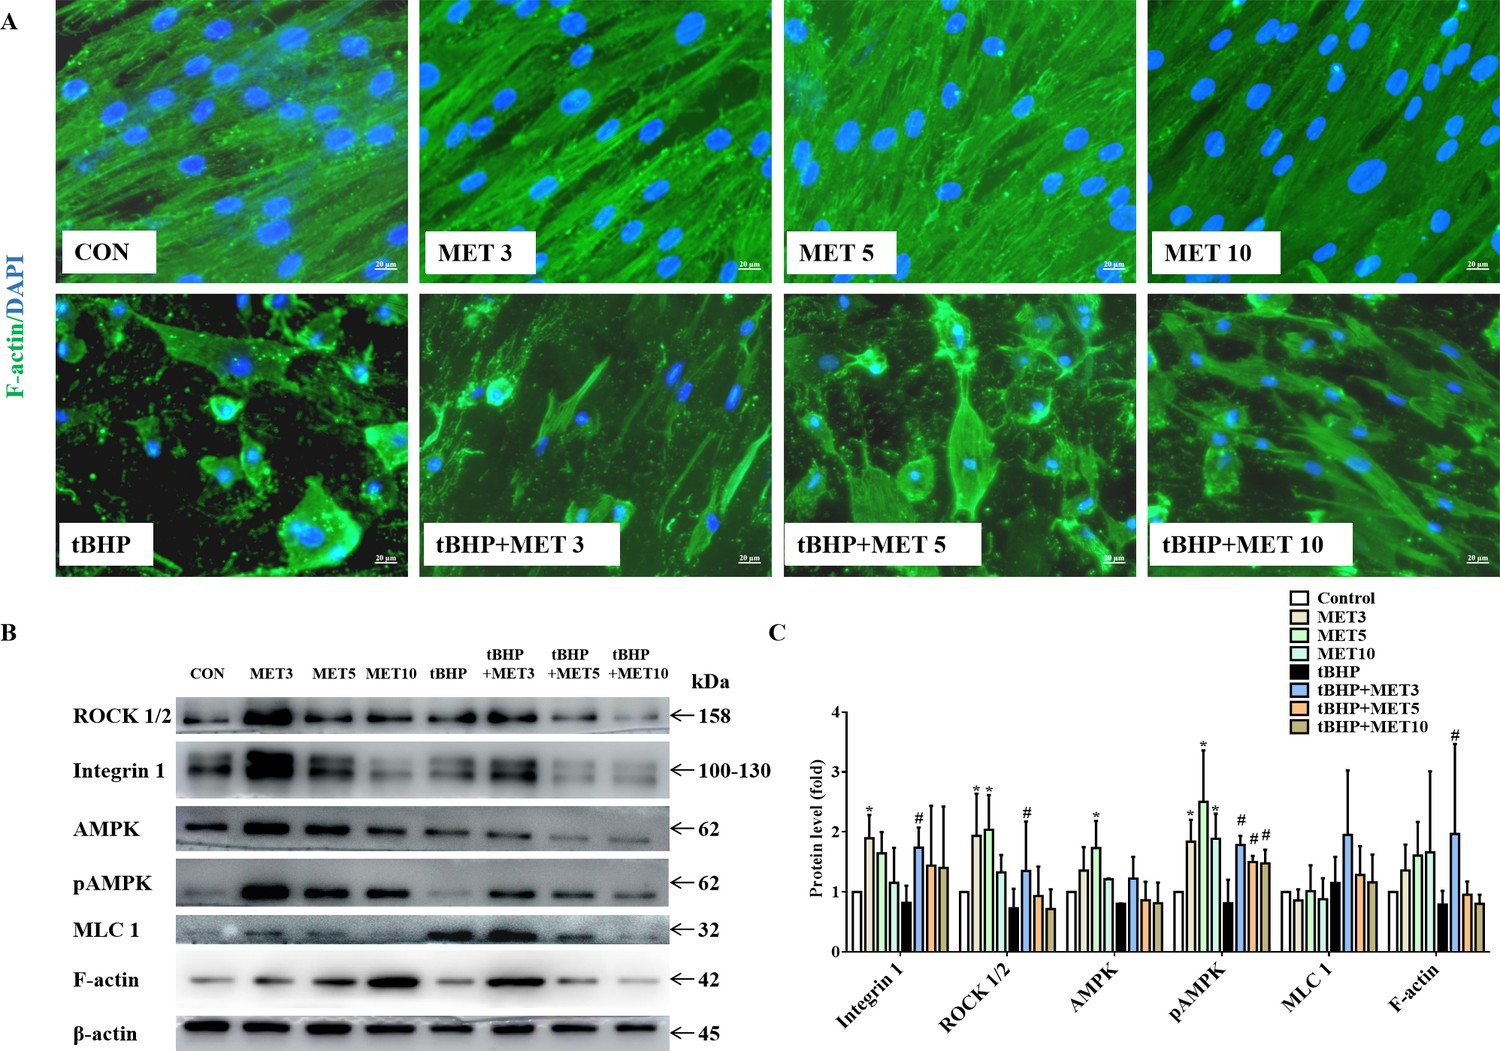
MET promoted the recovery of tBHP-induced cytoskeletal destruction (A) and activated the intergrin/ROCK pathway (B) in HTMCs.
Scale bar, 20 µm. (C) The quantitative protein levels of B. *p < 0.05 (comparison with the control), #p < 0.05 (comparison with the tBHP-treated group). HTMCs: human trabecular meshwork cells, MET: metformin, tBHP: tert-butyl hydroperoxide.
Figure 6
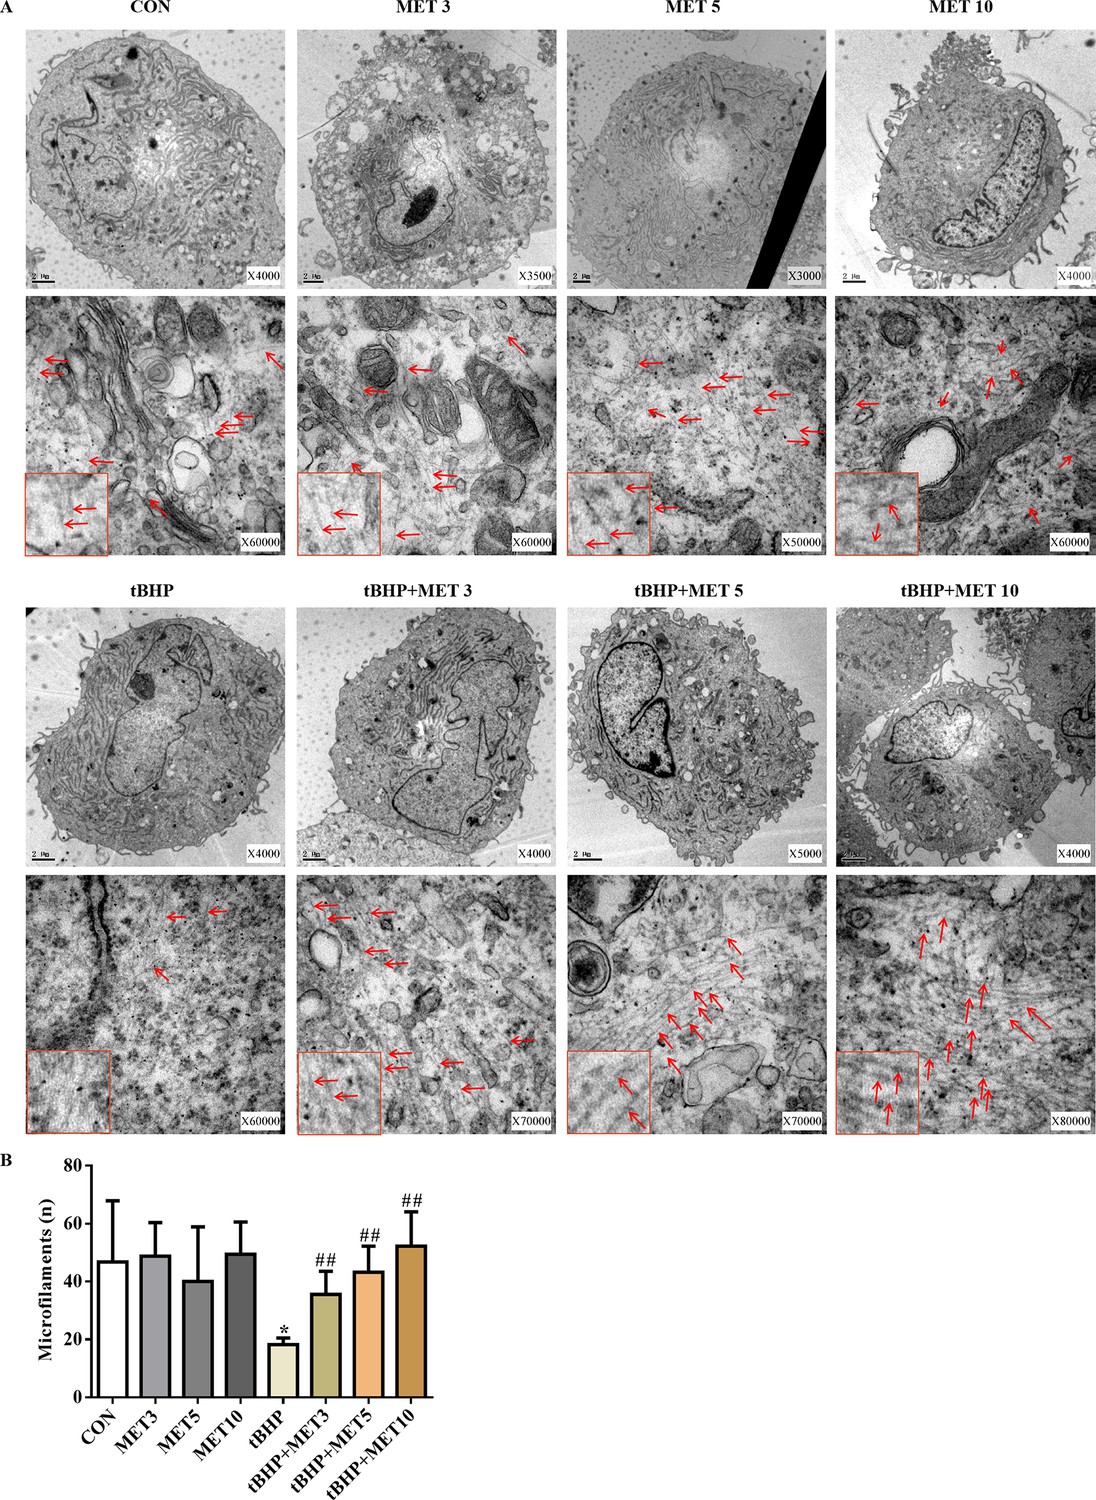
MET partially normalised the damaged microfilaments of HTMCs induced by tBHP (A).
Scale bar, 2 µm, Red arrows indicate the representative microfilaments imaged by transmission electron microscopy. The red rectangles embedded in the lower left part of each picture are representative microfilaments with a magnification of ×150,000. (B) The quantitative microfilaments of A. *p < 0.05 (comparison with the control), ##p < 0.01 (comparison with the tBHP-treated group). HTMCs: human trabecular meshwork cells, MET: metformin, tBHP: tert-butyl hydroperoxide.
Additional files
-
Source data 1
Source data files for Figure 1, Figure 2, Figure 3, Figure 4, Figure 5, Figure 6 and Figure 4—figure supplement 1.
- https://cdn.elifesciences.org/articles/81198/elife-81198-data1-v1.zip
-
MDAR checklist
- https://cdn.elifesciences.org/articles/81198/elife-81198-mdarchecklist1-v1.docx
-
Reporting standard 1
The ARRIVE guidelines 2.0: author checklist.
- https://cdn.elifesciences.org/articles/81198/elife-81198-repstand1-v1.docx
Download links
A two-part list of links to download the article, or parts of the article, in various formats.
Downloads (link to download the article as PDF)
Open citations (links to open the citations from this article in various online reference manager services)
Cite this article (links to download the citations from this article in formats compatible with various reference manager tools)
Metformin protects trabecular meshwork against oxidative injury via activating integrin/ROCK signals
eLife 12:e81198.
https://doi.org/10.7554/eLife.81198


