CCR1 mediates Müller cell activation and photoreceptor cell death in macular and retinal degeneration
- Department of Ophthalmology, Hadassah Medical Center, Faculty of Medicine, The Hebrew University of Jerusalem, Israel
Figures
Figure 1 with 2 supplements
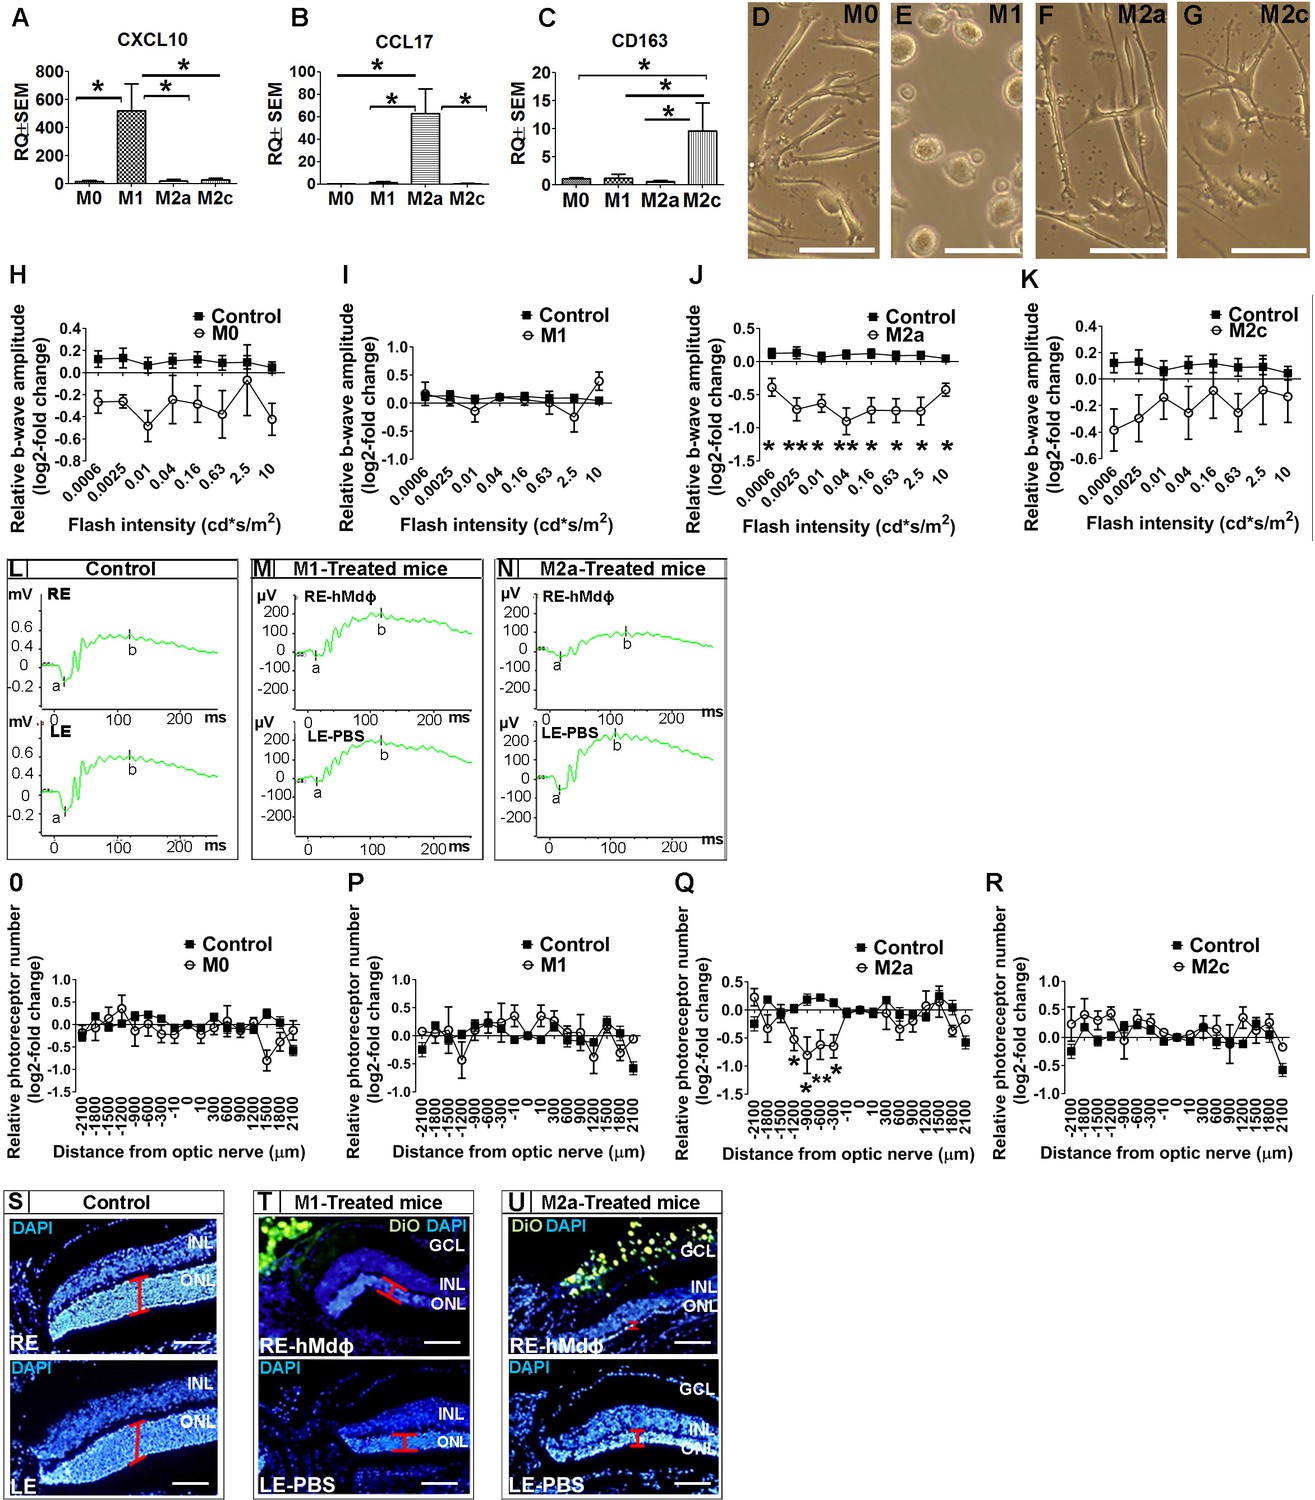
In vitro characterization of hMdɸs and in vivo cytotoxicity of M2a hMdɸ cells.
(A–C) Human M0 macrophages (hMdɸs) were polarized to form M1, M2a, or M2c hMdɸs, and expression of the phenotype-specific markers CXCL10 (A), CCL17 (B), and CD163 (C), respectively, was confirmed using quantitative real-time PCR (n=5 per group, one-way ANOVA with multiple comparisons). (D–G) Inverted phase-contrast microscopy of M0 (D), M1 (E), M2a (F), and M2c (G) hMdɸs, showing distinct morphologies for each subtype. (H–K) Relative electroretinography (ERG) b-wave amplitude versus light flash intensity of mice injected with M0 (H), M1 (I), M2a (J), and M2c (K) hMdɸs and control mice that were not exposed to light; ERG recordings revealed that adoptive transfer of M2a hMdɸs—but no other macrophage phenotypes—lead to suppressed b-wave amplitude (n=8 mice for each group, one-way ANOVA with multiple comparisons). The relative ERG b-wave was calculated by dividing the b-wave amplitude recorded from the mouse eye injected with hMdɸs by the b-wave amplitude recorder from the vehicle-injected eye of the same mouse. Similar b-wave amplitudes were recorded in fellow eyes of control mice. (L–N) Representative ERG recordings in control mice and in photic-injured mice in which the right eye (RE) was injected with M1(M) or M2a (N) hMdɸs and the left eye (LE) was injected with phosphate-buffered saline (PBS) as vehicle. ‘a’ and ‘b’ in the graph indicate the a-wave and the b-wave of the ERG, respectively. (O–R) Summary of the relative number of photoreceptor nuclei in the ONL measured at the indicated distances from the optic nerve head. A decrease in the number of photoreceptors nuclei was observed after adoptive transfer of M2a hMdɸ (Q), but not of other macrophage subtypes (O, P, and R) (n=8 mice for each group, one-way ANOVA with multiple comparisons). The relative number of photoreceptor nuclei was calculated by comparing the number of photoreceptor nuclei present in the ONL of the mouse eye injected with hMdɸ and the counterpart vehicle-injected eye. (S–U) Representative immunofluorescence images of retinal slices prepared from the indicated mice following an injection of DiO-stained hMdɸs (green); the nuclei were counterstained with DAPI (blue), and the ONL is indicated (red brackets). Note the presence of DiO-positive M2a hMdɸs in the GCL (U). GCL, ganglion cell layer; INL, inner nuclear layer; ONL, outer nuclear layer. Data shown as mean ± SEM. p-Values indicated by *p<0.05 and **p<0.01. Scale bars: 50 µm (D–G and S–U).
-
Figure 1—source data 1
Real-time quantitative PCR (qPCR) analysis of CXCL10, CCL17, and CD163 mRNA in M0, M1, M2a, and M2c macrophages derived from human monocytes (hMdɸs).
- https://cdn.elifesciences.org/articles/81208/elife-81208-fig1-data1-v1.xlsx
-
Figure 1—source data 2
Electroretinography (ERG) b-wave recordings and outer nuclear layer (ONL) thickness of hMdɸs-treated mice and untreated mice.
- https://cdn.elifesciences.org/articles/81208/elife-81208-fig1-data2-v1.xlsx
Figure 1—figure supplement 1
Establishing a model of photic retinal damage.
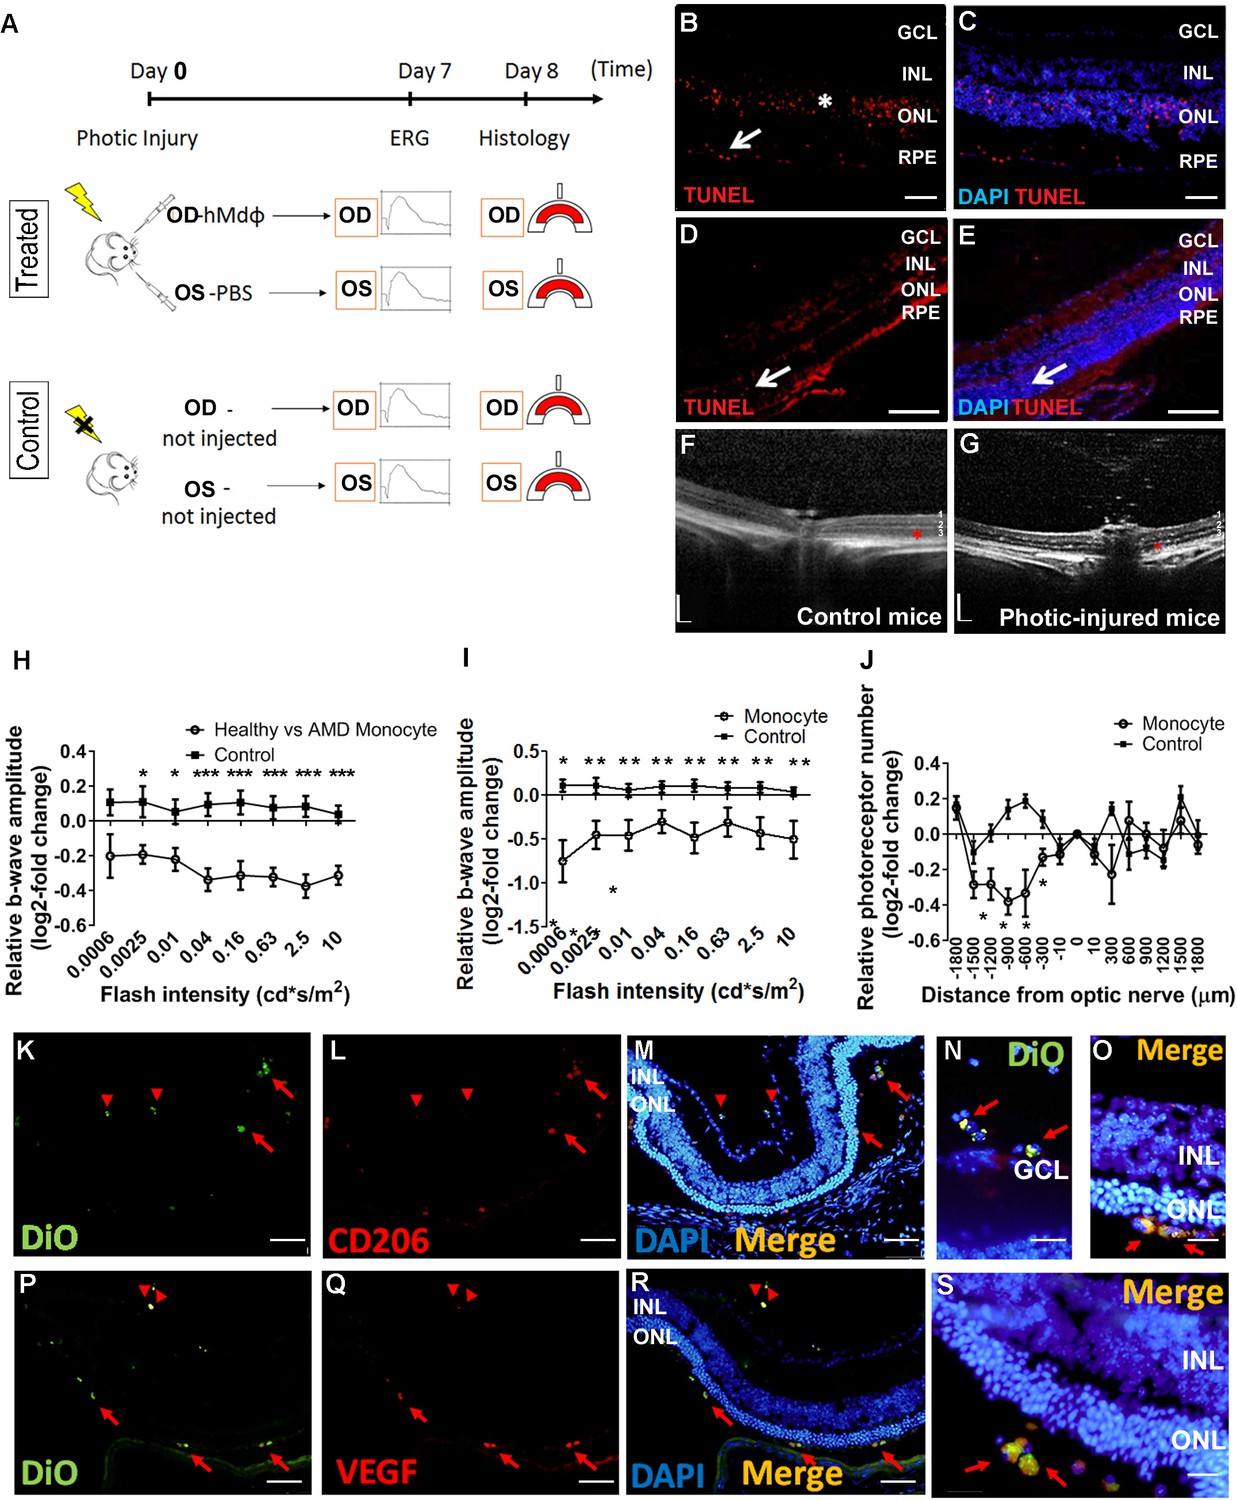
(A) Schematic diagram depicting the experimental design. The mice in the treated group underwent photic injury followed by an intravitreal injection of hMdɸs in the right eye (RE) and vehicle (phosphate-buffered saline [PBS]) in the left eye (LE); control mice were not exposed to photic injury, nor did they receive intravitreal injections. Fellow eyes in the treated and control mice were measured electroretinography (ERG) 7 days after photic injury, and thickness of the outer nuclear layer (ONL) was measured using histology 8 days after photic injury. (B–E) TUNEL (red) and DAPI (blue) staining of BALB/c mouse retinas 2 days after photic injury shows apoptotic photoreceptor cells (asterisk) and retinal pigment epithelial (RPE) cells (arrow) in the posterior retina (B and C), and relatively few apoptotic cells (arrow) in the peripheral retina (D and E). (F–G) Optical coherence tomography images obtained 7 days after photic injury reveal a marked reduction in ONL thickness (red asterisks) in a treated mouse (G) compared to a control mouse (F); 1, 2, and 3 indicate the ganglion cell layer (GCL), inner nuclear layer (INL), and ONL, respectively. (H) Relative b-wave ERG amplitudes versus flash intensity recorded from mice eyes injected with monocytes from aged-matched controls vs. monocytes from age-related macular degeneration (AMD) patients (n=9) and control mice that were not exposed to light (n=9). Suppressed b-wave amplitude was observed in the eyes injected with monocytes from healthy individuals compared with eyes injected with monocytes from AMD patients (Student’s t-test). (I) Relative b-wave ERG amplitudes versus flash intensity recorded from mice injected with monocytes (n=7) and control mice that were not exposed to light (n=9). Suppressed b-wave amplitude was observed in the eyes injected with monocytes (Student’s t-test). (J) A reduced number of photoreceptor nuclei were found in eyes injected with monocytes from AMD patients at different distances from the optic nerve head (ONH) (Student’s t-test). (K–S) Human monocyte polarization following adoptive transfer to mice eyes with photic-induced retinal injury showed monocytes from AMD patient (Dio-traced, green signal, K and P) expresses CD206 and vascular endothelial growth factor (VEGF) (red signal, L and Q) confirming polarization toward M2a phenotype. Note that expression of M2a markers were found only upon migration into retinal layers (red arrows in M, R and in high magnitude in O and S), but not in monocytes present in the vitreous (red arrowheads in M, R and in high magnitude in N). Data shown as mean ± SEM. p-Values indicated by *p<0.05 and **p<0.01. Scale bars: 20 µm (N,O,S), 50 µm (B–E, K–M, P–R), and 200 µm (F and G).
-
Figure 1—figure supplement 1—source data 1
Electroretinography (ERG) b-wave recordings and outer nuclear layer (ONL) thickness of monocytes-treated mice and untreated mice.
- https://cdn.elifesciences.org/articles/81208/elife-81208-fig1-figsupp1-data1-v1.xlsx
Figure 1—figure supplement 2
Adoptive transfer of M2a hMdɸ cells into mouse eyes.
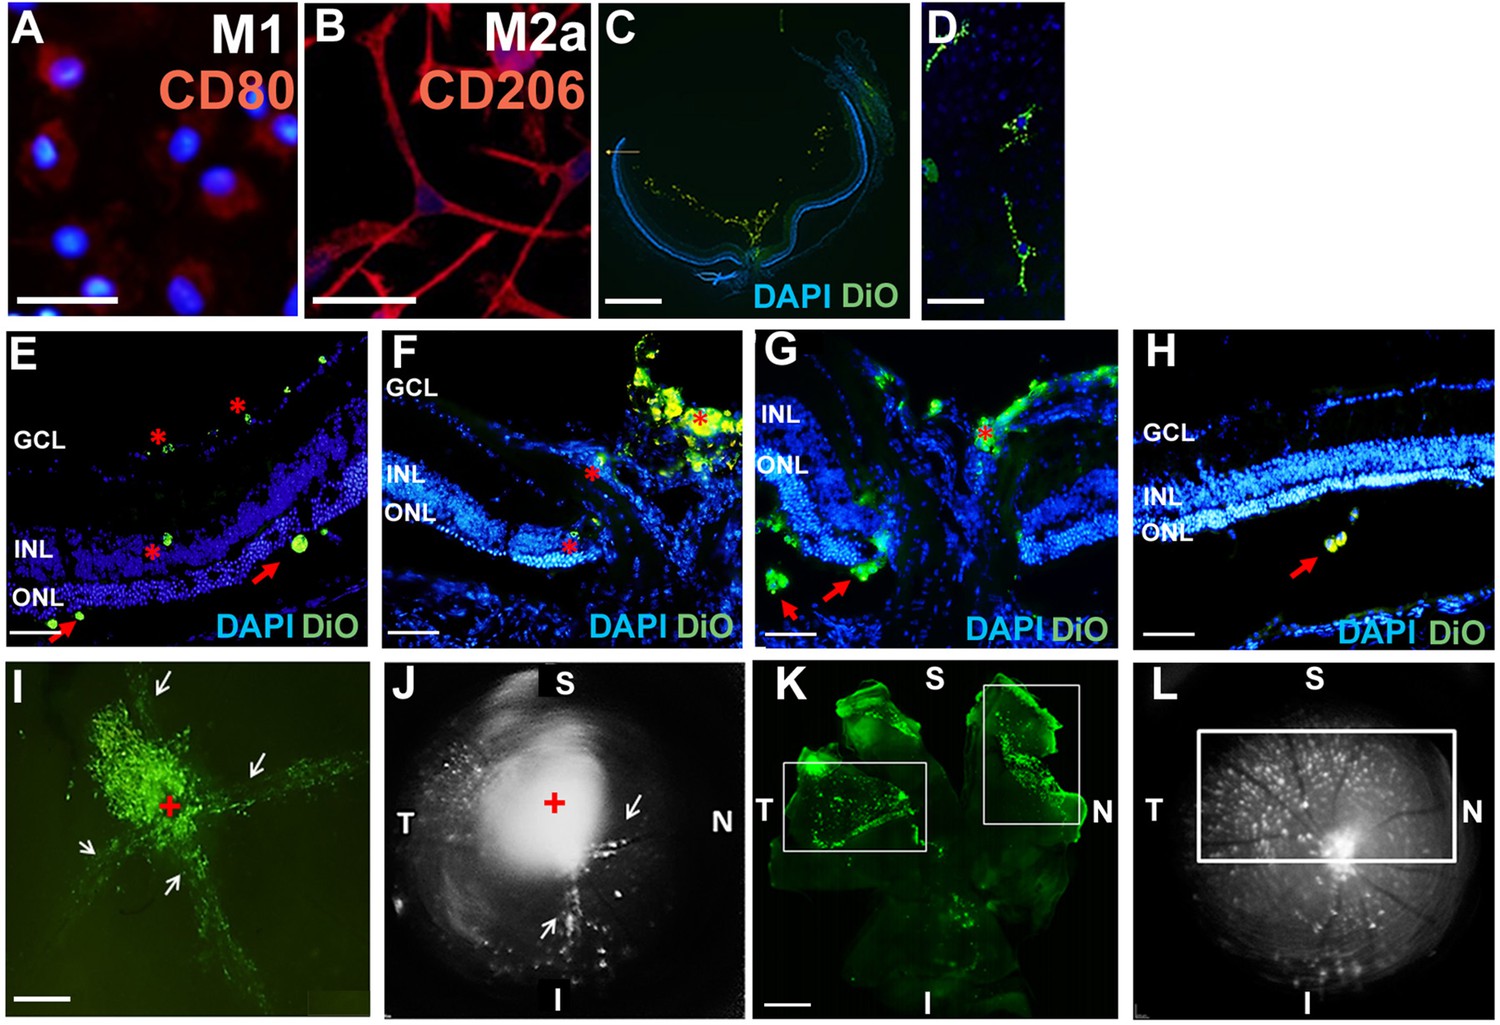
(A–B) Polarized M1 (A) and M2a (B) hMdɸs obtained from patients with age-related macular degeneration (AMD), showing distinct morphological differences and CD80 (red) or CD206 (red) expression in M1 or M2a hMdɸs respectively; the nuclei were counterstained with DAPI (blue). (C–H) Inverted phase-contrast microscopy images of cryosections prepared from mouse eyes 7 days after photic retinal injury and intravitreal injection of DiO-labeled M2a hMdɸs, showing M2a hMdɸs in the vitreous (C) with a polarized profile and elongated cell morphology (D), as well as across the layers of the retina (G, asterisk), including the subretinal space (G, arrows). Also, M0 (E), M1 (F), and M2c (H) hMdɸs were reached the different retinal layers. (I–L) Retinal flat-mount (I, K) and fundus autofluorescence images (J, L) of the retina 7 days after injecting M2a hMdɸs. Note the migration of M2a hMdɸs toward the ONH (the red cross in I and J) and in the vicinity of the large retinal vessels (arrows in I and J); also note the high density of M2a hMdɸs in the superior retinal area (indicated by the rectangles in K and L). S, superior; I, inferior; T temporal; N, nasal; GCL, ganglion cell layer; INL, inner nuclear layer; ONL, outer nuclear layer; ONH, optic nerve head. Scale bars: 50 µm (A, B, D, and E–H), 100 µm (I and K), and 200 µm (C).
Figure 2
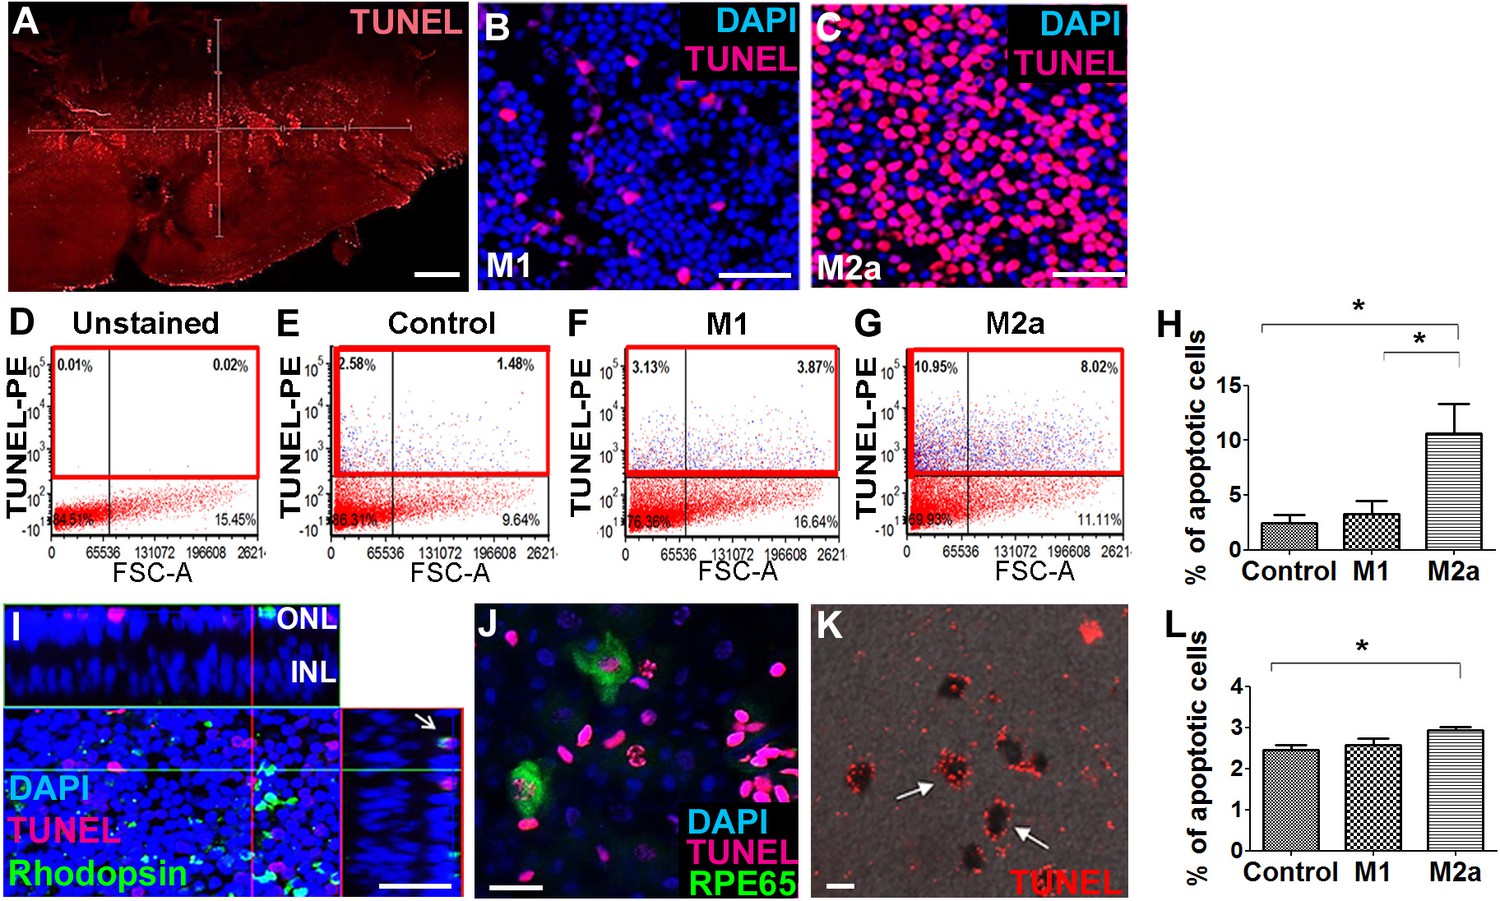
M2a hMdɸs have neurotoxic effects on retinal explants.
(A–C) TUNEL staining (red) of mouse retinal explants co-cultured with either M1 hMdɸs (B) or M2a hMdɸs (C) for 18 hr; the nuclei were counterstained with DAPI (blue). Confocal microscopy assessment of 11 randomly selected retinal fields (A) revealed M2a hMdɸ (C) to be associated with photoreceptor cell apoptosis as compared to M1 hMdɸ. (D–G) Representative FACS gating plot of cells obtained from the indicated retinal explants stained using TUNEL-PE; TUNEL+ cells are shown in the red rectangles based on an unstained retinal explant. (H) Summary of the percentage of apoptotic (TUNEL+) cells measured in control explants and in explants that were co-cultured with M1 or M2a hMdɸs (n=6 per group, one-way ANOVA with multiple comparisons). (I) Rhodopsin immunostaining (green) of a retinal explant showing the association of macrophages with apoptotic photoreceptor cells, indicated by the co-localization of TUNEL and rhodopsin staining in a Z-stack (arrow). (J–K) Co-culturing retinal pigment epithelial (RPE)-choroid explants with M2a hMdɸs results in the co-localization of TUNEL staining (red) and the RPE marker RPE65 marker (J; green), as well as the presence of TUNEL-positive hexagonal and pigmented cells (K; arrows). (L) The addition of supernatant collected from M2a hMdɸs to retinal explants increased photoreceptor death (measured as an increase in the percentage of TUNEL-positive cells) (n=6 per group, one-way ANOVA with multiple comparisons). INL, inner nuclear layer; ONL, outer nuclear layer. Data shown as mean ± SEM. p-Values indicated by *p<0.05. Scale bars: 20 µm (G and H), 50 µm (B, C, and F), and 200 µm (A).
-
Figure 2—source data 1
Summary of the percentage of apoptotic (TUNEL+) cells measured in the different groups of retinal explant.
- https://cdn.elifesciences.org/articles/81208/elife-81208-fig2-data1-v1.xlsx
Figure 3
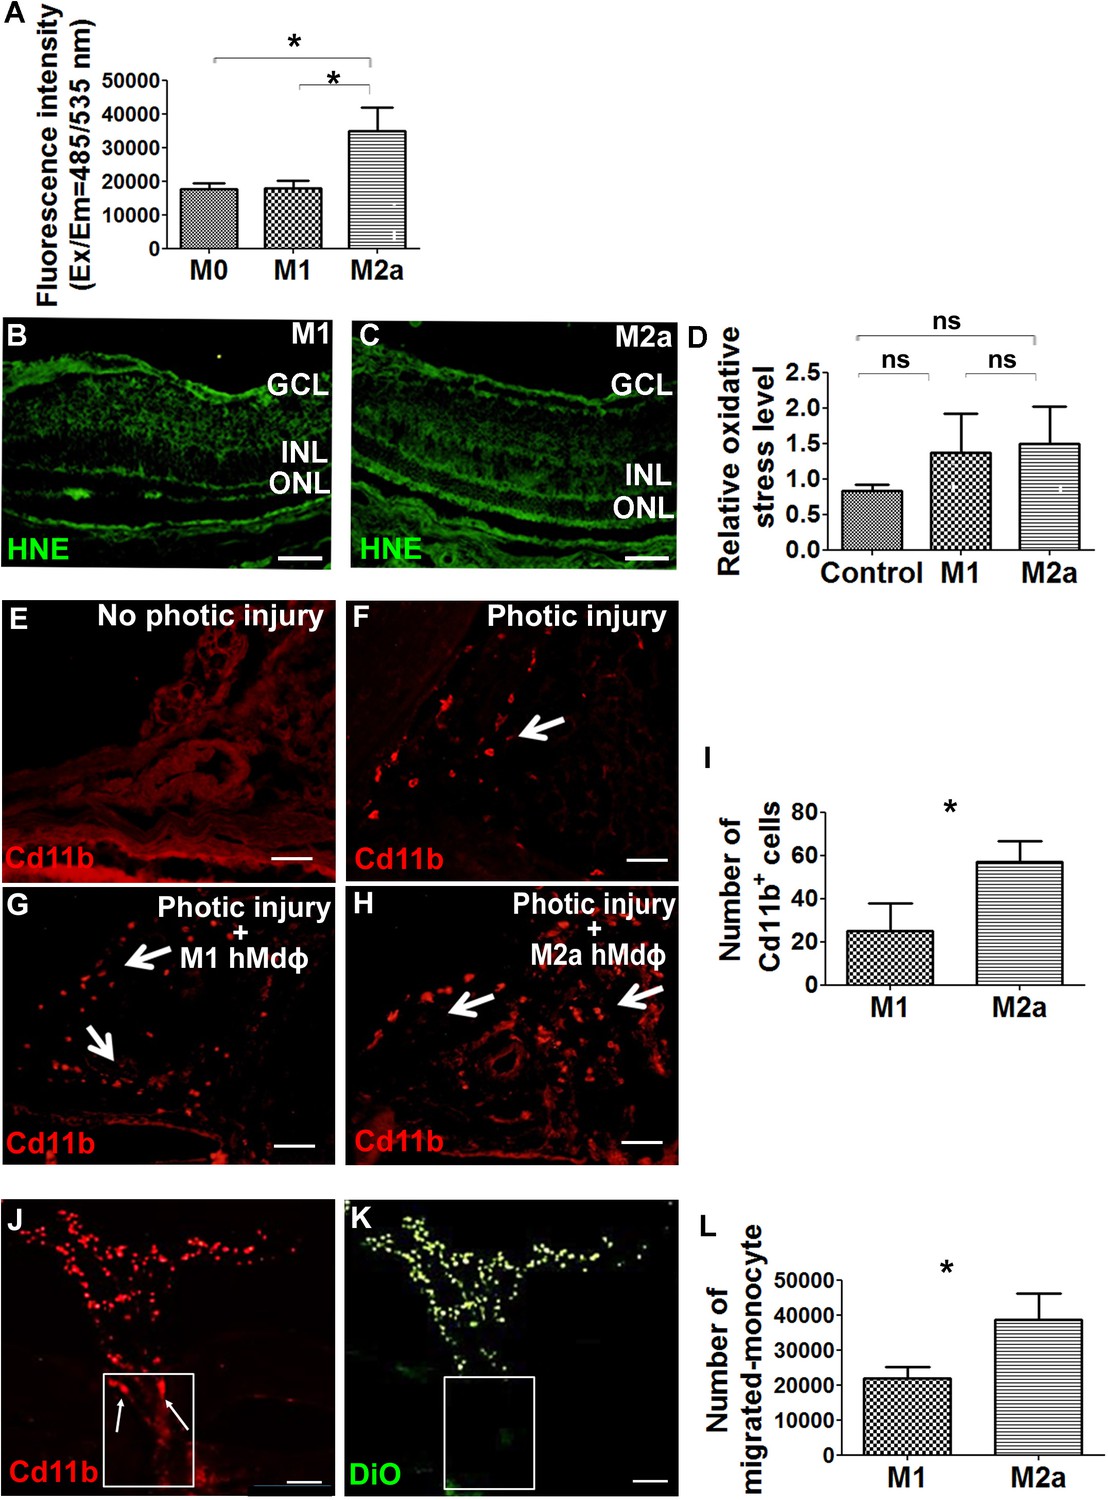
M2a hMdɸs produce high levels of reactive oxygen species (ROS) and induce the infiltration of cd11b+ cells.
(A) Cultured M2a hMdɸs produce higher levels of ROS than both M0 and M1 hMdɸs; ROS production was measured using the DCFDA fluorogenic dye (n=5 per group, one-way ANOVA with multiple comparisons). (B–C) Hydroxynonenal (HNE) immunostaining (green) shows similar levels of oxidative stress in mouse eyes following an intravitreal injection of either M1 hMdɸs (B) or M2a hMdɸs (C). (D) Summary of relative oxidative stress levels measured in control eyes and in eyes injected with M1 or M2a hMdɸs calculated by comparing the fluorescence level of HNE-stained sections of the hMdɸ-injected eye and the vehicle-injected eye of the same mouse. HNE staining intensity was quantified using ImageJ (n=7 per group, one-way ANOVA with multiple comparisons). (E–H) cd11b immunostaining (red, arrows) shows an increased presence of mononuclear phagocytes in the choroid tissue following photic injury (F) and in eyes following an intravitreal injection of M1 hMdɸs (G) or M2a hMdɸs (H). (I) Summary of cd11b+ cells present in the choroid tissue in eyes following an intravitreal injection of M1 or M2a hMdɸs (n=7 per group, Student’s t-test). (J–K) Inverted phase-contrast microscopy images of the optic nerve head (ONH) showing the migration of DiO-labeled M2a hMdɸ cells (K; green) and co-localization with recruited cd11b+ cells (J; red), shown in the rectangles. (L) An in vitro migration assay was performed using a Boyden chamber, showing an increase in monocytes that migrated toward the M2a hMdɸs compared with the M1 hMdɸs (n=6 per group, Student’s t-test). GCL, ganglion cell layer; INL, inner nuclear layer; ONL, outer nuclear layer. Data shown as mean ± SEM. p-Values indicated by ns, nonsignificant, *p<0.05. Scale bars: 50 µm (B–C and E–H) and 100 µm (J–K).
-
Figure 3—source data 1
Comparative analysis of reactive oxygen species (ROS) production, fluorescence level of hydroxynonenal (HNE)-stained sections, cd11b-positive cells quantification, and in vitro migration level between M1 and M2a hMdɸs.
- https://cdn.elifesciences.org/articles/81208/elife-81208-fig3-data1-v1.xlsx
Figure 4 with 2 supplements
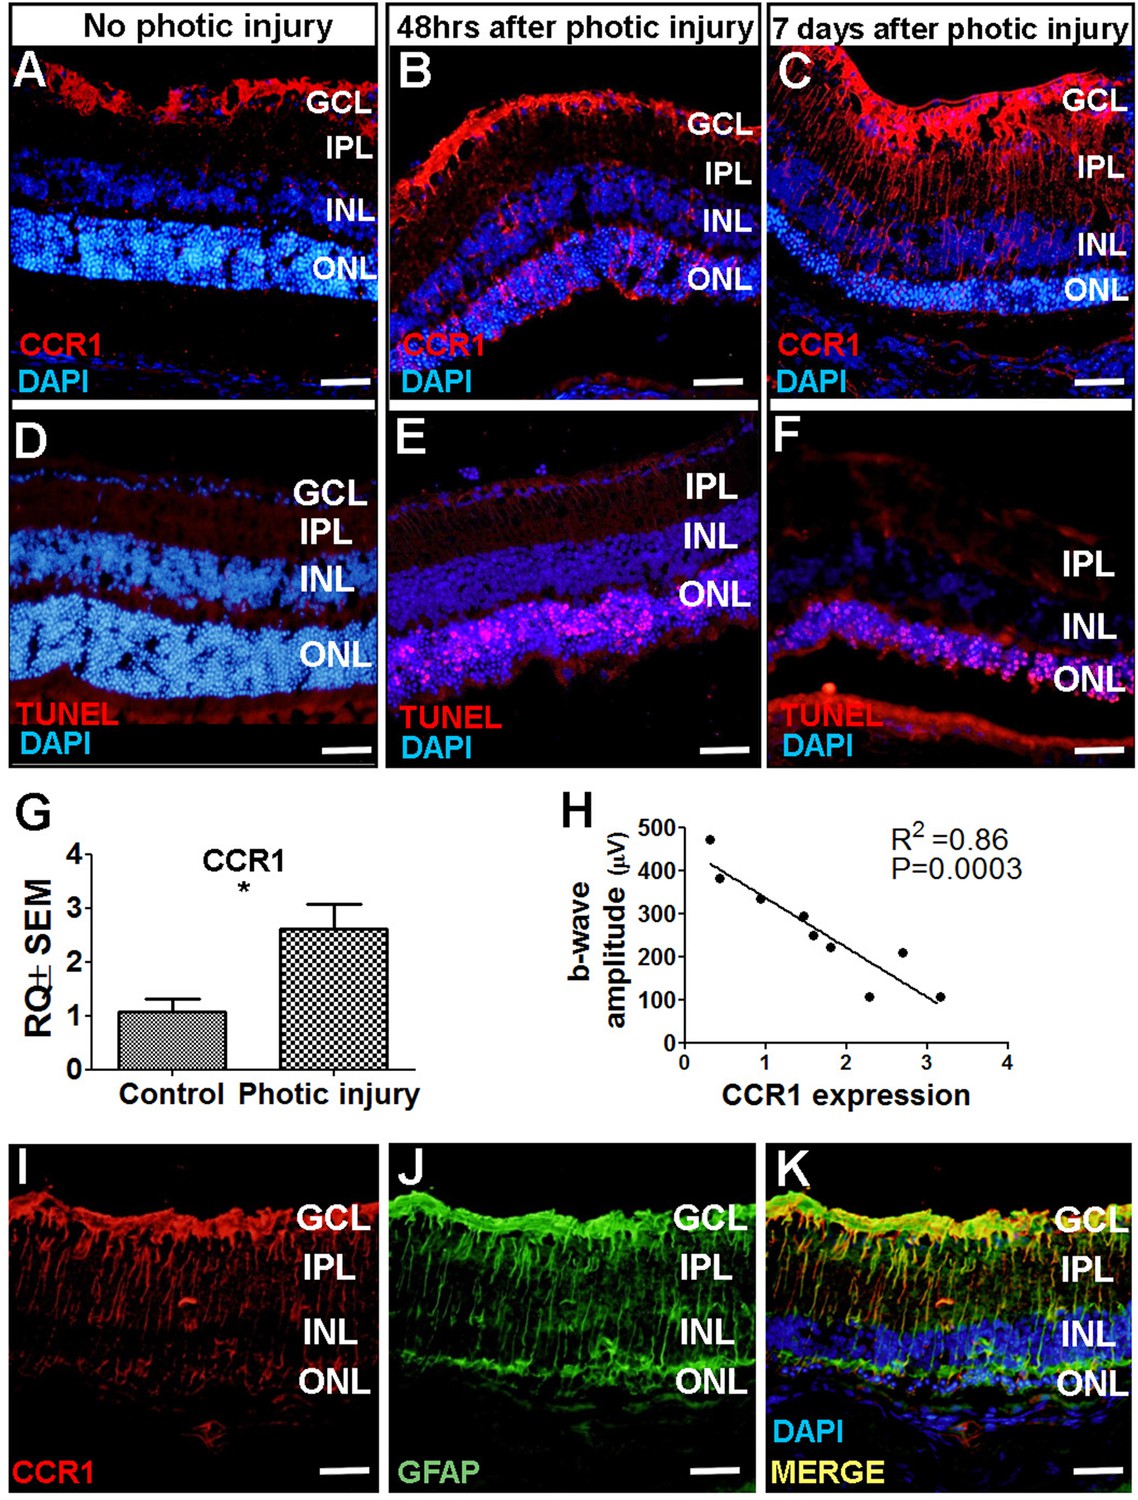
CCR1 is upregulated in a mouse model of photic injury.
(A–F) Albino BALB/c mice were exposed to photic injury; 48 hr and 7 days later, retinal sections were prepared and immunostained for Ccr1 (A–C; red) or TUNEL stained (D–F, red); the nuclei were counterstained with DAPI (blue). (G) Real-time quantitative PCR (qPCR) analysis of retinal Ccr1 mRNA measured in control mice and in mice 7 days after photic injury (n=6 mice for each group, Student’s t-test). (H) Ccr1 expression plotted against the b-wave amplitude measured using electroretinography (ERG) in mice 7 days after photic injury. Each symbol represents an individual mouse eye, and the correlation coefficient and p-value are shown. (I–K) Retinal sections were prepared 7 days after photic injury and co-immunostained for CCR1 (I; red) and the glial cell marker GFAP (J; green); the nuclei were counterstained with DAPI (blue). GCL, ganglion cell layer; INL, inner nuclear layer; IPL, inner plexiform layer; ONL, outer nuclear layer. Data shown as mean ± SEM. p-Values indicated by **p<0.005. Scale bars: 50 µm (A–F and I–K).
-
Figure 4—source data 1
Real-time quantitative PCR (qPCR) analysis of retinal Ccr1 mRNA in control mice vs. photic-injured mice and the correlation between the Ccr1 expression and the electroretinography (ERG) b-wave amplitude.
- https://cdn.elifesciences.org/articles/81208/elife-81208-fig4-data1-v1.xlsx
Figure 4—figure supplement 1
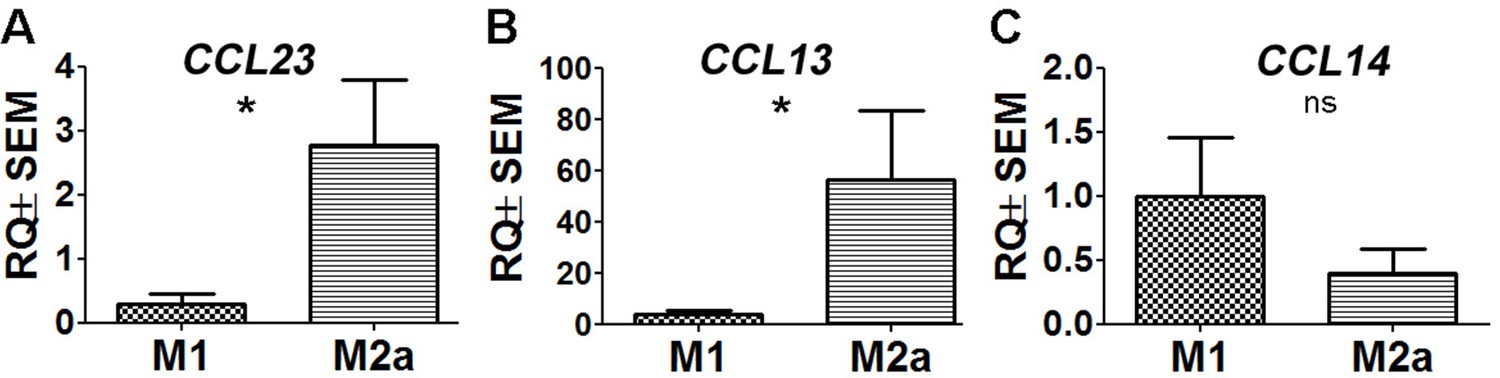
Two CCR1 ligands are expressed at higher levels in M2a hMdɸs compared to M1 hMdɸs.
(A–C) Real-time quantitative PCR (qPCR) analysis of CCL23 (A), CCL13 (B), and CCL14 (C) mRNA in M1 and M2a macrophages derived from human monocytes (n=6 per group, Student’s t-test). Data shown as mean ± SEM. p-Values indicated by ns, nonsignificant, *p<0.05.
-
Figure 4—figure supplement 1—source data 1
Real-time quantitative PCR (qPCR) analysis of CCL23, CCL13, and CCL14 mRNA in M1 and M2a macrophages derived from human monocytes.
- https://cdn.elifesciences.org/articles/81208/elife-81208-fig4-figsupp1-data1-v1.xlsx
Figure 4—figure supplement 2
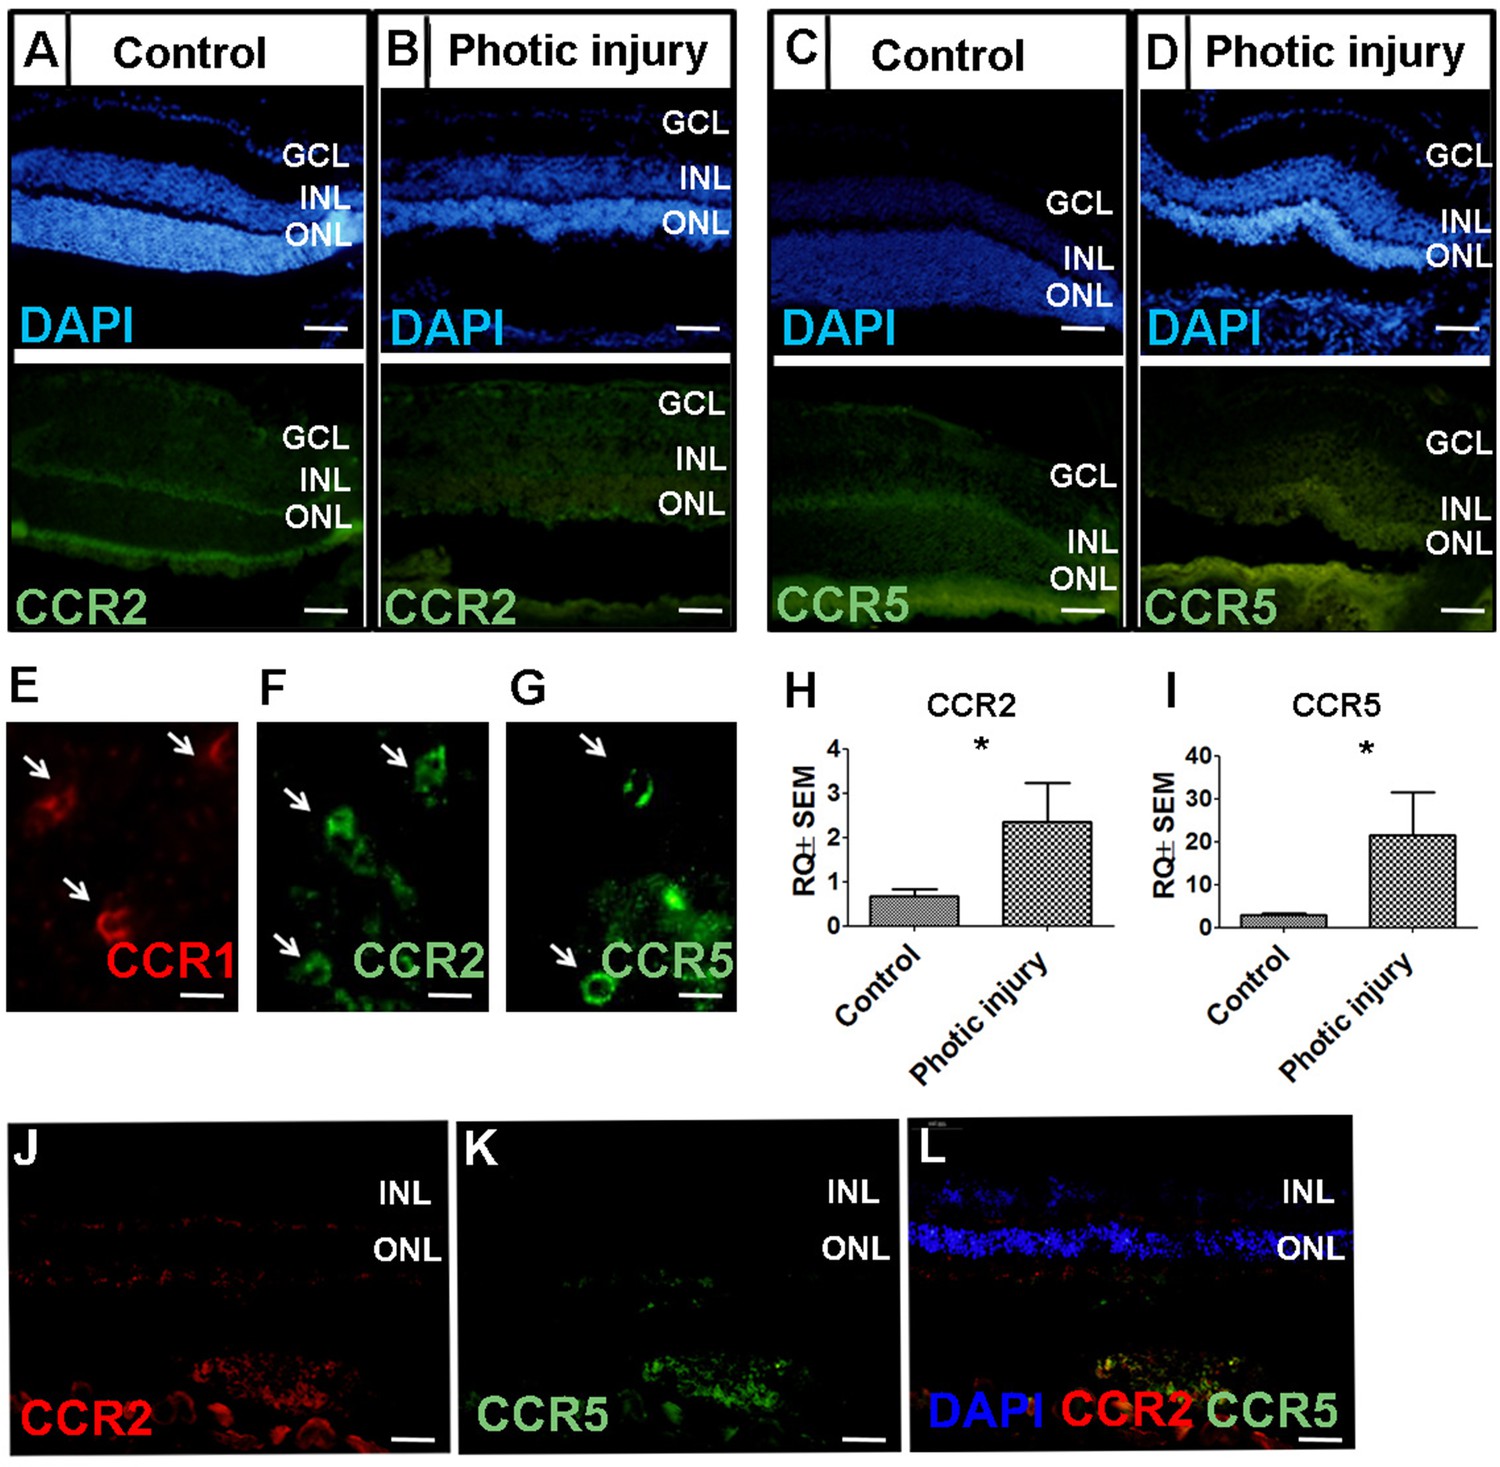
Expression of CCR2 and CCR5 in the mouse retina following photic injury.
(A–D) Retinal sections obtained from control and photic-injured mice were immunostained for CCR2 (A–B) or CCR5 (C–D); the nuclei were counterstained with DAPI (blue). (E–G) Flat-mount retinal sections were prepared from photic-injured mice and show recruited cells expressing CCR1 (E; arrows), CCR2 (F; arrows), and CCR5 (G; arrows). (H–I) Real-time quantitative PCR (qPCR) analysis of retinal Ccr2 and Ccr5 mRNA measured in control mice and photic-injured mice (n=6 mice for each group, Student’s t-test). (J–L) Retinal sections obtained from 3-week-old rd10 mice were immunostained for CCR2 (J) or CCR5 (K); the nuclei were counterstained with DAPI (L; blue). GCL, ganglion cell layer; INL, inner nuclear layer; ONL, outer nuclear layer. Data shown as mean ± SEM. p-Values indicated by *p<0.05. Scale bars: 50 µm (A–D and J–L) and 20 µm (E–G).
-
Figure 4—figure supplement 2—source data 1
Real-time quantitative PCR (qPCR) analysis of retinal Ccr2 and Ccr5 mRNA measured in control mice and photic-injured mice.
- https://cdn.elifesciences.org/articles/81208/elife-81208-fig4-figsupp2-data1-v1.xlsx
Figure 5
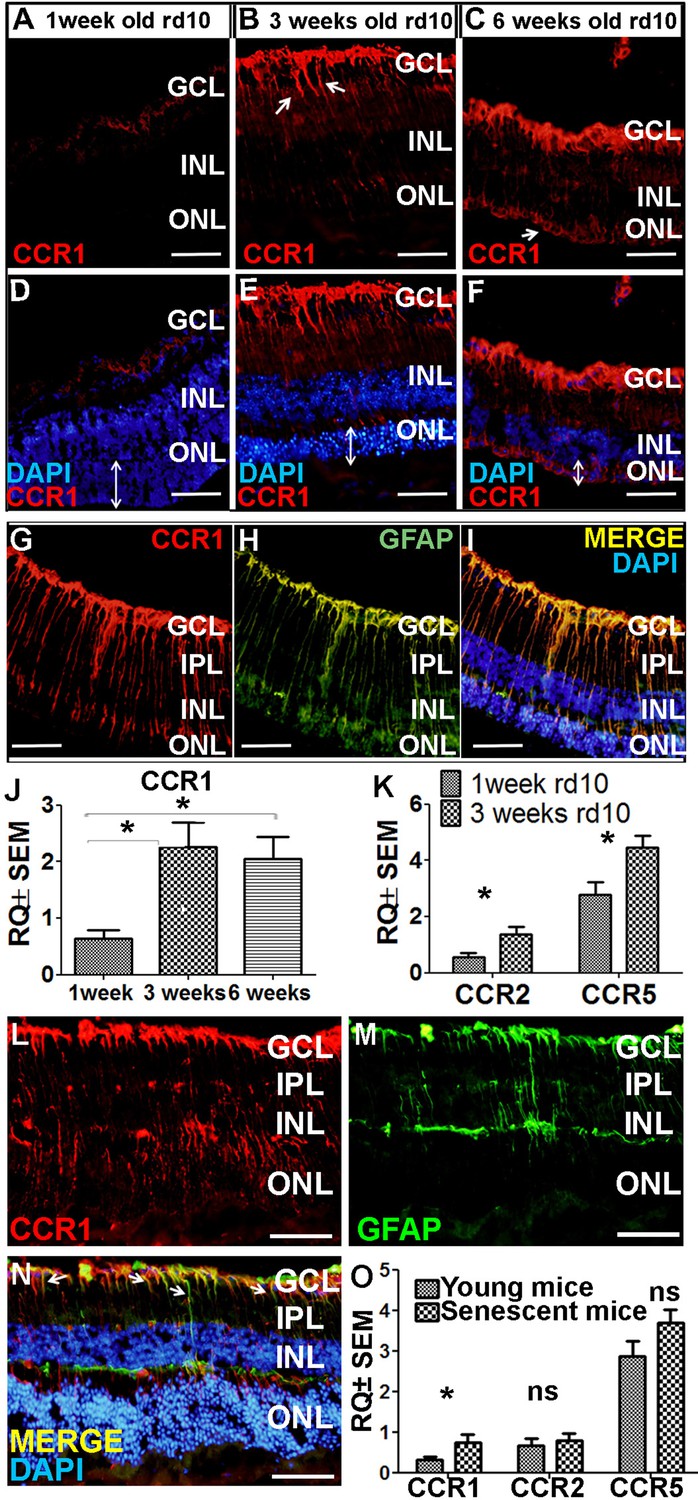
Ccr1 is upregulated in both rd10 mice and senescent mice.
(A–F) Retinal sections were prepared from 1-week-old (A, D), 3-week-old (B, E), and 6-week-old (C, F) rd10 mice and immunostained for CCR1; the nuclei were counterstained with DAPI. Note the increased expression of CCR1 (arrows) at 3 weeks (B) and 6 weeks (C), corresponding with reduced ONL thickness (E and F; double-ended arrows). (G–I) Retinal sections were prepared from a 3-week-old rd10 mouse and co-immunostained for CCR1 (G; red) and GFAP (H; green); the nuclei were counterstained with DAPI (I). Note the co-localization of CCR1 and GFAP in the Müller cells (I). (J) Real-time quantitative PCR (qPCR) analysis of retinal Ccr1 mRNA measured in 1-, 3-, and 6-week-old rd10 mice (n=6 mice for each group, one-way ANOVA with multiple comparisons). (K) Real-time qPCR analysis of retinal Ccr2 and Ccr5 mRNA measured in 1- and 3-week-old rd10 mice (n=4 mice for each group, Student’s t-test). (L–N) Retinal sections were prepared from 18-month-old (senescent) mice and co-immunostained for CCR1 (L; red) and GFAP (M; green); the nuclei were counterstained with DAPI. Note the co-localization of CCR1 and GFAP in the Müller cells (N; arrows). (O) Real-time qPCR analysis of retinal Ccr1, Ccr2, and Ccr5 mRNA measured in young (6-week-old) and senescent (18-month-old) mice (n=8 mice for each group, Student’s t-test). GCL, ganglion cell layer; INL, inner nuclear layer; IPL, inner plexiform layer; ONL, outer nuclear layer. Data shown as mean ± SEM. p-Values indicated by ns, not significant and *p<0.05. Scale bars: 50 µm (A–I and L–N).
-
Figure 5—source data 1
Real-time quantitative PCR (qPCR) analysis of retinal Ccr1, Ccr2, and Ccr5 mRNA measured in 1-, 3-, 6-week-old rd10 mice, in young (6-week-old) and senescent (18-month-old) mice.
- https://cdn.elifesciences.org/articles/81208/elife-81208-fig5-data1-v1.xlsx
Figure 6
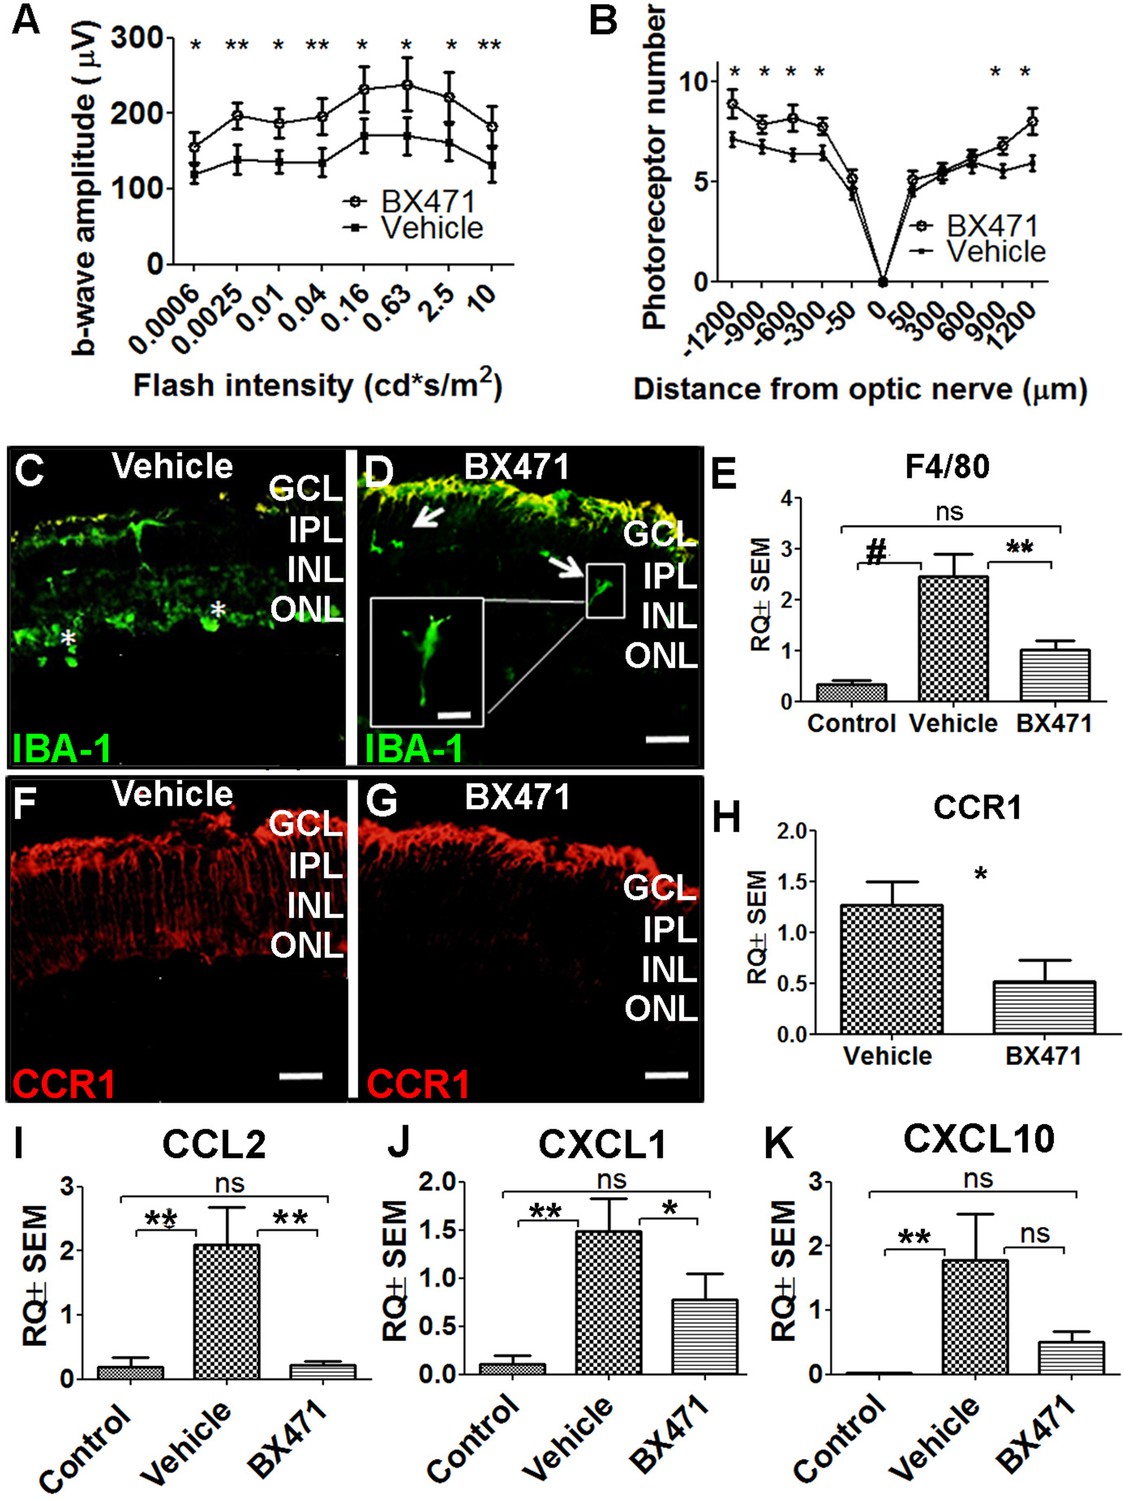
Inhibiting CCR1 reduces the effects of photic injury.
(A) Albino BALB/c mice were subjected to photic injury followed by subcutaneous injections of the CCR1 inhibitor BX471 or vehicle for 5 days. Electroretinography (ERG) recordings were then performed, and the amplitude of the b-wave was measured and is plotted against flash intensity (n=12 eyes for each group, Student’s t-test). (B) The number of photoreceptor nuclei was measured at the indicated distances from the optic nerve (n=14 eyes for each group, Student’s t-test). (C–G) Retinal sections were prepared from vehicle-treated mice (C) and BX471-treated mice (D) and immunostained for the microglial cell marker IBA-1. The asterisks indicate amoeboid-shaped cells in the ONL and subretinal layer (C), and the arrows indicate elongated cells in the GCL and IPL, with one cell shown in a magnified view (D; inset). (E) Real-time quantitative PCR (qPCR) analysis of retinal Adgre1 mRNA (which encodes the macrophage marker F4/80) in control mice, vehicle-treated photic-injured mice, and BX471-treated photic-injured mice (n=6 mice for each group, one-way ANOVA with multiple comparisons). (F–G) Retinal sections were prepared from vehicle-treated photic-injured mice (F) and BX471-treated photic-injured mice (G) and immunostained for CCR1. (H) Real-time qPCR analysis of retinal Ccr1 mRNA measured in vehicle-treated photic-injured mice and BX471-treated photic-injured mice (n=6 mice for each group, Student’s t-test). (I–K) Real-time qPCR analysis of retinal Ccl2 (I), Cxcl1 (J), and Cxcl10 (K) mRNA measured in control mice, vehicle-treated photic-injured mice, and BX471-treated photic mice (n=6 mice for each group, one-way ANOVA with multiple comparisons). GCL, ganglion cell layer; INL, inner nuclear layer; IPL, inner plexiform layer; ONL, outer nuclear layer. Data shown as mean ± SEM. p-Values indicated by ns, not significant and *p<0.05, **p<0.01, #p<0.001. Scale bars: 50 µm (C–D and F–G) and 20 µm (inset in D).
-
Figure 6—source data 1
Electroretinography (ERG) b-wave recordings and outer nuclear layer (ONL) thickness of vehicle-treated mice and BX471-treated mice.
Real-time quantitative PCR (qPCR) analysis of retinal F4/80, Ccr1, Ccl2, Cxcl1, and Cxcl10 mRNA in control mice, vehicle-treated photic-injured mice, and BX471-treated photic-injured mice.
- https://cdn.elifesciences.org/articles/81208/elife-81208-fig6-data1-v1.xlsx
Figure 7
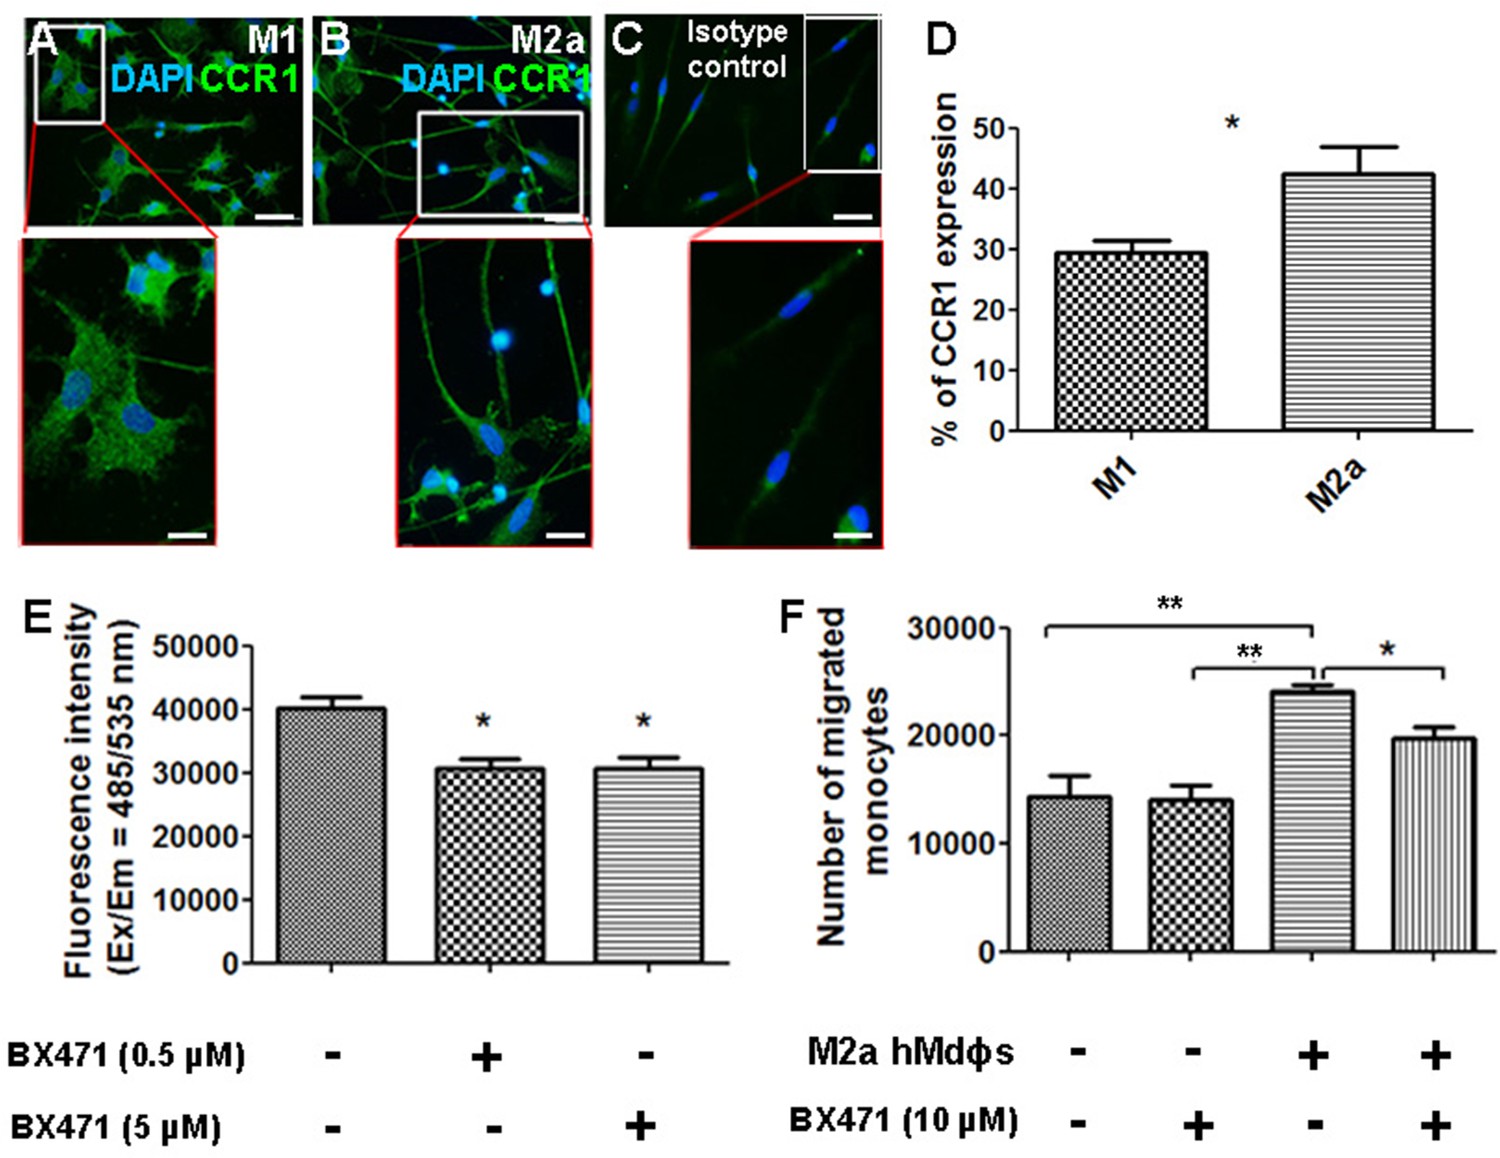
Inhibiting CCR1 modulates the functional properties of M2a hMdɸs.
(A–C) M1 (A) and M2a (B) hMdɸs were immunostained for CCR1 (green); magnified views are shown below. (D) Summary of the percentage of CCR1-postive cells measured using cell sorting analysis of CCR1-stained M1 hMdɸ and M2a hMdɸs (n=5 per group, Student’s t-test). (E) Summary of reactive oxygen species (ROS) levels measured in untreated M2a hMdɸs and M2a hMdɸs treated with 0.5 or 5 µM BX471 (n=4 per group, one-way ANOVA with multiple comparisons). (F) Summary of the migration of monocytes treated or not with 10 µM BX471 that migrated toward the M2a hMdɸs using a Boyden chamber (n=3 per group, one-way ANOVA with multiple comparisons). Data shown as mean ± SEM. p-Values indicated by *p<0.05 and **p<0.01. Scale bars: 50 µm (A–C) and 20 µm (insets in A–C).
-
Figure 7—source data 1
Cell sorting analysis of CCR1-stained M1 hMdɸ and M2a hMdɸs.
Reactive oxygen species (ROS) levels and migration level measured in M2a hMdɸs groups.
- https://cdn.elifesciences.org/articles/81208/elife-81208-fig7-data1-v1.xlsx
Tables
Table 1
qPCR Primer Sequences.
| Gene | Forward (5’–3’) | Reverse (5’–3’) |
|---|---|---|
| Human GAPDH Human CXCL10 Human CCL17 Human CD163 | AACAGCCTCAAGATCATCAGC GGTGAGAAGAGATGTCTGAATCC AGGGATGCCATCGTTTTTGTAA CAGTGCAGAAAACCCCACAA | GGATGATGTTCTGGAGAGCC GTCCATCCTTGGAAGCACTGCA GCTTCAAGACCTCTCAAGGCT AAAGGATGACTGACGGGATGA |
| Human CCL13 | ATCTCCTTGCAGAGGCTGAA | CTTCTCCTTTGGGTCAGCAC |
| Human CCL23 | TTTGAAACGAACAGCGAGTG | CAGCATTCTCACGCAAACC |
| Human CCL14 | ATACAGCTAAAGTTGGTGGGGG | TGGTGATGAAGACAATTCCGGG |
| Human CCR1 | AAGTCCCTTGGAACCAGAGAGAAG | CCAACCAGGCCAATGACAAA |
| Mouse Gapdh | AACTTTGGCATTGTGGAAGG | ACACATTGGGGGTAGGAACA |
| Mouse Ccr1 | GTTGGGACCTTGAACCTTGA | CCCAAAGGCTCTTACAGCAG |
| Mouse Ccr2 | GAAGAGGGCATTGGATTCAC | TATGCCGTGGATGAACTGAG |
| Mouse Ccr5 | TCTCCTAGCCAGAGGAGGTG | TGTCATAGCTATAGGTCGGAACTG |
| Mouse Adgre1* | GCATCATGGCATACCTGTTC | AGTCTGGGAATGGGAGCTAA |
| Mouse Ccl2 | AGGTCCCTGTCATGCTTCTG | TCTGGACCCATTCCTTCTTG |
| Mouse Cxcl1 | GACCATGGCTGGGATTCACC | CCAAGGGAGCTTCAGGGTCA |
| Mouse Cxcl10 | CATCCCTGCGAGCCTATCC | CATCTCTGCTCATCATTCTTTTTCA |
-
*
Encodes the F4/80 protein, also known as EMR1 (EGF-like module-containing mucin-like hormone receptor-like 1).
Table 2
Multiplex ELISA results.
| p-Value | M1:M2a ratio | M2a | M1 | Protein name |
|---|---|---|---|---|
| 0.0123 | 0.00 | 373 | 0 | TGFa |
| 0.0009 | 0.10 | 7457 | 826 | CCL14 |
| 0.0001 | 0.11 | 36,571 | 3821 | CCL13 |
| 0.0020 | 0.27 | 14,645 | 3866 | CCL17 |
| 0.0097 | 0.51 | 6530 | 3007 | CCL23 |
| 0.0159 | 0.52 | 82,038 | 43,946 | CCL24 |
| 0.0409 | 0.70 | 74,990 | 48,575 | PDGFB |
| 0.0298 | 0.78 | 937 | 712 | IL-7 |
| 0.0287 | 0.81 | 869 | 688 | TNFb |
| 0.0026 | 99.24 | 1458 | 109,591 | CXCL13 |
| 0.0558 | 40.72 | 394 | 9887 | CSF3 |
| 0.00002 | 39.66 | 16,545 | 238,286 | IL-6 |
| 0.0002 | 17.91 | 635 | 7254 | CXCL11 |
| 0.0002 | 15.27 | 2979 | 32,877 | CCL19 |
| 0.0008 | 6.33 | 5322 | 30,523 | CCL20 |
| 0.0032 | 5.47 | 28,468 | 94,382 | CCL5 |
| 0.0108 | 4.74 | 952 | 4515 | VEGF |
| 0.0210 | 3.08 | 5085 | 14,169 | IL-10 |
| 0.0572 | 2.60 | 6683 | 18,212 | CXCL6 |
| 0.0219 | 2.50 | 14,774 | 27,516 | CCL1 |
| 0.0029 | 2.43 | 150 | 296 | CXCL12 |
| 0.0008 | 2.27 | 8696 | 19,269 | CXCL10 |
| 0.0019 | 1.40 | 31,868 | 44,135 | CCL7 |
| 0.0506 | 1.21 | 365 | 442 | IL-11 |
Additional files
-
MDAR checklist
- https://cdn.elifesciences.org/articles/81208/elife-81208-mdarchecklist1-v1.docx
-
Supplementary file 1
Cytokines array result.
- https://cdn.elifesciences.org/articles/81208/elife-81208-supp1-v1.xlsx
Download links
A two-part list of links to download the article, or parts of the article, in various formats.
Downloads (link to download the article as PDF)
Open citations (links to open the citations from this article in various online reference manager services)
Cite this article (links to download the citations from this article in formats compatible with various reference manager tools)
CCR1 mediates Müller cell activation and photoreceptor cell death in macular and retinal degeneration
eLife 12:e81208.
https://doi.org/10.7554/eLife.81208


