Affectionate touch and diurnal oxytocin levels: An ecological momentary assessment study
- Institute of Medical Psychology, Center for Psychosocial Medicine, Heidelberg University Hospital, Germany
- Heidelberg University, Germany
- Department of Social Neuroscience, Faculty of Psychology, Ruhr University Bochum, Germany
- Department for Education and Human Development, DIPF|Leibniz Institute for Research and Information in Education, Germany
- Center for Research on Individual Development and Adaptive Education of Children at Risk, Germany
- Department of Behavioural Medicine, Faculty of Medicine, Institute of Basic Medical Sciences, University of Oslo, Norway
- Department of Psychiatry, University of Oldenburg, Germany
Figures
Figure 1
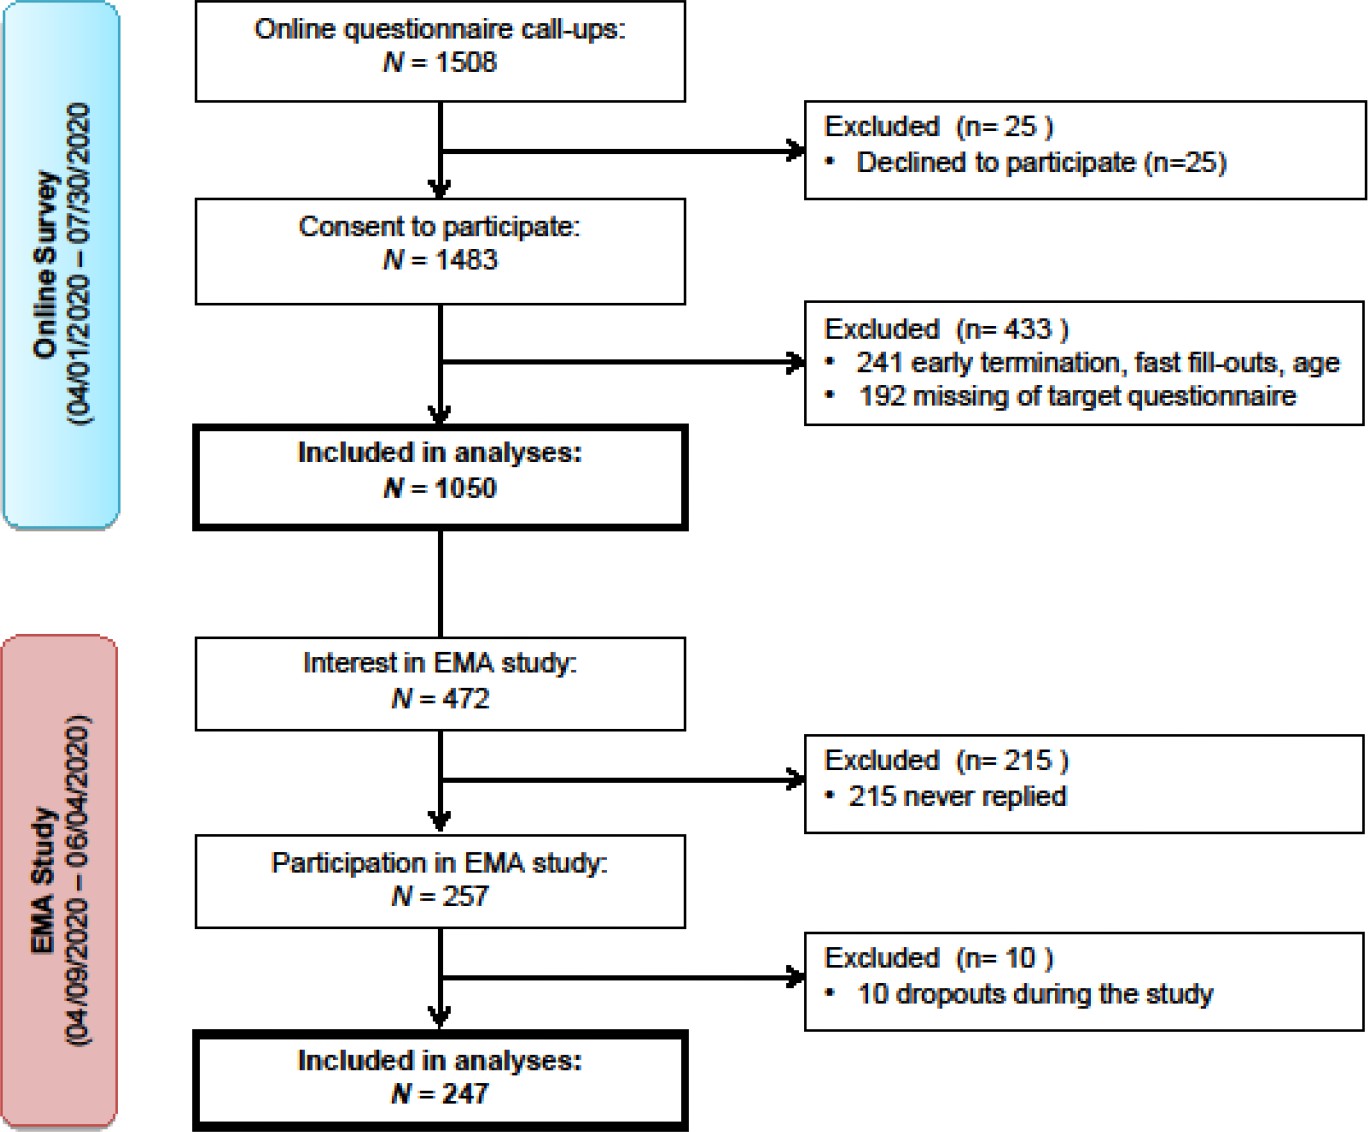
Flowchart of the recruitment process.
Figure 1 depicts the recruitment stages of both the online and the ecologically momentary assessments (EMA) study. Participants were recruited between April 1 and July 30, 2020, via online media and local newspapers. Inclusion criteria: fluency in German, minimum age of 18 y, and willingness to participate voluntarily. In total, 1483 individuals agreed to participate, of whom 1050 participants filled out the online questionnaires of interest. Out of the 472 participants who were interested in the EMA study, 247 finished the assessments.
Figure 2 with 1 supplement
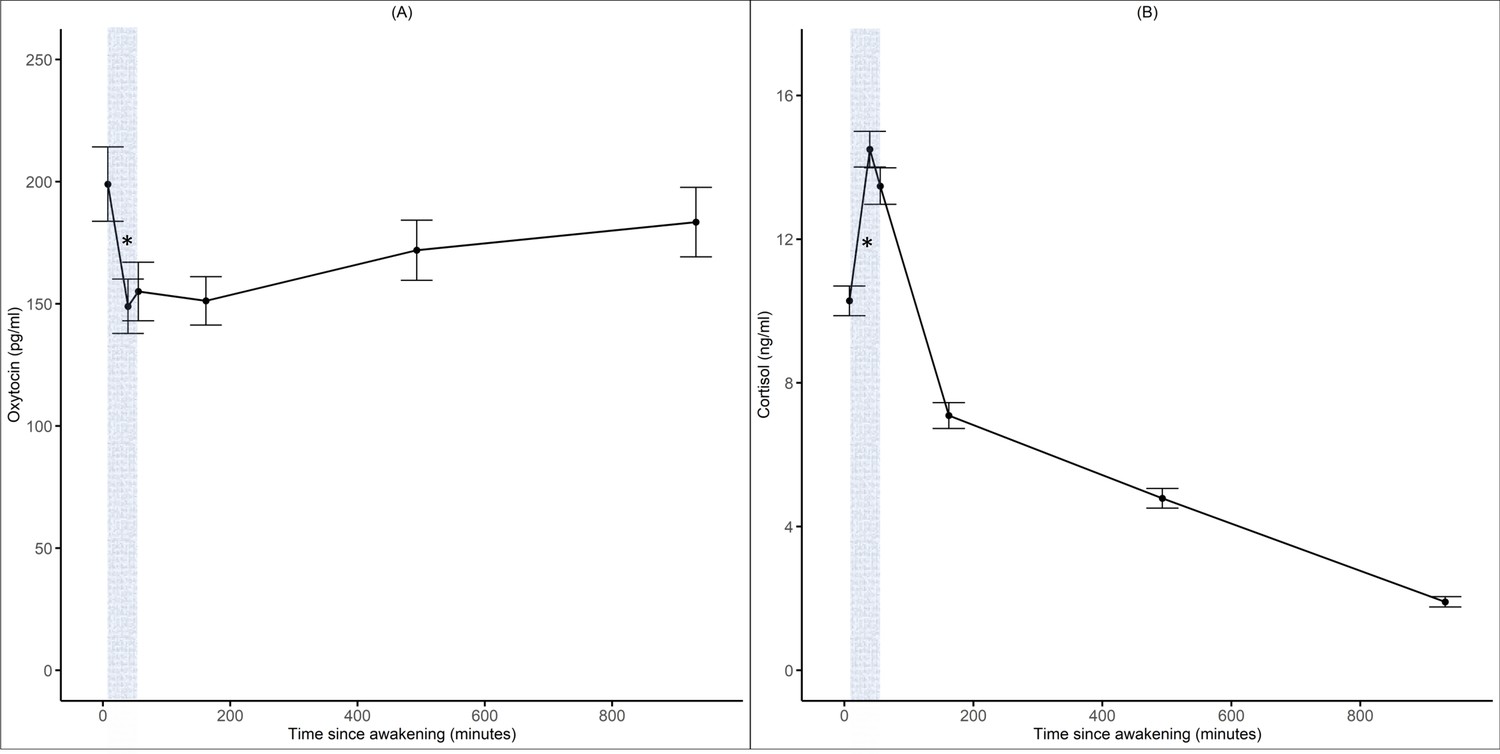
Diurnal oxytocin and cortisol trajectories.
Panels (A) and (B) illustrate the daily oxytocin (pg/ml) and cortisol (ng/ml) trajectories across 2 d and all participants. Gray area indicates cortisol and oxytocin awakening response. Error bars indicate 95% confidence intervals.
Figure 2—figure supplement 1
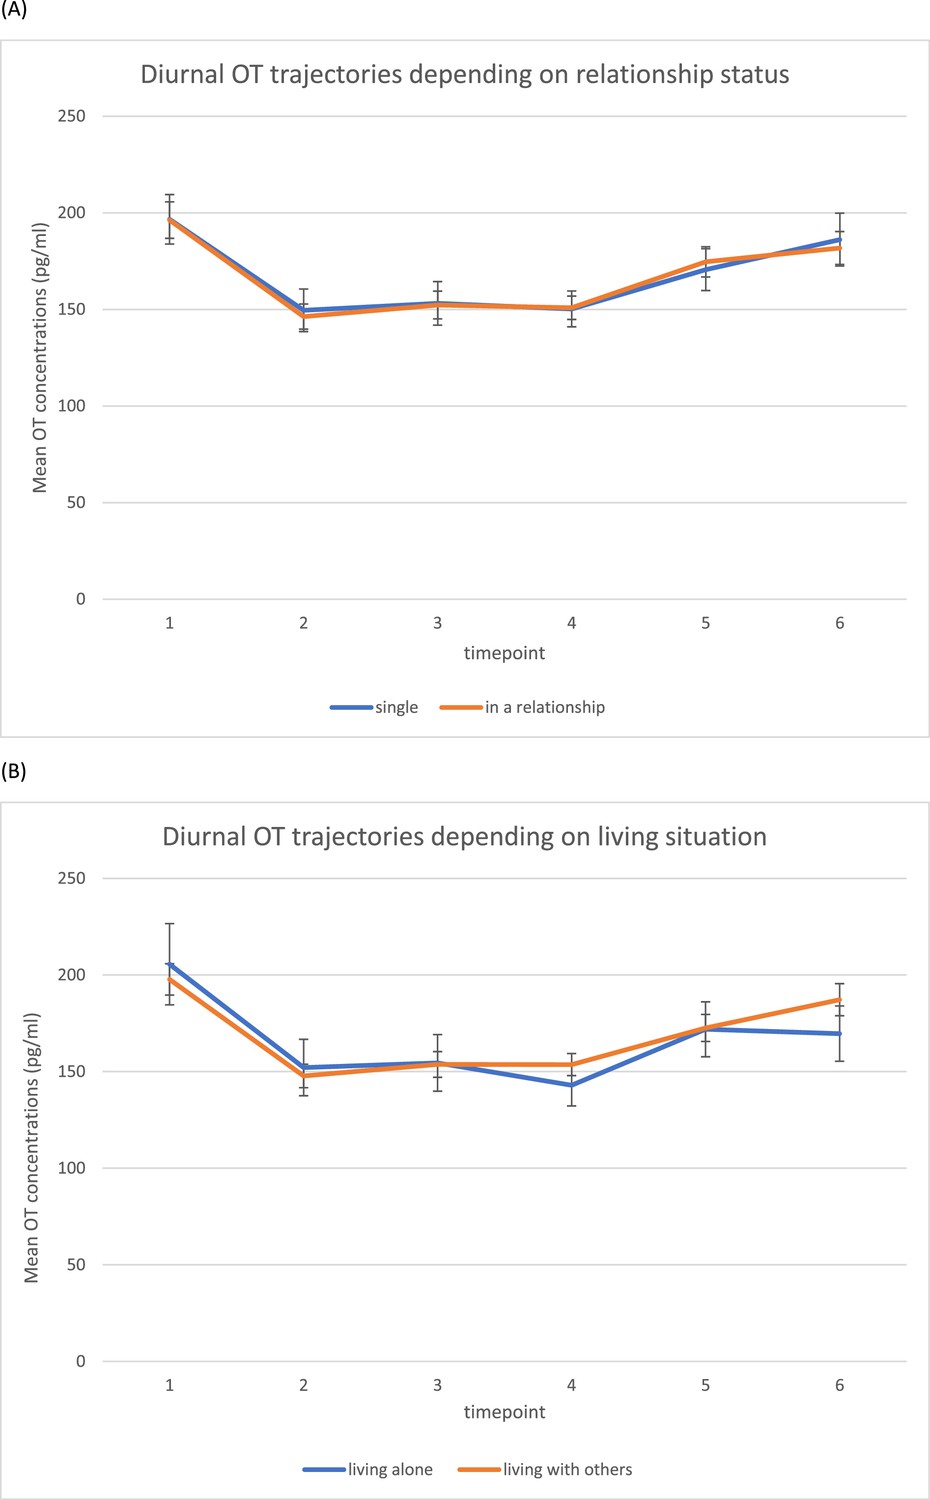
Diurnal oxytocin levels depending on relationship status (A) and living arrangements (B).
Figure 3
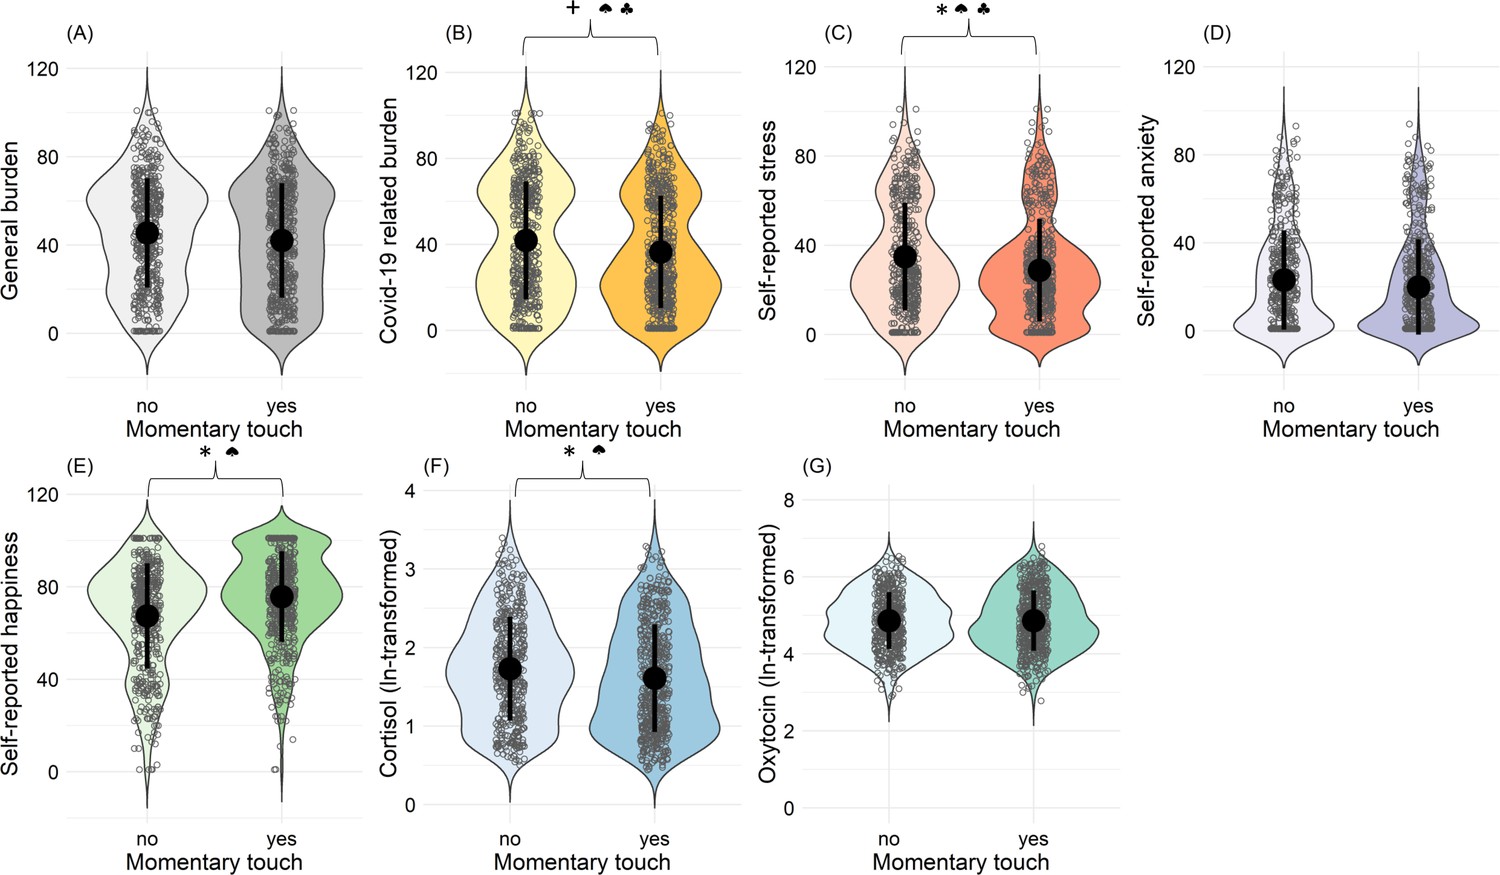
Associations between occurrence of affectionate touch and psychological and hormonal state.
Panels (A) to (G) illustrate violin plots with density distributions of subjective ratings of general and Covid-19-related burden, stress, anxiety, happiness, cortisol, and oxytocin, depending on whether touch occurred or not. Each dot represents one assessment. Central dots (black) represent each mean. Black lines represent the standard deviations. * indicates statistically significant results (p<0.05). +indicates a statistical trend (p<0.1). ♠ indicates statistically significant between-person effect. ♣ indicates statistically significant within-person effect.
Figure 4
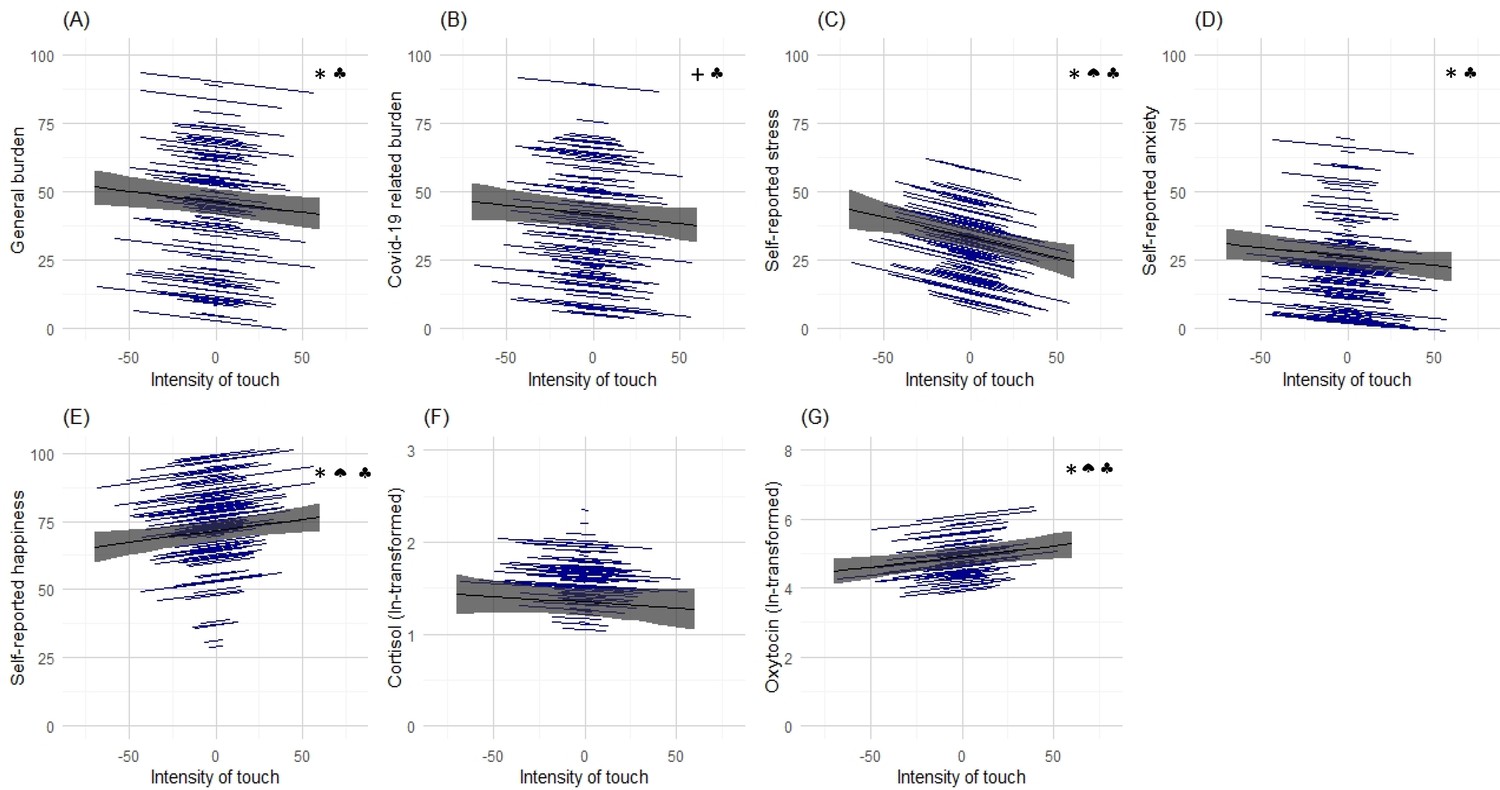
Associations between momentary affectionate touch intensity and psychological and hormonal state.
Panels (A) to (G) illustrate the results of random intercept and fixed slopes models depicting associations of momentary intensity of touch with self-reported general burden and Covid-19 related burden, stress, anxiety, happiness, cortisol, and oxytocin. Gray lines indicate the overall predicted slope, whereas the blue lines indicate the individual’s predicted slopes with their minimum and maximum predicted values as endpoints. Gray areas depict the 95% confidence band. * indicates statistically significant results (p<0.05).+indicates a statistical trend (p<0.1). ♠ indicates statistically significant between-person effect. ♣ indicates statistically significant within-person effect.
Tables
Table 1
Sample characteristics of online survey and ecological momentary assessment.
| Sample characteristics of online survey participants | ||||
|---|---|---|---|---|
| Men (n = 227) | Women (n = 815) | Non-binary (n = 4) | Missing (n = 4) | |
| M (SD) | M (SD) | M (SD) | M (SD) | |
| Age (years) | 34.67 (15.18) | 36.74 (14.58) | 45.50 (24.73) | 40.25 (15.39) |
| General psychological distress* | 10.22 (6.75) | 13.18 (7.49) | 21.00 (5.89) | 19.50 (14.66) |
| Anxiety† | 5.15 (3.68) | 6.95 (4.12) | 10.50 (3.11) | 9.25 (7.68) |
| Depression ‡ | 5.07 (3.55) | 6.22 (4.10) | 10.50 (3.32) | 10.25 (8.18) |
| Loneliness § | 37.18 (10.15) | 39.33 (10.95) | 53.00 (13.24) | 47.50 (19.50) |
| Attitude toward social touch ¶ | 33.58 (10.18) | 34.76 (12.27) | 38.50 (23.39) | 40.75 (16.92) |
| Sample characteristics of ecological momentary assessment participants | ||||
| Men (n = 74) | Women (n = 173) | |||
| M | SD | M | SD | |
| Age (years) | 30.99 | 13.62 | 33.05 | 12.41 |
| Cortisol (ng/ml) ** | 8.40 | 2.02 | 8.68 | 2.31 |
| Oxytocin (pg/ml)** | 176.12 | 106.18 | 164.54 | 96.74 |
| Covid-19-related burden** | 36.98 | 24.61 | 41.78 | 23.49 |
| General burden | 39.96 | 23.89 | 47.20 | 21.78 |
| Stress levels†† | 29.49 | 15.88 | 35.62 | 17.00 |
| Anxiety levels†† | 18.39 | 15.98 | 24.14 | 20.08 |
| Happiness levels†† | 71.13 | 17.09 | 67.87 | 18.42 |
| Intensity of affectionate touch†† | 65.21 | 20.00 | 56.57 | 23.13 |
-
Table depicts means (M) and standard deviations (SD). Number of participants indicated as (n).
-
*
Hospital Anxiety and Depression Scale (HADS total score).
-
†
HADS Anxiety subscale.
-
‡
HADS Depression subscale.
-
§
University of California, Los Angeles Loneliness Scale (UCLA Loneliness).
-
¶
Social Touch Questionnaire (STQ).
-
**
Out of 2964 possible data points, n = 2724 remained for analysis after excluding outliers, samples that were not stored as instructed or below detection limit, sampling problems.
-
††
Momentary self-reported state.
Table 2
Results of the associations between affectionate touch and self-reported psychological affective states.
| (A) Random intercept and random slopes models | |||||
|---|---|---|---|---|---|
| Effects | General burden | Covid-19 burden | Stress | Anxiety | Happiness |
| Fixed effectsWithin-person | |||||
| Intercept | 47.734 (4.668); p<0.001 | 43.145 (5.009); p<0.001 | 34.431 (3.596); p<0.001 | 21.096 (3.958); p<0.001 | 71.080 (3.778); p<0.001 |
| Touch* | 0.462 (1.561); p=0.767 | –2.660 (1.424); p=0.062 | –4.187 (1.994); p=0.036 | –0.217 (1.510); p=0.886 | 1.557 (1.599); p=0.331 |
| Between-person | |||||
| Touch* | –5.560 (3.791); p=0.144 | –7.478 (4.068); p=0.067 | –7.534 (2.907); p=0.010 | –1.483 (3.210); p=0.645 | 12.420 (3.068); p<0.001 |
| Covariates | |||||
| Age | –0.186 (0.122); p=0.128 | –0.158 (0.131); p=0.228 | –0.136 (0.094); p=0.150 | –0.090 (0.103); p=0.388 | 0.051 (0.099); p=0.605 |
| Sex† | 4.709 (3.325); p=0.158 | 3.761 (3.565); p=0.293 | 4.986 (2.524); p=0.050 | 6.568 (2.814); p=0.021 | –3.318 (2.681); p=0.217 |
| Day | –2.196 (0.864); p=0.011 | –2.602 (0.981); p=0.008 | –4.189 (1.228); p<0.001 | –3.145 (0.875); p<0.001 | 1.637 (0.901); p=0.070 |
| Random effects (SD) | |||||
| Intercept | 21.487 | 22.794 | 13.694 | 17.647 | 16.597 |
| Touch* | 9.141 | 0.642 | 8.094 | 7.906 | 8.945 |
| Residual | 12.821 | 14.864 | 18.741 | 13.076 | 13.478 |
| (B) Random intercept and fixed slopes models | |||||
| Effects | General burden | Covid-19 burden | Stress | Anxiety | Happiness |
| Fixed effects Within-person | |||||
| Intercept | 44.439 (6.130); p<0.001 | 39.748 (6.114); p<0.001 | 32.966 (4.609); p<0.001 | 24.466 (5.277); p<0.001 | 71.437 (4.626); p<0.001 |
| Touch intensity | –0.077 (0.028); p=0.008 | –0.068 (0.036); p=0.058 | –0.148 (0.044); p<0.001 | –0.065 (0.029); p=0.026 | 0.085 (0.030); p=0.005 |
| Between-person | |||||
| Touch intensity | –0.121 (0.086); p=0.163 | –0.138 (0.087); p=0.115 | –0.223 (0.067); p=0.001 | –0.102 (0.074); p=0.171 | 0.314 (0.066); p<0.001 |
| Covariates | |||||
| Age | –0.031 (0.161); p=0.847 | –0.082 (0.161); p=0.610 | –0.090 (0.125); p=0.475 | –0.158 (0.143); p=0.270 | 0.007 (0.122); p=0.952 |
| Sex† | 2.647 (4.253); p=0.535 | 4.143 (4.214); p=0.327 | 2.650 (3.069); p=389 | 5.932 (3.645); p=0.106 | –0.030 (3.171); p=0.993 |
| Day | –3.788 (1.056); p<0.001 | –4.930 (1.302); p<0.001 | –4.791 (1.583); p=0.003 | –3.718 (1.078); p<0.001 | 3.695 (1.112); p=0.001 |
| Random effects (SD) | |||||
| Intercept | 22.467 | 21.601 | 13.206 | 18.622 | 15.842 |
| Residual | 11.812 | 14.626 | 18.300 | 12.121 | 12.591 |
-
Table depicts coefficients (standard errors in parentheses) and p-values of associations between (A) the presence and (B) intensity of affectionate touch and psychological variables. Number of observations = 593–1023, Number of participants 162–227.
-
*
0 = no, 1 = yes.
-
†
0 = male, 1 = female.
Table 3
Results of the associations between affectionate touch and hormonal levels.
| (A) Random intercept and random slopes models | (B) Random intercept and fixed slopes models | ||||
|---|---|---|---|---|---|
| Effects | Cortisol | Oxytocin | Effects | Cortisol | Oxytocin |
| Fixed effectsWithin-person | Fixed effectsWithin-person | ||||
| Intercept | 2.941 (0.165); p<0.001 | 4.973 (0.405); p<0.001 | Intercept | 2.744 (0.370); p<0.001 | 4.657 (0.798); p<0.001 |
| Touch* | –0.019 (0.060); p=0.756 | –0.030 (0.076); p=0.688 | Touch intensity | –0.001 (0.001); p=0.367 | 0.006 (0.002); p=0.003 |
| Between-person | Between-person | ||||
| Touch* | –0.121 (0.057); p=0.036 | –0.145 (0.147); p=0.329 | Touch intensity | –0.001 (0.002); p=0.504 | 0.002 (0.003); p=0.489 |
| Covariates | Covariates | ||||
| Age | –0.001 (0.002); p=0.633 | –0.013 (0.005); p=0.011 | Age | –0.001 (0.003); p=0.776 | –0.019 (0.007); p=0.007 |
| Sex† | –0.020 (0.044); p=0.647 | –0.129 (0.123); p=0.293 | Sex† | –0.001 (0.063); p=0.989 | –0.167 (0.151); p=0.272 |
| Day | –0.050 (0.035); p=0.155 | –0.010 (0.059); p=0.863 | Day | –0.032 (0.051); p=0.528 | 0.077 (0.086); p=0.370 |
| Time-fall ‡ | –0.476 (0.023); p<0.001 | 0.051 (0.035); p=0.145 | Time-fall ‡ | –0.471 (0.032); p<0.001 | 0.025 (0.049); p=0.611 |
| Body mass index | –0.014 (0.005); p=0.009 | 0.012 (0.015); p=0.422 | Body mass index | 0.005 (0.009); p=0.585 | 0.014 (0.022); p=0.528 |
| Eating* | –0.077 (0.075); p=0.302 | 0.032 (0.117); p=0.788 | Eating* | –0.125 (0.099); p=0.210 | 0.099 (0.149); p=0.506 |
| Drinking* | –0.007 (0.081); p=0.933 | 0.045 (0.126); p=0.722 | Drinking* | –0.011 (0.108); p=0.919 | –0.039 (0.161); p=0.810 |
| Caffeine* | 0.127 (0.043); p=0.004 | –0.099 (0.070); p=0.158 | Caffeine* | 0.131 (0.064); p=0.043 | 0.157 (0.102); p=0.125 |
| Alcohol* | –0.030 (0.063); p=0.628 | –0.174 (0.096); p=0.070 | Alcohol* | –0.012 (0.072); p=0.865 | –0.154 (0.112); p=0.171 |
| Cigarettes* | 0.104 (0.072); p=0.153 | 0.053 (0.139); p=0.705 | Cigarettes* | 0.089 (0.098); p=0.368 | –0.054 (0.179); p=0.766 |
| Physical activity* | 0.039 (0.040); p=0.332 | 0.108 (0.065); p=0.098 | Physical activity* | –0.072 (0.056); p=0.199 | 0.014 (0.086); p=0.873 |
| Sleep duration § | –0.003 (0.004); p=0.371 | –0.009 (0.008); p=0.272 | Sleep duration § | –0.029 (0.029); p=0.321 | 0.046 (0.060); p=0.438 |
| Sleep quality ¶ | –0.001 (0.001); p=0.289 | –0.000 (0.002); p=0.912 | Sleep quality ¶ | –0.001 (0.001); p=0.477 | –0.000 (0.002); p=0.960 |
| Problem falling asleep* | 0.031 (0.053); p=0.552 | –0.245 (0.101); p=0.015 | Problem falling asleep* | 0.030 (0.081); p=0.709 | –0.133 (0.148); p=0.370 |
| Sleeping pills* | 0.032 (0.109); p=0.772 | 0.031 (0.254); p=0.904 | Sleeping pills* | –0.203 (0.290); p=0.487 | 0.771 (0.453); p=0.093 |
| Forced awake* | –0.008 (0.041); p=0.838 | 0.012 (0.088); p=0.894 | Forced awake* | 0.016 (0.058); p=0.788 | 0.075 (0.117); p=0.520 |
| Brushing teeth* | 0.045 (0.036); p=0.217 | 0.096 (0.056); p=0.090 | Brushing teeth* | 0.029 (0.051); p=0.568 | 0.016 (0.077); p=0.839 |
| Random effects (SD) | Random effects (SD) | ||||
| Intercept | 0.149 | 0.542 | Intercept | 0.179 | 0.546 |
| Touch* | 0.273 | 0.166 | Touch intensity | – | – |
| Residual | 0.334 | 0.477 | Residual | 0.339 | 0.461 |
-
Table depicts unstandardized coefficients (standard errors in parentheses) and p-values of hormonal associations with (A) the presence and (B) intensity of affectionate touch. Number of observations = 251–545. Number of participants = 88–152.
-
*
0 = no, 1 = yes.
-
†
0 = male, 1 = female.
-
‡
0 = time point 1–3, 1 = time point 4, 2 = time point 5, 3 = time point 6.
-
§
In hours.
-
¶
1 = very bad, 101 = very good.
Additional files
Download links
A two-part list of links to download the article, or parts of the article, in various formats.
Downloads (link to download the article as PDF)
Open citations (links to open the citations from this article in various online reference manager services)
Cite this article (links to download the citations from this article in formats compatible with various reference manager tools)
Affectionate touch and diurnal oxytocin levels: An ecological momentary assessment study
eLife 12:e81241.
https://doi.org/10.7554/eLife.81241


