Human thymopoiesis produces polyspecific CD8+ α/β T cells responding to multiple viral antigens
- Sorbonne Université, INSERM, Immunology‐Immunopathology‐Immunotherapy, France
- AP‐HP, Hôpital Pitié‐Salpêtrière, Clinical Investigation Center for Biotherapies (CIC‐BTi) and Immunology‐Inflammation‐Infectiology and Dermatology Department (3iD), France
- Université Paris Cité, Institut Cochin, CNRS, INSERM, France
- ILTOO pharma, Statistical department, France
- CRCINA, INSERM, CNRS, Université d'Angers, Université de Nantes, France
- Center of Life Sciences, Skoltech, Russian Federation
- Assistance Publique Hôpitaux de Paris, Service de Diabétologie et Immunologie Clinique, Cochin Hospital, France
Figures
Figure 1 with 3 supplements

Thymocyte differentiation produces clustered CDR3s with high generation probability and preferential TRB VJ gene combinations.
(A) Representation of βCDR3aa networks from DPCD3−, DPCD3+, and CD8+. Each dot represents a single CDR3. Dots are connected (forming clusters) by edges defined by Levenshtein distance of ≤1 (one AA substitution/insertion/deletion). (B) Percentage of clustered βCDR3aa (*p=0.0152 and ****p<0.0001, Mann–Whitney test, mean ± s.e.m, n=13). (C) βCDR3aa clustered from DPCD3+ and ThyCD8. Each dot represents a single βCDR3aa. The colour scale represents the number of neighbors for each CDR3. Blue dots have only one connection while red dots have more than three connections (up to 30). (D) Degree of clustered βCDR3aa (****p<0.0001, Mann–Whitney test, mean ± s.e.m, n=13). (E) Generation probability of dispersed and clustered βCDR3aa in DPCD3+ or CD8+ cells (****p<0.0001, Mann–Whitney test, mean ± s.e.m, n=13). (F) Correlation between Pgen and βCDR3 number of connections in the CD8+ thymocyte repertoire. Contour plot represent the generation probability as a function of βCDR3 connections in the CD8+ thymocytes for donor P29. Linear regression curves between Pgen and number of connections are represented as red dotted lines (‘y’ represent the regression curve’s equation). Pearson correlation coefficient ‘R’ and p value ‘p’ are calculated for each individual (Figure 3D). (G) PCA analysis of TRB VJ gene combinations in CD8 thymocytes. Blue: dispersed nodes; Red: clustered nodes. AA, amino acid; PCA, principal component analysis.
Figure 1—figure supplement 1
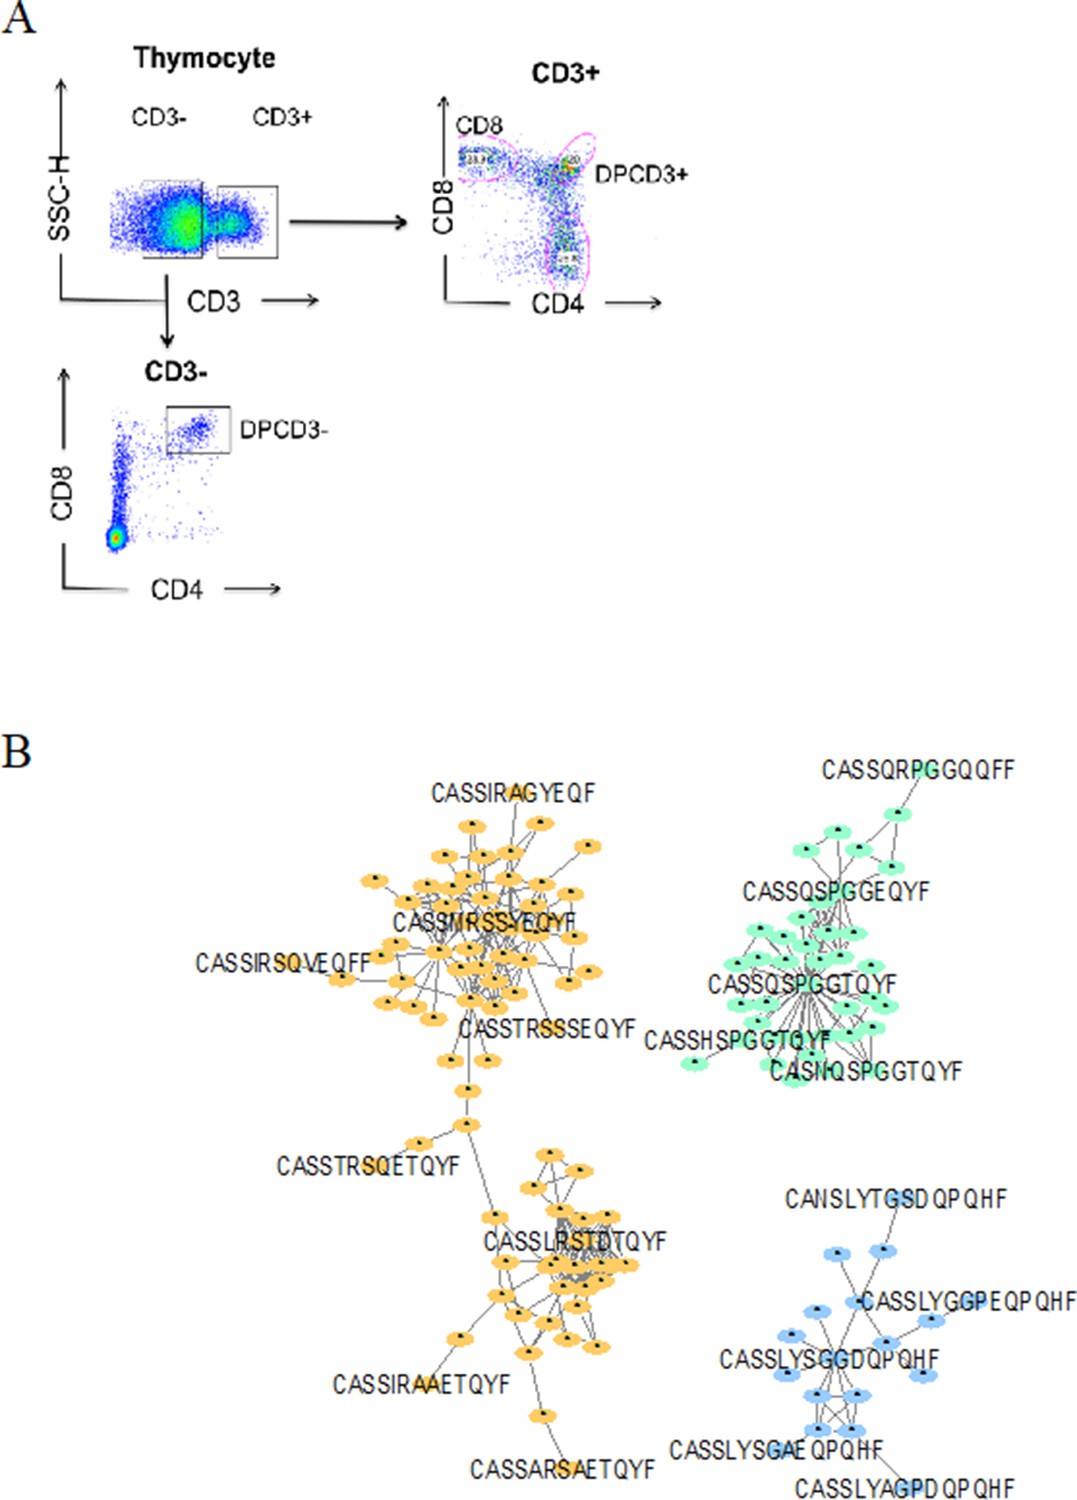
Dotplot of thymocytes sorting.
(A) Dotplot of thymocytes sorting. Cells from the different patients were sorted according to their phenotypes: CD3+CD4CD8+ for ThyCD8, CD3+CD4+CD8+ for DPCD3+ and CD3−CD4+CD8+ for DPCD3−. (B) Networks of βCDR3s specific for GILGFVFTL from influenza (orange), GLCTLVAML from Epstein-Barr virus (green), and FPRPWLHGL from human immunodeficiency virus (blue) are shown. These βCDR3s are from TCRs identified on CD8 T lymphocytes isolated with class I tetramer loaded with the indicated peptides (Tickotsky et al., 2017; Shugay et al., 2018). Each node represents a clonotype. Two different clonotypes are connected if their βCDR3s differ by at most one amino acid (LD≤1).
Figure 1—figure supplement 2
Properties of thymocytes’ TCRs.
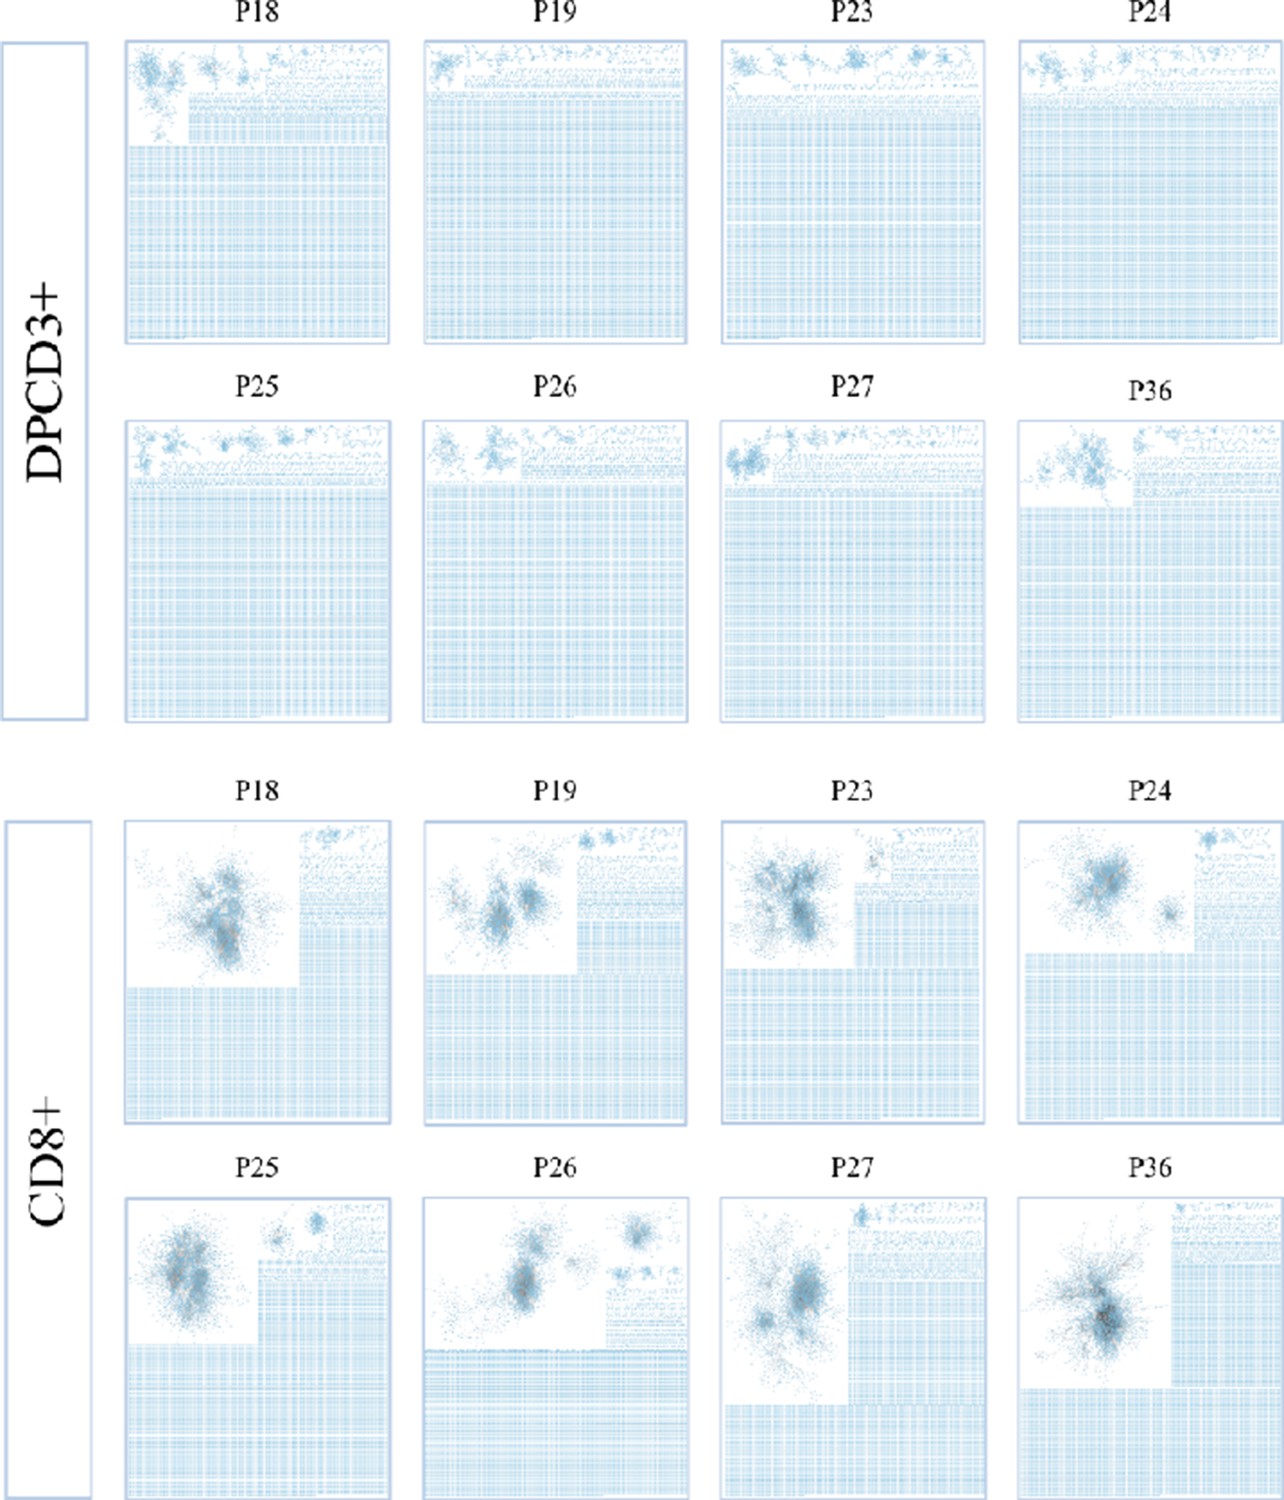
βCDR3 network during thymopoiesis. Representation of the 18,000 most frequent βCDR3 networks from DPCD3+ and CD8+ thymocytes of eight donors (Pn).
Figure 1—figure supplement 3
Properties of thymocytes’ TCRs.
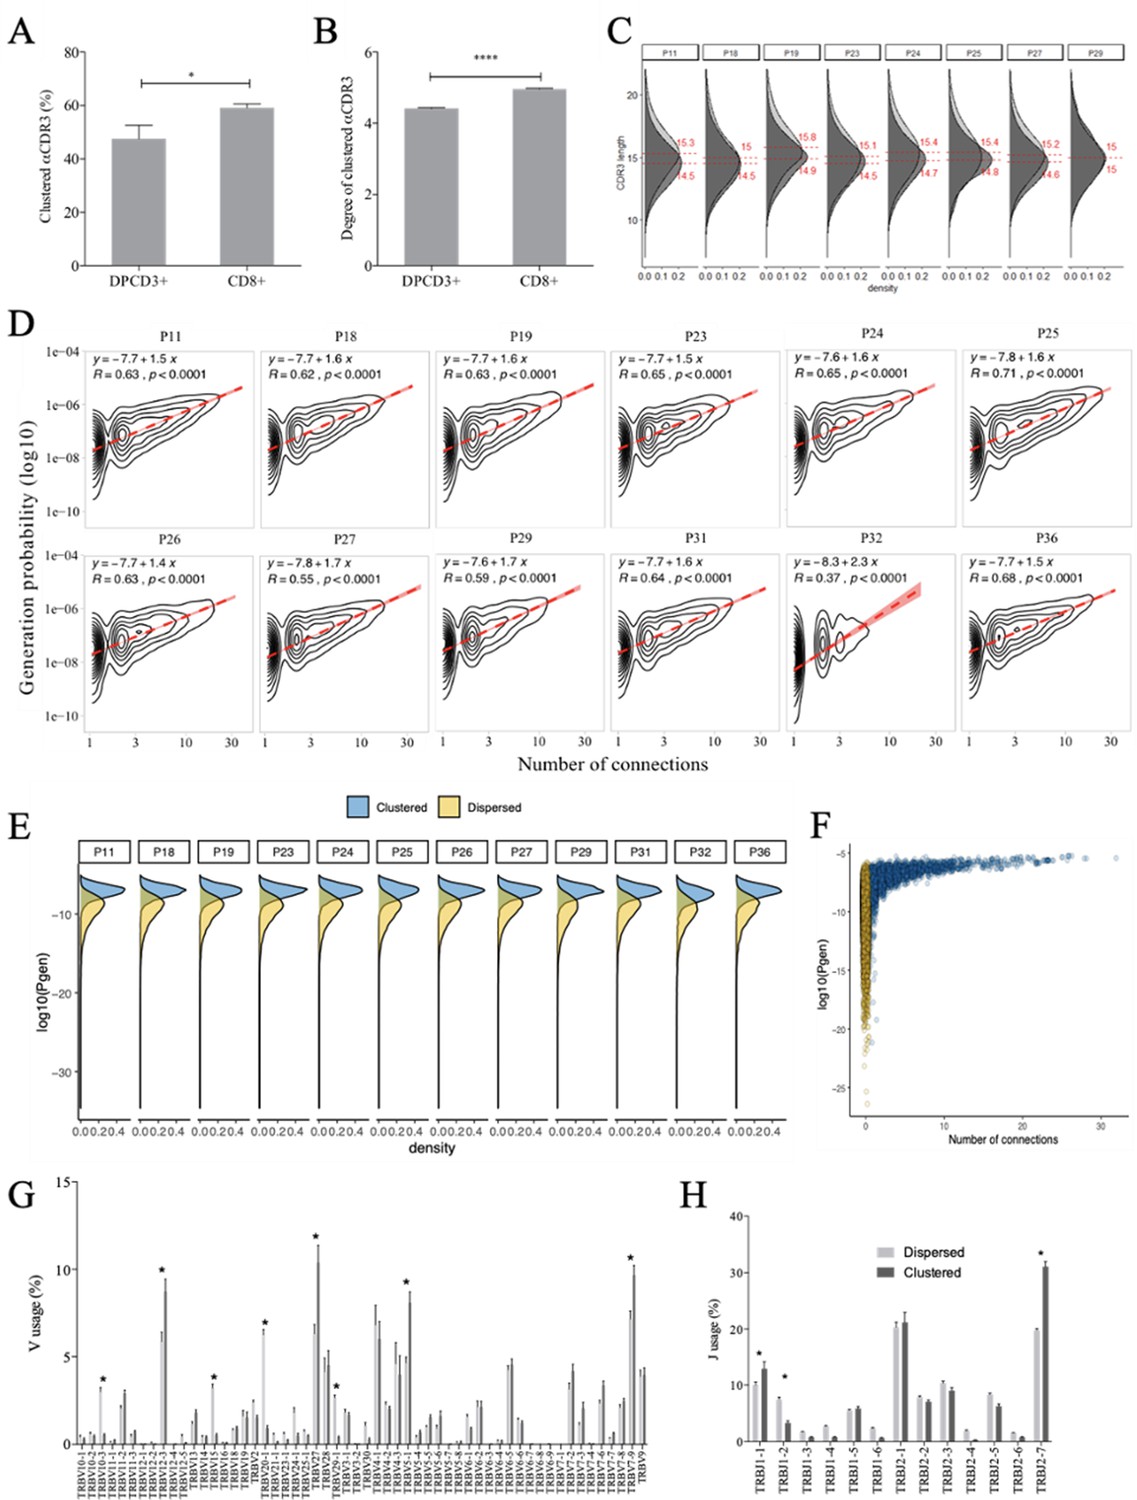
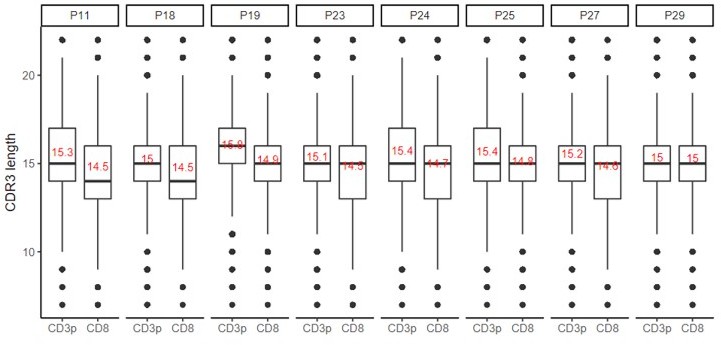
(A, B) Clustered αCDR3s from DPCD3+ and CD8+ thymocytes. Analyses were performed on the first 18,000 most frequent αCDR3s per sample (n=6 for DPCD3+ and n=10 for CD8+ thymocytes). (A) Percentage of clustered αCDR3s ( *p=0.016, Mann–Whitney test, mean ± s.e.m, n=13). (B) Degree of clustered αCDR3s (****p<0.0001, Mann–Whitney test, mean ± s.e.m, n=13). (C) The CDR3 length distribution was compared between DPCD3+ and CD8+ thymocytes for each donor. Dashed lines and values show the mean of the respective distributions. (D) Correlation between Pgen and βCDR3 number of connections in the CD8+ thymocyte repertoire. The contour plots represent the generation probability as a function of βCDR3 connections in the CD8+ thymocytes for donors P11 to P36. Linear regression curves between Pgen and number of connections are represented as red dashed lines (‘y’ represents the regression curve’s equation). The Pearson correlation coefficient ‘R’ and p value ‘p’ are calculated for each individual. (E) Density plot showing the distribution of Pgens in clustered (blue) and dispersed (yellow) CDR3s within the CD8+ population of each donor. (F) Distribution of the Pgens as a function of the number of connections of the CDR3s in the CD8+ population of donor P18. Dispersed CDR3s with zero connections are colored in yellow and clustered ones in blue. Pgens are represented in a logarithmic scale. (G, H) Clonogram representation of TCR Vβ (G) and Jβ (H) usage in clustered versus dispersed CD8+ thymocytes. The bar plots represent the mean percentage of TCR Vβ (left) and Jβ (right) in dispersed (light gray) versus clustered (dark gray). (*p<0.01, multiple t test, mean ± s.e.m).
Figure 2 with 1 supplement
Thymocyte differentiation produces clustered CDR3s with high publicness.
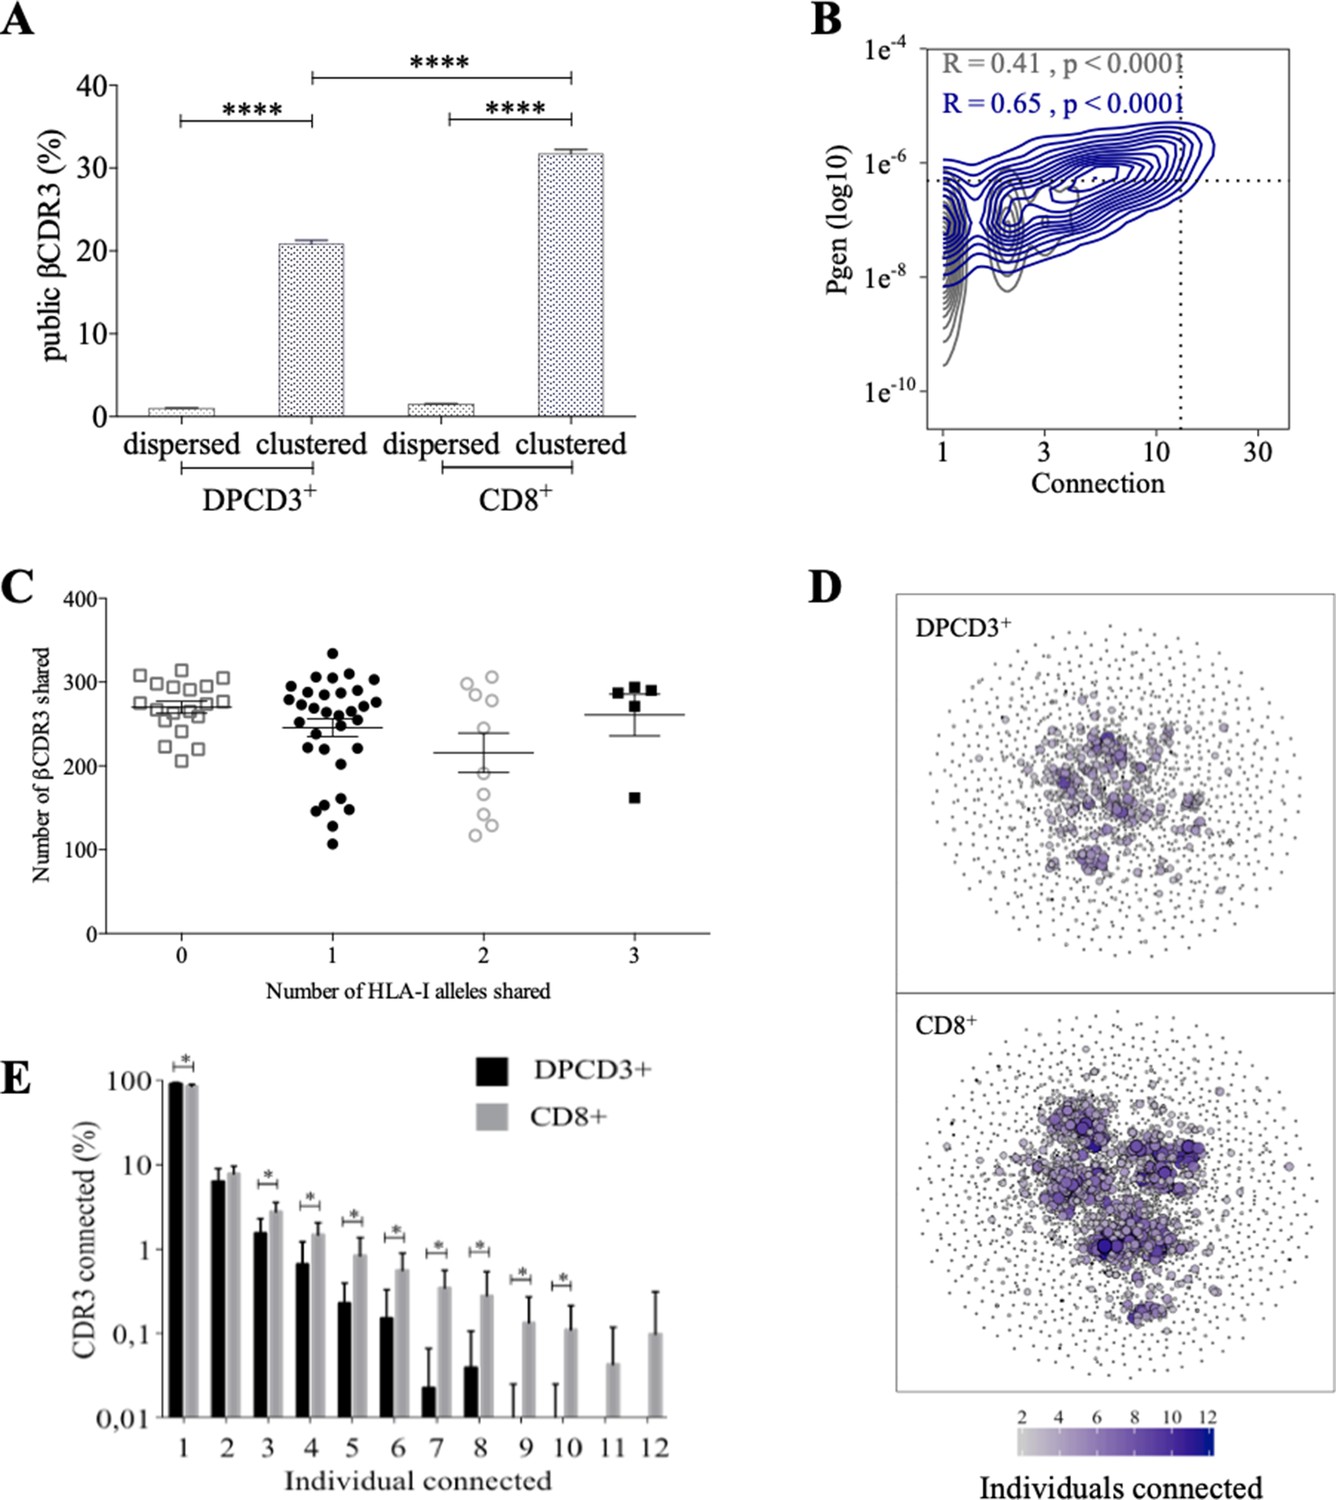
Mean percentages of public (black) or private (gray) βCDR3s in all, dispersed or clustered nodes (****p<0.0001, Mann–Whitney test, mean ± s.e.m, n=13). (B) Enrichment of public βCDR3s in the CD8+ thymocyte repertoires. Representation of the generation probability as a function of βCDR3 connections in individuals (Pn). The contour plots represent shared (blue) or private (gray) βCDR3s for a representative patient. The Pearson correlation coefficient ‘R’ and p value ‘p’ are calculated for each group. The black dotted lines delimit the threshold for the 2.5% sequences with the higher Pgen and connection. βCDR3s with both the highest Pgen and connections are also the most public for 12 out of 12 individuals (p<0.0001, Chi-square test, Figure 2—source data 1, Figure 2—figure supplement 1B). (C) The number of public βCDR3s in CD8+ thymocytes is independent of the number of HLA-I alleles shared. Each dot represents the number of βCDR3s shared between two donors in the first 18,000 CD8+ thymocytes. There is no significant difference in the number of public βCDR3s according to the number of HLA-I alleles shared (p>0.1, Mann–Whitney test, mean ± s.e.m, n=13). The number of public βCDR3s is independent of the number of HLA alleles shared. (D) Public convergence of βCDR3 recognition properties during thymopoiesis. CDR3 connections between individuals. The top 1500 βCDR3s were sampled from DPCD3+ (upper square) and CD8+ (lower square) cells from each individual and pooled. The CDR3s are clustered based on LD≤1 with colour and size both representing the level of sharing between individuals for each CDR3. (E) Convergence of public βCDR3 specificities during thymopoiesis. Bar plots representing the percentage of CDR3s from an individual that are connected to CDR3s of other individuals, for DPCD3+ and CD8+ thymocytes. The first two bars represent CDR3s that are not connected (n=1). The number of unconnected nodes in DPCD3+ is higher than in CD8+ (*p=0.002). The other bars represent the percentage of CDR3s connected between individuals. The number of nodes connected to 3–10 individuals is significantly higher in CD8+ than in DPCD3+ cells (*p<0.01, multiple t test).
-
Figure 2—source data 1
Enrichment of public βCDR3s in CD8+ thymocytes versus DPCD3+.
- https://cdn.elifesciences.org/articles/81274/elife-81274-fig2-data1-v1.docx
Figure 2—figure supplement 1
Publicness of thymocytes’ CDR3s.
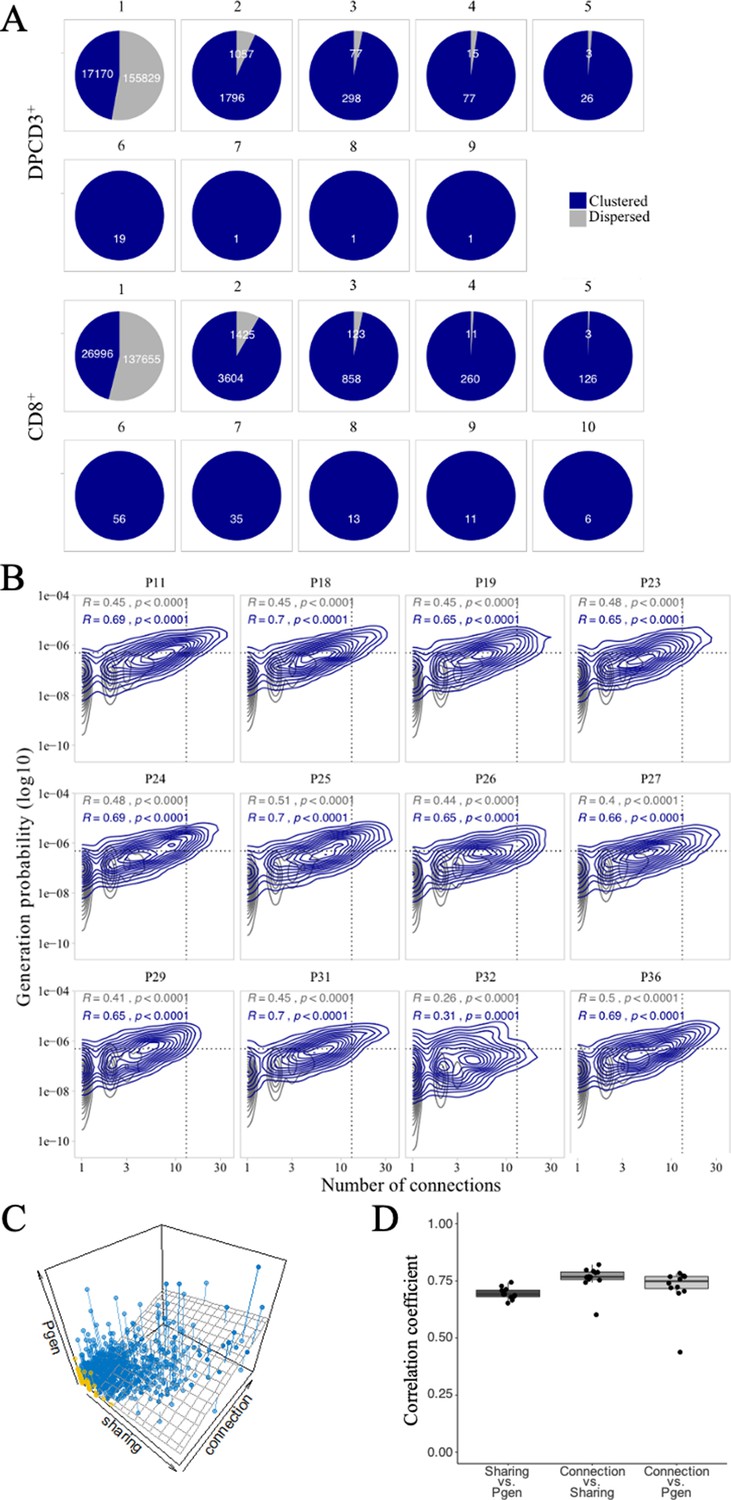
(A) βCDR3 sharing between individuals. Pie charts represent the sharing between individuals before (DPCD3+) and after thymic selection (CD8+). Colours represent the dispersed (gray) or clustered (blue) CDR3s. Sharing was analyzed within the 10 donors for which there were at least 18,000 βCDR3s in DPCD3+ and in CD8+ thymocytes. (B) Enrichment of public βCDR3s in the CD8+ thymocyte repertoires. Representation of the generation probability as a function of βCDR3 connections in individuals (Pn). The contour plots represent shared (blue) or private (gray) βCDR3s. The Pearson correlation coefficient ‘R’ and p value ‘p’ are calculated for each group. The black dotted lines delimit the threshold for the 2.5% sequences with the higher Pgen and connection. βCDR3s with both the highest Pgen and connections are also the most public for 12 out of 12 individuals (p<0.0001, two-tailed Fisher test). (C) The Pgen, connectivity and cross-individual sharing were projected in a 3D plot for each sequence in the CD8+ population of donor P18. A linear regression model (represented in dark gray) was fit to the data. Dispersed and clustered CDR3s are represented in yellow and blue, respectively. (D) Pairwise correlation coefficients between the three parameters. Each point represents an individual and the computed correlation coefficient is represented on the y-axis.
Figure 3 with 3 supplements
Clustered public TCRs are enriched for virus-specific TCRs.
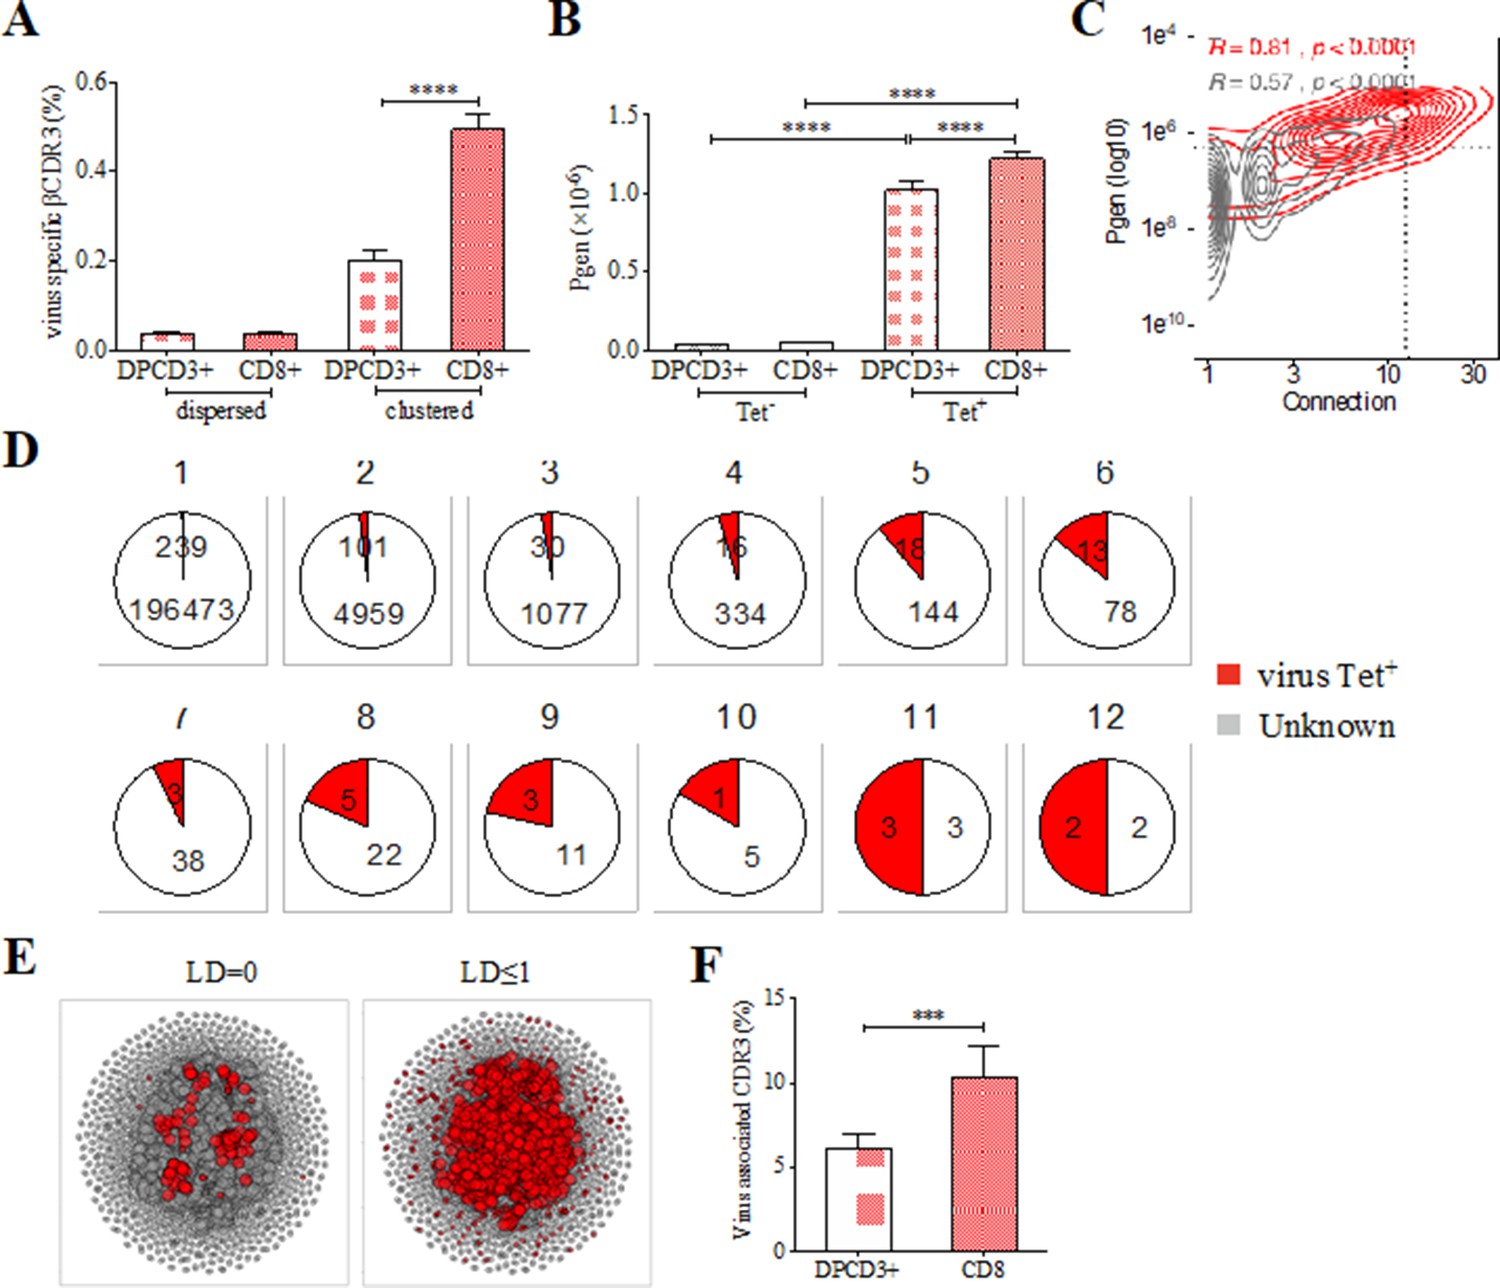
(A) Barplots showing the mean percentages of CDR3s associated with pathogens within DPCD3+ and ThyCD8 cells and for dispersed or clustered CDR3s. (B) Mean generation probability of virus-specific βCDR3s, based on their identification by tetramer, in DPCD3+ or CD8+ thymocytes (A,B, ****p<0.0001, Mann–Whitney test, mean ± s.e.m, n=13). (C) Enrichment of virus-specific βCDR3s in the CD8+ thymocyte repertoire. Representation of the generation probability as a function of βCDR3 connections in a representative individual. The contour plot represents βCDR3s from TCRs identified as virus-specific based on tetramer identification Roth et al., 2005, Watkin et al., 2017 (red) or with unknown specificity (gray). Pearson correlation coefficient ‘R’ and p value ‘p’ are calculated for each group. The black dashed lines delimit the threshold for the 2.5% sequences with both higher Pgen and degree of connection. βCDR3s with both the highest Pgen and connections were also the most virus-specific for 11 out of 12 individuals, Figure 3—figure supplement 1A (p value<0.0001, Chi-square test). (D) Virus-specific βCDR3s sharing in CD8+ thymocytes. Pie charts represent the βCDR3s from private (Dupic et al., 2018) to shared βCDR3s by all donors (Roth et al., 2005), in gray for βCDR3s with unknown specificity or in red for those with a virus specificity. (E) Network of virus-associated CDR3s. The shared (identical) and linked (LD≤1) virus-associated CDR3s within the CDR3 network of one individual are in red. (F) Virus antigen coverage. Barplot represents the mean percentage of LD≤1 to virus-associated CDR3s in all individuals (***p<0.001, Mann–Whitney test, mean ± s.e.m, n=13). TCR, T-cell receptor.
-
Figure 3—source data 1
Enrichment of virus-specific βCDR3s from databases in clustered CD8+ thymocytes.
- https://cdn.elifesciences.org/articles/81274/elife-81274-fig3-data1-v1.docx
Figure 3—figure supplement 1
Virus specificities of thymocytes’ CDR3s.
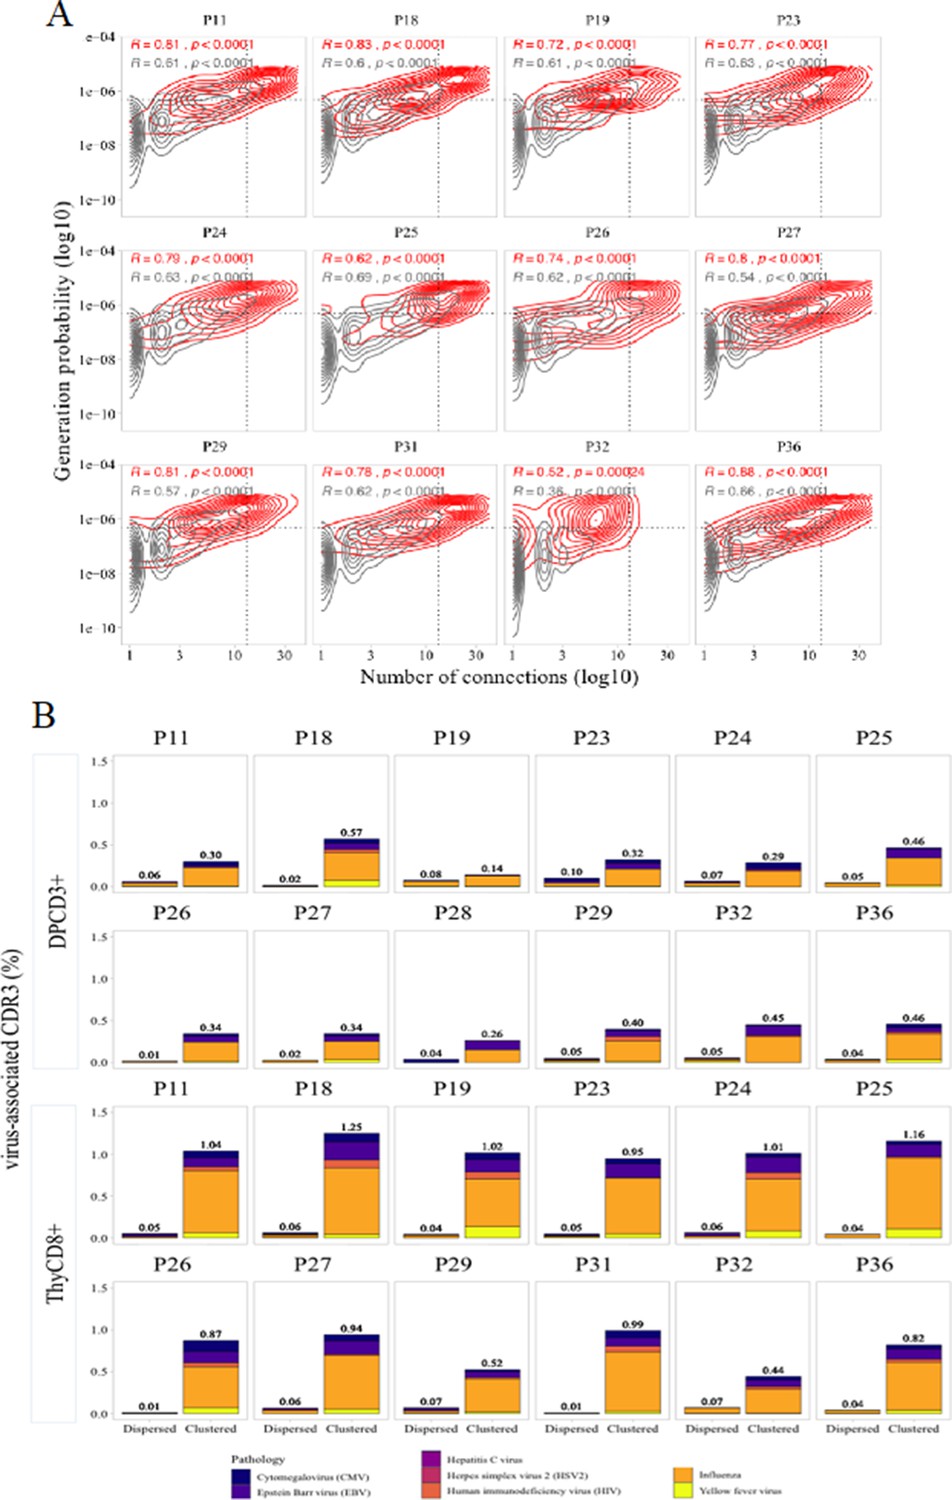
(A) Enrichment of virus-specific βCDR3s in the CD8+ thymocyte repertoire. Representation of the generation probability as a function of βCDR3 connections in individuals (Pn). The contour plots represent βCDR3s from TCRs identified as virus-specific based on tetramer identification Welsh and Selin, 2002, Verhoeven et al., 2008 (red) or with unknown specificity (gray). The Pearson correlation coefficient ‘R’ and p value ‘p’ are calculated for each group. The black dotted lines delimit the threshold for the 2.5% sequences with both higher Pgen and degree of connection. βCDR3s with both the highest Pgen and connections were also the most virus-specific for 11 out of 12 individuals (p value<0.0001, two-tailed Chi-square test). (B) Virus-specific CDR3s among DPCD3+ and ThyCD8 cells. Barplots represent the percentage of CDR3s from TCR identified as virus-specific based on tetramer binding (Tickotsky et al., 2017; Zhang et al., 2021). For each panel, calculation is done on dispersed (left boxplot) or clustered (right boxplot) CDR3s. Colours correspond to different viral specificities.
Figure 3—figure supplement 2
Sharing of virus specific thymocytes’ CDR3s.
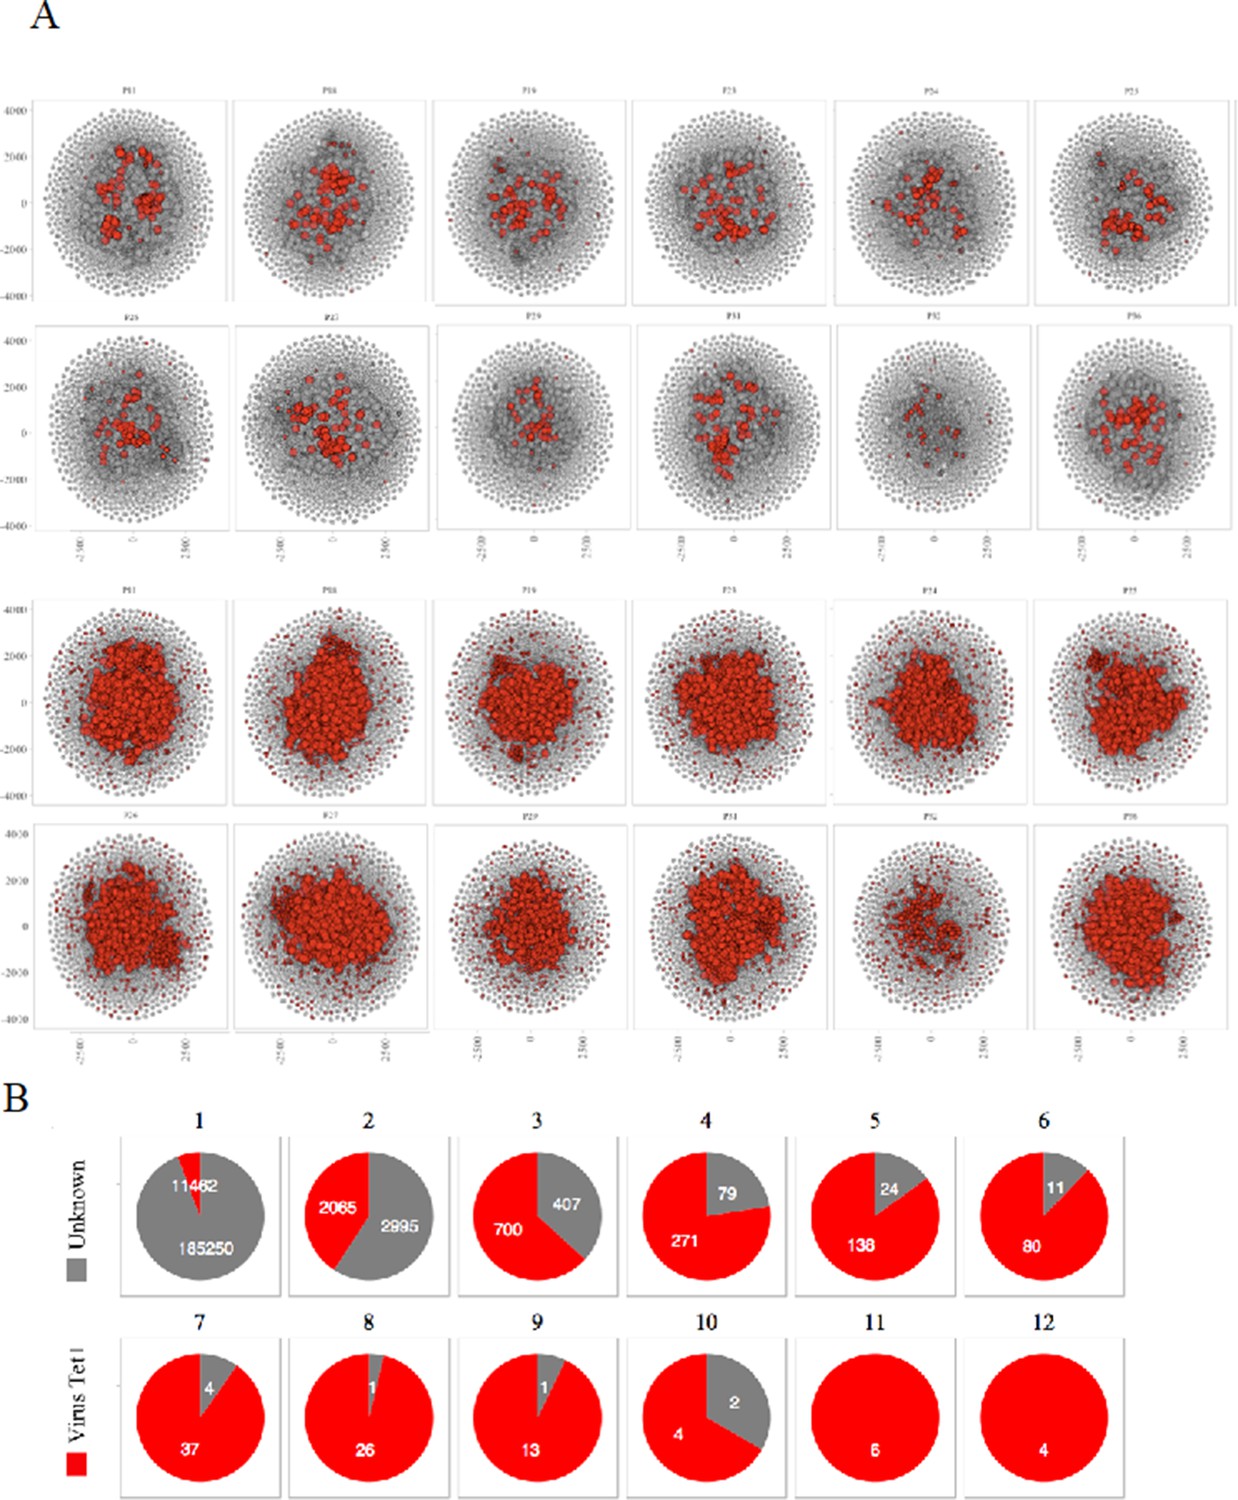
(A) Network of clustered nodes from the first top ranking 18,000 CDR3s. For each individual, we plot CDR3s as viral-associated (red) either if they are in the public database (lines 1 and 2) or if they have an LD≤1 with a CDR3 of the public database (lines 3 and 4). (B) Sharing of virus-associated CDR3s. The virus-associated CDR3s are highly shared between individuals.
Figure 3—figure supplement 3
Binding properties of single-cell TCRs.
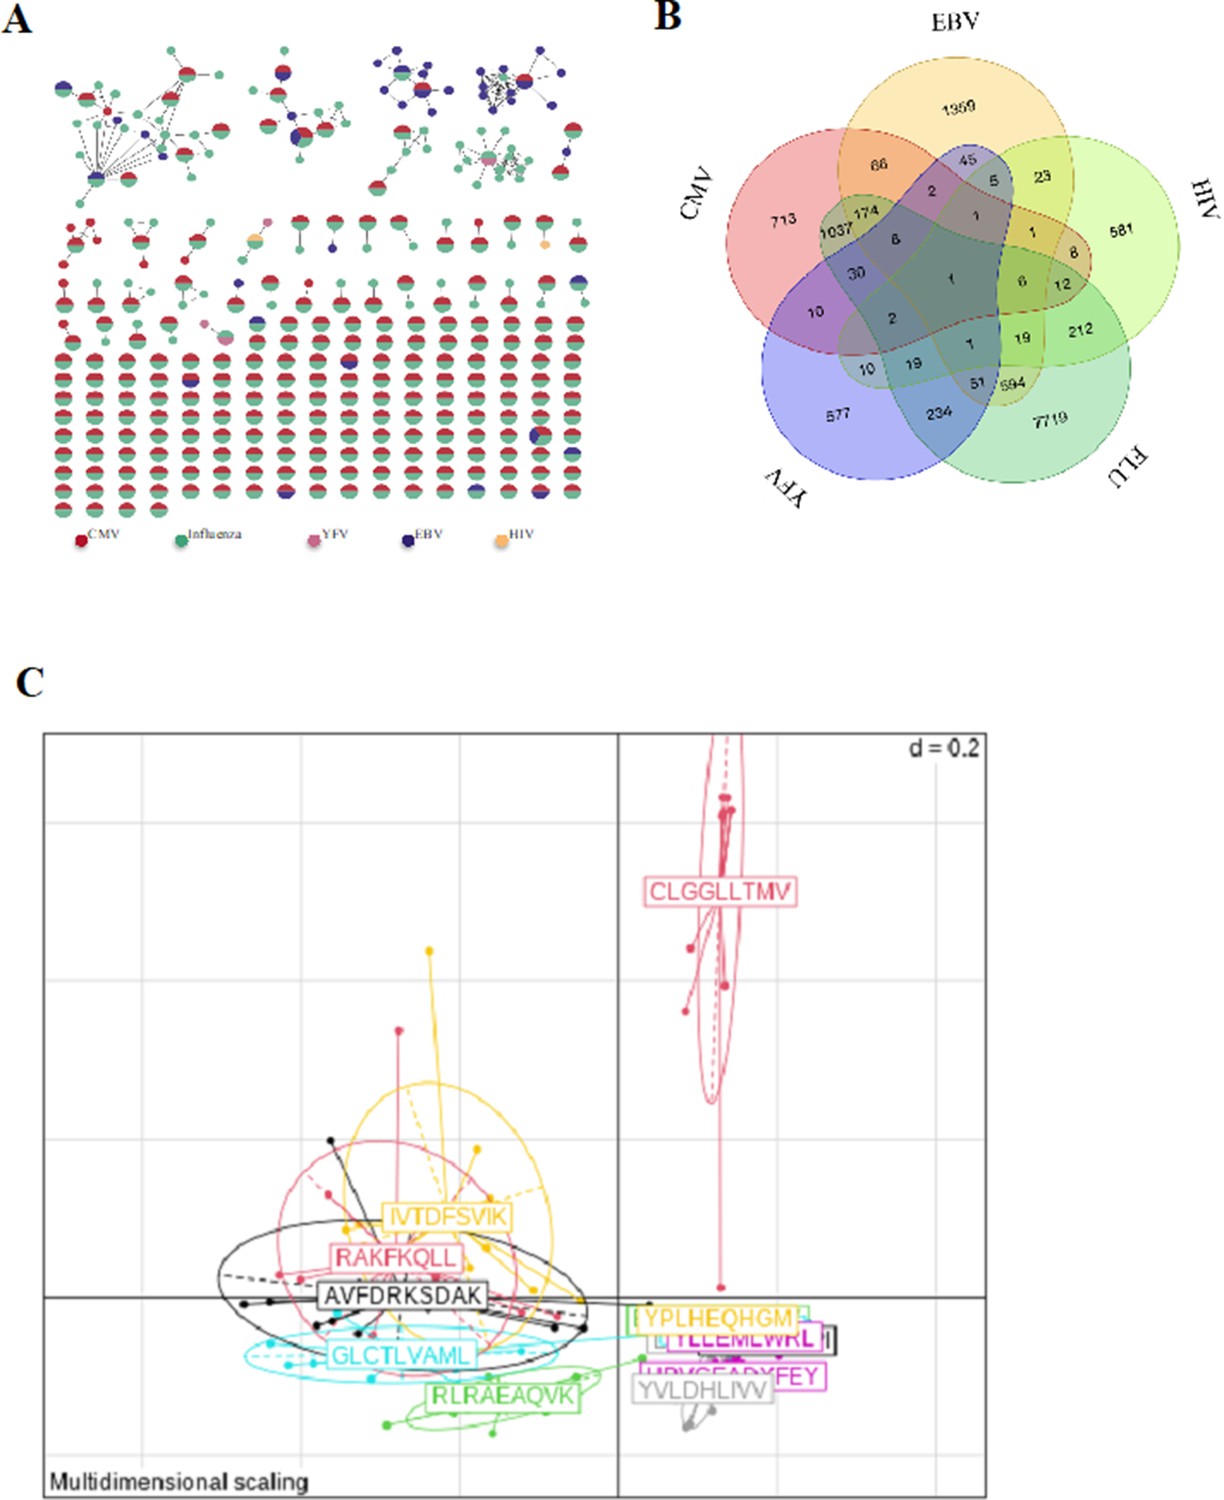
(A) Network of tetramer-binding CDR3s from public database (VDJdb) identifying CDR3s with multiple viral specificities. Each dot represents a single CDR3. Dots are connected by an edge defined by a Levenshtein distance of ≤1 (one AA substitution/insertion/deletion). Each dot represents a CDR3 with at least two specificities for two different viruses. The colors are related to a specific virus. The specificities of these CDR3 were identified by tetramer staining. (B) Venn diagram representing specificities for five different viruses of the 13,557 unique virus-associated CDR3s (those from Figure 3e, LD≤1). AA, amino acid; TCR, T-cell receptor.
Figure 4 with 2 supplements
Identification of polyspecific TCRs.
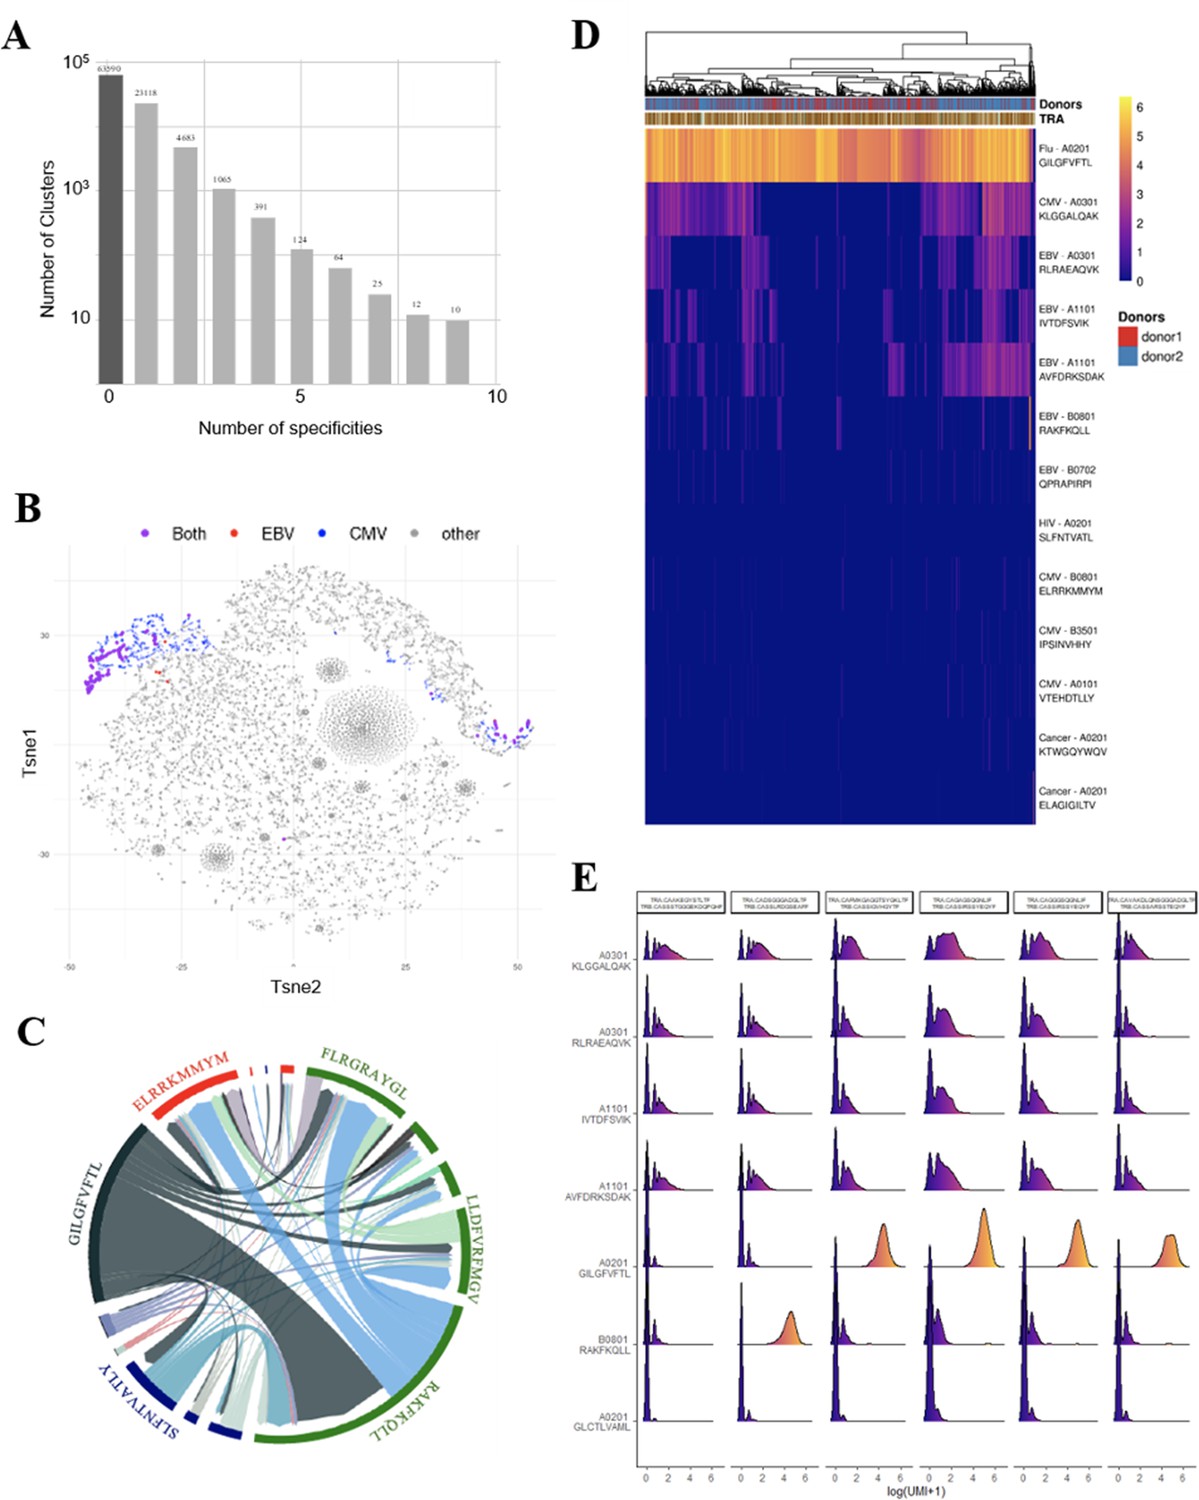
(A) Analysis of shared T-cell specificities with the GLIPH2 algorithm. 216,000 CDR3β sequences from the CD8 thymocytes and 32,496 sequences from VDJdb that are tetramer specific were analysed to obtain 93,182 specificity groups. 31.6% of the groups contained at least one CDR3 with a known specificity for a virus. 6.8% of the clusters identified by GLIPH2 contained CDR3s with more than one specificity, and up to nine different ones. (B) t-SNE plots of βCDR3 sequences from peripheral CD8 T cells based on sequence similarity. On this overall repertoire representation, we labeled cells that were annotated as EBV specific (red), CMV specific (blue), and ones that bound to both EBV and CMV dextramers (purple). (C) Chord diagram showing TCR binding to multiple Dextramers. The chord diagram shows TCR binding to HLA-matched dextramers loaded with peptides from unrelated viruses. Each segment represents TCR binding to the peptides marked above. The size of the segments corresponds to the number of TCRs binding to these peptides. The link between segments identifies multiple TCR binding to different peptides. The colours of the segments represent the different viruses: CMV (red), EBV (green), HIV (dark blue), HPV (light green), HTLV (purple), and influenza (dark gray). The full list of the different peptides is in Figure 4—source data 1. (D) Heatmap of the binding score (in a logarithmic scale) for different dextramers of different TCRs using the same CASSIRSSYEQYF βCDR3, in two donors. The polyspecificity is oriented toward the recognition of common viruses such as influenza, EBV, and CMV. Density distributions of the binding score (in a logarithmic scale) for different dextramers of the top clonotypes in donor 2. TCR, T-cell receptor.
-
Figure 4—source data 1
List of peptides represented on the chord plot from Figure 4C.
- https://cdn.elifesciences.org/articles/81274/elife-81274-fig4-data1-v1.docx
Figure 4—figure supplement 1
Binding patterns to A*03 and A*11 dextramers.
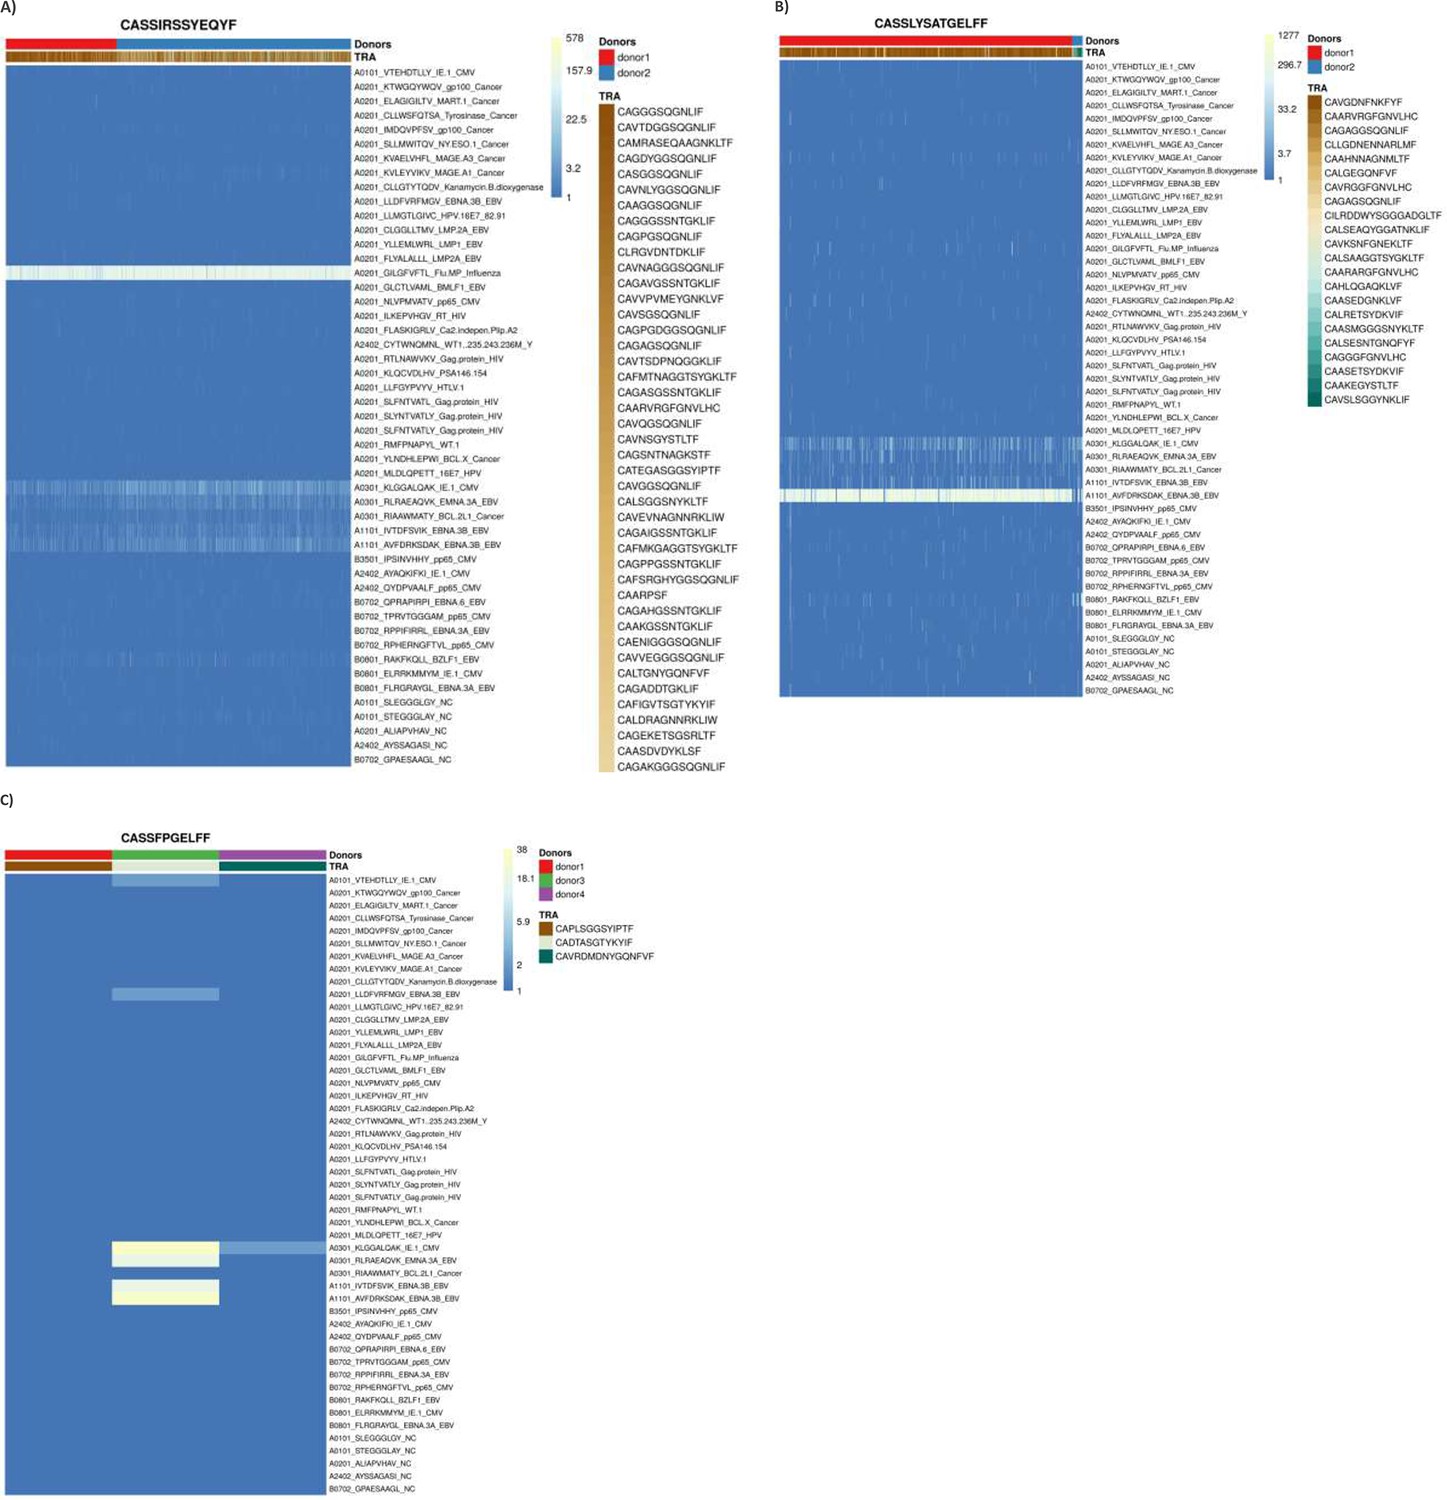
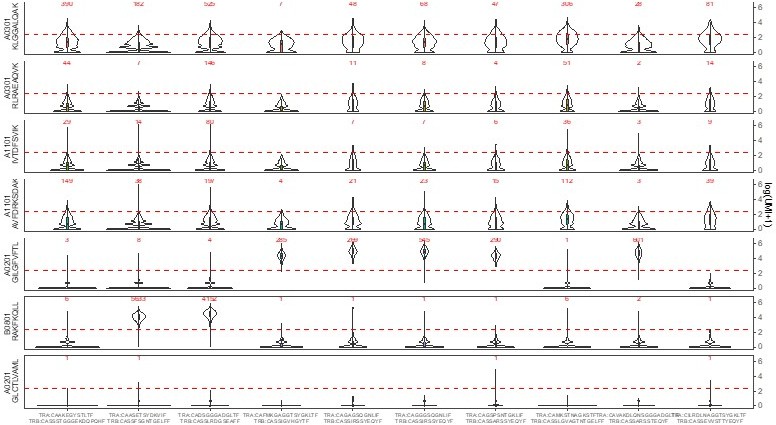
(A) Heatmap of the binding score for different dextramers of different TCRs using the same CASSIRSSYEQYF βCDR3, in two donors. The recognition properties are remarkably similar whatever the βCDR3. The polyspecificity is oriented toward the recognition of common viruses such as influenza, EBV, and CMV. (B) We identified another βCDR3 from donor 1 that is associated with a strong binding to one A1101 dextramer presenting an EBV peptide, when associated to many different αCDR3. The binding to the other A03 and A011 dextramers is weaker and seems to depend more on the αCDR3. The same βCDR3was also found in a second donor, associated with different αCDR3s. In this donor, the binding appeared αCDR3 dependent, even for the stronger binding to the A1101 dextramer presenting an EBV peptide. Altogether, these identify different binding patterns than in (A). (C) We identified a βCDR3 from donor 3 that binds preferentially to A*03 and A*11 dextramers. However, it binds to only four out of five of these. Moreover, we identified this same βCDR3 in two other cells from donors 1 and 4, but that was associated with different αCDR3s. Except for only one weak binding, these TCRs do not show binding to the A*03 and A*11 dextramers, identifying a different binding pattern than in (A). Altogether, (A), (B), and (C) reveal that the binding patterns of the A*03 and A*11 dextramers are TCR dependent and cannot be due to their interaction with other molecules that interact with MHCs sur as KIRs. MHC, major histocompatibility complex; TCR, T-cell receptor.
Figure 4—figure supplement 2
Single-cell gene expression analysis.
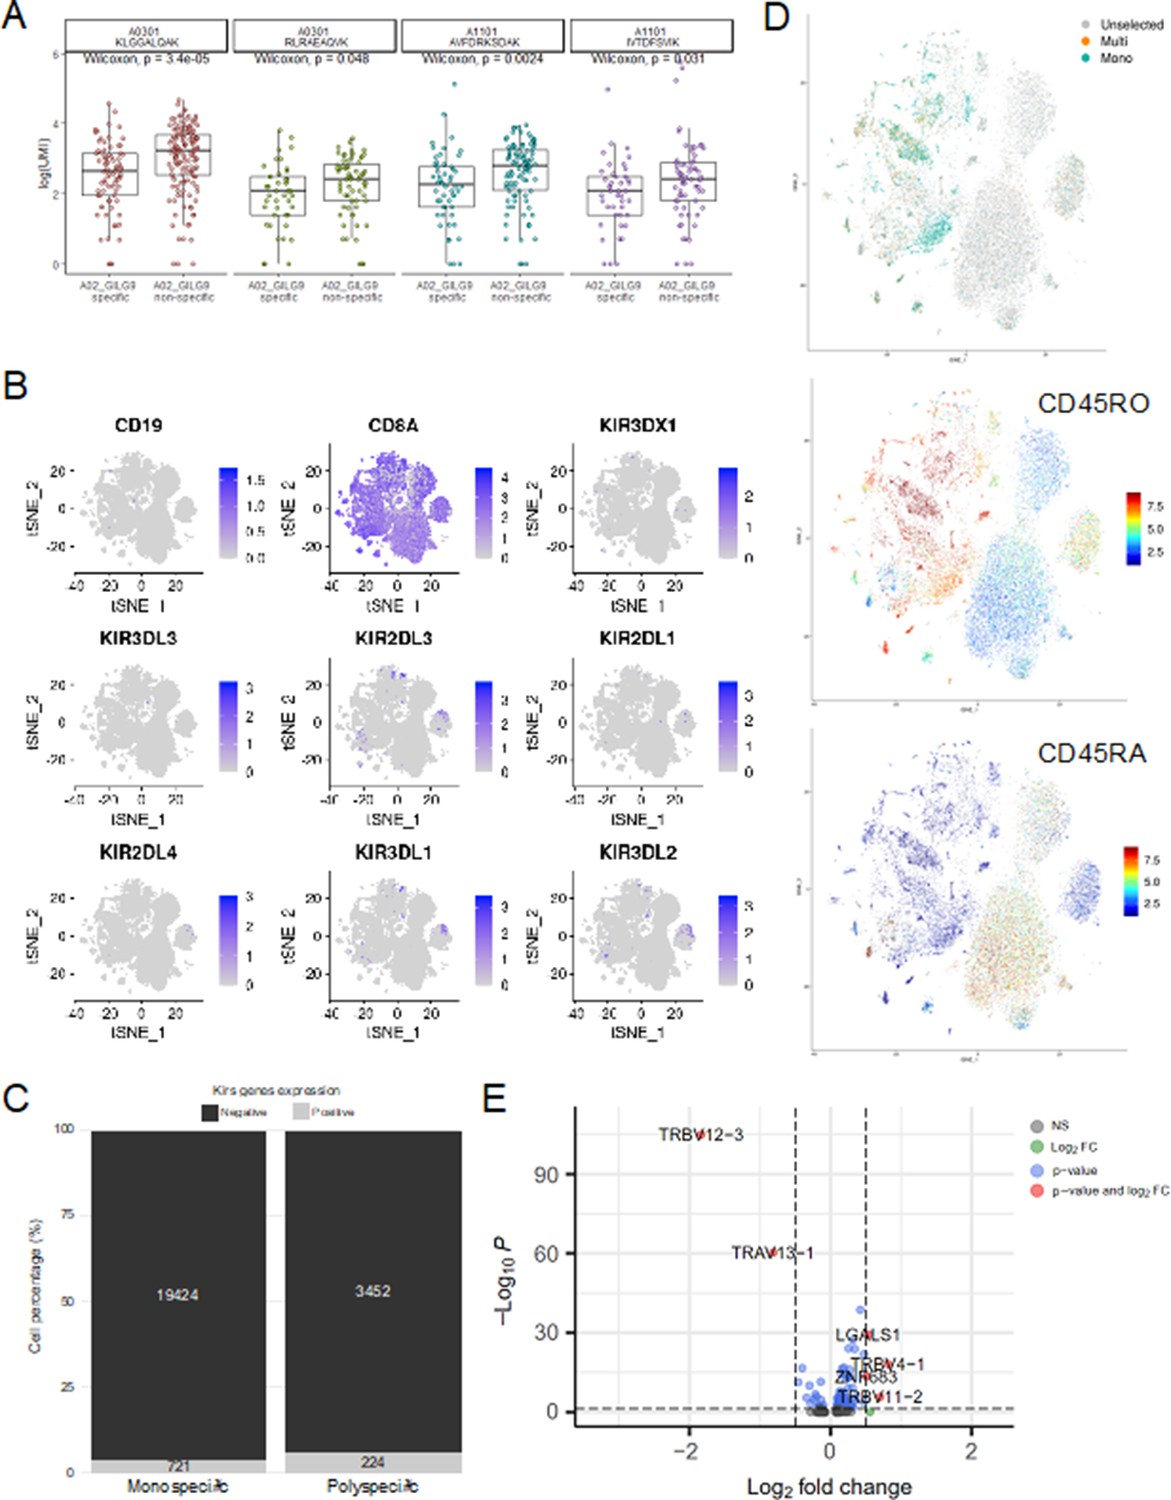
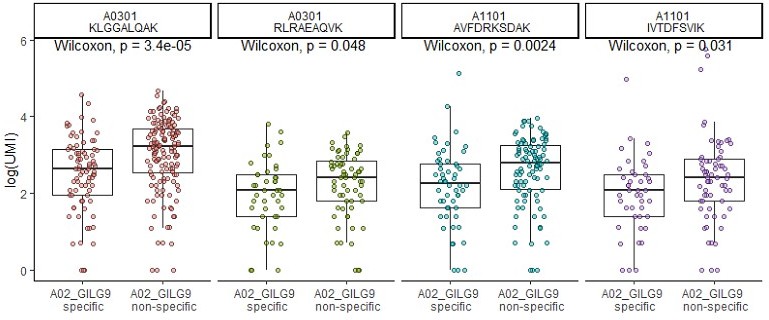
(A) Six of the most expanded clonotypes were selected from the single-cell data set, of which three were specific to the Influenza_A0201 GILGFVFTL dextramer (A02_GILG9 specific), and the other three were not (A02_GILG9 nonspecific). Each point represents a cell expressing one of the selected clonotypes, for which the binding score is represented for four other dextramers. A nonparametric Wilcoxon test was performed (*p<0.05; **p<0.01; ***p<0.001; ****p<0.0001). (B) t-SNE plots of KIR gene expression. t-SNE plots represent the normalized expression of CD19 (negative control), CD8A (positive control), and seven KIR family genes in the single-cell data set. (C) Comparison of the KIR gene expression between polyspecific and monospecific cells. Cells were considered as ‘positive’ if at least one of the KIR genes had an expression>0, and ‘negative’ if no KIR genes were expressed (expression=0). The y-axis shows the percentage of monospecific and polyspecific cells, and values within the bars represent the number of cells in each group. (D) t-SNE plots of the single-cell gene expression showing cells labeled as multispecific (orange) or monospecific (green) (top panel), the expression of CD45RO (middle panel) and CD45RA (lower panel) within these cells. (E) Volcano plot of the differential gene expression analysis between polyspecific and monospecific cells. Volcano plot showing the fold-change (x-axis) versus the significance (y-axis) of the identified 464 genes. The significance (non-adjusted p value) and the fold-change are converted to −Log10(adjusted p value) and Log2(fold-change), respectively. The vertical and horizontal dotted lines show the cutoff of fold-change=±0.5, and of p value=0.05, respectively. Only six genes were differentially expressed by >0.5-fold with p value <0.05 between the two groups.
Figure 5 with 2 supplements
Polyreactivity of polyspecific TCRs.
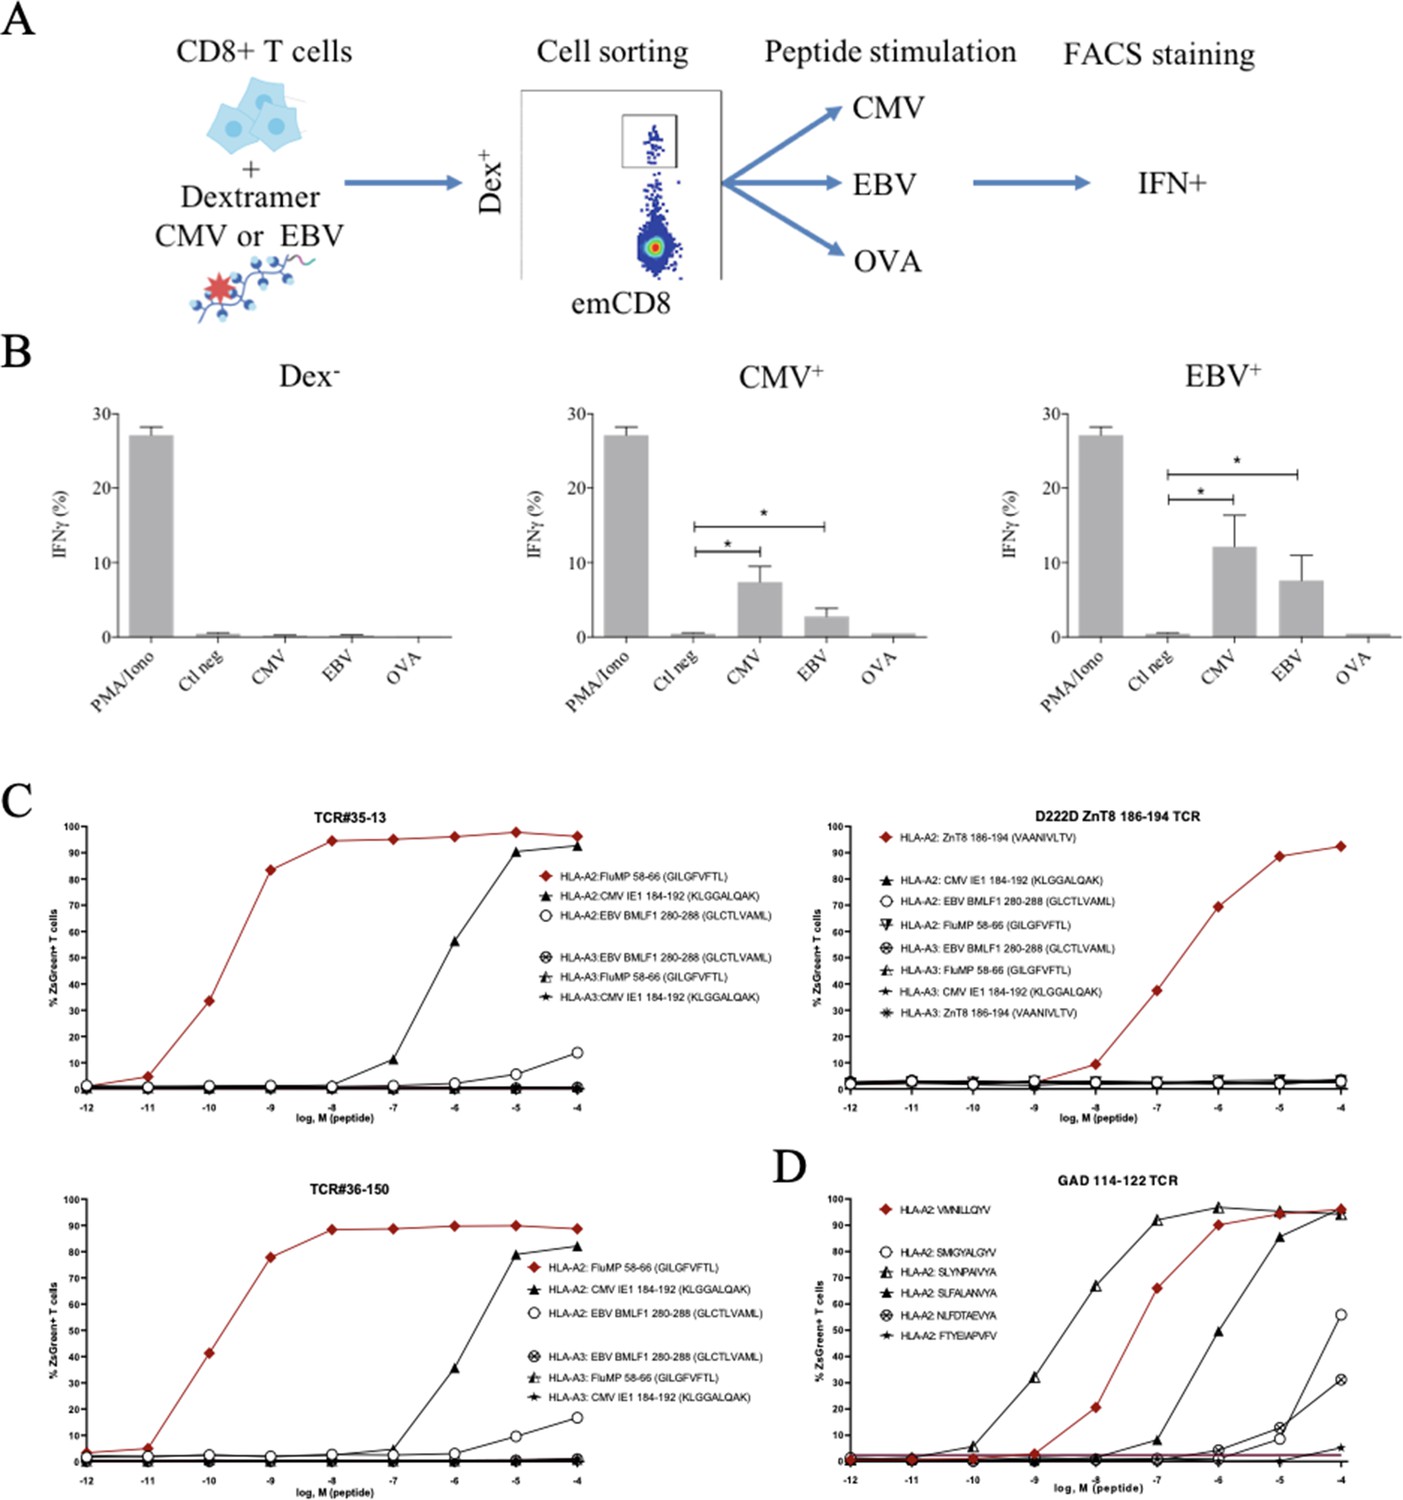
(A) Schematic representation of the in vitro cross-activation experiment. (B) In vitro activation of polyspecific T cells. Percentage of IFNγ producing emCD8+ cells after activation with PMA/ionomycin (positive control), no peptide (Ctl neg) or CMV, EBV, and OVA peptides (*p<0.05, Mann–Whitney test, mean ± s.e.m.). (C) Poly-reactivity of re-expressed viral epitope-reactive TCRs. 5KC cells transduced with TCR#35–13 (upper left), TCR#36–150 (bottom left) that responded to different peptides in the single-cell screening, and D222D-ZnT8186–194 (upper right) that responded to its cognate peptide ZnT8186–194 were stimulated with the indicated nonamer peptides at different concentrations, pulsed on K562 cells expressing either HLA-A*02:01 or HLA-A*03:01. The percent cells expressing the NFAT-driven ZsGreen reporter is shown as activation readout. A representative experiment out of two performed is shown.(D) TCRs from single-sorted CD8+ T cells stained with tetramers loaded with pancreatic self-peptides were cloned in reporter cell lines. We analyzed their response to various peptides: cognate peptide in red and peptides with no significant structural commonalities (gray). TCR, T-cell receptor.
-
Figure 5—source data 1
List of the sequences of individual TCRs expressed and analyzed in vitro in Figure 5.
- https://cdn.elifesciences.org/articles/81274/elife-81274-fig5-data1-v1.docx
Figure 5—figure supplement 1
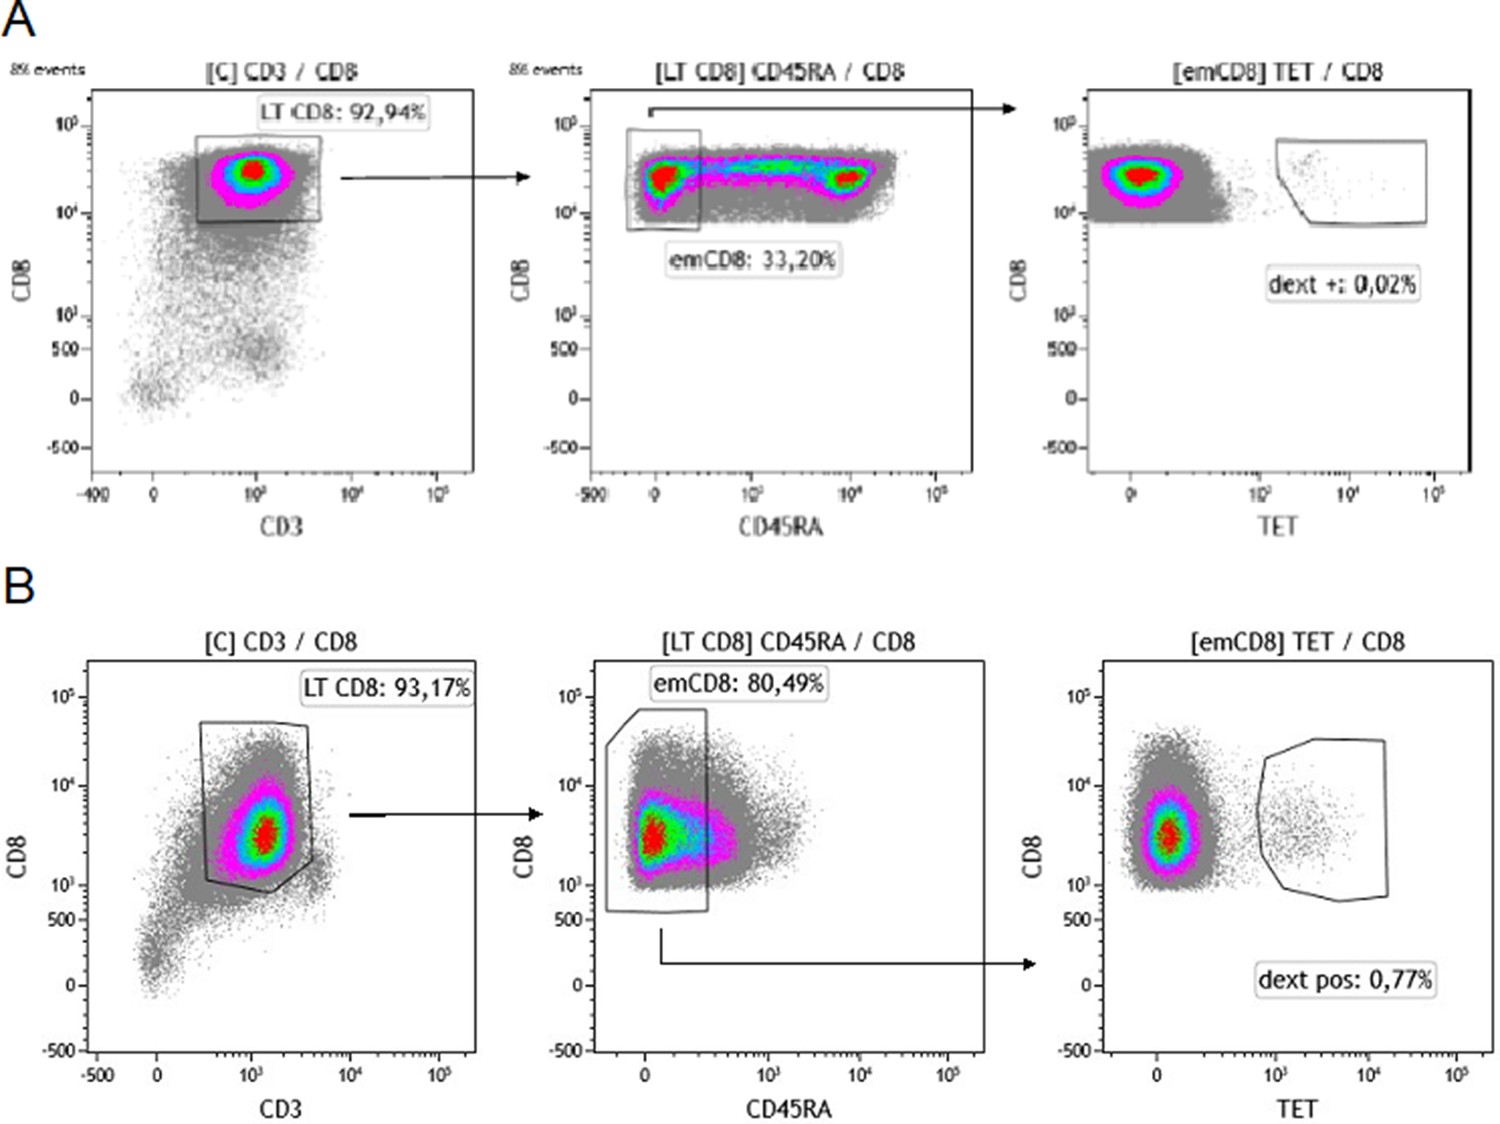
Gating strategy for sorting effector memory (emCD8) Dextramer positive cells.
(A, B) CD8 were previously enriched from cytapheresis PBMC. Gating strategy of the sorting of Cytomegalovirus (A) or Epstein-Barr virus (B) dextramère positive effector memory CD8 (emCD8) from CD8 enriched fraction of PBMC’s donor after excluding doublets. emCD8 cells are CD3+ CD8+ CD45RA− cells. PBMC, peripheral blood mononuclear cell.
Figure 5—figure supplement 2
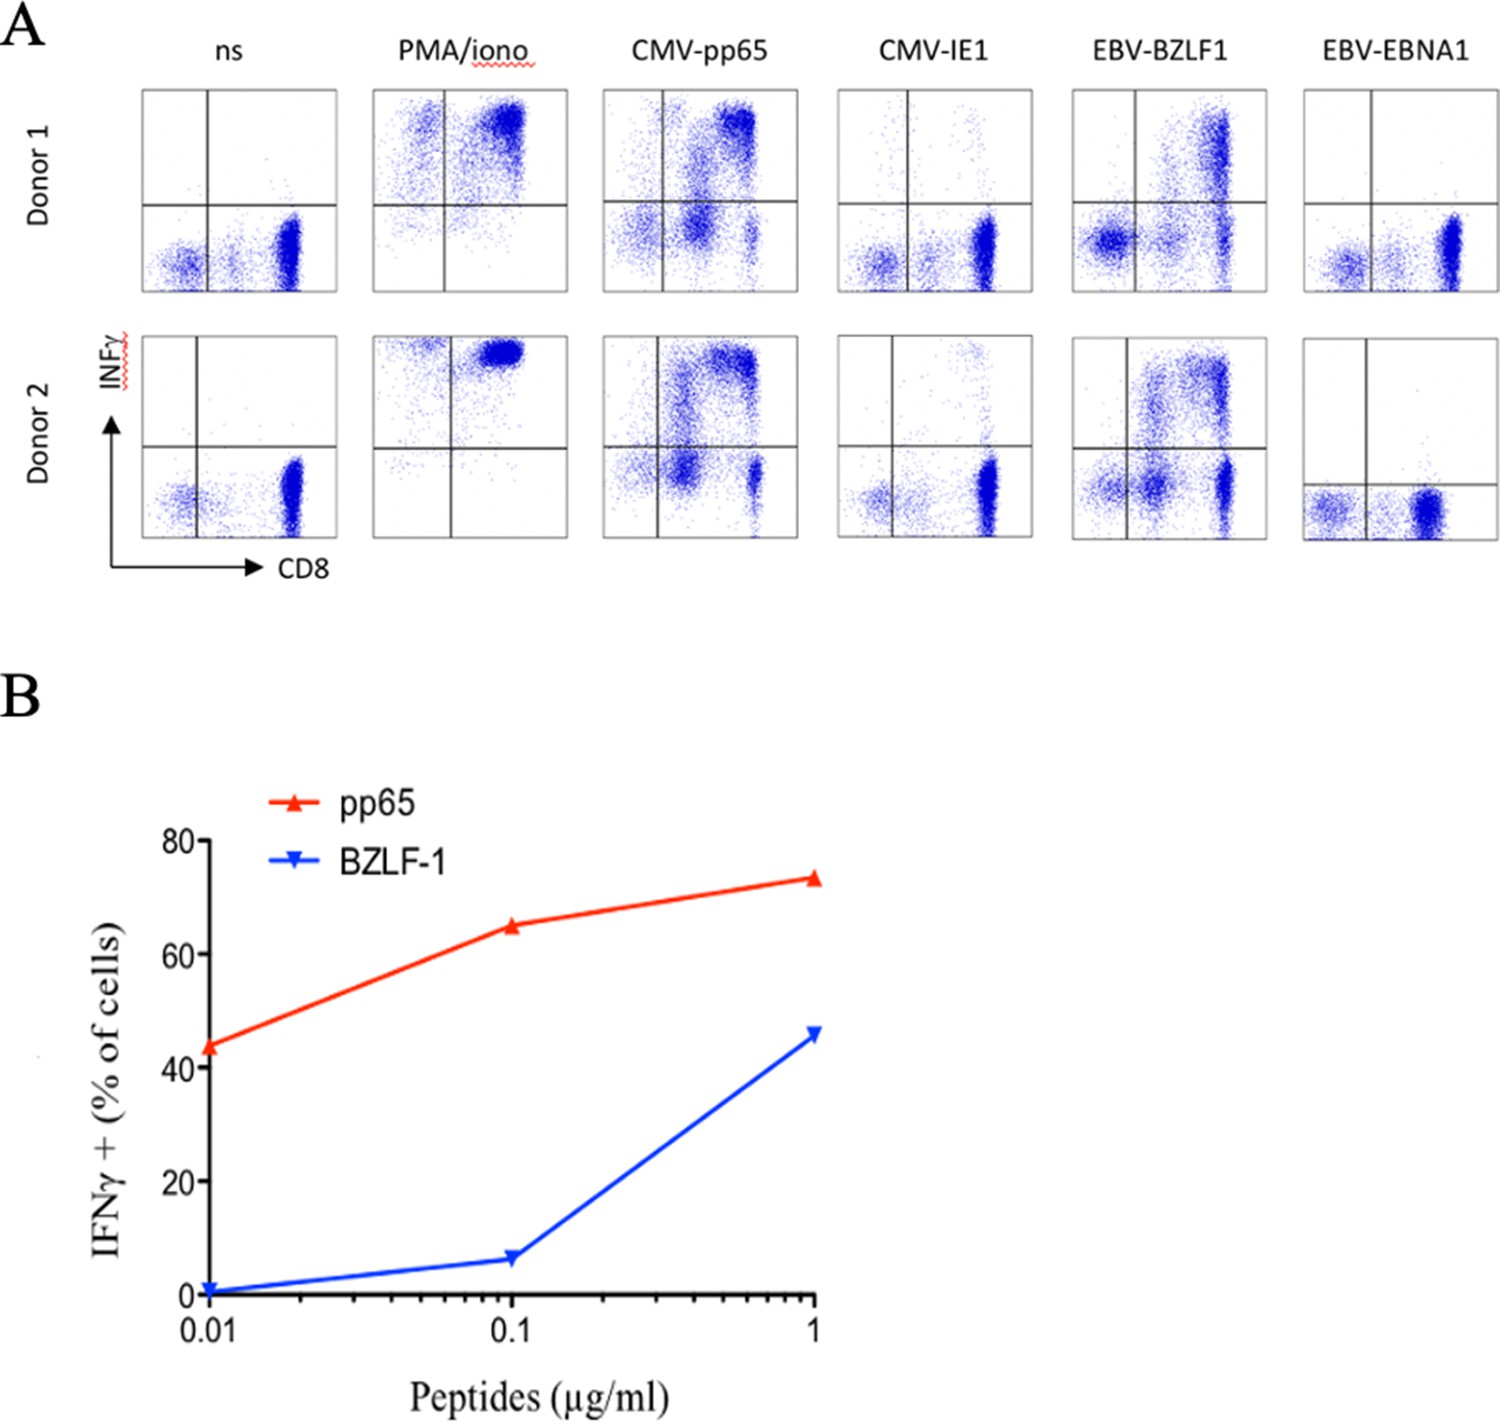
Polyspecific properties of anti-CMV cytotoxic cells.
(A) PBMC were stimulated in vitro using Peptivator CMV pp65 (that consists mainly of 15-mer peptides with 11-amino acid overlap, covering the complete sequence of the pp65 protein) and cultured for 25 days. Selected CTL were then restimulated in the presence of either Peptivator CMV pp65, Peptivator CMV IE-1, EBV-BZLF1, or Peptivator EBV EBNA-1. (B) Concentration-dependent activation of polyspecific cells. We represent the percentage of cells secreting IFNγ as a function of peptides concentration. Activation with pp65 CMV peptide (red) and BZLF-1 EBV peptide (blue) results in INF production and depends of the peptides’ concentration. Similar observations were made with cells from five different donors. PBMC, peripheral blood mononuclear cell.
Author response image 1
Author response image 2
Author response image 3
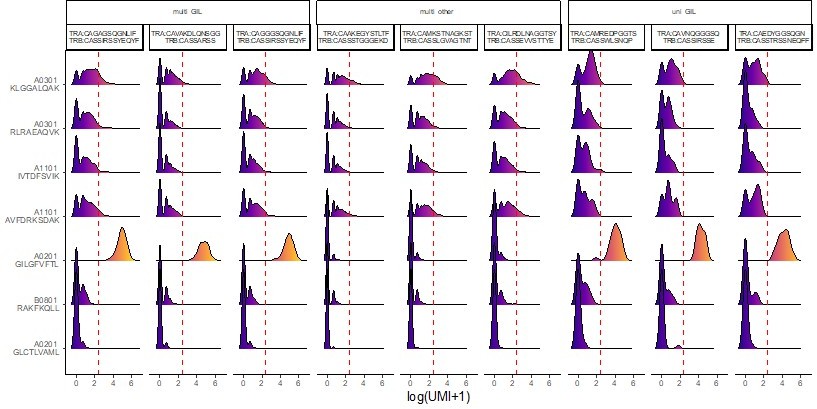
multi-GIL are multi-specific clonotypes with the highest specificity being towards the A02-GIL dextramer.
Multi-other refers to multi-specific clonotypes without any differentially high binding to any of the dextramers. Finally, uni-GIL are uni-specific clonotypes that exclusively bind the A02-GIL dextramer.
Author response image 4
Additional files
Download links
A two-part list of links to download the article, or parts of the article, in various formats.
Downloads (link to download the article as PDF)
Open citations (links to open the citations from this article in various online reference manager services)
Cite this article (links to download the citations from this article in formats compatible with various reference manager tools)
Human thymopoiesis produces polyspecific CD8+ α/β T cells responding to multiple viral antigens
eLife 12:e81274.
https://doi.org/10.7554/eLife.81274


