Sensorimotor feedback loops are selectively sensitive to reward
- Brain and Mind Institute, University of Western Ontario, Canada
- Department of Psychology, University of Western Ontario, Canada
- School of Psychology, University of Birmingham, United Kingdom
- Department of Physiology & Pharmacology, Schulich School of Medicine & Dentistry, University of Western Ontario, Canada
- Robarts Research Institute, University of Western Ontario, Canada
- Haskins Laboratories, United States
Figures
Figure 1
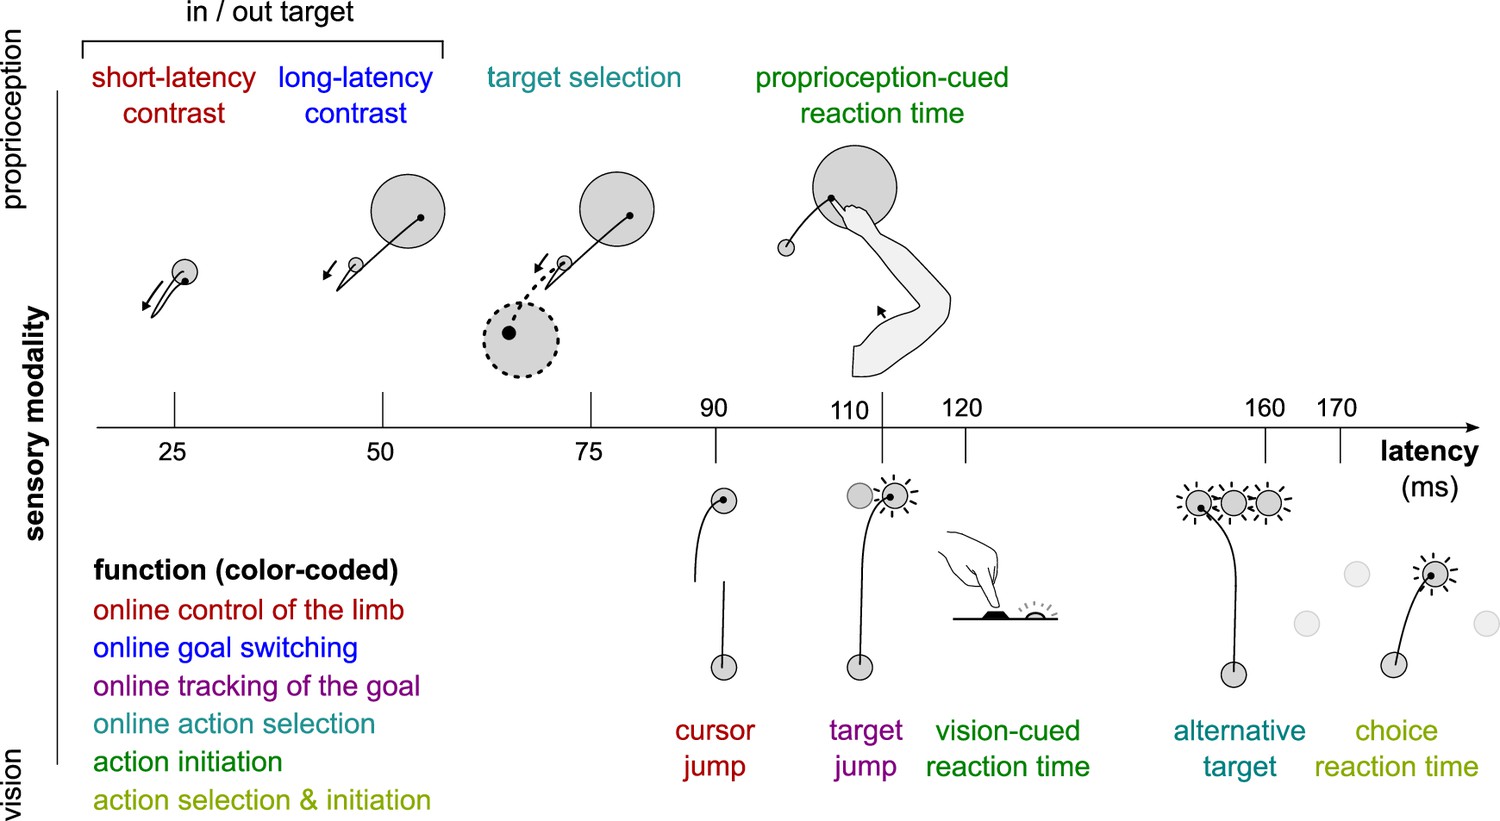
Different sensorimotor feedback responses are emphasized in different task designs.
Feedback responses can be classified along three dimensions: the sensory modality on which they rely (vertical axis), their post-perturbation latency (horizontal axis), and the function they perform (color-coded). Latencies indicated here reflect the fastest reported values from the literature and not necessarily what was observed in this study. Note that this is a partial inventory. Figure 1 has been adapted from Figure 2 in Scott, 2016.
Figure 2
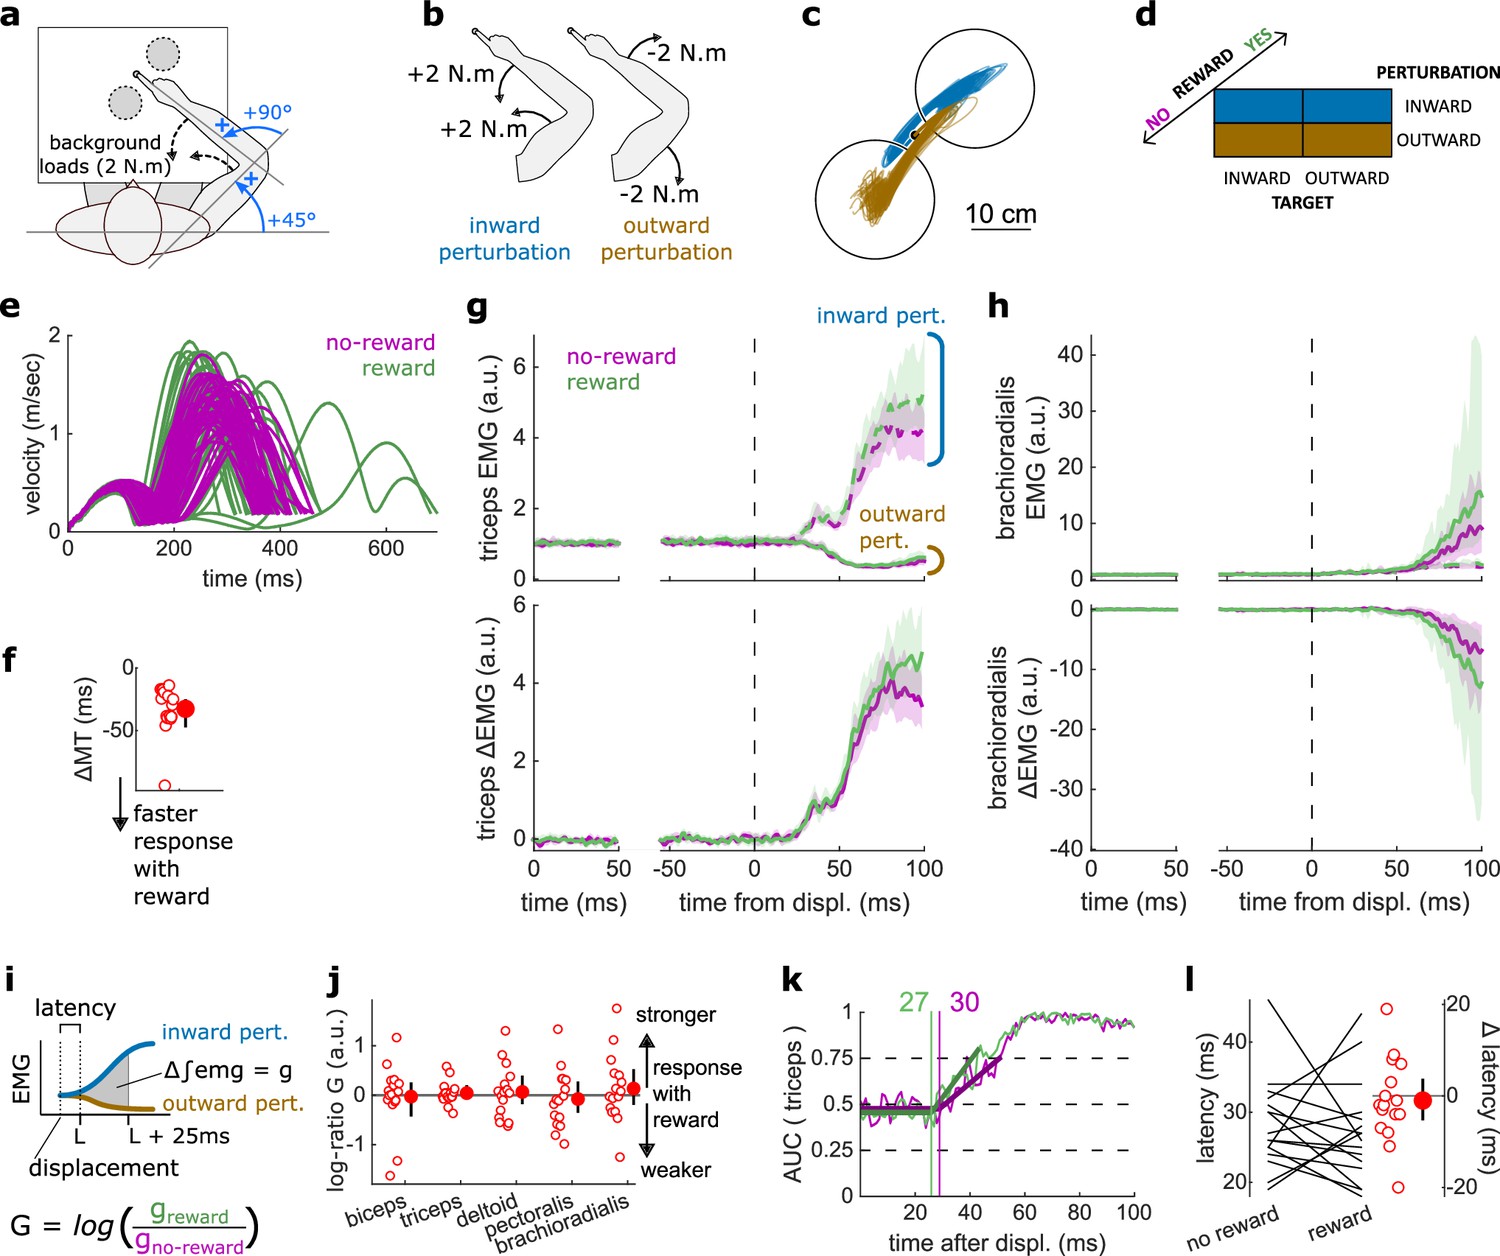
Results for the SLR contrast.
(a) Schematic representation of the apparatus from a top view. Participants could move their arm in a horizontal plane. Background forces were applied to pre-activate the extensor muscles (dashed arrows). The dashed circles indicate the two possible target positions. (b) A mechanical perturbation, either two positive (inward) or two negative (outward) torques, was applied at the shoulder and elbow joints. To observe the SLR, we contrasted the feedback response in trials with inward torques against those with outward torques. (c) Example trajectories for one participant for inward (blue) and outward (brown) perturbations. Only trials with a target opposite to the perturbation are shown for clarity. (d) Schematic representation of the In-Out task’s full 2×2×2 factorial design, with the conditions color-coded as in (b). (e) Example participant’s radial hand velocity during trials with and without reward. (f) Difference in median movement time between rewarded and non-rewarded trials. (g) Mean triceps EMG signal across participants, with the dashed and solid lines representing inward and outward perturbations, respectively; bottom panels: difference between EMG signals following inward and outward perturbations. The left panels show EMG at trial baseline (see EMG signal processing). Shaded areas indicate 95% CIs. (h) Same as (g) for the brachioradialis. (i) Schematic of the method used to estimate feedback gains for the SLR. For each recorded muscle, the feedback gain was defined as the difference between integrated EMG from the divergence point between the contrasted conditions’ EMG signals to 25 ms post-divergence. We then computed a log-ratio between the gain in rewarded and non-rewarded conditions. (j) Log-ratio of feedback gains in the rewarded versus non-rewarded conditions in a 25 ms window following SLR onset. (k) Example area under the curve (AUC) to obtain response latency for one participant. Thick lines indicate line-of-best-fit for a two-step regression (see Materials and methods). (l) Response latencies. In all panels with a red filled dot and black error bars, the filled dot indicates the group mean and error bars indicate 95% CIs (N=16). CI, confidence interval; EMG, electromyographic; SLR, short-latency rapid response.
Figure 3

Results for the LLR contrast.
(a) Contrast used to observe the LLR. Background loads are not drawn here for clarity. (b) Example trajectories for one participant for an outward (blue) or inward (brown) target. (c) Schematic representation of the In-Out task’s full 2×2×2 factorial design with the conditions color-coded as in (b). (d) Example participant’s radial hand velocity during trials with and without reward. (e) Difference in median movement time between rewarded and non-rewarded trials. (f) Mean triceps EMG signal across participants, with the dashed and solid lines representing the outward and inward target conditions, respectively, as indicated in (a); bottom panels: difference between the outward and inward target condition. The left panels show EMG at trial baseline (see EMG signal processing). Shaded areas indicate 95% CIs. (g) Same as (f) for the brachioradialis. (h) Log-ratio of feedback gains in the rewarded versus non-rewarded conditions in a 50 ms window following LLR onset. (i) Example area under the curve (AUC) to obtain response latency for one participant. Thick lines indicate line-of-best-fit for a two-step regression (see Materials and methods). (j) Response latencies. In all panels with a red filled dot and black error bars, the filled dot indicates the group mean and error bars indicate 95% CIs (N=16). CI, confidence interval; EMG, electromyographic; LLR, long-latency rapid response.
Figure 4
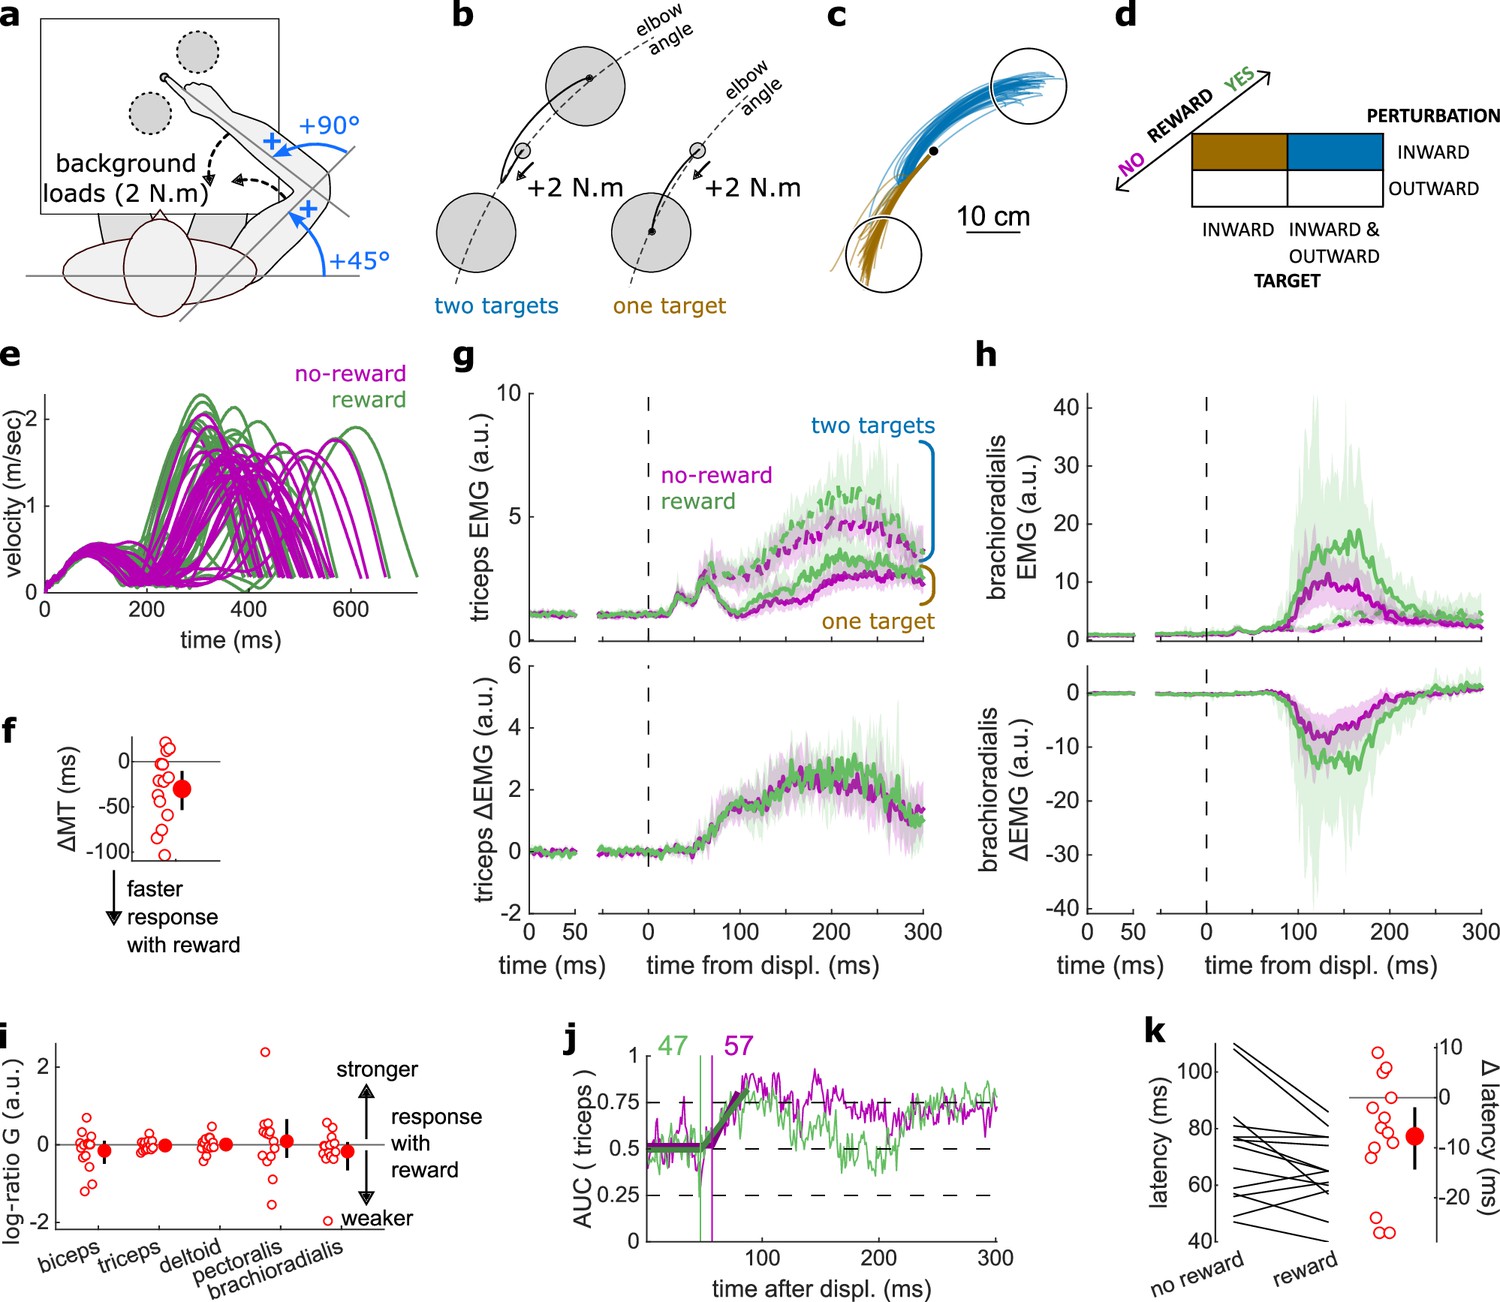
Results for the Target Selection task.
(a) Schematic representation of the apparatus from a top view. Participants could move their arm in a horizontal plane. Background forces were applied to pre-activate the extensor muscles (dashed arrows). (b) Contrast used to observe the feedback response to a Target Selection. Background loads are not drawn for clarity. (c) Example trajectories for one participant in the two-targets (blue) and one-target (brown) conditions. (d) Schematic representation of the Target Selection task’s full 2×2×2 factorial design with the conditions color-coded as in (b). (e) Example participant’s radial hand velocity during trials with and without reward. (f) Difference in median movement time (MT) between rewarded and non-rewarded trials. A negative value indicates a smaller MT for rewarded trials. (g) Mean triceps EMG signal across participants, with the dashed and solid lines representing two- and one-target conditions, respectively, as indicated in (b); bottom panels: difference between the two- and one-target condition. The left panels show EMG at trial baseline (see EMG signal processing). Shaded areas indicate 95% CIs. (h) Same as (g) for the brachioradialis muscle. (i) Log-ratio G of feedback gains in the rewarded versus non-rewarded conditions in a 50 ms window following Target Selection response onset. (j) Example area under the curve (AUC) to obtain response latency for one participant. Thick lines indicate line-of-best-fit for a two-step regression (see Materials and methods). (k) Response latencies. In all panels with a red filled dot and black error bars, the filled dot indicates the group mean and error bars indicate 95% CIs (N=14). CI, confidence interval; EMG, electromyographic.
Figure 5
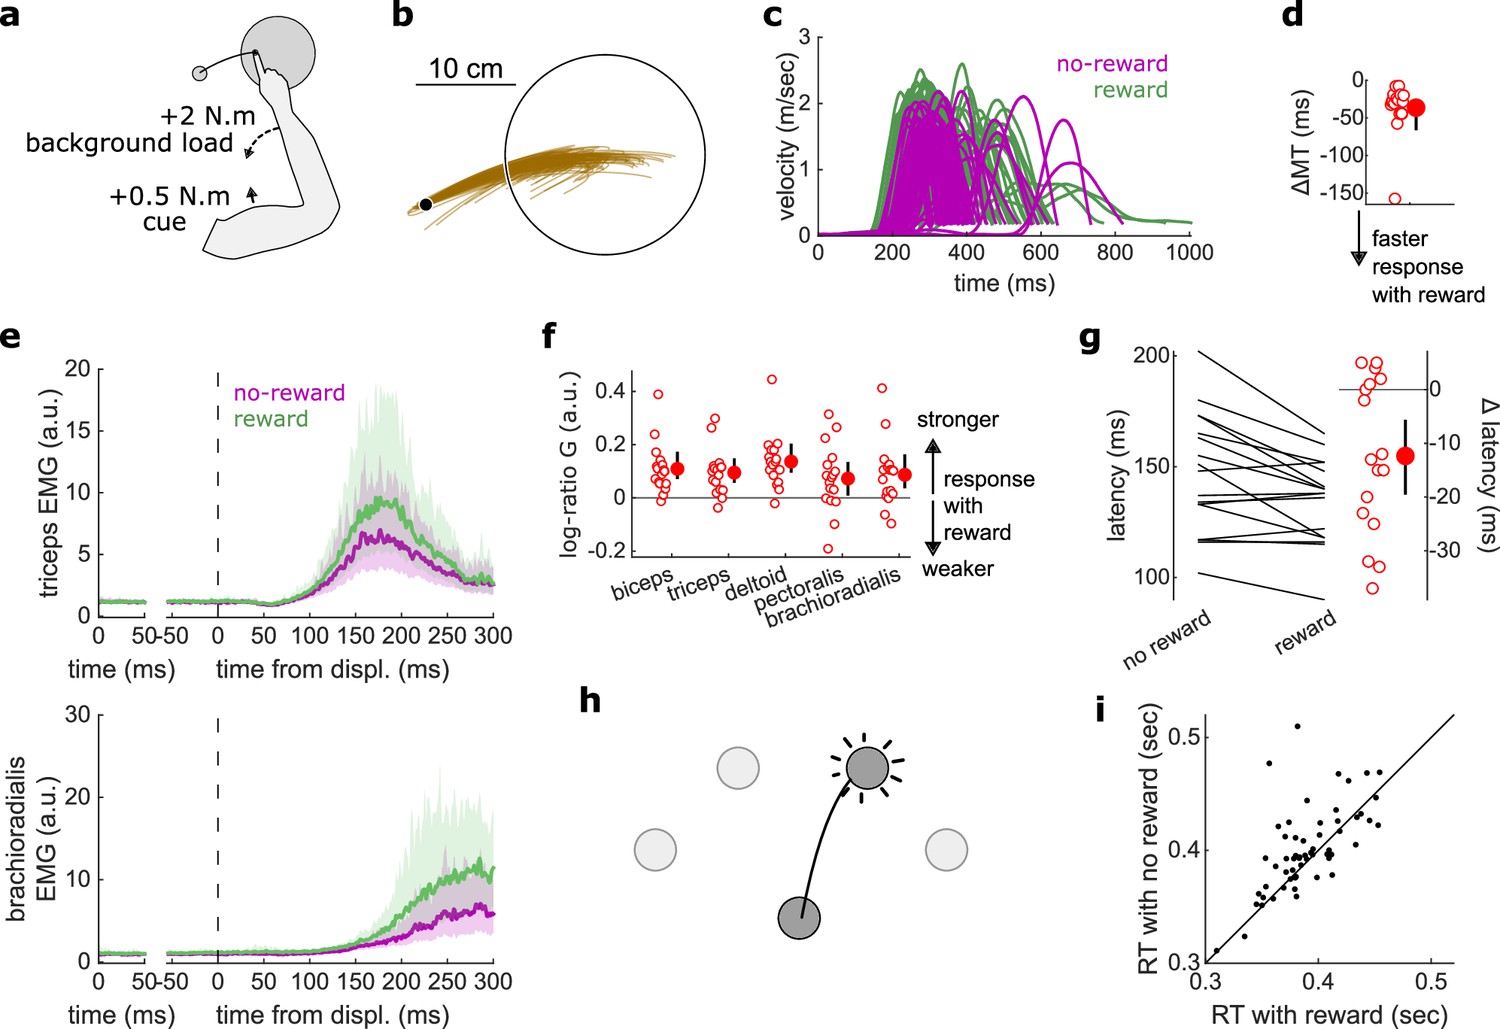
Results for the Reaction Time tasks.
(a) Schematic of task design for Proprioception-cued Reaction Times. Participants were informed to initiate an elbow extension by a small mechanical perturbation at the shoulder (solid black arrow). Background loads pre-loaded the elbow extensor muscles (dashed black arrow). (b) Example trajectories for one participant. (c) Example participant’s radial hand velocity during trials with and without reward. (d) Difference in median movement time between rewarded and non-rewarded trials. (e) Top panels: mean triceps EMG signal across participants. The left panels show EMG at trial baseline (see EMG signal processing). Shaded areas indicate 95% CIs. Bottom panels: same as top panels for the brachioradialis. (f) Log-ratio of feedback gains in the rewarded versus non-rewarded conditions in a 50 ms window following the feedback response onset. (g) Response latencies. In all panels with a red filled dot and black error bars, the filled dot indicates the group mean and error bars indicate 95% CIs (N=17). (h) Schematic of task design for choice reaction times. (i) Median reaction times for each participant (N=60) in the choice reaction time task in the rewarded and non-rewarded conditions, plotted against the unity line. CI, confidence interval; EMG, electromyographic.
Figure 6
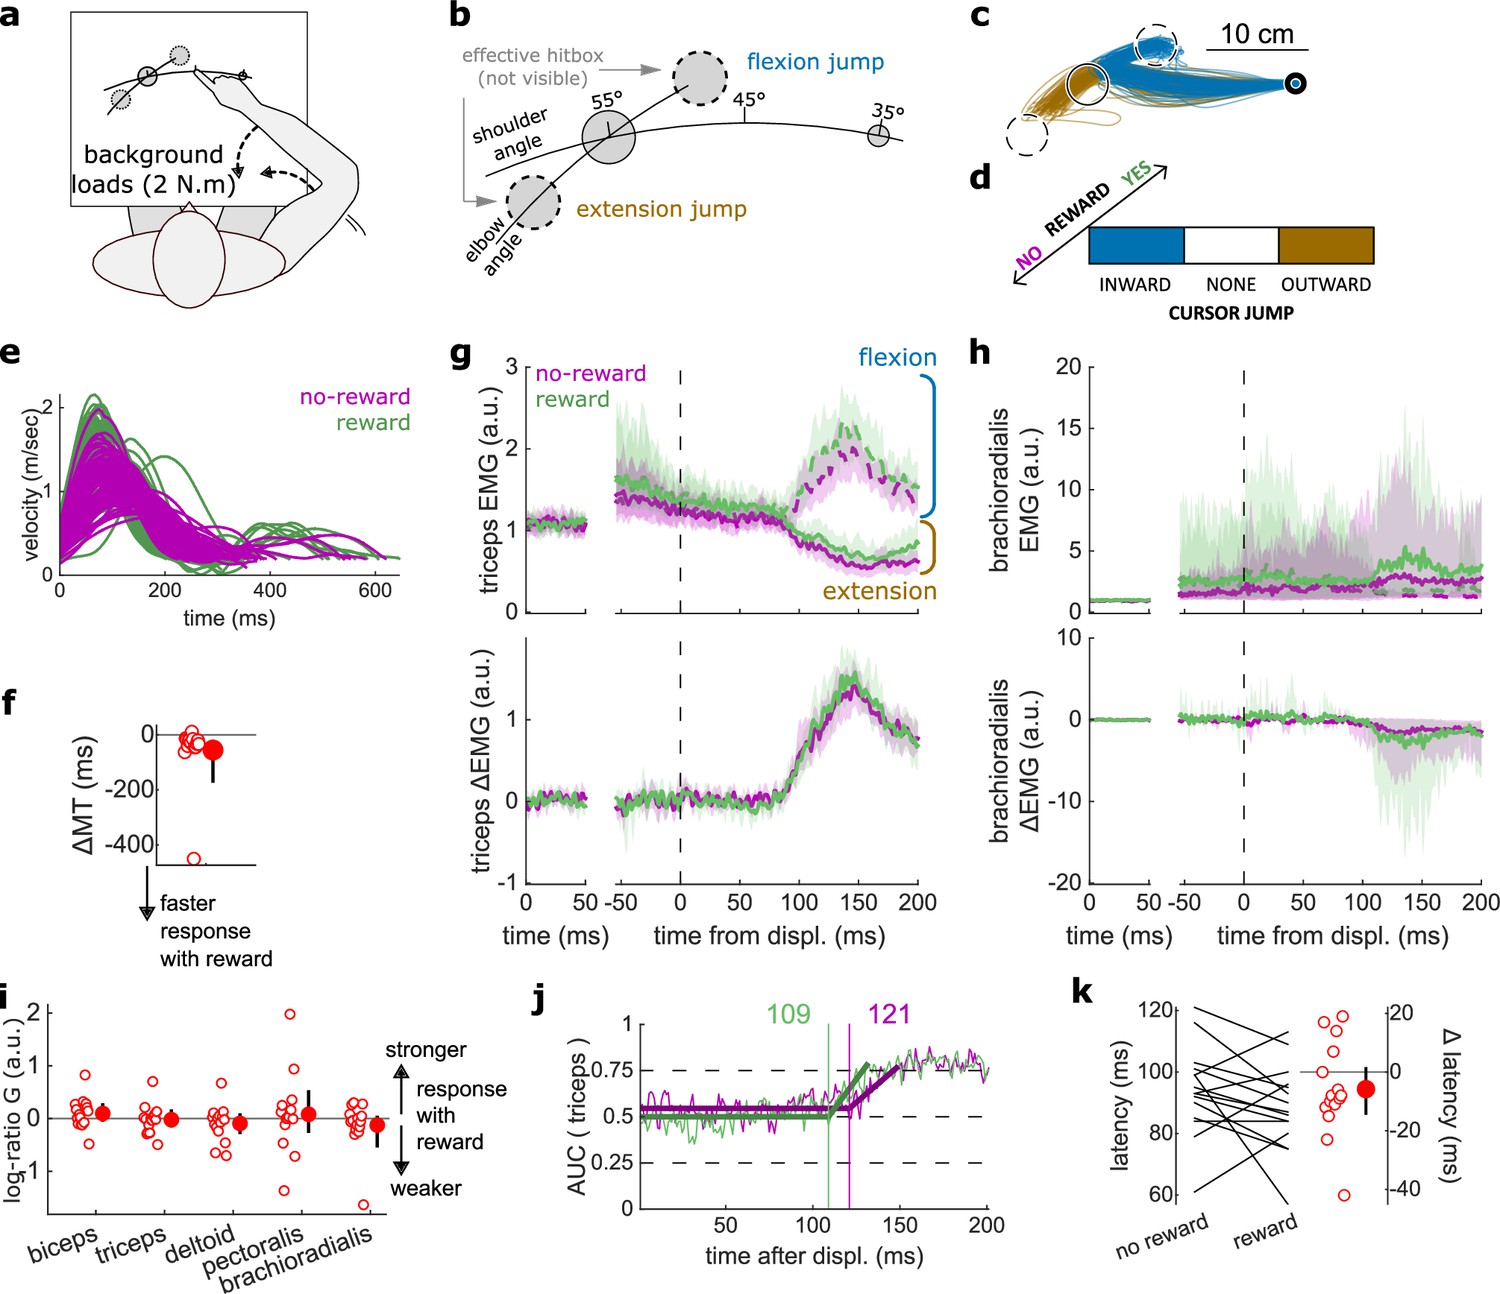
results for the Cursor Jump task.
(a) Schematic representation of the apparatus from a top view. Participants could move their arm in a horizontal plane. 2 N·m Background forces were applied to pre-activate the extensor muscles (dashed arrows). (b) Contrast used to observe the feedback response to a cursor jump. (c) Example trajectories for one participant. The dashed circles correspond to where the actual target ‘hit box’ is to successfully compensate for the cursor jump. (d) Schematic representation of the Cursor Jump task’s full 2×3 factorial design with the conditions color-coded as in (b). (e) Example participant’s radial hand velocity during trials with and without reward. (f) Difference in median movement time between rewarded and non-rewarded trials. (g) Mean triceps EMG signal across participants, with the dashed and solid lines representing a flexion jump and an extension jump, respectively; bottom panels: difference between the flexion and extension condition. The left panels show EMG at trial baseline (see EMG signal processing). Shaded areas indicate 95% CIs. (h) Same as (g) but for the brachioradialis. (i) Log-ratio G of feedback gains in the rewarded versus non-rewarded conditions in a 50 ms window following the onset of the feedback response to the cursor jump. (j) Example area under the curve (AUC) to obtain response latency for one participant. Thick lines indicate line-of-best-fit for a two-step regression (see Materials and methods). (k) Response latencies. In all panels with a red filled dot and black error bars, the filled dot indicates the group mean and error bars indicate 95% CIs (N=15). CI, confidence interval; EMG, electromyographic.
Figure 7
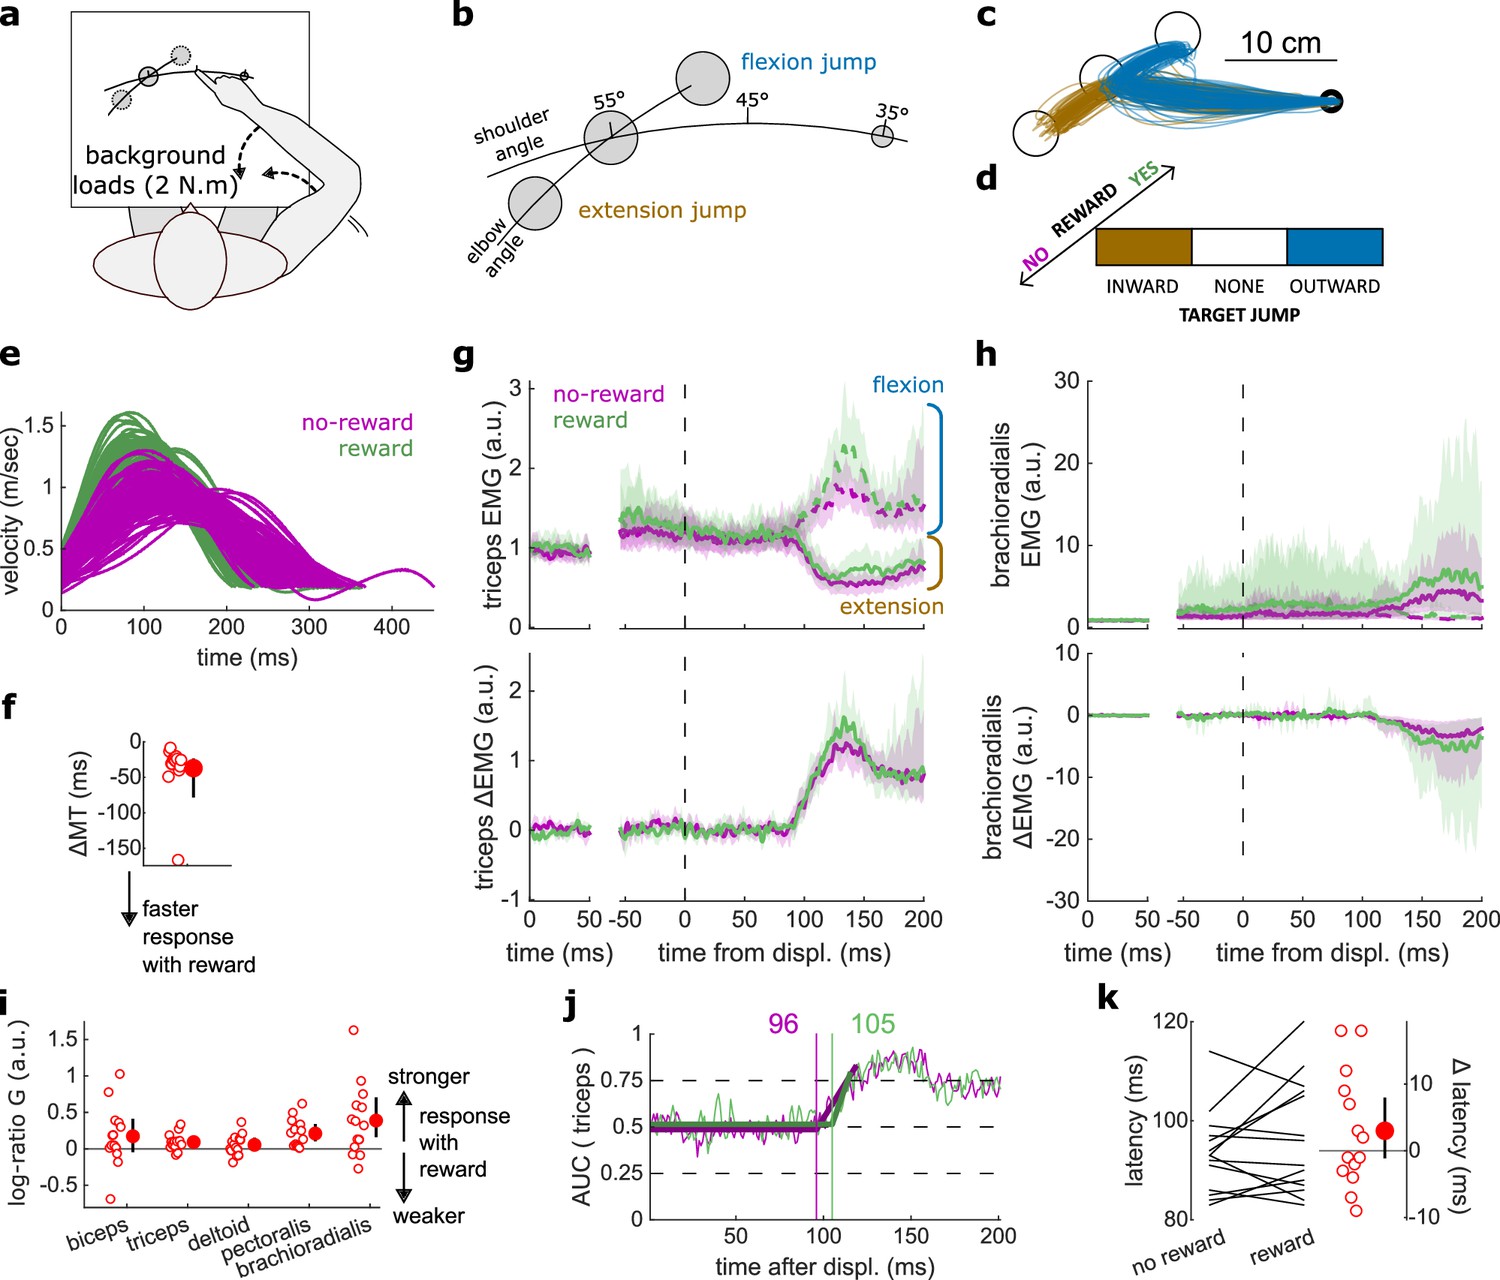
Results for the Target Jump task.
(a) Schematic representation of the apparatus from a top view. Participants could move their arm in a horizontal plane. 2 N·m Background forces were applied to pre-activate the extensor muscles (dashed arrows). (b) Contrast used to observe the feedback response to a target jump. (c) Example trajectories for one participant. (d) Schematic representation of the Target Jump task’s full 2×3 factorial design with the conditions color-coded as in (b). (e) Example participant’s radial hand velocity during trials with and without reward. (f) Difference in median movement time between rewarded and non-rewarded trials. (g) Mean triceps EMG signal across participants, with the dashed and solid lines representing an extension jump and a flexion jump, respectively, as indicated in (b); bottom panels: difference between the extension and flexion conditions. The left panels show EMG at trial baseline (see EMG signal processing). Shaded areas indicate 95% CIs. (h) Same as (g) for the brachioradialis. (i) Log-ratio G of feedback gains in the rewarded versus non-rewarded conditions in a 50 ms window following the onset of the feedback response to the target jump. (j) Example area under the curve (AUC) to obtain response latency for one participant. Thick lines indicate line-of-best-fit for a two-step regression (see Materials and methods). (k) Response latencies. In all panels with a red filled dot and black error bars, the filled dot indicates the group mean and error bars indicate 95% CIs (N=14). CI, confidence interval; EMG, electromyographic.
Figure 8
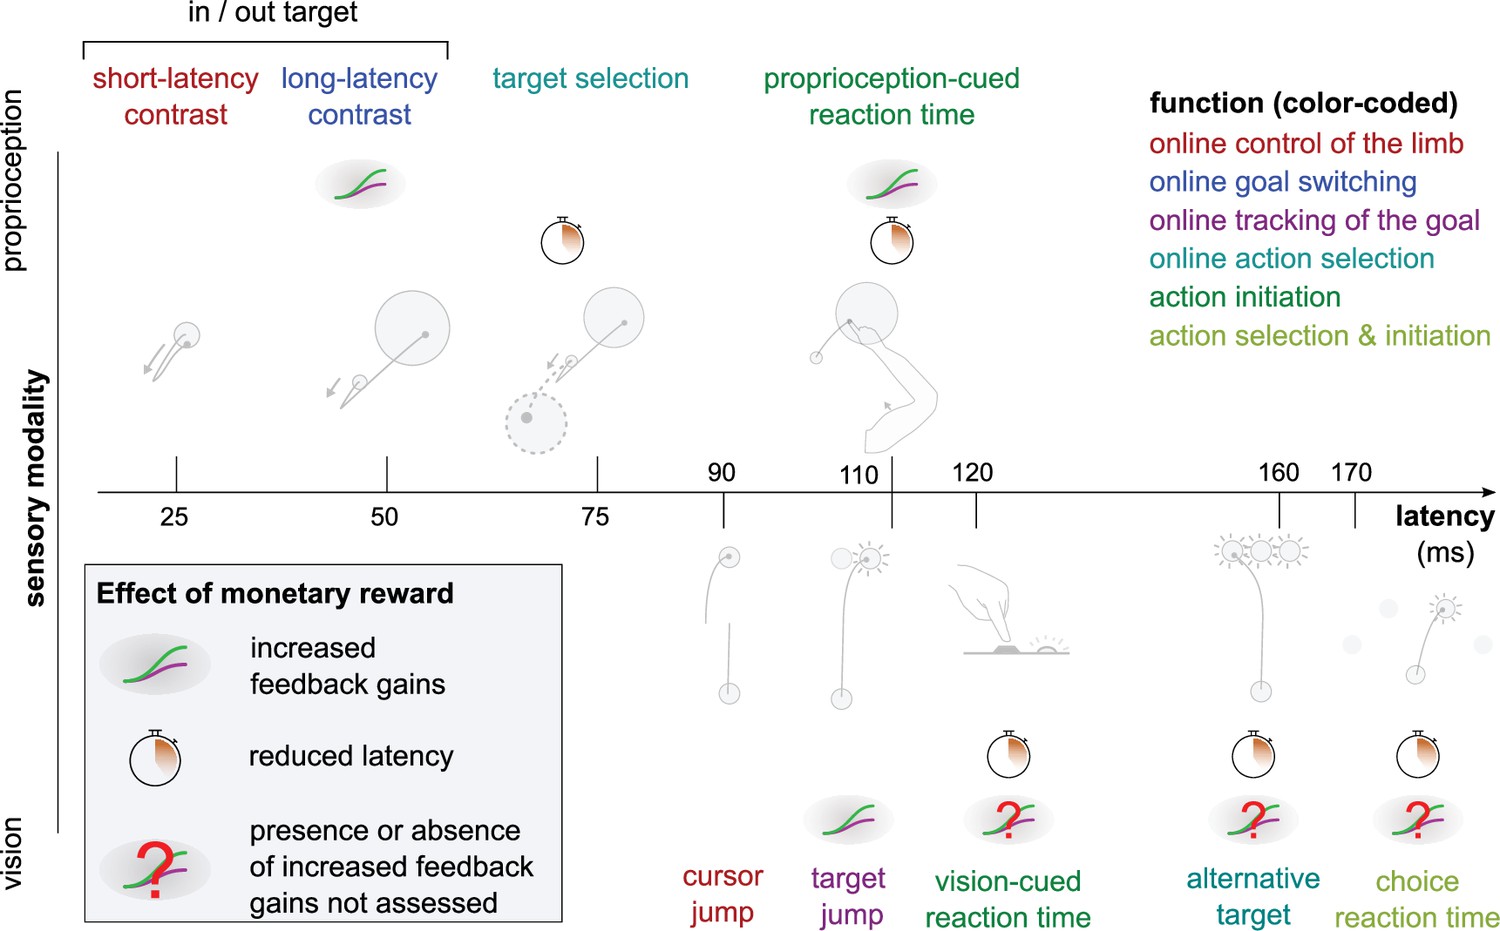
Overview of expected reward impact on sensorimotor feedback responses.
Reward can impact a feedback loop response by increasing feedback gains or reducing latency. The color code indicates function and is identical to the one in Figure 1. Results for the Alternative Target and Vision-cued Reaction Time tasks are drawn from Carroll et al., 2019 and Stillings et al., 1968, respectively.
Author response image 1

Position of maximum excursion following the perturbation in the condition with an inward (counterclockwise) push and an outward (clockwise) target.
Trials where reward was provided are colorcoded in green, and trials where no reward was provided are color-coded in red. The triangle indicates the starting position from which the perturbation occurred. Each panel represents one participant (N=16).
Author response image 2

Author response image 3

Simulated data with gaussian noise (noise standard deviation = 0).
2).
Author response image 4

Estimated latency as noise standard deviation in the simulated data was varied.
The blue line indicates the true latency of signal divergence.
Author response image 5

Extrapolation method from Brenner and Smeets, 2019, on triceps EMG from the cursor jump task.
Author response image 6
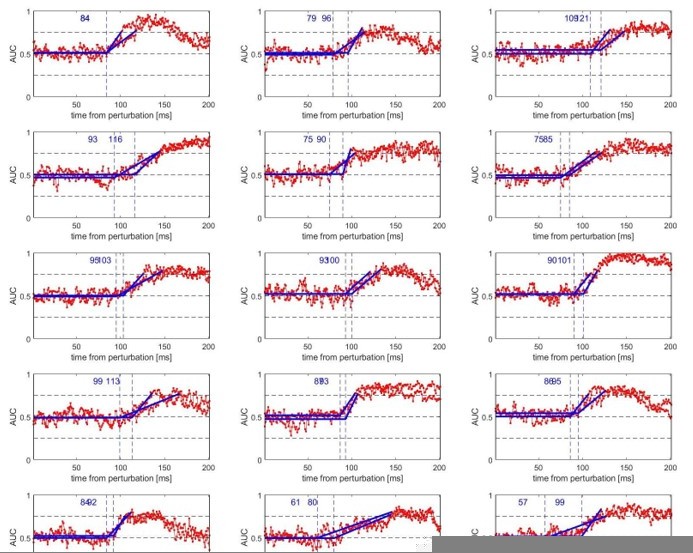
ROC method from Weiler et al.
, 2015, on triceps EMG from the cursor jump task. The solid blue lines indicate the segmented linear fits, and the “knee” of this fit is highlighted with vertical dashed lines.
Tables
Table 1
Task to feedback response mapping.
This table indicates the correspondence between tasks and published work used, and the feedback responses assessed in the present study. RT, reaction time.
| Feedback response | Task | Reference |
|---|---|---|
| SLR | In-Out Target task | |
| LLR | ||
| Target Selection | Target Selection | |
| Target Jump | Target Jump | |
| Cursor Jump | Cursor Jump | |
| Proprioception-cued RTs | Proprioception-cued RTs | |
| Vision-cued RTs | Stillings et al., 1968 | |
| Alternative Target | Carroll et al., 2019 | |
| Choice RTs | (Data set re-analysed) | Codol et al., 2020a |
Table 2
Parameters used to compute the return in each rewarded trial, for each condition in the Proprioception-cued Reaction Time, Cursor Jump, Target Jump, and Target Selection tasks.
| Task | Condition | Scaler | Shifter | τ | MTmax (ms) |
|---|---|---|---|---|---|
| Reaction Time | N/A | 1 | 0 | 2.447 | 728 |
| Cursor Jump | Inward | 0.996 | –0.029 | 4.273 | 2781 |
| No jump | 0.667 | 0.079 | 5.433 | 2335 | |
| Outward | 0.996 | –0.041 | 3.958 | 2864 | |
| Target Jump | Inward | 0.999 | –0.026 | 4.281 | 2697 |
| No jump | 0.683 | –0.040 | 3.893 | 2882 | |
| Outward | 0.999 | –0.054 | 3.853 | 2690 | |
| Target Selection | One target Inward Pert. | 0.676 | –0.034 | 6.236 | 1673 |
| One target Outward Pert. | 0.690 | 0.004 | 5.534 | 2241 | |
| Two targets Inward Pert. | 0.749 | –0.021 | 4.904 | 2373 | |
| Two targets Outward Pert. | 0.749 | 0.009 | 5.350 | 2208 |
Additional files
Download links
A two-part list of links to download the article, or parts of the article, in various formats.
Downloads (link to download the article as PDF)
Open citations (links to open the citations from this article in various online reference manager services)
Cite this article (links to download the citations from this article in formats compatible with various reference manager tools)
Sensorimotor feedback loops are selectively sensitive to reward
eLife 12:e81325.
https://doi.org/10.7554/eLife.81325


