Evidence for dopaminergic involvement in endogenous modulation of pain relief
- Institute of Cognitive and Clinical Neuroscience, Central Institute of Mental Health, Medical Faculty Mannheim, Heidelberg University, Germany
- Clinical Psychology, Department of Experimental Psychology, Heinrich Heine University Düsseldorf, Germany
- Integrative Spinal Research, Department of Chiropractic Medicine, Balgrist University Hospital, University of Zurich, Switzerland
- Wellcome Centre for Integrative Neuroimaging, John Radcliffe Hospital, United Kingdom
Figures
Figure 1
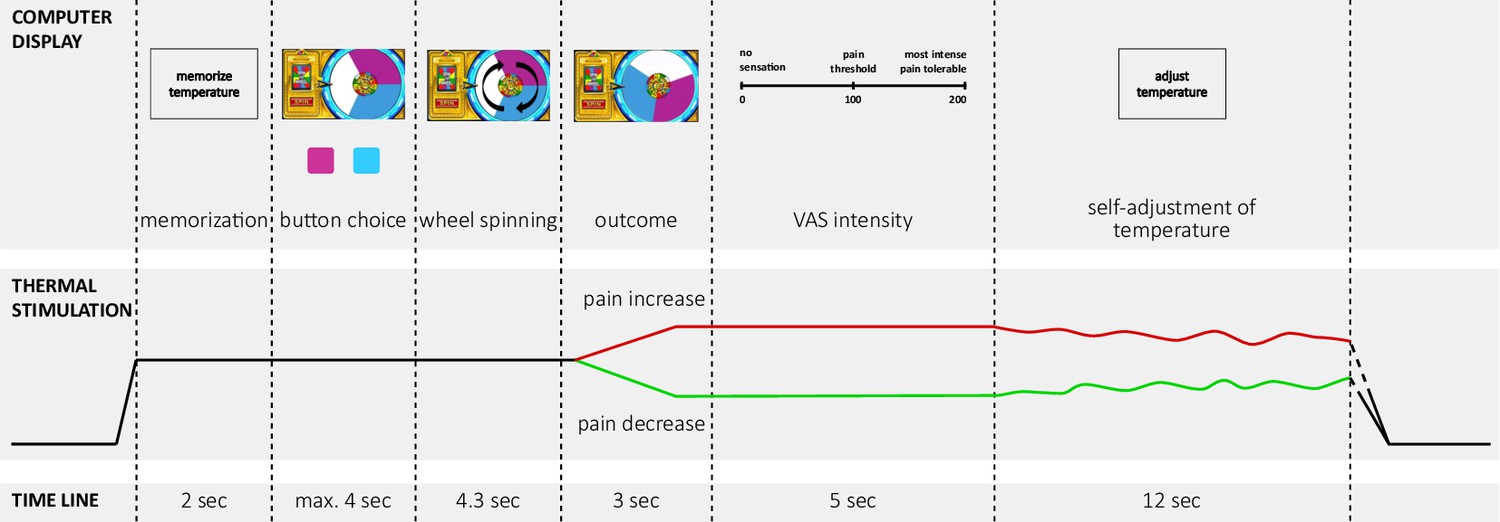
Time line of one trial with active decision-making (test trials) of the wheel of fortune game.
Experimental pain was implemented using contact heat stimulation on capsaicin sensitized skin on the forearm. In each trial, the temperature increased from a baseline of 30 °C to a predetermined moderately painful stimulation intensity perceived as moderately painful. In each testing session, one of the two colors (pink and blue) of the wheel was associated with a higher chance to win pain relief (counterbalanced across subjects and drug conditions). Pain relief (win) as outcome of the wheel of fortune game (depicted in green) and, pain increase (loss; depicted in red) were implemented as phasic changes in stimulation intensity offsetting from the tonic painful stimulation. Based on a probabilistic reward schedule for these outcomes, participants could learn which color was associated with a better chance to win pain relief. In passive control trials and neutral trials participants did not play the game but had to press a black button after which the wheel started spinning and landed on a random position with no pointer on the wheel. Trials with active decision-making were matched by passive control trials without decision making but the same nociceptive input (control trials), resulting in the same number of pain increase and pain decrease trials as in the active condition. In neutral trials the temperature did not change during the outcome interval of the wheel. Two outcome measures were implemented in all trial types: (i) after the phasic changes during the outcome phase participants rated the perceived momentary intensity of the stimulation on a visual analogue scale (‘VAS intensity’); (ii) after this rating, participants had to adjust the temperature to match the sensation they had memorized at the beginning of the trial, i.e. the initial perception of the tonic stimulation intensity (‘self-adjustment of temperature’). This perceptual discrimination task served as a behavioral assessment of pain sensitization and habituation across the course of one trial. One trial lasted approximately 30 s, phasic offsets occurred after approximately 10 s of tonic pain stimulation. Adapted from Becker et al., 2015. Figure 1 is reproduced from Figure 1 in Becker et al., 2015.
Figure 2 with 1 supplement

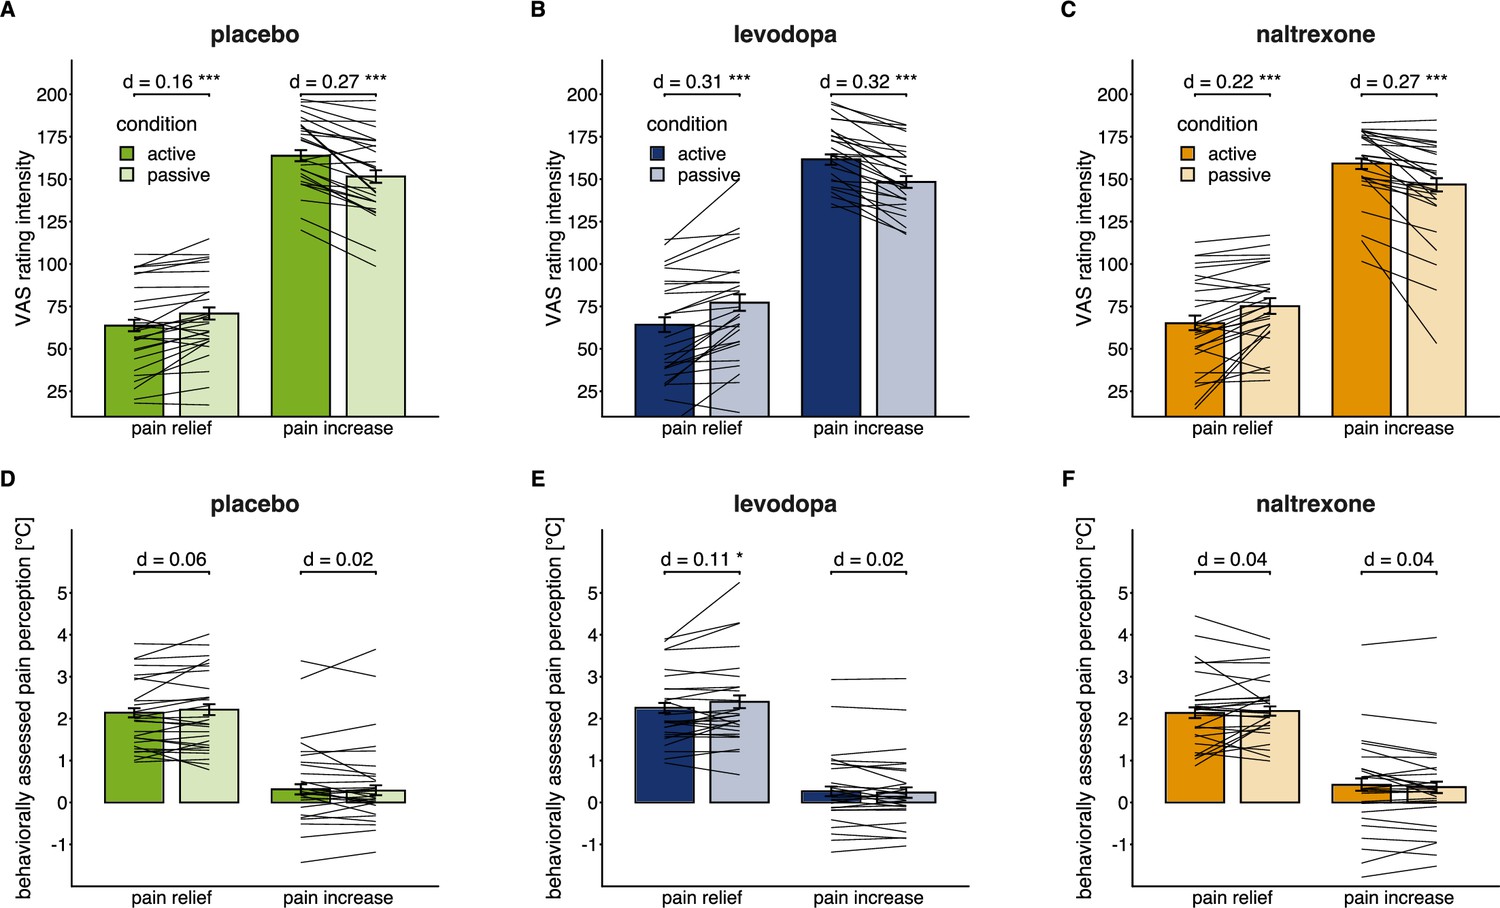
Effects of active versus passive condition after pain relief and pain increase in each drug condition.
Means (bars) and 95% confidence intervals of means (error bars) for VAS pain intensity ratings (A, B, C) and behaviorally assessed pain perception (D, E, F; within-trial sensitization in pain perception in °C) for each drug session (placebo: n=28, levodopa: n=27, naltrexone: n=28). d indicates the standardized effect size after controlling for random effects and residual variance. ** p<0.01, *** p<0.001, for post-hoc comparisons of test versus control trials.
Figure 2—figure supplement 1
Individual level effects of active versus passive condition after pain relief and pain increase in each drug condition.
Individual means superimposed on the group means (bars) and 95% confidence intervals of group means (error bars) for VAS pain intensity ratings (A, B, C) and behaviorally assessed pain perception (D, E, F; within-trial sensitization in pain perception in °C) for each drug session (placebo: n=28, levodopa: n=27, naltrexone: n=28). d indicates the standardized effect size after controlling for random effects and residual variance. ** p<0.01, *** p<0.001, for post-hoc comparisons of test versus control trials.
Figure 3 with 4 supplements
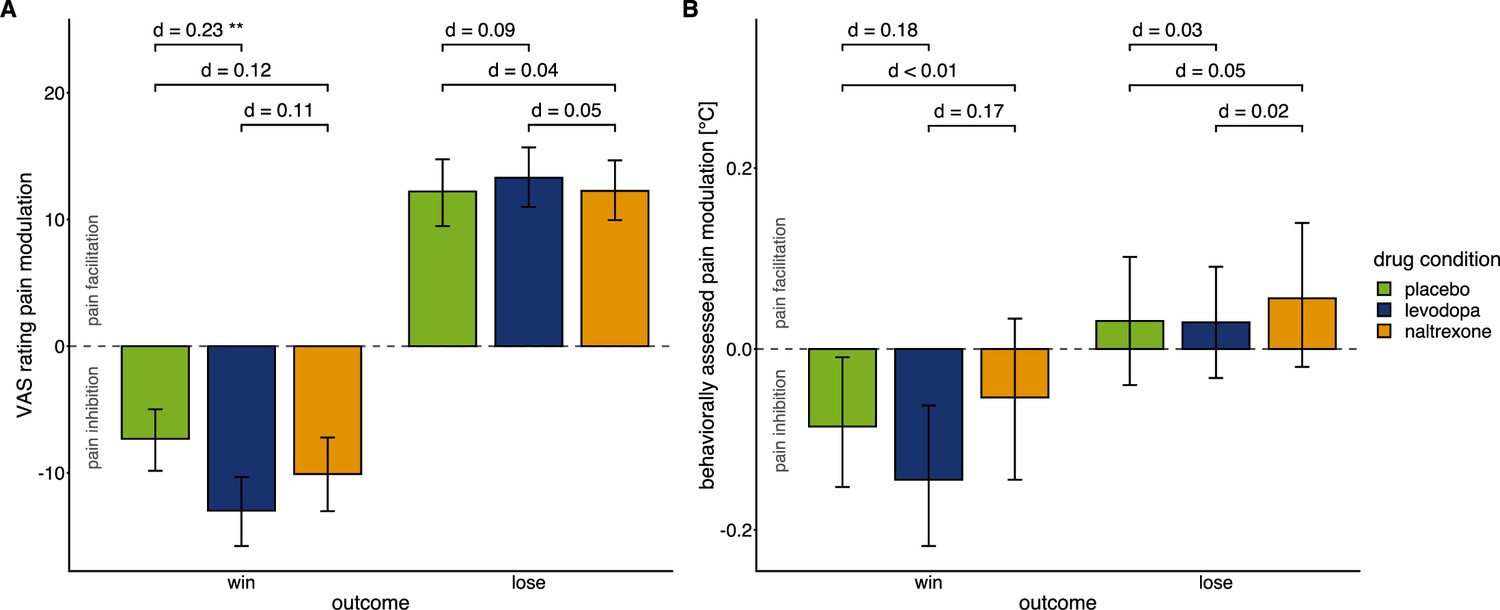
Effects of drug manipulation on endogenous pain modulation.
Effects of drug manipulation on endogenous pain modulation assessed by VAS ratings of pain intensity (A) and behaviorally assessed pain perception (B) after winning and losing in the wheel of fortune game, respectively (placebo: n=28, levodopa: n=27, naltrexone: n=28). Bars show group level means and error bars show 95% confidence interval of the group level mean. d indicates the standardized effect-size after controlling for random effects and residual variance. While the temporal order of sessions did affect pain modulation (Figure 3—figure supplement 1), measures of pain sensitivity, that were not experimentally manipulated (Figure 3—figure supplement 2), and measures of mood (Figure 3—figure supplement 3) did not significantly differ between drug conditions. For individual effects of the drug manipulations on endogenous pain modulation see Figure 3—figure supplement 4.
Figure 3—figure supplement 1
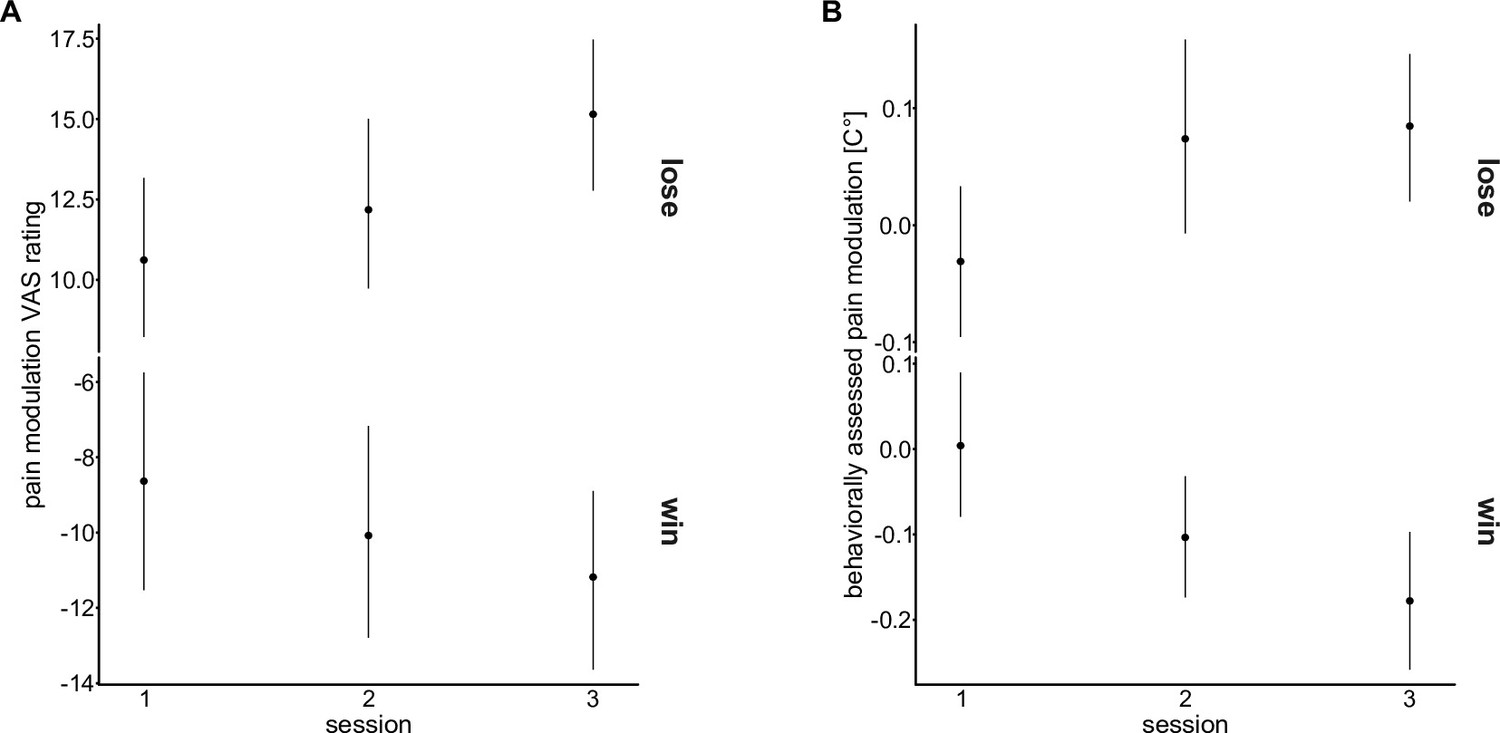
Effects of temporal order of sessions on endogenous modulation.
Means (points) and 95% confidence intervals of the mean (error bars) for pain modulation in (A) VAS ratings and (B) behaviorally assessed pain modulation for each testing session.
Mixed-effects models testing whether the temporal order of the testing sessions, independent of the order of the application of the drugs, had an effect on pain modulation in win and lose trials of the wheel of fortune did not show a main effect of ‘session number’ (pain modulation VAS ratings: F(2, 1593.70)=1.28, p=0.279; behaviorally assessed pain modulation: F(2, 1599.84)=0.86, p=0.425) but point to a differential effect of temporal order for win and lose outcomes (interaction ‘outcome × session number’: pain modulation VAS ratings: F(2, 1593.77)=3.00, p=0.050; behaviorally assessed pain perception: F(2, 1597.27)=7.94, p<0.001). Hence, temporal order was included as an additional main effect when testing the effect of ‘drug’ on pain modulation.
Figure 3—figure supplement 2
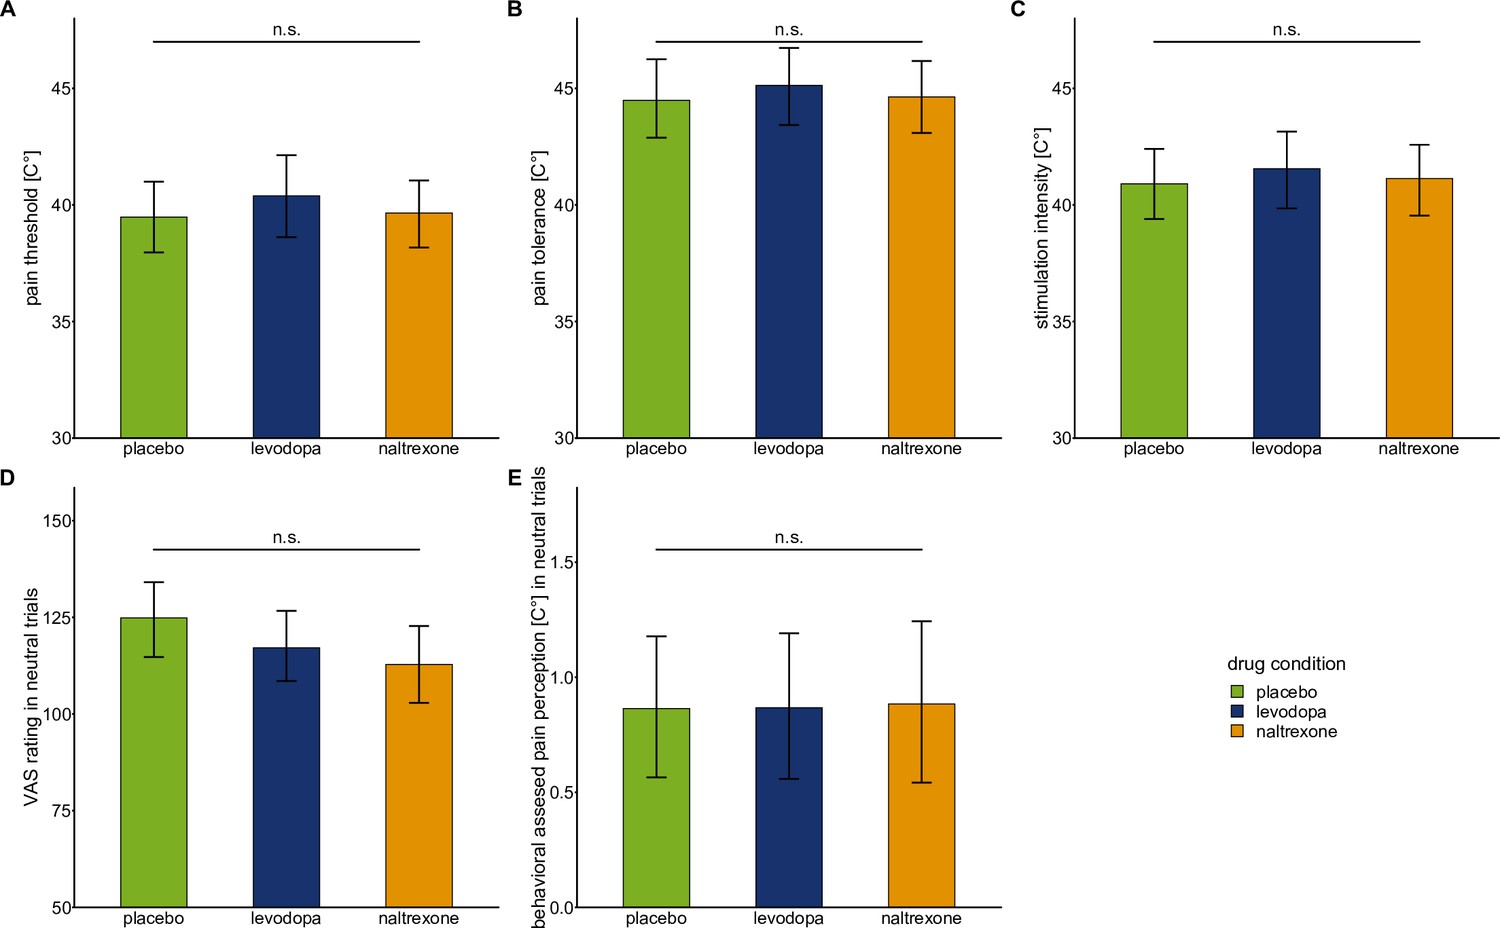
Baseline pain sensitivity and neutral condition of the wheel of fortune task.
Bars show means and error bars 95% confidence intervals of the mean for (A) pain threshold, (B) pain tolerance, (C) stimulation intensity, (D) VAS ratings in neutral trials (in which participants did not play the game and the temperature stayed constant), and (E) behaviorally assessed pain perception in neutral trials for each drug condition.
Mixed-effects models using drug condition (placebo: n = 28, levodopa: n = 27, naltrexone: n = 28) to predict measures of baseline pain sensitivity showed no significant main effect for ‘drug’: pain threshold: F(2,53.21) = 0.64, p=0.529; pain tolerance: F(2,53.18) = 0.31, p = 0.736; stimulation intensity: F(2,53.2) = 0.30, p = 0.745. Mixed-effects models using drug condition to predict VAS ratings and behaviorally assessed pain perception in the neutral condition of the wheel of fortune task showed no significant main effect for ‘drug’: VAS ratings: F(2,53.31) = 2.12, p = 0.131; behaviorally assessed pain perception: F(2,53.13) = 0.01, p = 0.990.
Figure 3—figure supplement 3
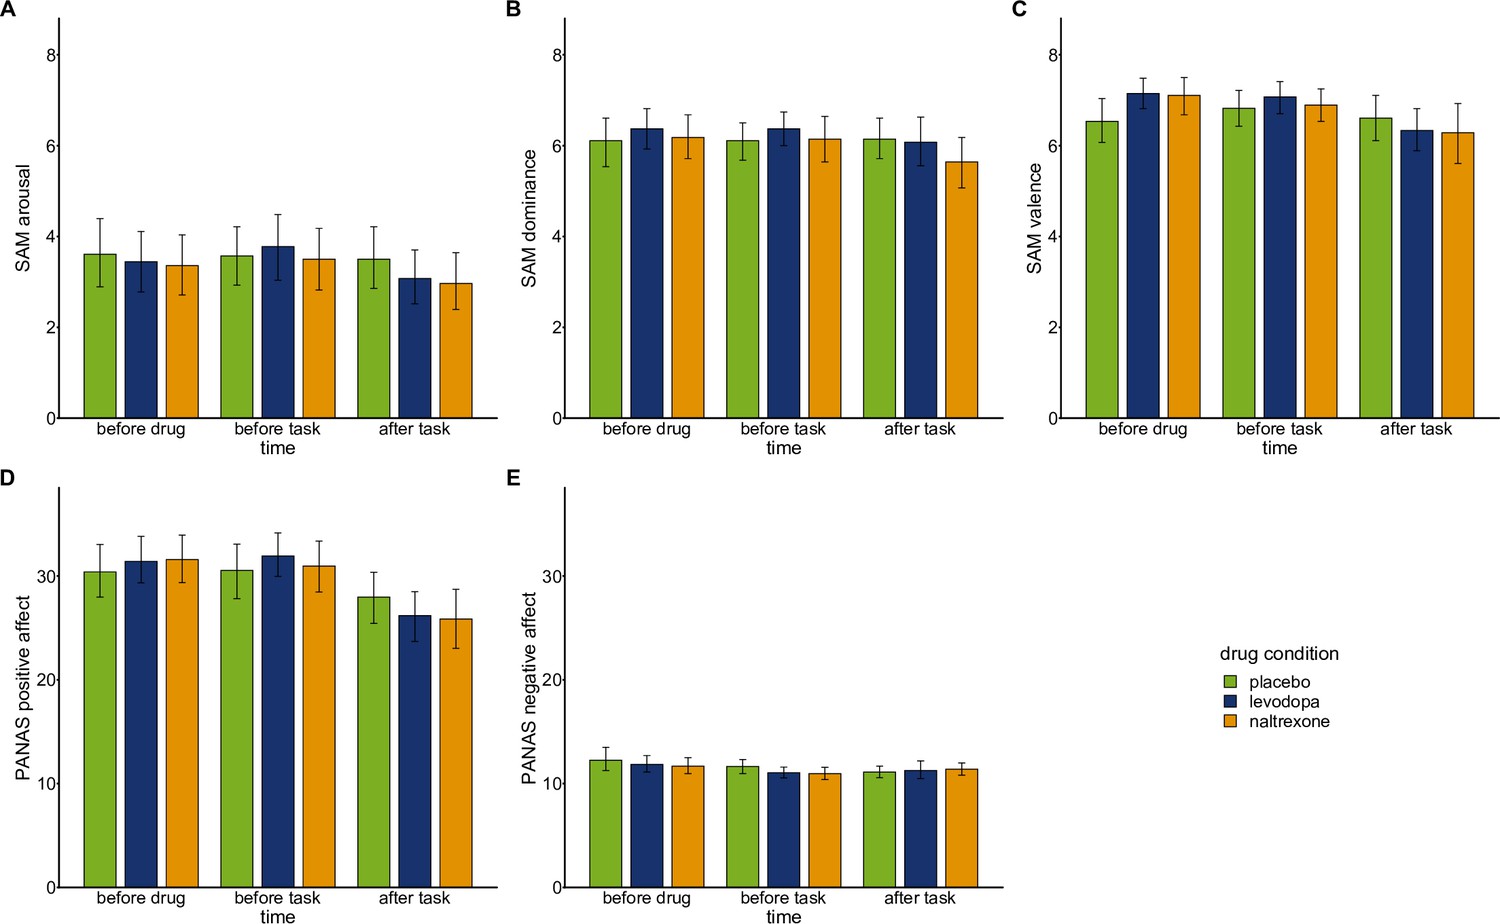
Mood ratings.
Mood was assessed over the course of each experimental session before drug intake, before playing the wheel of fortune game, and after playing the game using computerized versions of the Self-Assessment Manikin (SAM; Bradley and Lang, 1994; Lang, 1980) and a German version (Krohne et al., 1996) of the Positive And Negative Affect Scale (PANAS; Watson et al., 1988).
Bars show means and error bars 95% confidence intervals of the mean for SAM subscales (A) arousal, (B) dominance, (C) valence, and PANAS subscales (D) positive affect, and (E) negative affect at each time point. To test whether drug conditions (placebo: n=28, levodopa: n=27, naltrexone: n=28) differentially affected mood we fit separate mixed-effects models predicting subscales of SAM and PANAS by ‘drug’, ‘time’, and their interaction. SAM ratings for arousal, dominance, and valence did not show any significant main effects of ‘drug’ (arousal: F(2,213.2)=1.56, p=0.214); dominance: F(2,213.29)=1.03, p=0.359; valence: F(2,213.41)=0.74, p=0.479) nor significant interactions for ‘drug x time’ (arousal: F(4,213.0)=0.69, p=0.599; dominance: F(4,213.00)=0.88, p=0.4771; valence: F(4,213.00)=2.28, p=0.062). Participants’ positive affect assed with the PANAS did not show a significant main effect of ‘drug’ (F(2,213.25=0.05, p=0.954) nor a significant interaction of ‘drug x time’ (F(2, 213.00)=1.60, p=0.176). Similarly, negative affect assessed with the PANAS did not show a significant main effect of ‘drug’ (F(2, 213.51)=0.93, p=0.376) nor a significant interaction of ‘drug x time’ (F(2, 213.00)=0.79, p=0.533).
Figure 3—figure supplement 4
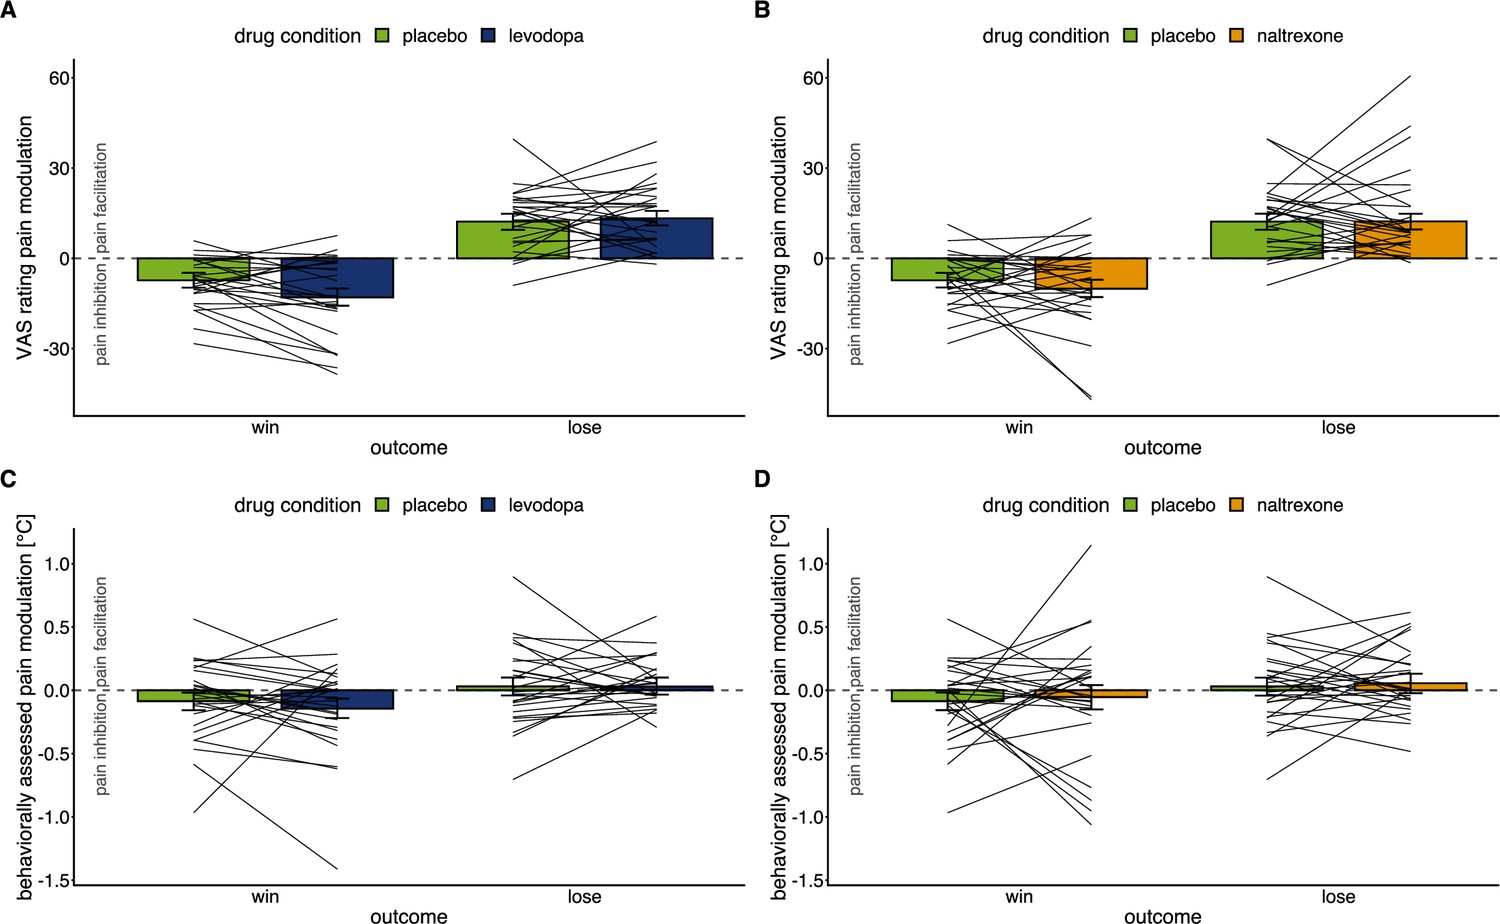
Individual level effects of drug manipulations on endogenous modulation.
Effects of drug manipulation on endogenous pain modulation assessed by VAS ratings of pain intensity (A & B) and behaviorally assessed pain perception (C & D) after winning and losing in the wheel of fortune game, respectively (placebo: n=28, levodopa: n=27, naltrexone: n=28).
Bars show group level means and error bars show 95% confidence interval of the group level mean. Lines show individual means of the placebo condition and the respective drug condition.
Figure 4 with 1 supplement
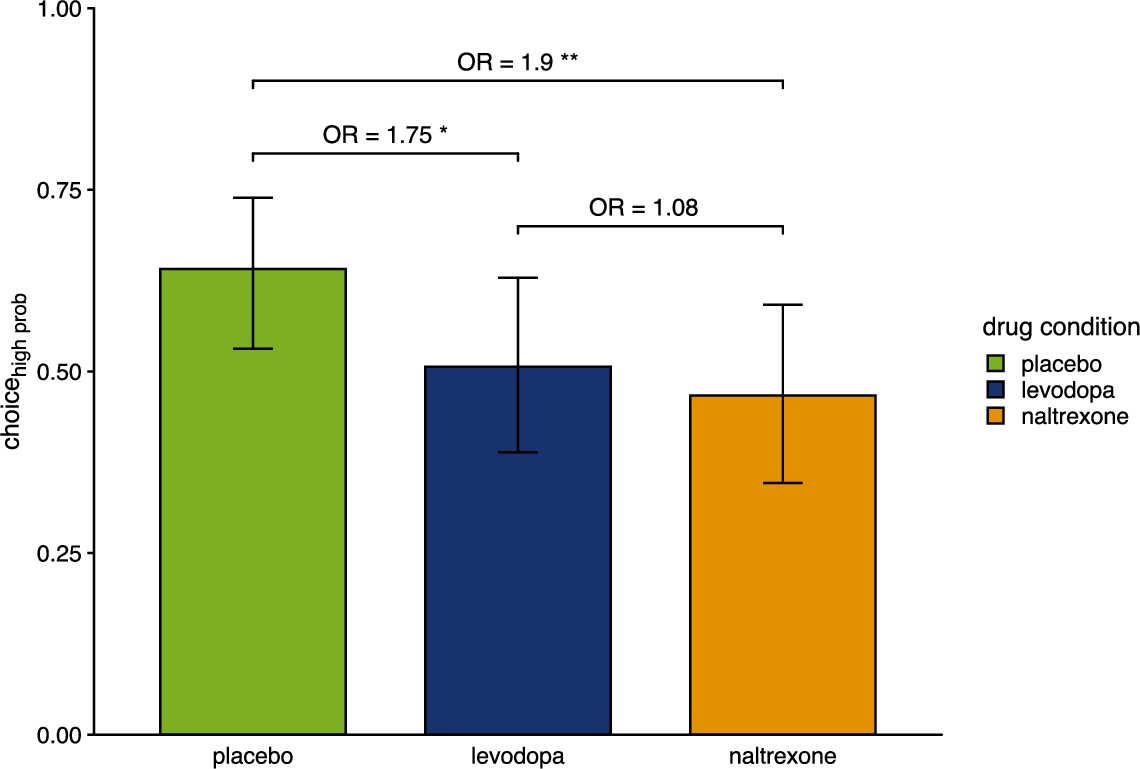
Proportion of choices of the color associated with a higher chance of winning pain relief.
Bars show group level means and error bars show 95% confidence interval of the group level mean (placebo: n=28, levodopa: n=27, naltrexone: n=28). OR indicates odds ratios as effect size of estimated effects between drugs. *p<0.05, ** p<0.01.
Figure 4—figure supplement 1
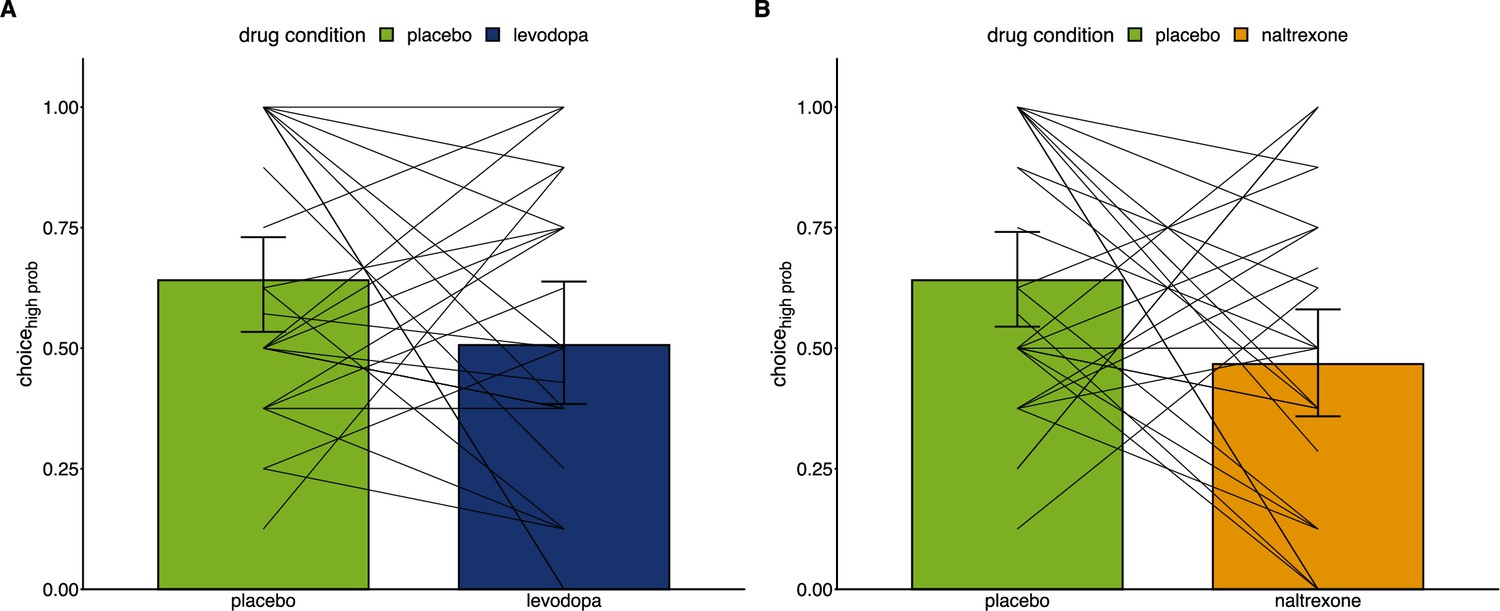
Individual level effects of drug manipulations on choice behavior.
Proportion of choices of the color associated with a higher chance of winning pain relief (placebo: n=28, levodopa: n=27, naltrexone: n=28) comparing the placebo condition to the levodopa condition (A) and to the naltrexone condition (B).
Lines connect individual proportions of choices of the advantageous option between placebo and the respective drug condition.
Figure 5 with 1 supplement
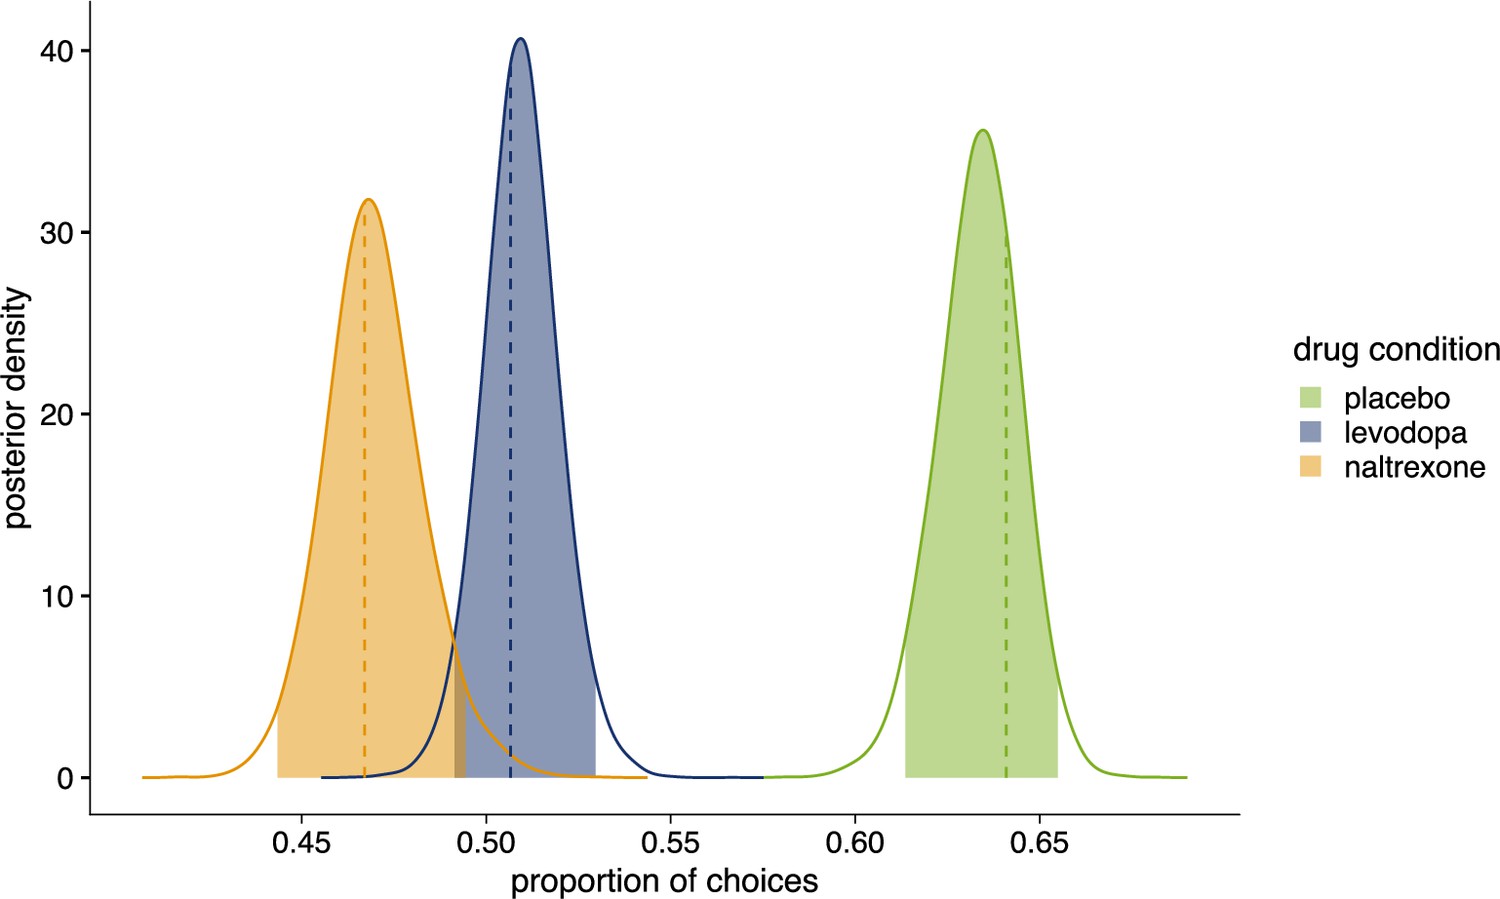
Posterior distributions of the proportion of choices in favor of .
Colored areas show 95% highest density interval (HDI95). Dashed lines indicate observed proportion of choices in favor of . Placebo (n=28): = 0.641, HDI95 = [0.614,0.655], posterior (p-value (pp)=0.320); levodopa (n=27): = 0.507, HDI95 = [0.491,0.530], p=0.679; naltrexone (n=28): = 0.467, HDI95 = [0.443,0.494], p=0.611. Figure 5—figure supplement 1 shows comparison of drug conditions for each parameter of winning model 4.
Figure 5—figure supplement 1
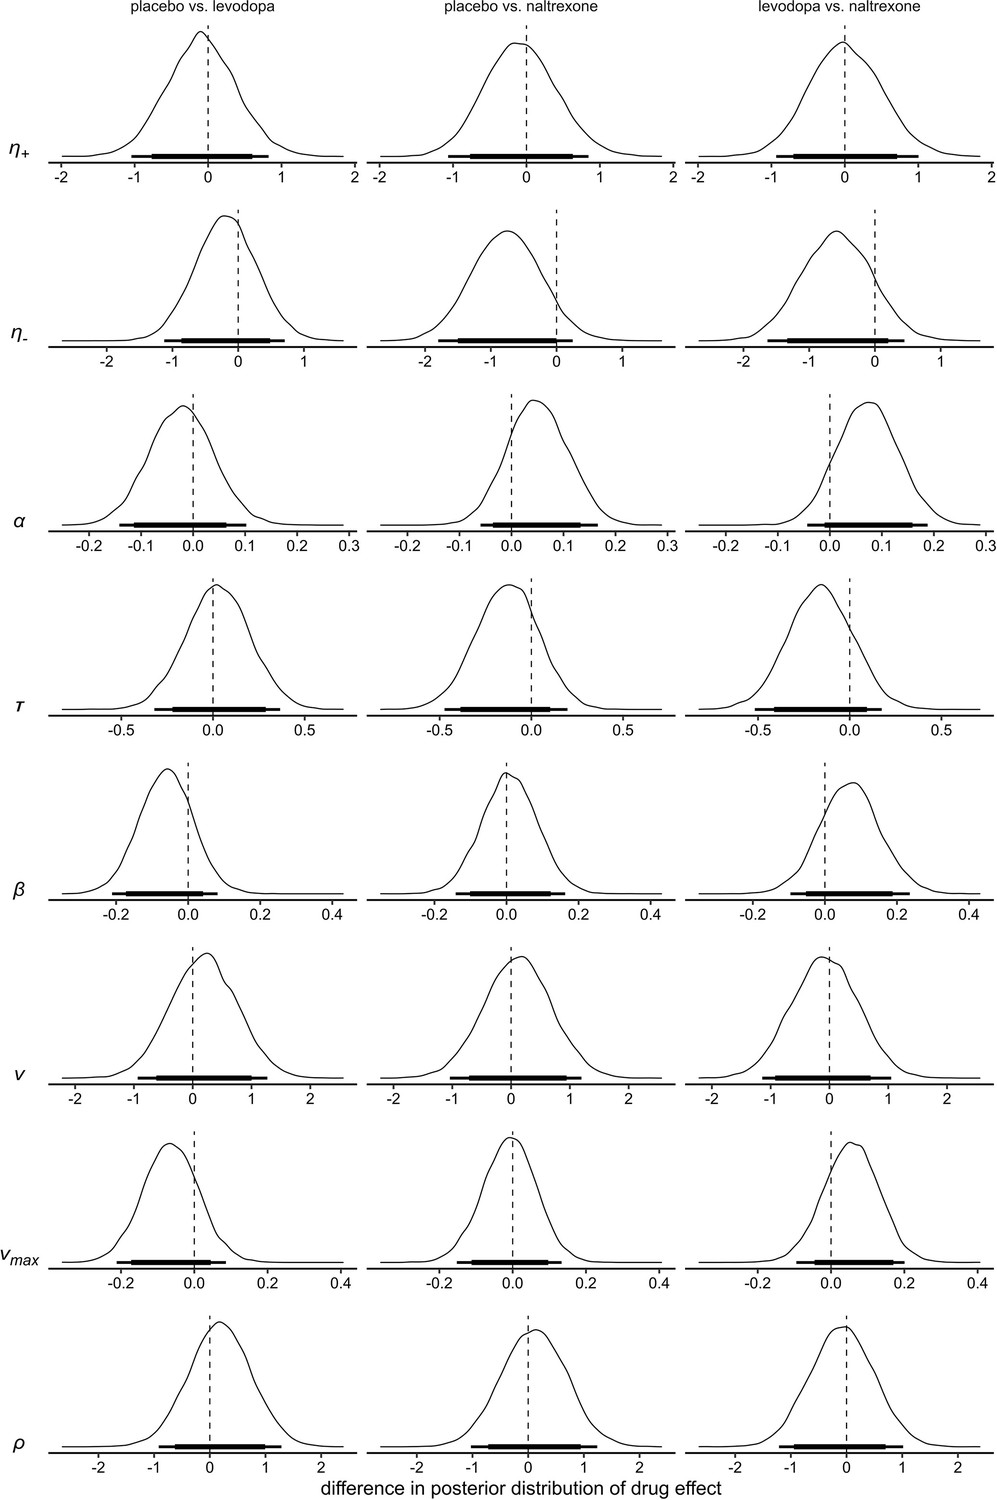
Differences of the posterior distributions of group level parameters for the main effect of drug in model 4.
Thick black bars indicate the 85% HDI, thin bars indicate the 95% HDI. : learning rate for positive prediction errors; : learning rate for negative prediction errors; : boundary separation; : non-decision time; : a-priori bias; : drift-rate scale factor; : drift-rate boundary; : outcome sensitivity.
Figure 6
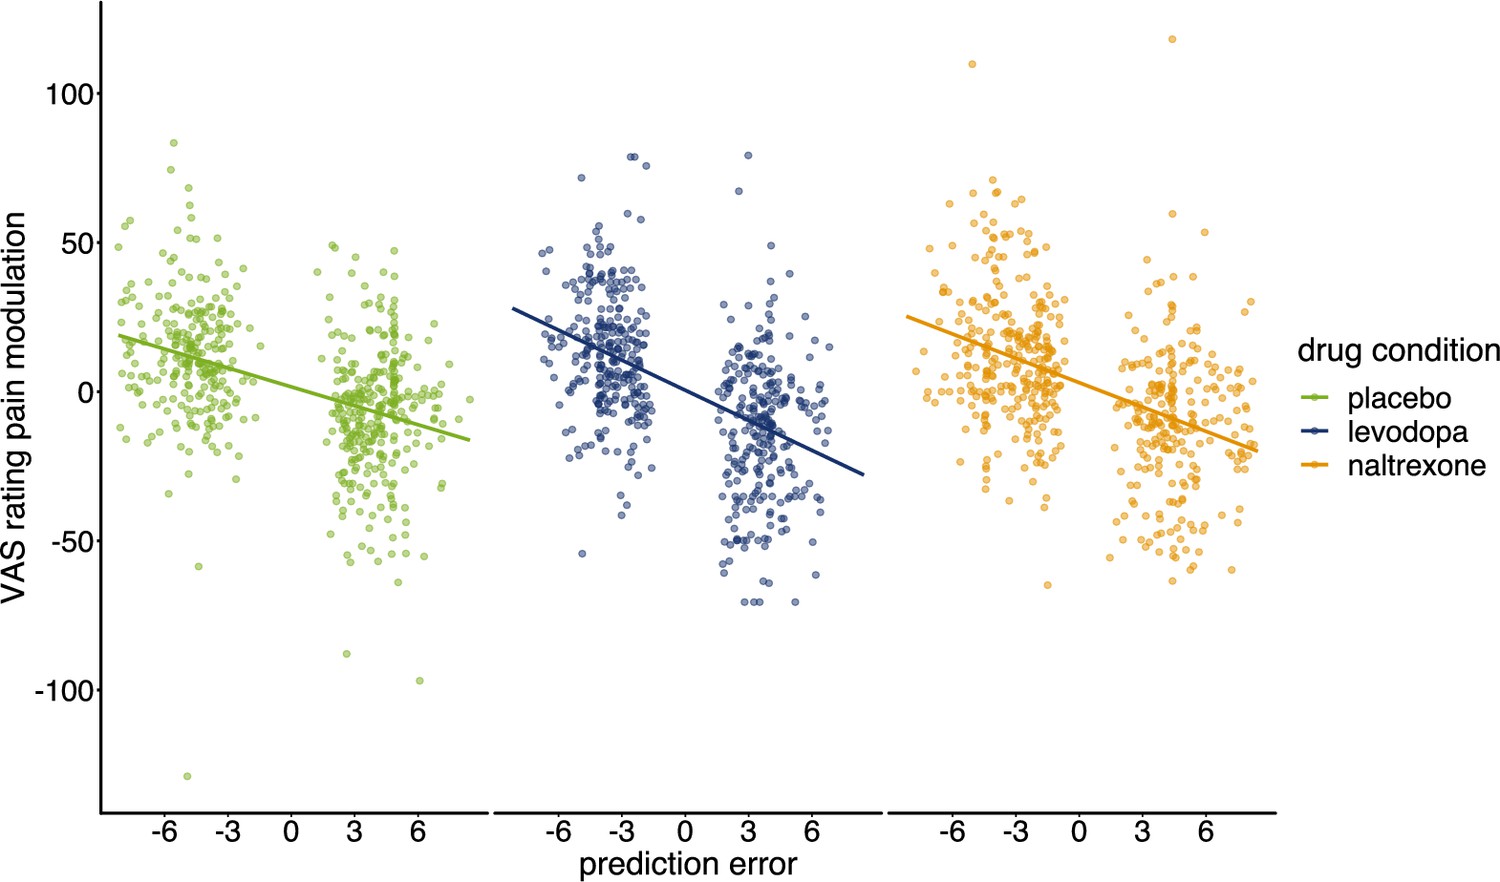
Pain modulation in VAS ratings predicted by prediction errors for each condition.
Regression lines indicate prediction from the mixed effects model with predictors ‘PE’, ‘drug’, and their interaction (placebo: n=28, levodopa: n=27, naltrexone: n=28).
Figure 7
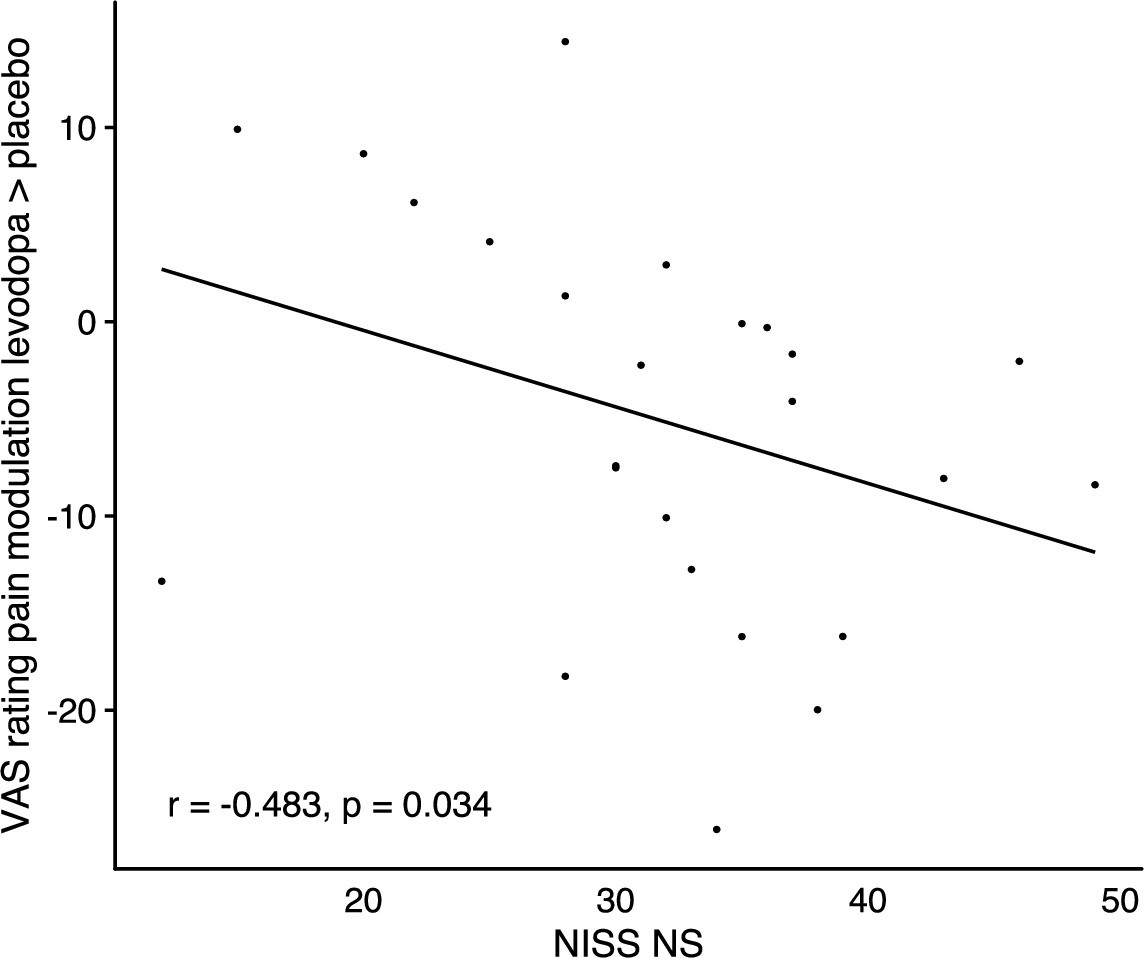
Correlation of changes in endogenous pain modulation induced by winning pain relief under levodopa compared to placebo with individuals’ scores on the ‘need for stimulation’ subscale of the NISS questionnaire, n=24.
Figure 8
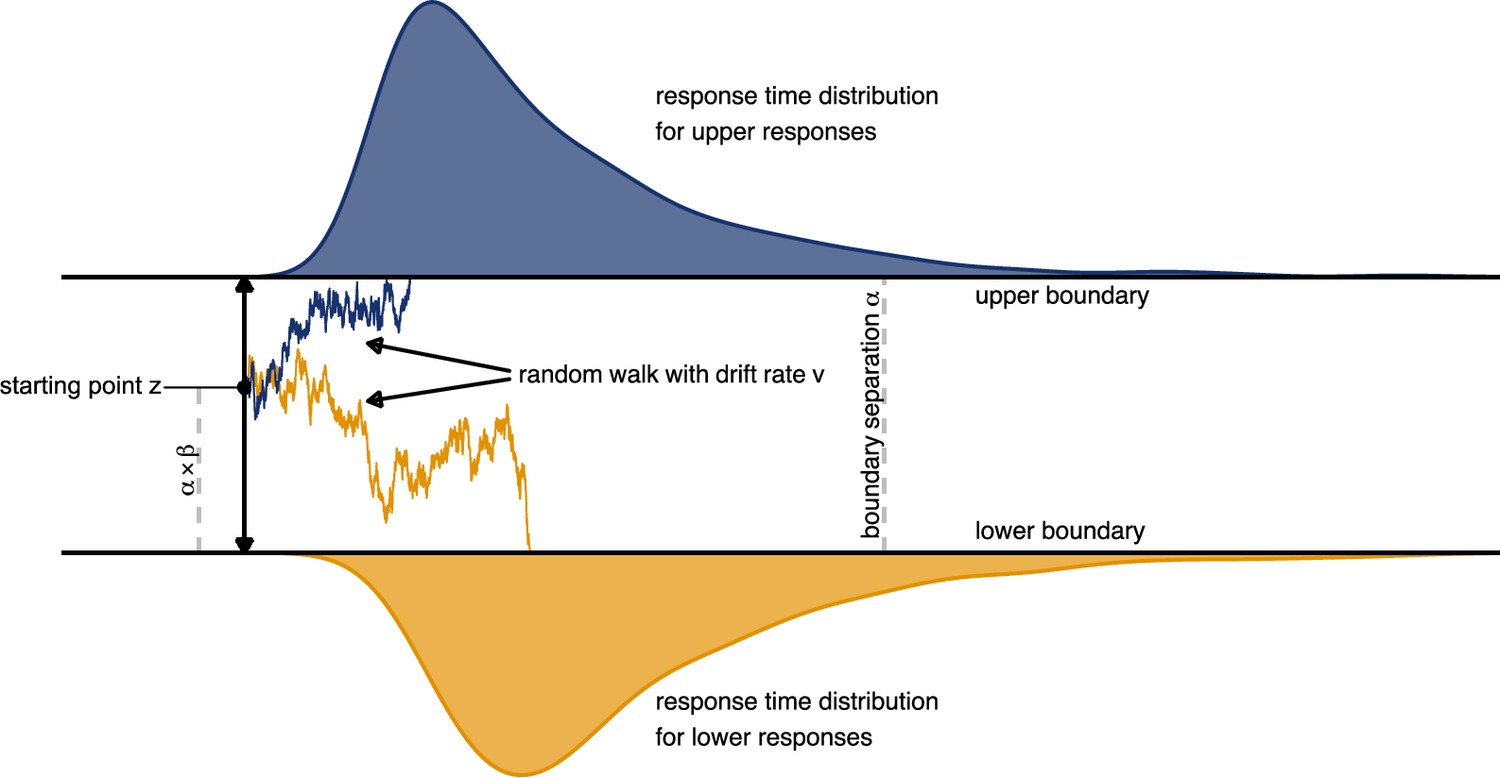
Schematic depiction of the drift diffusion process.
Accumulation of evidence starts at point which is defined by the a-priori bias and the boundary separation . Noisy evidence is integrated over time (represented by sample paths in blue and orange, for upper and lower boundary choices, respectively).
Tables
Table 1
Means and standard deviation of means for pain modulation in VAS ratings of perceived intensity and the behaviorally assessed pain perception (negative values indicate pain inhibition; positive values indicate pain facilitation).
| Pain modulation in VAS ratings of pain intensity | Pain modulation in behavioral measure (°C) | |||||||||||
|---|---|---|---|---|---|---|---|---|---|---|---|---|
| placebo | levodopa | naltrexone | placebo | levodopa | naltrexone | |||||||
| n=28 | n=27 | n=28 | n=28 | n=27 | n=28 | |||||||
| Outcome | M | SD | M | SD | M | SD | M | SD | M | SD | M | SD |
| win | –7.31 | 21.51 | –12.98 | 23.54 | –10.09 | 23.79 | –0.09 | 0.64 | –0.14 | 0.66 | –0.05 | 0.74 |
| lose | 12.21 | 21.12 | 13.29 | 20.48 | 12.26 | 22.27 | 0.03 | 0.59 | 0.03 | 0.54 | 0.06 | 0.68 |
Table 2
Model comparison.
Models are ordered by their expected log pointwise predictive density (ELPD). ELPDdiff: difference to the ELPD of winning model 4. se(ELPDdiff): standard error of the difference in ELPD.
| Model | ELPD | ELPDdiff | se(ELPDdiff) |
|---|---|---|---|
| Model 4 | –837.71 | 0 | 0 |
| Model 3 | –845.44 | –7.73 | 1.51 |
| Model 2 | –997.33 | –159.62 | 15.77 |
| Model 1 | –998.33 | –160.62 | 15.95 |
Table 3
Model specification.
Models 1–4 were defined using different combinations of parameters for reward sensitivity and the mapping of expected values to the drift rate. A ‘static’ reward sensitivity means that pain increase and pain decrease were defined as –1 and 1, respectively (see Equation 4). A ‘scaled’ outcome sensitivity means that pain decrease was defined as and pain decrease as (see Equation 5). A ‘linear’ drift rate mapping means that the drift rate for each trial was defined as the difference of expected values multiplied by (see Equation 7). A sigmoid mapping of the drift rate means that was defined by a sigmoid function bounded at . (see Equation 8 und Equation 9). All models included two learning rates ( , ), the non-decision time , the boundary separation , and the a priori bias .
| Model | Outcome sensitivity | Drift rate mapping |
|---|---|---|
| Model 1 | static | linear |
| Model 2 | scaled | linear |
| Model 3 | static | sigmoid |
| Model 4 | scaled | sigmoid |
Additional files
Download links
A two-part list of links to download the article, or parts of the article, in various formats.
Downloads (link to download the article as PDF)
Open citations (links to open the citations from this article in various online reference manager services)
Cite this article (links to download the citations from this article in formats compatible with various reference manager tools)
Evidence for dopaminergic involvement in endogenous modulation of pain relief
eLife 12:e81436.
https://doi.org/10.7554/eLife.81436


