A task-general connectivity model reveals variation in convergence of cortical inputs to functional regions of the cerebellum
- Department of Psychology, University of California, Berkeley, United States
- Western Institute for Neuroscience, Western University, Canada
- Helen Wills Neuroscience Institute, University of California, Berkeley, United States
- Department of Statistical and Actuarial Sciences, Western University, Canada
- Department of Computer Science, Western University, London, Canada
Figures
Figure 1
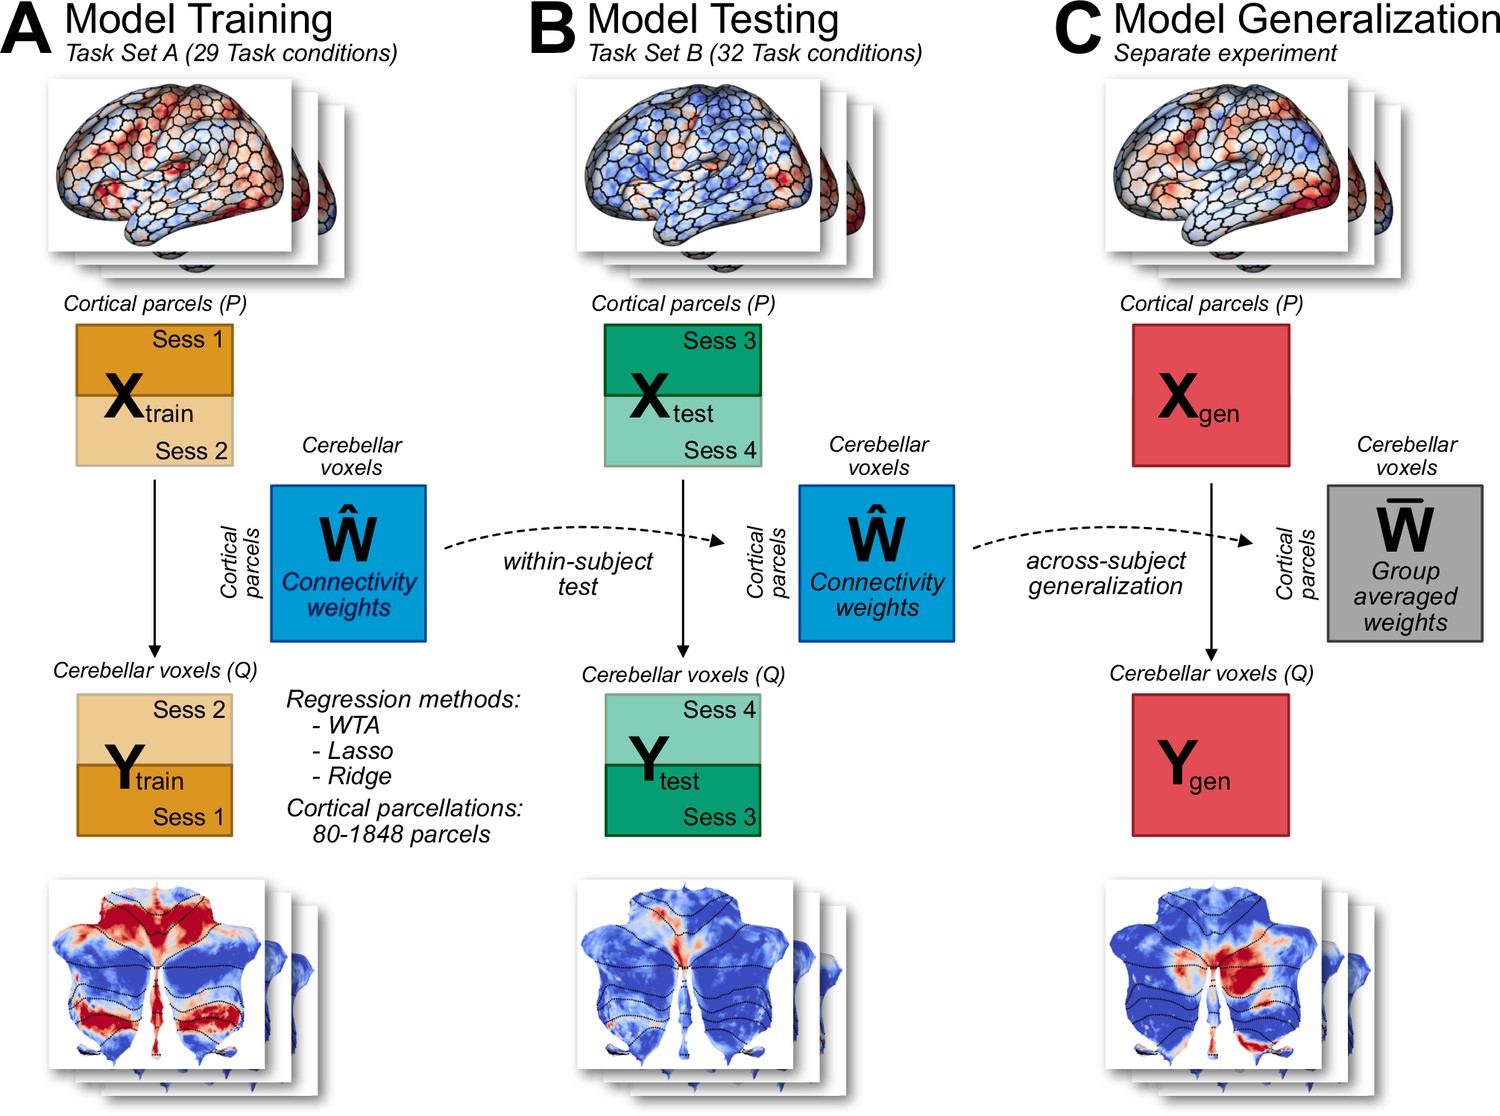
Connectivity model training and evaluation.
(A) Models were trained on Task Set A (session 1 and 2) of the multi-domain task battery (MDTB; King et al., 2019). Model hyperparameters were tuned using fourfold cross validation. Three types of models were used (WTA, Lasso, Ridge), each with 7 cortical parcellations of different granularity. (B) Models were tested on an independent Task Set B (sessions 3 and 4), which included both novel and common tasks. Models had to predict the cerebellar activity solely from cortical activity patterns. To avoid the influence of shared noise correlations across cortex and cerebellum, the models were trained and tested by using cortical and cerebellar activity patterns from different sessions within each task set (see Methods). (C) As a test of generalization, the models were used to predict cerebellar activity from cortical data obtained from a separate experiment (King et al., unpublished data).
Figure 2 with 4 supplements
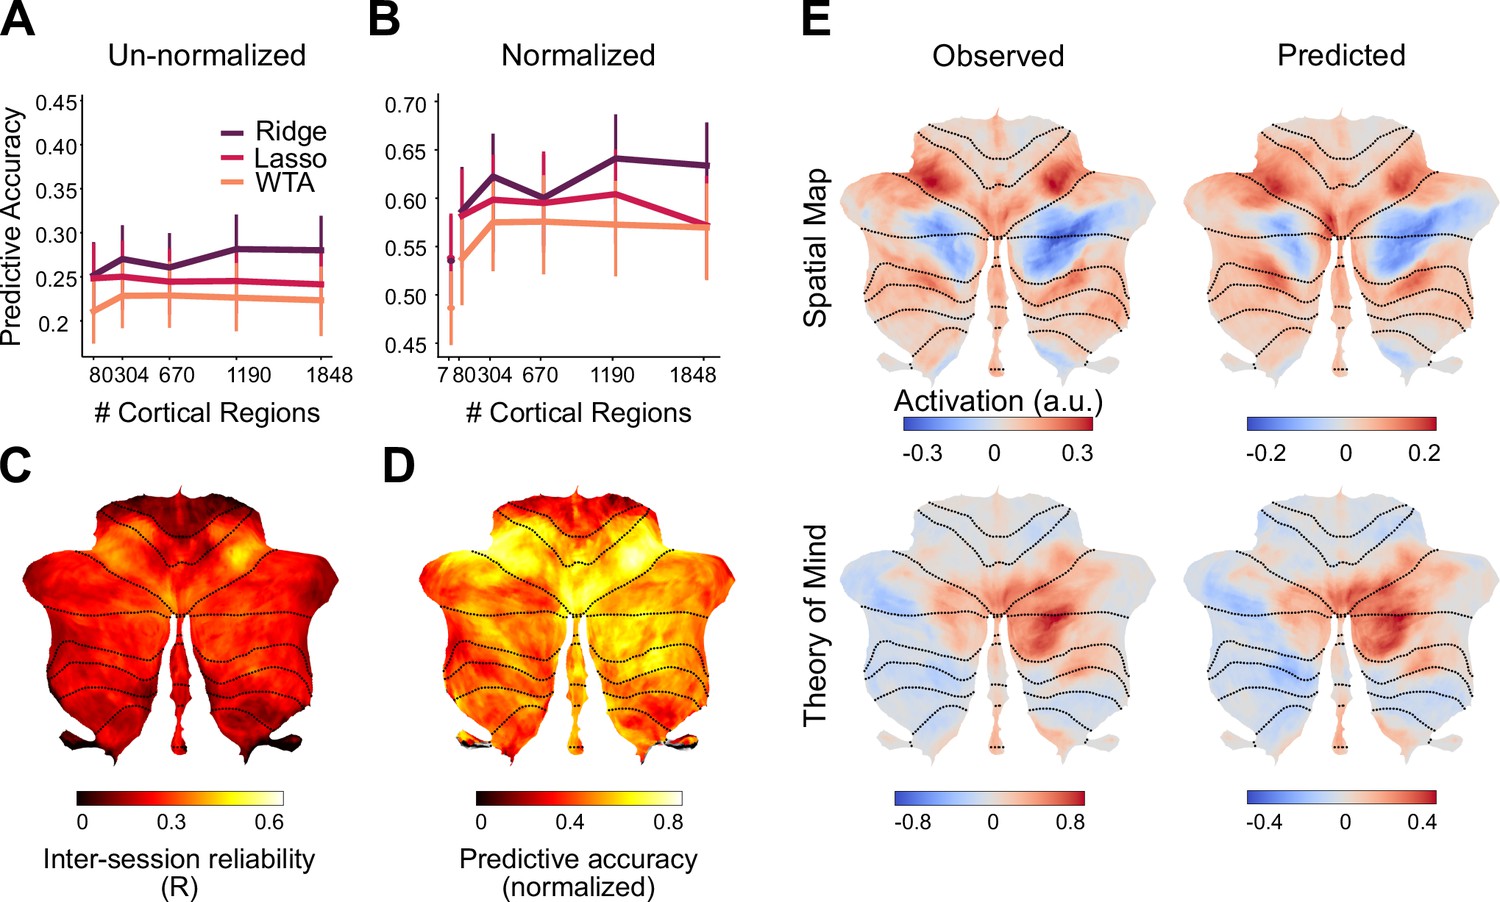
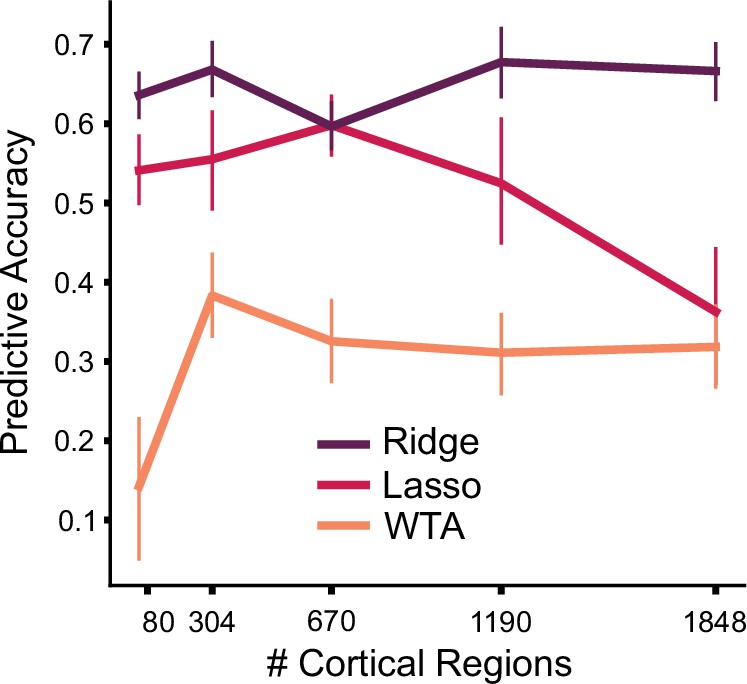
Performance of cortico-cerebellar connectivity models.
(A) Predictive accuracy (Pearson correlation) of the Ridge, Lasso, and WTA regression models for the test data of Task Set B (B) Predictive accuracy normalized to the noise ceiling based on reliability of both cerebellar and cortical data (see Methods). Source data files are available for panels A and B (‘model_evaluation.csv’) (C) Voxelwise map of inter-session reliability of the test data. (D) Voxelwise map of predictive accuracy of the Ridge model (1848 parcels), normalized to the noise ceiling. (E) Observed and predicted activity for a novel task involving spatial working memory (Spatial Map) and a social cognition task (Theory of Mind). The spatial map task was not included in Task Set A. Error bars indicate 95% confidence intervals across participants (n=24).
-
Figure 2—source data 1
Source data file contains model evaluation predictive accuracies for each of the three methods (Ridge, Lasso, Winner-Take-All), and for each parcellation (80-1848).
- https://cdn.elifesciences.org/articles/81511/elife-81511-fig2-data1-v1.csv
Figure 2—figure supplement 1
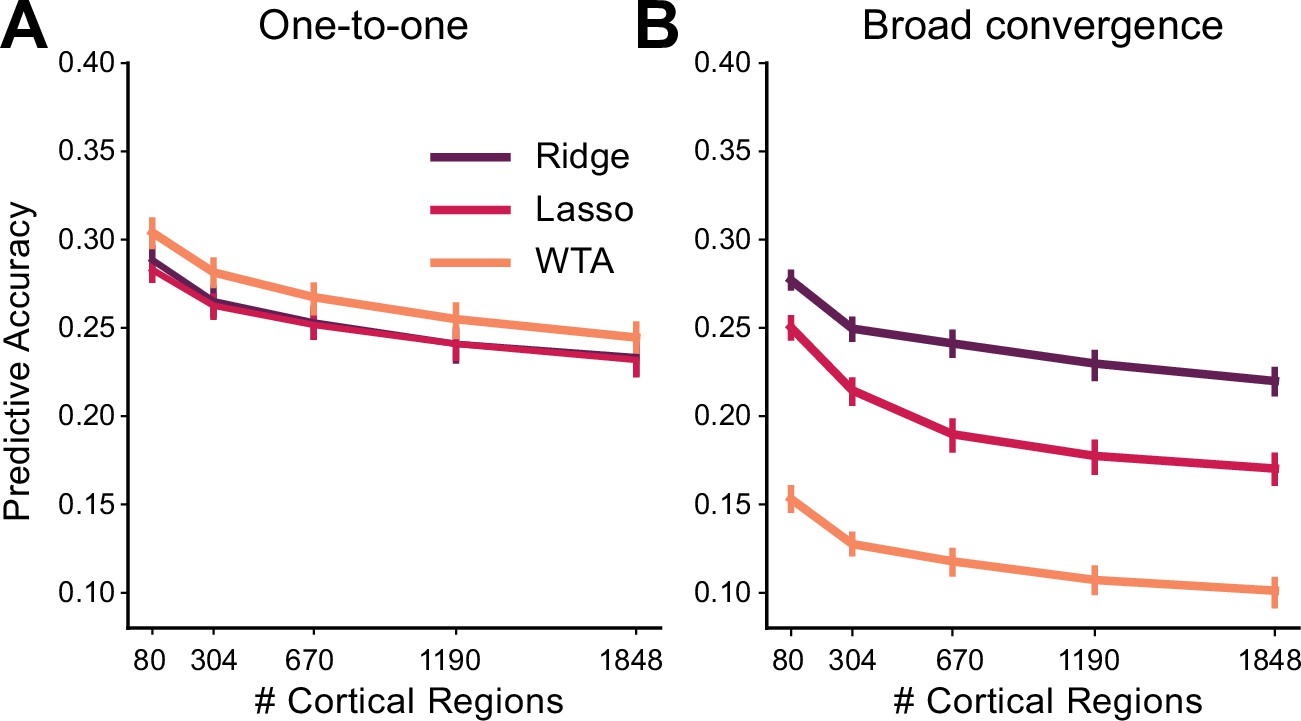
Model recovery simulations demonstrate the ability to identify different forms of cortico-cerebellar connectivity.
Predictive accuracy for Ridge, Lasso, and WTA models trained and tested on simulated data generated using (A) one-to-one connectivity with each cerebellar voxel connected only to one randomly selected cortical region (B) broad convergence with connectivity weights being drawn from a Gaussian distribution. Data were simulated using the observed cortical activity for Task Set A and B for training and test data, respectively (see Methods for details). As expected, the WTA model provided the best prediction for the one-to-one architecture and the Ridge model provided the best prediction for the convergent architecture. Error bars indicate 95% confidence intervals across simulations.
Figure 2—figure supplement 2
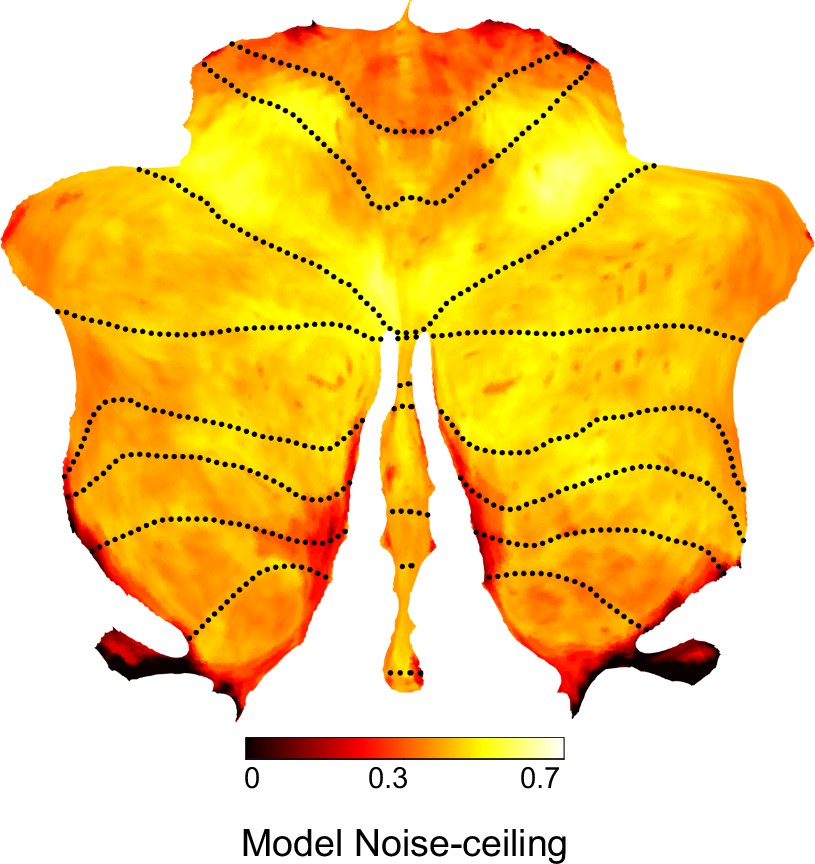
Noise ceiling for Ridge model.
Expected predictive accuracy assuming that the fitted Ridge model (1848 parcels) reflects the true cortico-cerebellar connectivity. The noise ceiling takes into account the reliability of the cerebellar data, as well as the reliability of the prediction based on the measured cortical data.
Figure 2—figure supplement 3
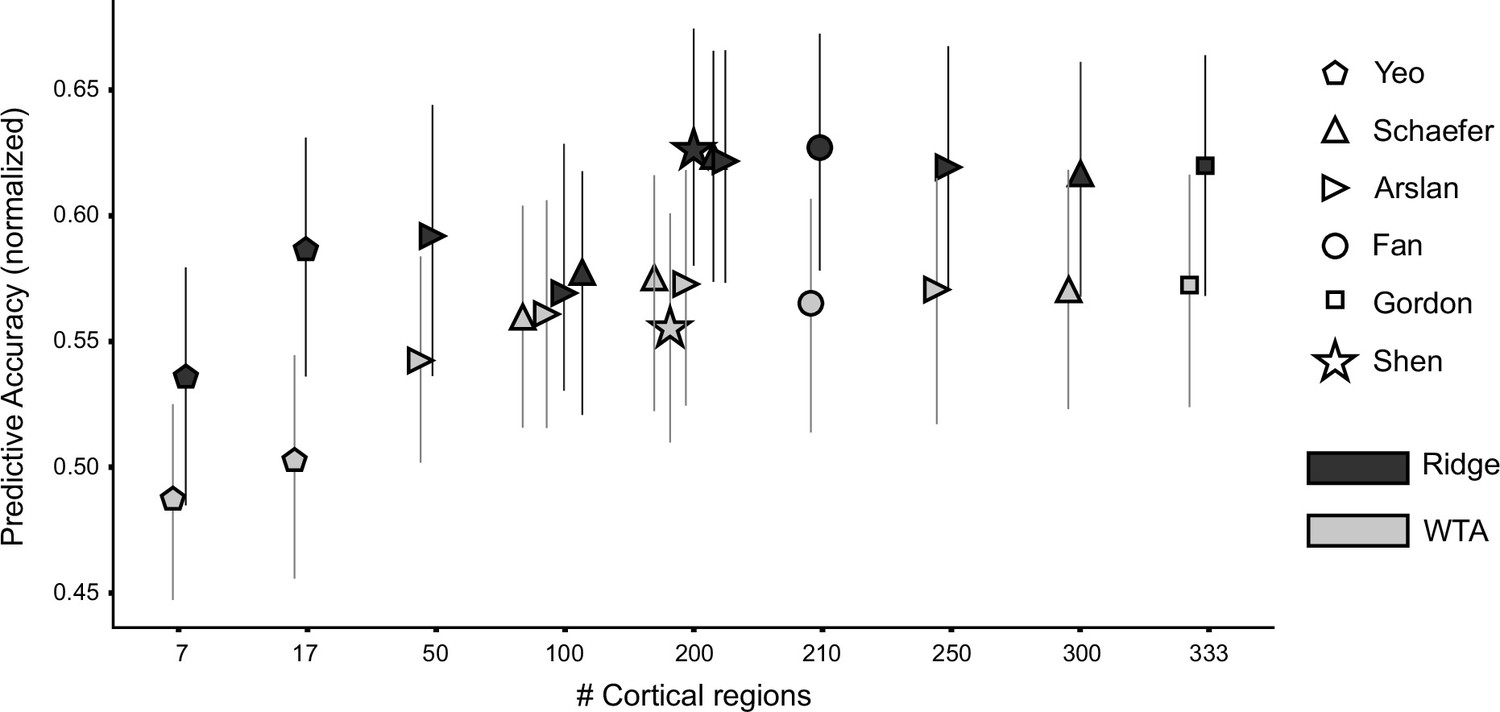
Predictive accuracy for Ridge and WTA models using functional cortical parcellations.
[(Yeo et al., 2011), (Schaefer et al., 2018), (Arslan et al., 2015), (Fan et al., 2016), (Gordon et al., 2016), (Shen et al., 2013), denoted by first author]. Predictive performance is normalized to the noise ceiling. The number of cortical parcels varied from 7 to 330 regions. Error bars indicate 95% confidence intervals across participants (n=24). All evaluated parcellations are available at https://github.com/DiedrichsenLab/fs_LR_32 (Zhi et al., 2021).
Figure 2—figure supplement 4
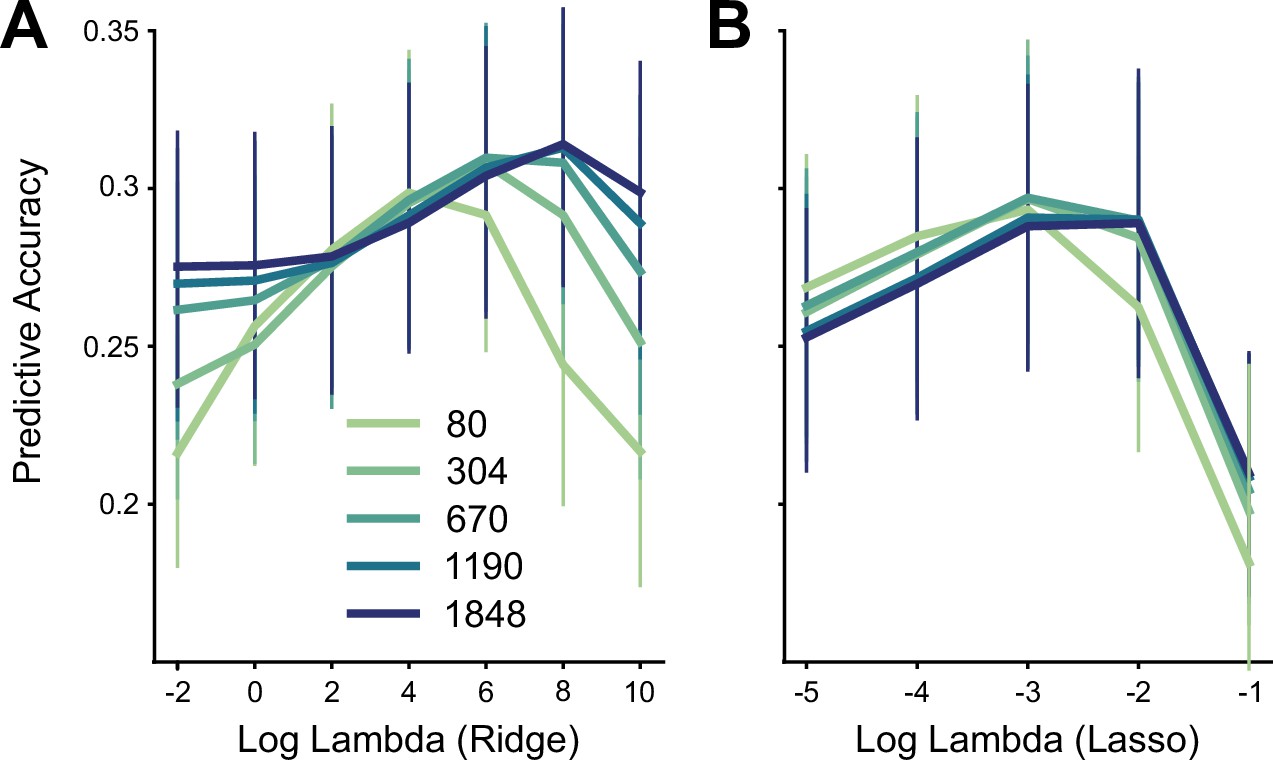
Hyper-parameter tuning for connectivity models.
Predictive accuracy for Ridge (A) and Lasso (B) models using different regularization coefficients (log-lambda values) across five levels of granularity, and cross-validated over 4 folds of the training data. The WTA model did not use a hyper-parameter. Source data files are available for panels A (‘model_training_ridge.csv’) and B (‘model_training_lasso.csv’). Error bars indicate 95% confidence intervals across participants (n=24).
-
Figure 2—figure supplement 4—source data 1
Source data file contains predictive accuracies for each hyperparameter (-2, 0, 2, 4, 6, 8, 10) of the Lasso model, and for each parcellation (80-1848).
- https://cdn.elifesciences.org/articles/81511/elife-81511-fig2-figsupp4-data1-v1.csv
-
Figure 2—figure supplement 4—source data 2
Source data file contains predictive accuracies for each hyperparameter (-5, -4, -3, -2, -1) of the Ridge model, and for each parcellation (80-1848).
- https://cdn.elifesciences.org/articles/81511/elife-81511-fig2-figsupp4-data2-v1.csv
Figure 3 with 3 supplements
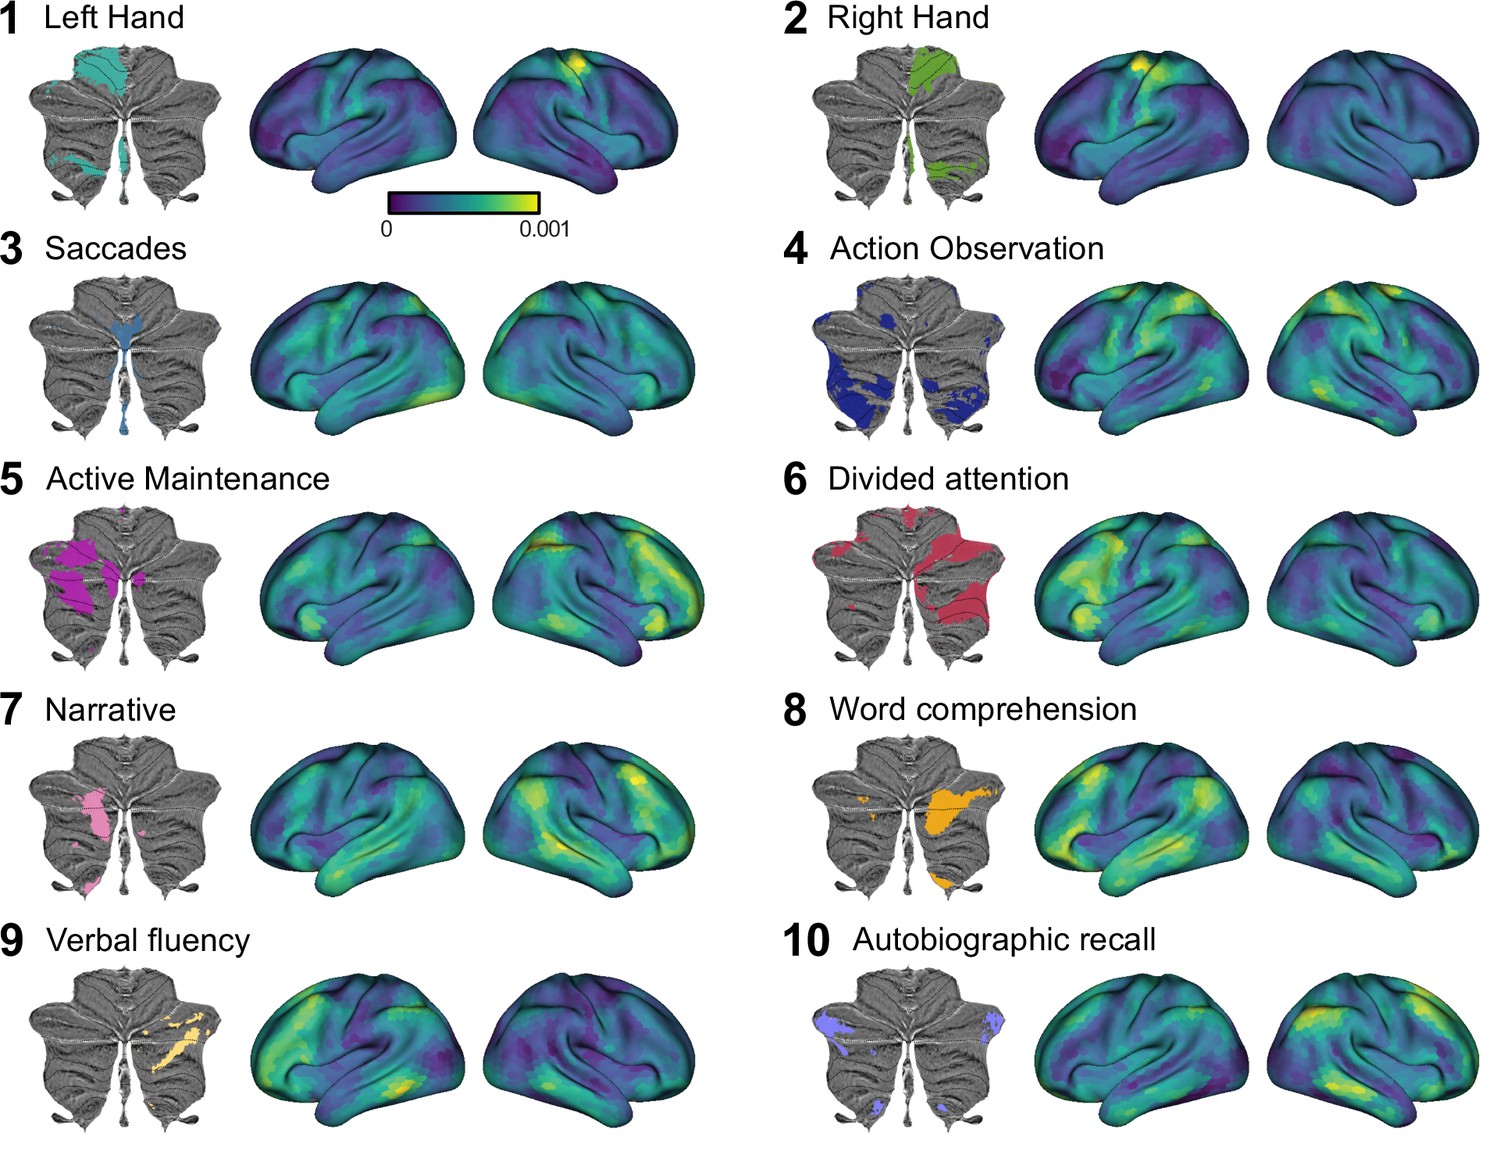
Cortical connectivity weight maps for the Ridge regression model with 1848 cortical parcels for each of 10 functional cerebellar regions.
Each region is denoted by the most important functional term (King et al., 2019). Results are averaged across participants. Regression weights are in arbitrary units. See Figure 3—animation 1 for a gif of the connectivity weight maps, and see Figure 3—figure supplement 1 for the corresponding analysis using Lasso regression. Figure 3 has been adapted from Figure 5 from King et al., 2019.
Figure 3—figure supplement 1
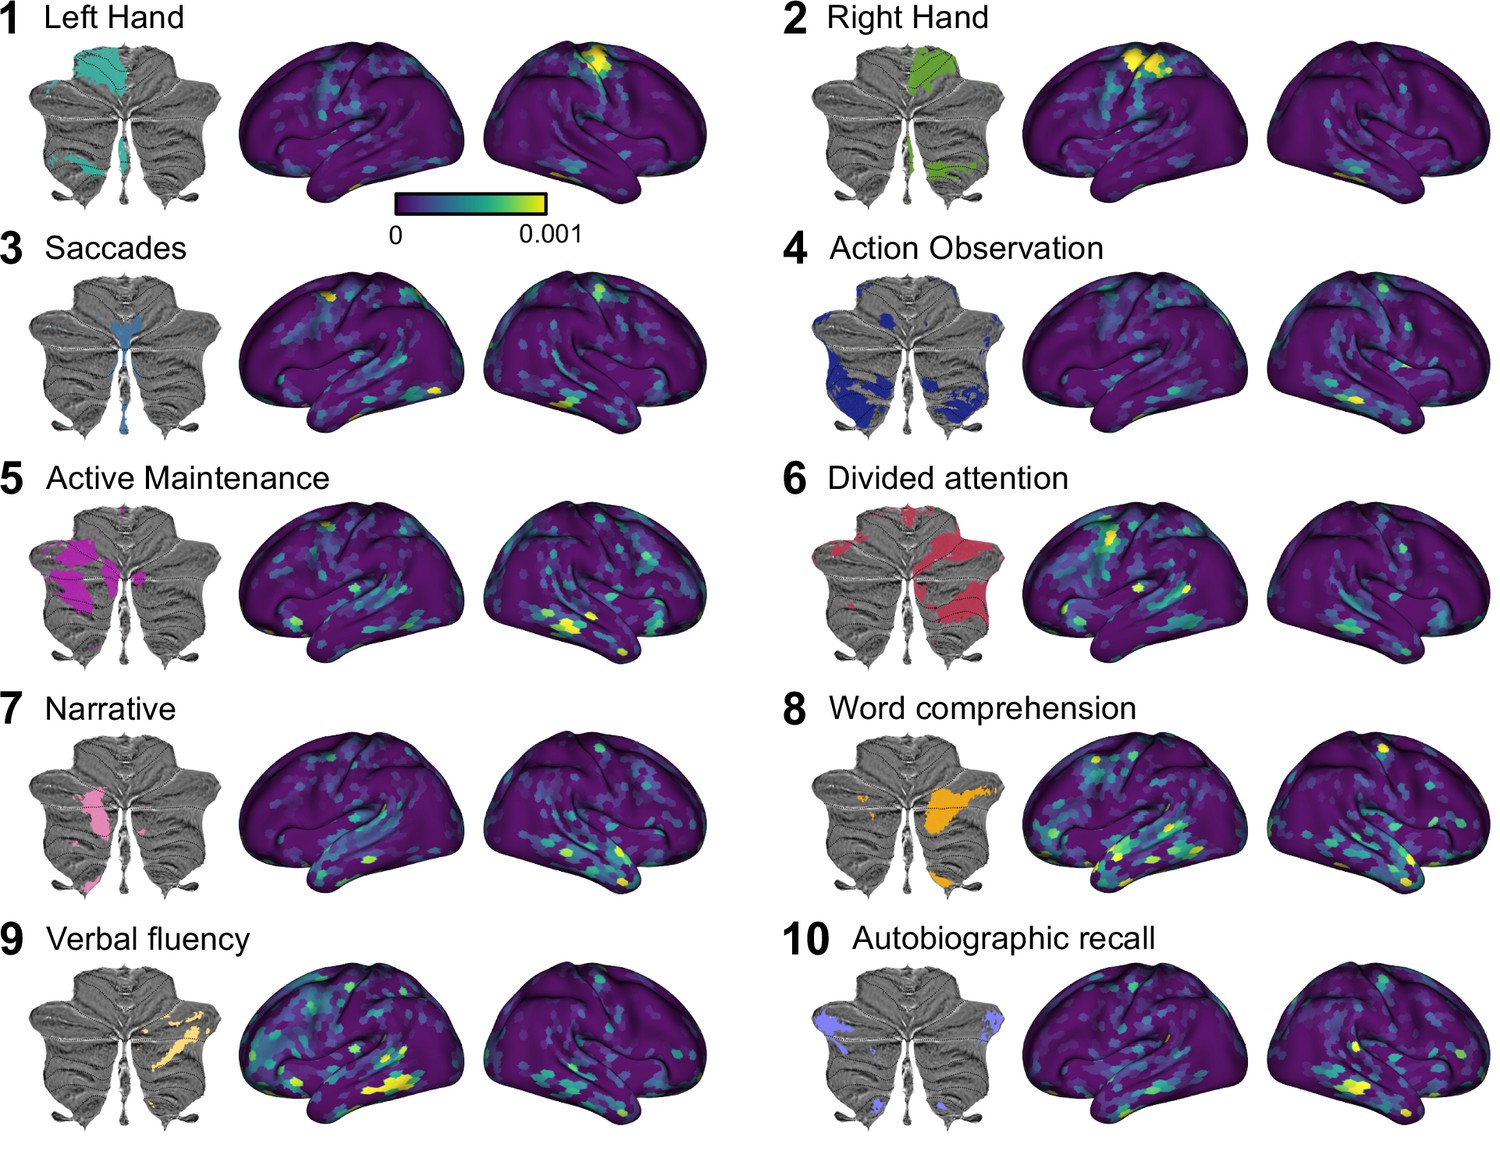
Cortical connectivity weight maps for the Lasso model with 1848 cortical regions.
As in Figure 4, the results are averaged across individuals for each of the 10 functional regions defined on the MDTB data set, with each region denoted by the most important functional term. Results are averaged across participants and voxels within each cerebellar region. Regression weights are in arbitrary units. See Figure 3—animation 2 for a gif of the connectivity weight maps.
Figure 3—animation 1
Animated cortico-cerebellar connectivity maps for the Ridge regression model.
Figure 3—animation 2
Animated cortico-cerebellar connectivity maps for the Lasso regression model.
Figure 4 with 2 supplements
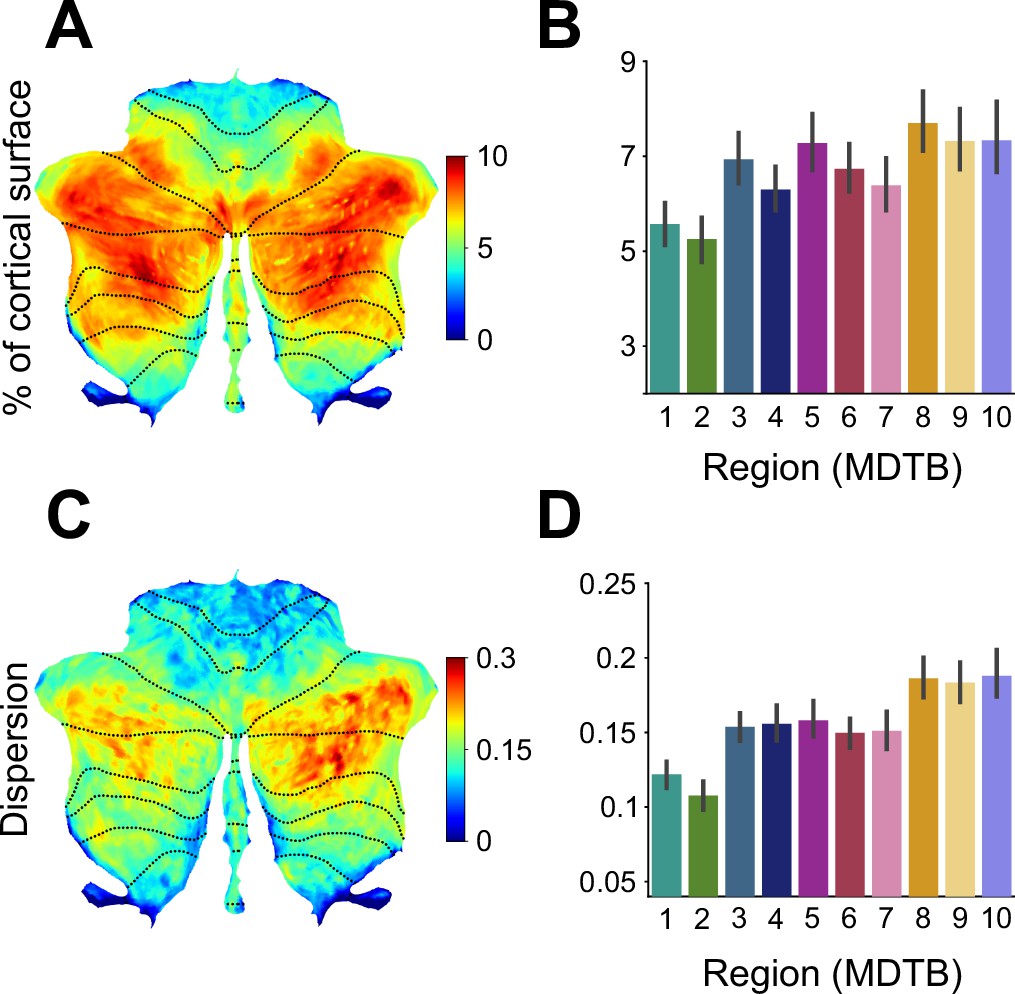
Cortico-cerebellar convergence measures using the Lasso model.
(A) Map of the cerebellum showing percentage of cortical parcels with non-zero weights for the Lasso model (n=80 parcels). (B) Percentage of parcels with non-zero weights for functional subregions of the cerebellum. (C) Spherical dispersion of the connectivity weights on the cortical surface for each cerebellar voxel. (D) Average cortical dispersion for each functional subregion of the cerebellum. Error bars indicate standard error of the mean across participants. See Figure 4—figure supplement 1 for the same results using Ridge regression. Error bars indicate 95% confidence intervals across participants (n=24).
Figure 4—figure supplement 1

Cortico-cerebellar convergence measures using the Ridge model.
(A) Map of the cerebellum showing percentage of cortical parcels with coefficients for the Ridge model (n=80 parcels) above threshold (see Methods). (B) Percentage of parcels with weights above threshold for functional subregions of the cerebellum. (C) Spherical dispersion of the connectivity weights on the cortical surface for each cerebellar voxel. (D) Average cortical dispersion for each functional subregion of the cerebellum. Error bars indicate standard error of the mean across participants. Error bars indicate 95% confidence intervals across participants (n=24).
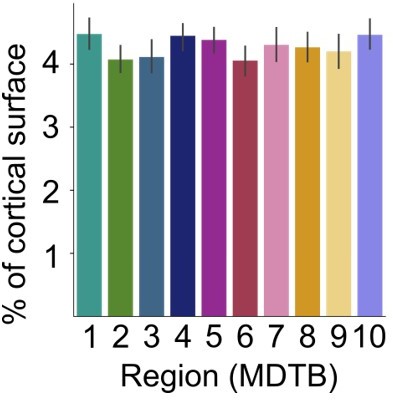
Figure 4—figure supplement 2
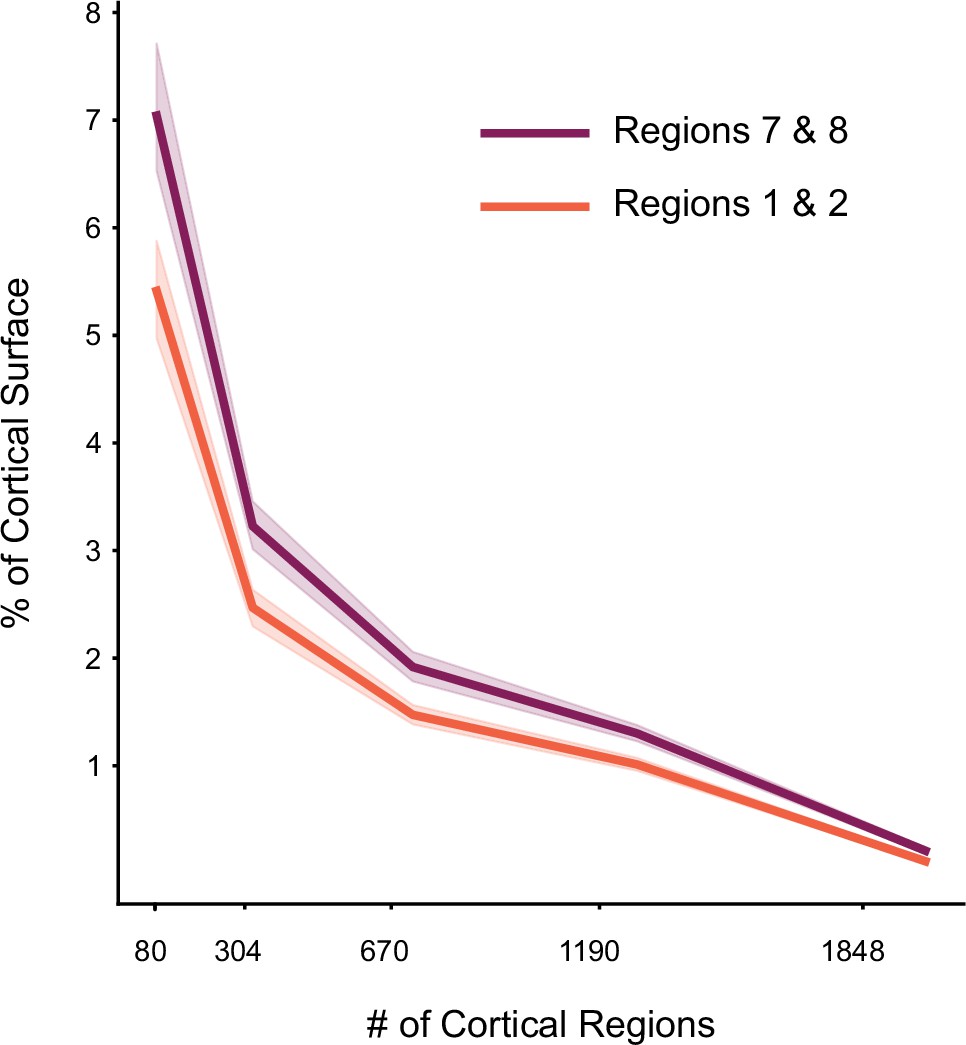
Percentage of cortical surface across levels of granularity for Lasso regression model.
Calculation is performed as in Figure 3B. The results are averaged across the two hand regions of the cerebellum (MDTB functional parcellation, regions 1 and 2), and regions related to narrative and word comprehension (regions 7 and 8). Error bars indicate 95% confidence intervals across participants (n=24).
Figure 5
Generalization to new dataset.
Models of cortico-cerebellar connectivity are tested in a new experiment. Each model is tested across different levels of cortical granularity. Predictive accuracy is the Pearson correlation between observed and predicted activity patterns, normalized to the noise ceiling. Error bars indicate 95% confidence intervals across participants (n=20).
Author response image 1
Author response image 2
Additional files
Download links
A two-part list of links to download the article, or parts of the article, in various formats.
Downloads (link to download the article as PDF)
Open citations (links to open the citations from this article in various online reference manager services)
Cite this article (links to download the citations from this article in formats compatible with various reference manager tools)
A task-general connectivity model reveals variation in convergence of cortical inputs to functional regions of the cerebellum
eLife 12:e81511.
https://doi.org/10.7554/eLife.81511


