Participation in the nationwide cervical cancer screening programme in Denmark during the COVID-19 pandemic: An observational study
- The Danish Clinical Quality Program - National Clinical Registries, Denmark
- Department of Pathology, Lillebaelt Hospital, Denmark
- Department of Regional Health Research, University of Southern Denmark, Denmark
- University Research Clinic for Cancer Screening, Department of Public Health Programmes,Randers Regional Hospital, Denmark
- Department of Clinical Medicine, Aarhus University, Denmark
Figures
Figure 1
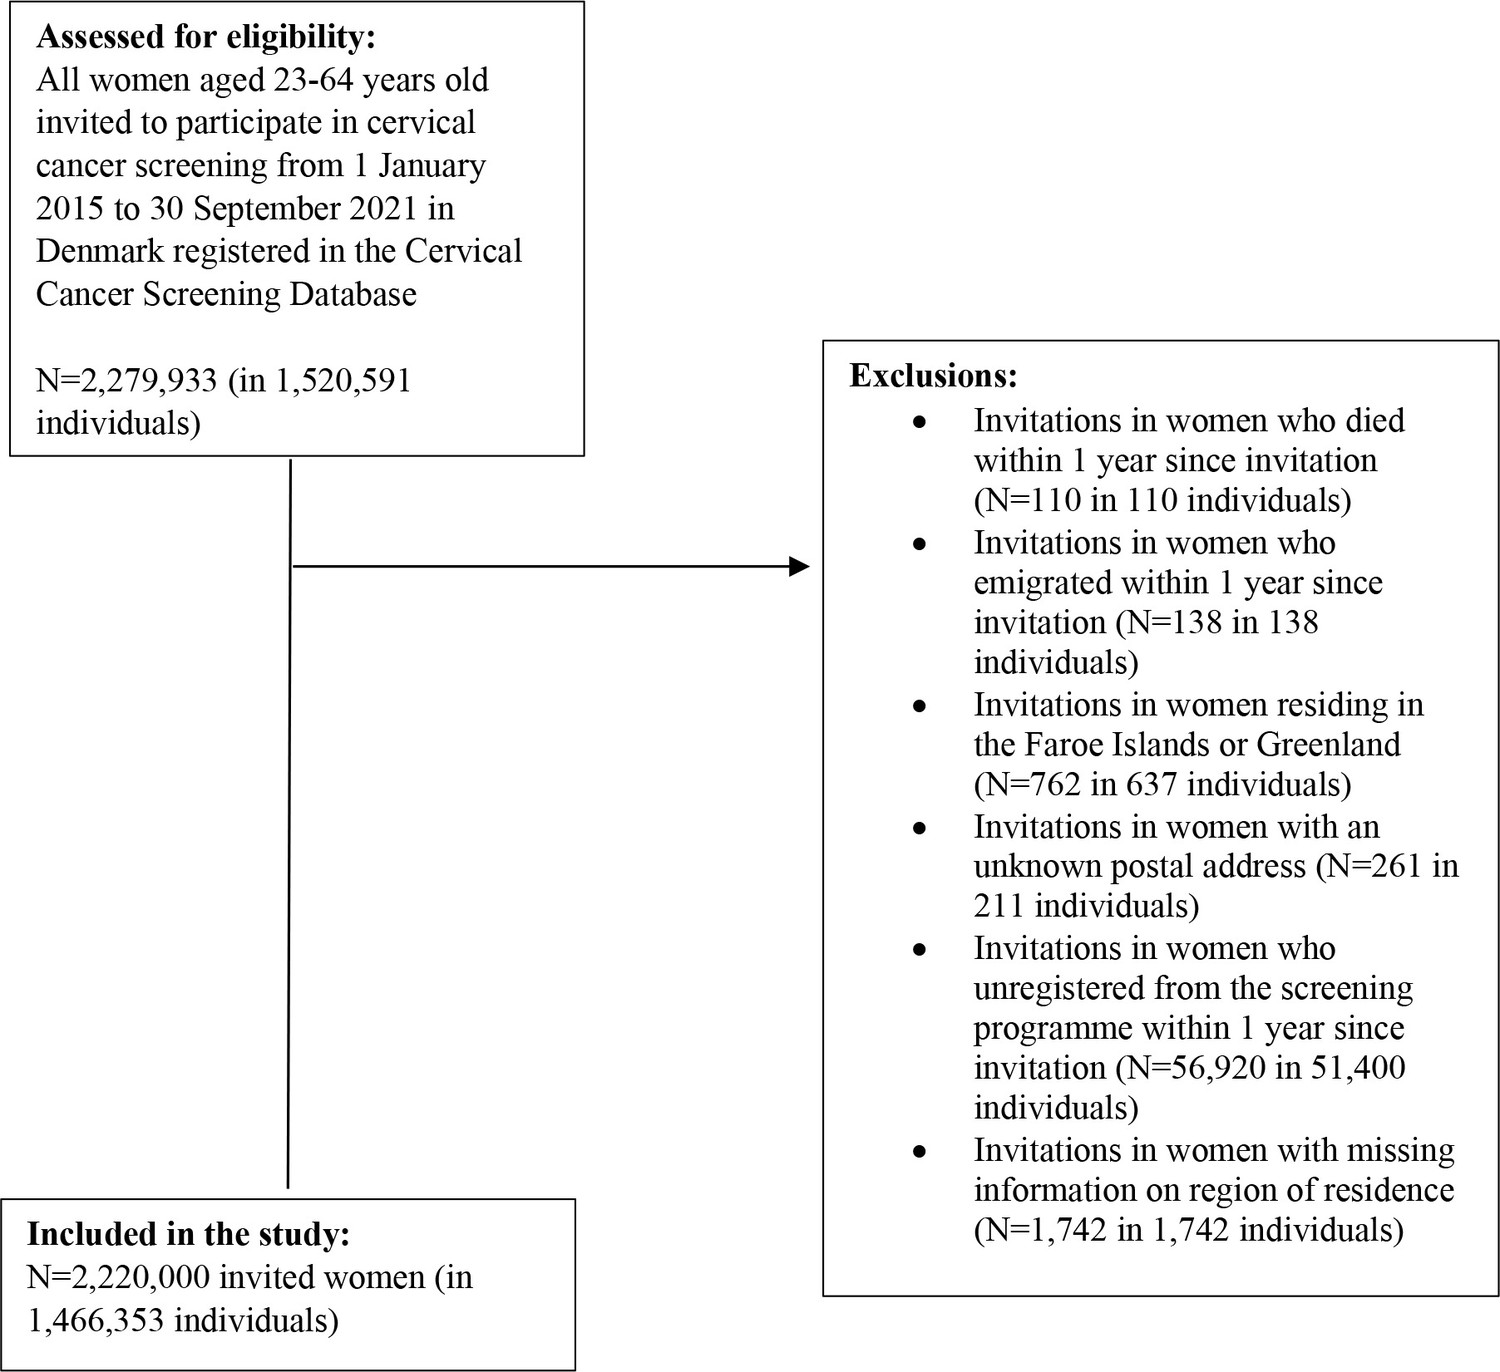
Flow-chart of the study population.
Figure 2
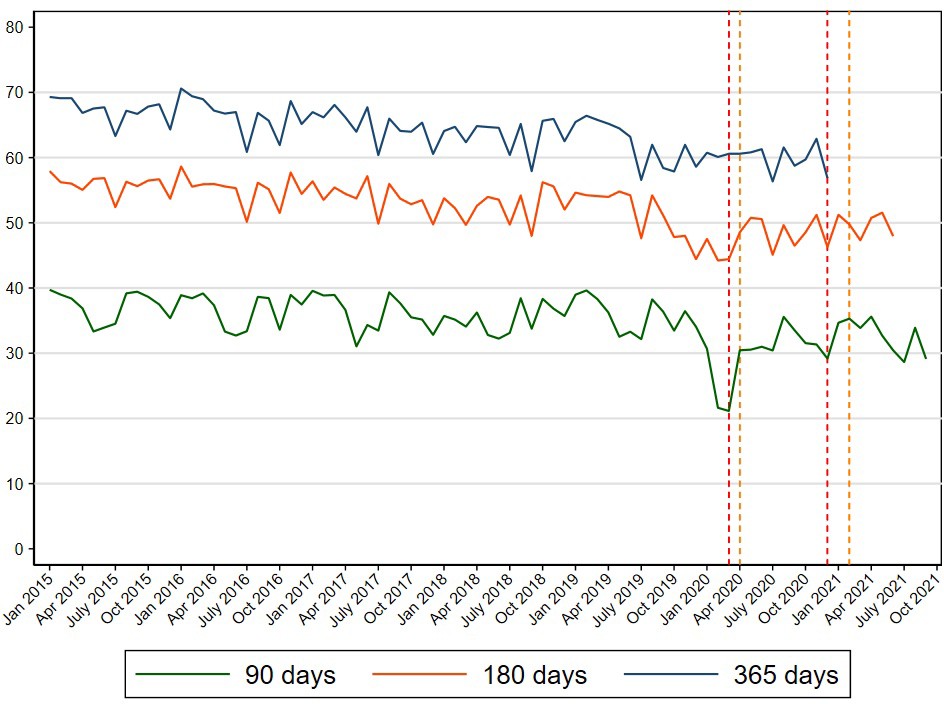
Participation in cervical cancer screening in Denmark within 90, 180, and 365 d since invitation from 2015 to 2021.
Tables
Table 1
Baseline characteristics of women invited to participate in cervical cancer screening in Denmark from 2015 to 2021.
| Pre-pandemic(01 January 2015–31 January 2020) | Pre-lockdown(01 February 2020–10 March 2020) | First lockdown(11 March 2020–15 April 2020) | First re-opening(16 April 2020–15 December 2020) | Second lockdown(16 December 2020–27 February 2021) | Second re-opening(28 February 2021–30 September 2021) | Total | |
|---|---|---|---|---|---|---|---|
| N (%) | N (%) | N (%) | N (%) | N (%) | N (%) | N (%) | |
| Total | 1,641,199 (73.9) | 41,876 (1.9) | 31,255 (1.4) | 223,386 (10.1) | 69,729 (3.1) | 212,555 (9.6) | 2,220,000 (100.0) |
| Age at invitation | |||||||
| 23–29 y | 384,272 (23.4) | 10,223 (24.4) | 7731 (24.7) | 58,569 (26.2) | 17,624 (25.3) | 56,816 (26.7) | 535,235 (24.1) |
| 30–39 y | 412,249 (25.1) | 10,614 (25.3) | 7712 (24.7) | 56,783 (25.4) | 17,571 (25.2) | 54,367 (25.6) | 559,296 (25.2) |
| 40–49 y | 495,153 (30.2) | 12,690 (30.3) | 9233 (29.5) | 63,872 (28.6) | 19,051 (27.3) | 59,366 (27.9) | 659,365 (29.7) |
| 50–59 y | 246,814 (15.0) | 6665 (15.9) | 5269 (16.9) | 34,841 (15.6) | 11,810 (16.9) | 31,387 (14.8) | 336,786 (15.2) |
| 60–64 y | 102,711 (6.3) | 1684 (4.0) | 1310 (4.2) | 9321 (4.2) | 3673 (5.3) | 10,619 (5.0) | 129,318 (5.8) |
| Median (IQI) | 41 (31; 49) | 40 (30; 48) | 40 (30; 49) | 39 (30; 48) | 40 (30; 49) | 39 (30; 48) | 40 (30; 49) |
| Ethnicity | |||||||
| Danish descent | 1,358,106 (82.8) | 33,975 (81.2) | 25,778 (82.5) | 177,501 (79.5) | 45,340 (81.3) | 132,376 (81.0) | 1,773,076 (82.2) |
| Descendant of immigrant | 31,339 (1.9) | 918 (2.2) | 781 (2.5) | 5723 (2.6) | 1260 (2.3) | 3881 (2.4) | 43,902 (2.0) |
| Western immigrant | 87,100 (5.3) | 2581 (6.2) | 1655 (5.3) | 15,869 (7.1) | 3247 (5.8) | 9710 (5.9) | 120,162 (5.6) |
| Non-western immigrant | 163,638 (10.0) | 4375 (10.5) | 3027 (9.7) | 24,176 (10.8) | 5928 (10.6) | 17,535 (10.7) | 218,679 (10.1) |
| Cohabitation status | |||||||
| Living alone | 529,023 (32.3) | 13,708 (32.8) | 10,300 (33.0) | 76,687 (34.4) | 3867 (35.1) | N/A | 633,585 (32.5) |
| Cohabiting | 351,991 (21.5) | 9225 (22.1) | 6829 (21.9) | 50,379 (22.6) | 2369 (21.5) | N/A | 420,793 (21.6) |
| Married | 759,009 (46.3) | 18,890 (45.2) | 14,088 (45.1) | 96,132 (43.1) | 4794 (43.5) | N/A | 892,913 (45.9) |
| Educational level (ISCED) | |||||||
| ISCED15 level 1–2 | 960,324 (60.6) | 24,481 (59.3) | 18,667 (60.6) | 129,791 (59.3) | 40,565 (60.1) | 122,230 (60.4) | 1,296,058 (60.4) |
| ISCED15 level 3–5 | 393,390 (24.8) | 10,185 (24.7) | 7539 (24.5) | 52,354 (23.9) | 16,772 (24.8) | 48,870 (24.1) | 529,110 (24.7) |
| ISCED15 level 6–8 | 231,157 (14.6) | 6589 (16.0) | 4600 (14.9) | 36,716 (16.8) | 10,173 (15.1) | 31,395 (15.5) | 320,630 (14.9) |
| Disposable income | |||||||
| Lowest quintile | 322,307 (19.9) | 7419 (18.2) | 5869 (19.0) | 43,920 (20.4) | 12,715 (18.6) | 39,486 (19.3) | 431,716 (19.8) |
| Second quintile | 334,113 (20.6) | 7611 (18.7) | 5878 (19.0) | 40,851 (19.0) | 12,137 (17.8) | 36,480 (17.9) | 437,070 (20.0) |
| Third quintile | 338,563 (20.9) | 8066 (19.8) | 5850 (18.9) | 40,863 (19.0) | 11,738 (17.2) | 34,157 (16.7) | 439,237 (20.1) |
| Fourth quintile | 326,174 (20.1) | 8604 (21.1) | 6449 (20.9) | 43,279 (20.1) | 14,025 (20.5) | 40,367 (19.8) | 438,898 (20.1) |
| Highest quintile | 301,566 (18.6) | 9067 (22.2) | 6878 (22.2) | 46,484 (21.6) | 17,742 (26.0) | 53,702 (26.3) | 435,439 (20.0) |
| Healthcare usage | |||||||
| Rare | 319,960 (19.5) | 8519 (20.3) | 5985 (19.1) | 47,619 (21.3) | 13,413 (19.2) | 43,973 (20.7) | 439,469 (19.8) |
| Low | 366,807 (22.3) | 9020 (21.5) | 6774 (21.7) | 48,280 (21.6) | 15,181 (21.8) | 45,102 (21.2) | 491,164 (22.1) |
| Average | 347,589 (21.2) | 8758 (20.9) | 6637 (21.2) | 46,608 (20.9) | 14,364 (20.6) | 44,024 (20.7) | 467,980 (21.1) |
| High | 299,358 (18.2) | 7583 (18.1) | 5727 (18.3) | 40,091 (17.9) | 12,967 (18.6) | 38,760 (18.2) | 404,486 (18.2) |
| Frequent | 307,485 (18.7) | 7996 (19.1) | 6132 (19.6) | 40,788 (18.3) | 13,804 (19.8) | 40,696 (19.1) | 416,901 (18.8) |
| Time from invitation to participation, median (IQI) | 94 (42; 200) | 120 (72; 207) | 122 (53; 201) | 86 (36; 161) | 69 (29; 133) | 51 (28; 101) | 89 (39; 184) |
-
IQI = interquartile interval; ISCED = International Standard Classification of Education; Information on cohabitation status was only available from Statistics Denmark until the end of February 2021, whereas all other socio-economic variables were available until end of the study period.
Table 2
Prevalence ratios and 95% CIs of participation in cervical cancer screening in Denmark within 365 d since invitation from 2015–2021*.
| N | Pre-pandemic(01 January 2015–31 January 2020) | Pre-lockdown(01 February 2020–10 March 2020) | First lockdown(11 March 2020–15 April 2020) | First re-opening(16 April 2020–15 December 2020) | Second lockdown(16 December 2020–31 December 2020) | ||||||
|---|---|---|---|---|---|---|---|---|---|---|---|
| N=164,1199 | N=41,876 | N=31,255 | N=223,386 | N=69,729 | |||||||
| PR | (95% CI) | PR | (95% CI) | PR | (95% CI) | PR | (95% CI) | PR | (95% CI) | ||
| Overall | 2,220,000 | 1.00 | - | 0.97 | (0.96; 0.98) | 0.97 | (0.96; 0.98) | 1.01 | (1.00; 1.01) | 0.99 | (0.97; 1.00) |
| Age at invitation | |||||||||||
| 23–29 y | 535,235 | 1.00 | - | 0.96 | (0.94; 0.98) | 0.98 | (0.95; 1.00) | 0.99 | (0.98; 1.00) | 1.00 | (0.96; 1.04) |
| 30–39 y | 559,296 | 1.00 | - | 0.97 | (0.95; 0.99) | 0.99 | (0.97; 1.01) | 1.01 | (1.00; 1.02) | 1.00 | (0.97; 1.04) |
| 40–49 y | 659,365 | 1.00 | - | 0.95 | (0.93; 0.96) | 0.94 | (0.92; 0.95) | 1.00 | (0.99; 1.01) | 0.93 | (0.90; 0.96) |
| 50–59 y | 336,786 | 1.00 | - | 1.01 | (0.99; 1.03) | 1.00 | (0.98; 1.02) | 1.02 | (1.01; 1.03) | 1.05 | (1.01; 1.08) |
| 60–64 y | 129,318 | 1.00 | - | 0.95 | (0.92; 0.99) | 0.93 | (0.90; 0.97) | 0.98 | (0.96; 1.00) | 0.93 | (0.87; 0.99) |
| Ethnicity | |||||||||||
| Danish descent | 1,773,076 | 1.00 | - | 0.96 | (0.95; 0.97) | 0.96 | (0.95; 0.97) | 1.00 | (1.00; 1.01) | 0.97 | (0.96; 0.99) |
| Descendant of immigrant | 43,902 | 1.00 | - | 0.95 | (0.86; 1.05) | 0.88 | (0.79; 0.98) | 0.97 | (0.92; 1.02) | 0.93 | (0.78; 1.12) |
| Western Immigrant | 120,162 | 1.00 | - | 1.03 | (0.98; 1.09) | 1.04 | (0.98; 1.11) | 1.09 | (1.06; 1.12) | 1.06 | (0.95; 1.17) |
| Non-western immigrant | 218,679 | 1.00 | - | 0.99 | (0.95; 1.02) | 0.98 | (0.94; 1.02) | 1.04 | (1.02; 1.06) | 1.07 | (1.00; 1.14) |
| Cohabitation status | |||||||||||
| Living alone | 633,585 | 1.00 | - | 0.97 | (0.95; 0.98) | 0.96 | (0.94; 0.98) | 1.02 | (1.01; 1.02) | 0.98 | (0.95; 1.02) |
| Cohabiting | 420,793 | 1.00 | - | 0.96 | (0.94; 0.98) | 0.97 | (0.95; 0.99) | 1.00 | (0.99; 1.01) | 1.00 | (0.96; 1.04) |
| Married | 892,913 | 1.00 | - | 0.97 | (0.96; 0.98) | 0.97 | (0.96; 0.99) | 1.00 | (1.00; 1.01) | 0.98 | (0.96; 1.01) |
| Educational level (ISCED) | |||||||||||
| ISCED15 level 1–2 | 1,297,050 | 1.00 | - | 0.96 | (0.95; 0.97) | 0.96 | (0.95; 0.98) | 1.01 | (1.00; 1.01) | 0.99 | (0.97; 1.01) |
| ISCED15 level 3–5 | 529,165 | 1.00 | - | 0.96 | (0.95; 0.98) | 0.97 | (0.95; 0.99) | 1.00 | (0.99; 1.01) | 0.97 | (0.94; 1.00) |
| ISCED15 level 6–8 | 319,925 | 1.00 | - | 1.00 | (0.98; 1.02) | 0.99 | (0.97; 1.02) | 1.04 | (1.03; 1.05) | 1.06 | (1.01; 1.10) |
| Disposable income | |||||||||||
| Lowest quintile | 419,122 | 1.00 | - | 0.95 | (0.93; 0.98) | 0.96 | (0.93; 0.98) | 1.02 | (1.01; 1.04) | 1.02 | (0.97; 1.07) |
| Second quintile | 422,225 | 1.00 | - | 0.95 | (0.92; 0.97) | 0.94 | (0.91; 0.96) | 1.00 | (0.99; 1.01) | 1.00 | (0.95; 1.04) |
| Third quintile | 424,081 | 1.00 | - | 0.96 | (0.94; 0.98) | 0.95 | (0.93; 0.97) | 0.99 | (0.98; 1.00) | 0.94 | (0.91; 0.98) |
| Fourth quintile | 425,069 | 1.00 | - | 0.96 | (0.95; 0.98) | 0.96 | (0.95; 0.98) | 1.00 | (0.99; 1.01) | 0.96 | (0.93; 0.99) |
| Highest quintile | 424,457 | 1.00 | - | 0.98 | (0.96; 0.99) | 0.96 | (0.95; 0.98) | 1.00 | (0.99; 1.00) | 0.97 | (0.95; 1.00) |
| Healthcare usage | |||||||||||
| Rare | 439,469 | 1.00 | - | 0.97 | (0.95; 0.99) | 0.97 | (0.95; 1.00) | 1.02 | (1.01; 1.03) | 0.99 | (0.94; 1.04) |
| Low | 491,164 | 1.00 | - | 0.97 | (0.95; 0.99) | 0.95 | (0.93; 0.97) | 1.00 | (0.99; 1.01) | 0.95 | (0.91; 0.99) |
| Average | 467,980 | 1.00 | - | 0.95 | (0.94; 0.97) | 0.95 | (0.93; 0.97) | 1.00 | (0.99; 1.01) | 1.00 | (0.97; 1.04) |
| High | 404,486 | 1.00 | - | 0.97 | (0.95; 0.98) | 0.96 | (0.94; 0.98) | 1.01 | (1.00; 1.02) | 0.99 | (0.96; 1.03) |
| Frequent | 416,901 | 1.00 | - | 0.97 | (0.95; 0.99) | 0.98 | (0.97; 1.00) | 1.00 | (0.99; 1.01) | 0.96 | (0.93; 1.00) |
-
*Adjusted for month, year, and age at invitation; PR = prevalence ratio; ISCED = International Standard Classification of Education.
Additional files
-
Supplementary file 1
Proportion of women participating in cervical cancer screening in Denmark within 90 d since invitation from 2015 to 2021.
- https://cdn.elifesciences.org/articles/81522/elife-81522-supp1-v2.xlsx
-
Supplementary file 2
Proportion of women participating in cervical cancer screening in Denmark within 180 d since invitation from 2015 to 2021.
- https://cdn.elifesciences.org/articles/81522/elife-81522-supp2-v2.xlsx
-
Supplementary file 3
Proportion of women participating in cervical cancer screening in Denmark within 365 d since invitation from 2015 to 2021.
- https://cdn.elifesciences.org/articles/81522/elife-81522-supp3-v2.xlsx
-
Supplementary file 4
Prevalence ratios and 95% CIs of participation in cervical cancer screening in Denmark within 90 d since invitation from 2015 to 2021.
- https://cdn.elifesciences.org/articles/81522/elife-81522-supp4-v2.xlsx
-
Supplementary file 5
Prevalence ratios and 95% CIs of participation in cervical cancer screening in Denmark within 180 d since invitation from 2015 to 2021.
- https://cdn.elifesciences.org/articles/81522/elife-81522-supp5-v2.xlsx
-
MDAR checklist
- https://cdn.elifesciences.org/articles/81522/elife-81522-mdarchecklist1-v2.pdf
Download links
A two-part list of links to download the article, or parts of the article, in various formats.
Downloads (link to download the article as PDF)
Open citations (links to open the citations from this article in various online reference manager services)
Cite this article (links to download the citations from this article in formats compatible with various reference manager tools)
Participation in the nationwide cervical cancer screening programme in Denmark during the COVID-19 pandemic: An observational study
eLife 12:e81522.
https://doi.org/10.7554/eLife.81522


