Rab10 regulates the sorting of internalised TrkB for retrograde axonal transport
- Department of Neuromuscular Diseases and UCL Queen Square Motor Neuron Disease Centre, UCL Queen Square Institute of Neurology, University College London, United Kingdom
- UK Dementia Research Institute at UCL, United Kingdom
Figures
Figure 1
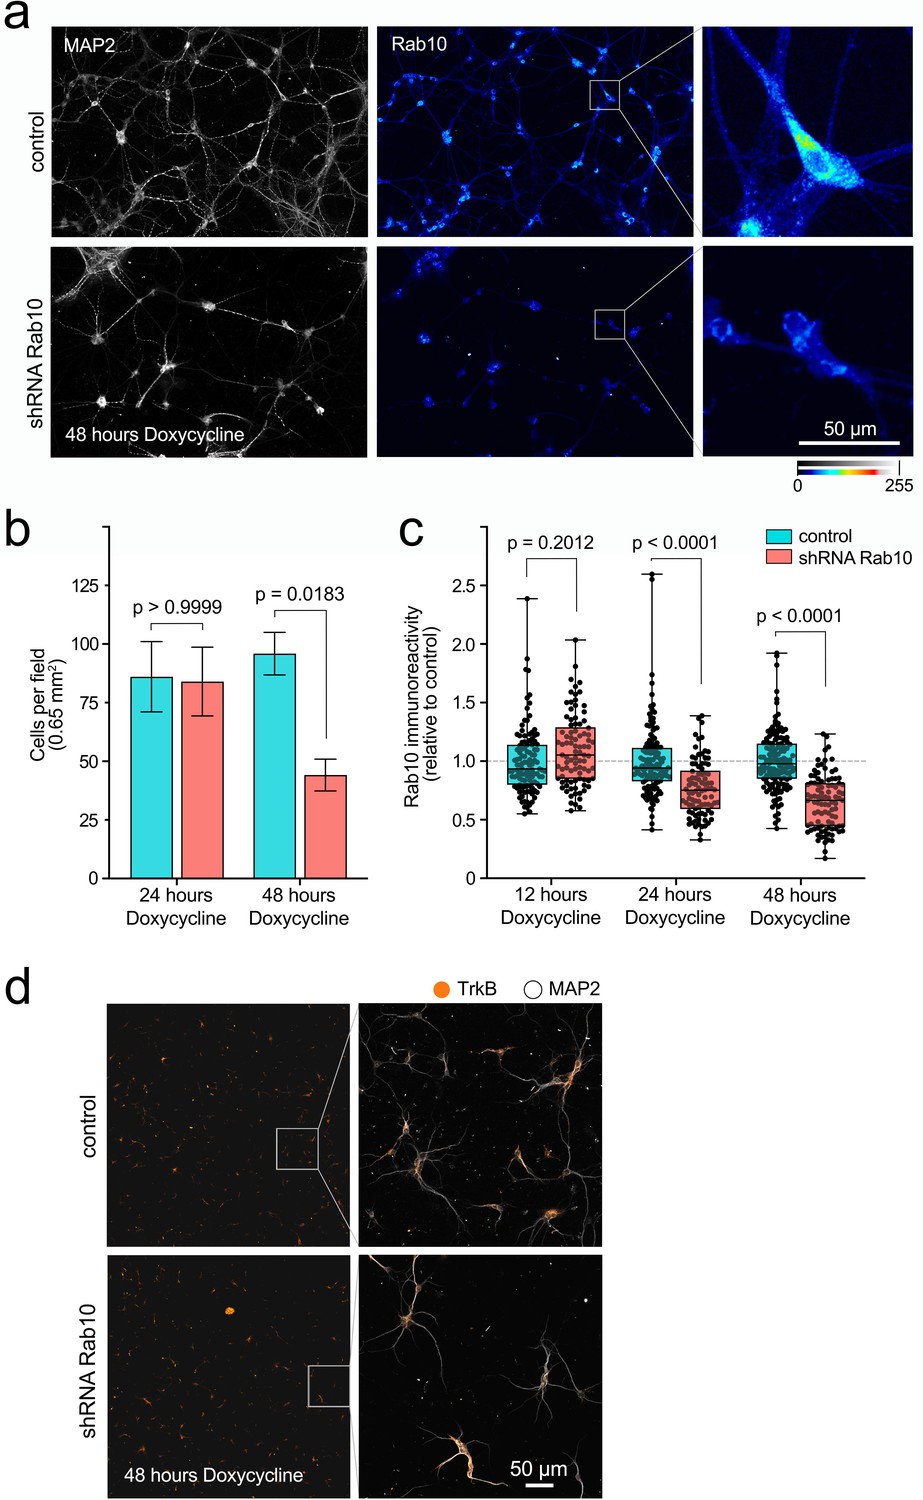
Doxycycline-inducible knockdown of Rab10 in hippocampal neurons.
(a) Representative fields of a primary mass culture of hippocampal neurons transduced with shRNA Rab10 versus control and treated with doxycycline for 48 hr. Cells have been immunolabelled for MAP2 (grey) and Rab10 (colour scale 0–255). Scale bar = 50 µm. (b) Cell density was quantified in 18 fields per treatment across three independent experiments, showing a significant decrease after 48 hr. Two-way ANOVA, F(1,68), p value for knockdown = 0.0270, p value for time = 0.0406, p value for interaction = 0.2114 (non-significant). The p values for Bonferroni multiple comparison tests, t(68), are indicated in the plot. (c) In the same experiments, immunoreactivity for Rab10 was quantified per cell at 12, 24, and 48 hr with doxycycline, and analysed using two-way ANOVA (p value for knockdown, time, and interaction <0.0001); p values for Bonferroni multiple comparison tests, t(68), are indicated in the plot and show a significant effect of the shRNA at 24 and 48 hr. (d) Representative low-magnification fields showing no difference on immunoreactivity for TrkB in hippocampal neurons treated with shRNA Rab10 versus control after 48 hr with doxycycline. The right panel shows zoomed boxes with TrkB (orange) and MAP2 (grey). Source data of the plots have been included in Figure 1—source data 1.
-
Figure 1—source data 1
Data tables for each plot presented in Figure 1 are given as individual CSV files.
- https://cdn.elifesciences.org/articles/81532/elife-81532-fig1-data1-v1.zip
Figure 2
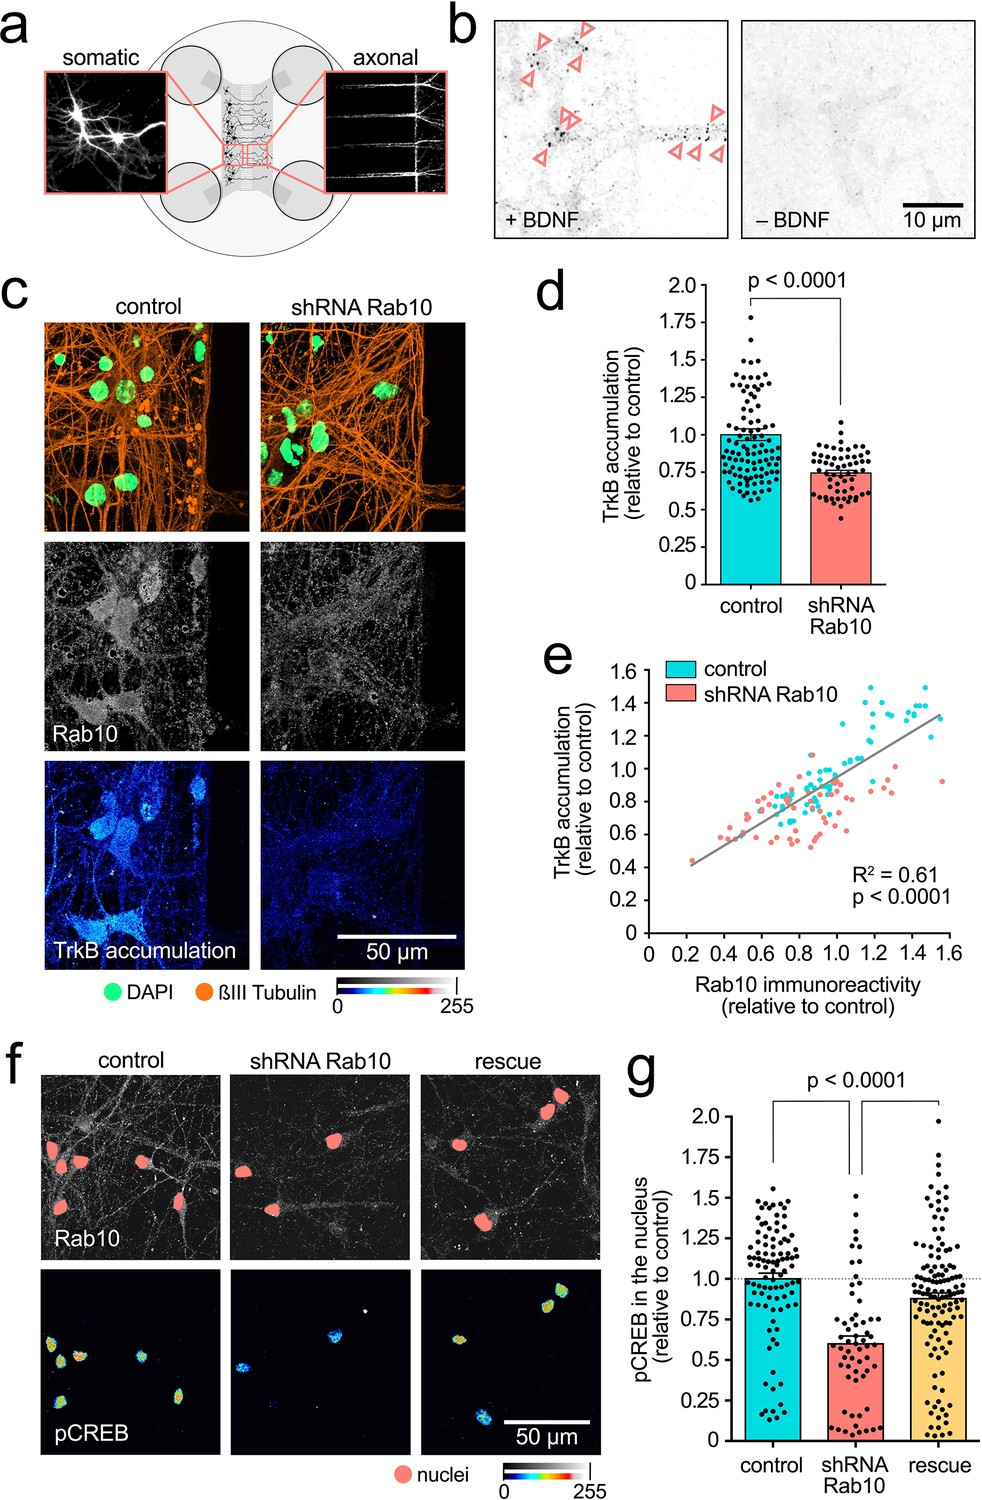
Rab10 is required for retrograde TrkB trafficking and signalling.
(a) Schematic of two-compartment microfluidic chambers highlighting compartmentalisation of somata (left) and axon terminals (right). Micro-flow from somatic to axonal compartments provides fluidic isolation of the somatic compartment to probes added to the other chamber. (b) Representative images from the cell bodies of neurons incubated for 2.5 hr with anti-TrkB in the axonal compartment, with (+) or without (-) brain-derived neurotrophic factor (BDNF). Pink arrowheads indicate examples of retrogradely transported TrkB-positive organelles. Scale bar: 10 µm. (c) Neurons treated with the shRNA targeting Rab10 were compared to control transduced neurons. Immunofluorescence revealed similar neuronal density (see ßIII-tubulin in orange and nuclear staining in green, top panel), but a decrease in both, expression of Rab10 (grey, middle panel) and retrograde accumulation of TrkB after 2.5 hr (colour intensity scale, bottom panel). Scale bar: 50 µm. (d) Quantification of retrograde TrkB accumulation in three independent experiments show statistically significant differences (unpaired Student’s t-test, t(140), p<0.0001). (e) Correlation between expression level of Rab10 and retrograde TrkB accumulation in control and Rab10-knockdown neurons show a significant linear correlation (goodness-of-fit R2=0.61; Pearson r, XY pairs = 131, p<0.0001). (f) Axonal stimulation with BDNF for 2.5 hr leads to robust appearance of phosphorylated CREB in the nucleus of control neurons (left panel). This response was impaired in neurons depleted of Rab10 (middle panel), and rescued by the co-expression of a shRNA-resistant mutant Rab10 (right panel). Immunofluorescence for Rab10 is shown in grey, with the nuclei indicated with a pink mask, and nuclear phosphorylated CREB is shown in a colour intensity scale. Scale bar: 50 µm. (g) Quantification from three independent experiments showing the statistically significant effect of manipulating Rab10 expression on the levels of phosphorylated CREB in the nucleus (one-way ANOVA, F(2,280), p<0.0001; p values for the Bonferroni multiple comparison tests, t(280), are indicated in the plot). Source data of the plots have been included in Figure 2—source data 1.
-
Figure 2—source data 1
Data tables for each plot presented in Figure 2 are given as individual CSV files.
- https://cdn.elifesciences.org/articles/81532/elife-81532-fig2-data1-v1.zip
Figure 3 with 1 supplement
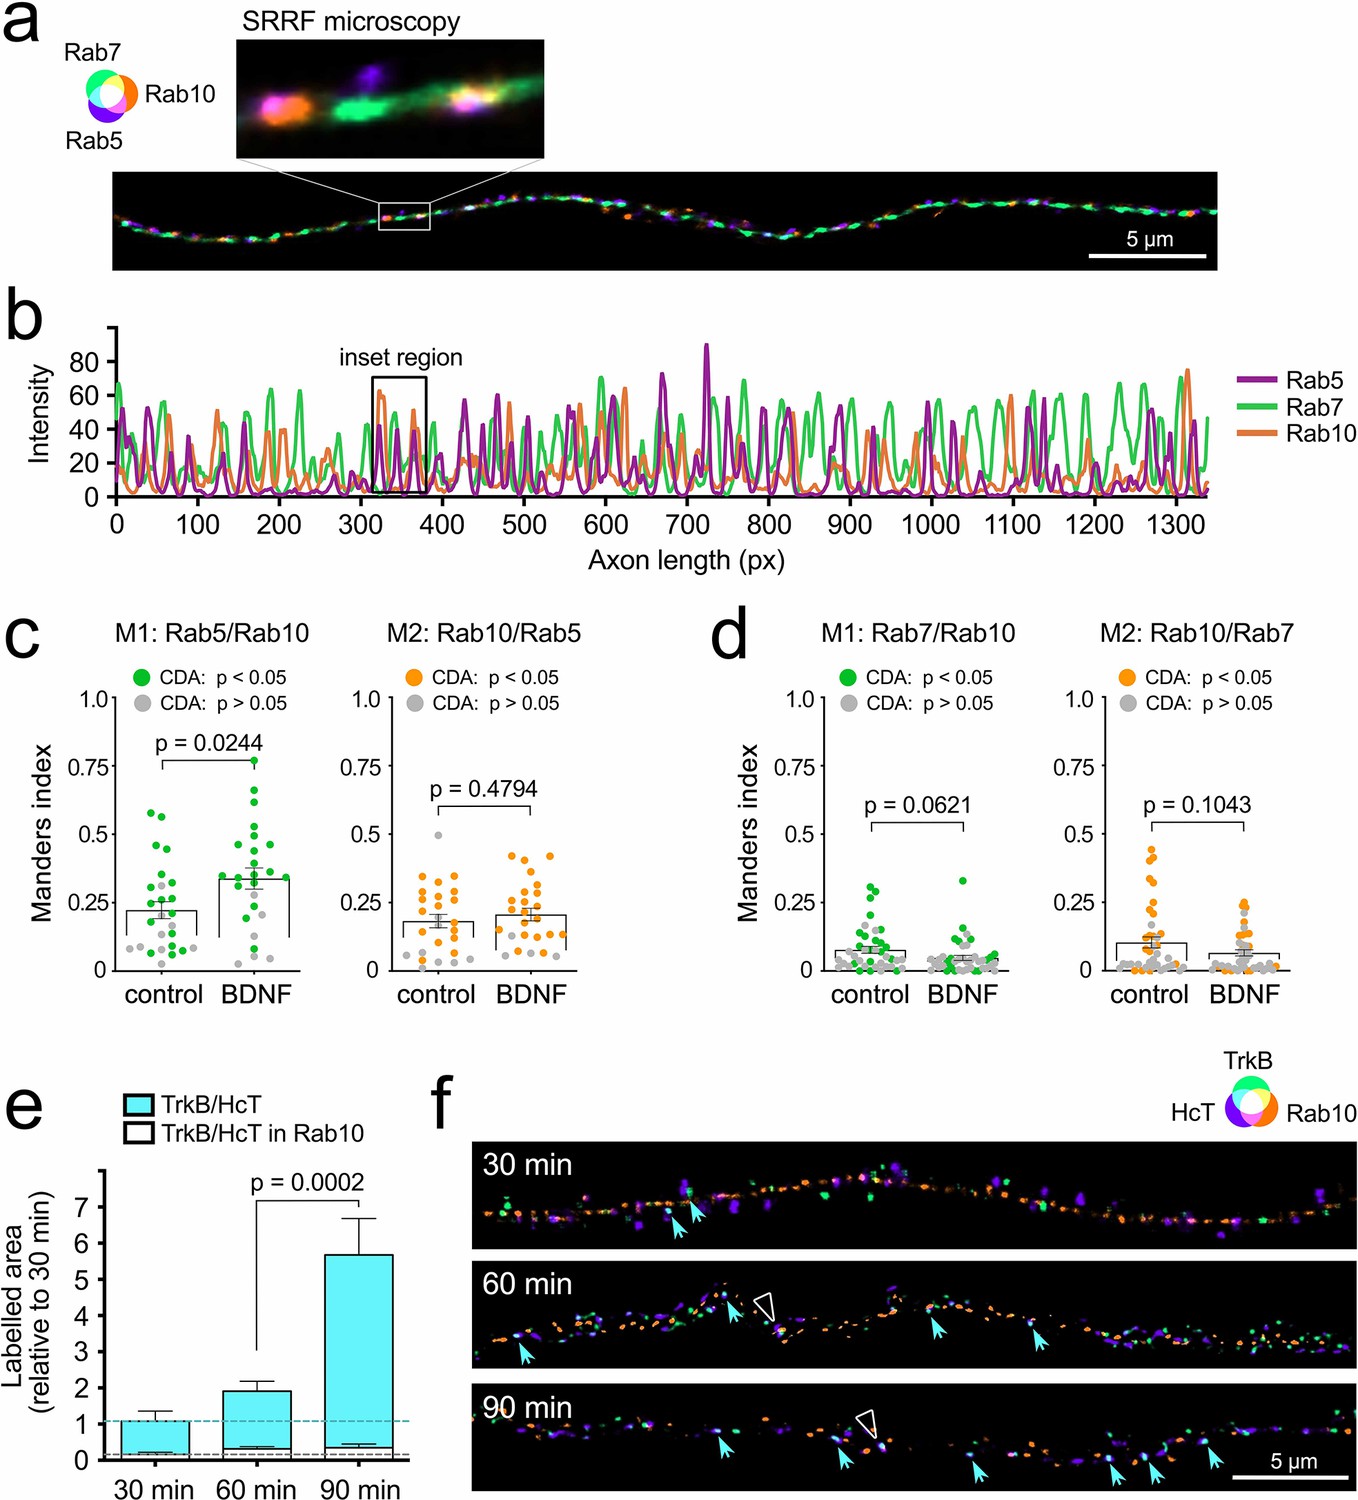
Internalised TrkB transiently co-localises with Rab10 in axons.
(a) Representative super-resolution radial fluctuations (SRRF) microscopy of an axon stained for endogenous Rab5 (purple), Rab7 (green), and Rab10 (orange). The inset at ×6 higher magnification shows examples of partial co-localisation of Rab10 with Rab5 and Rab7. Scale bar = 5 µm. (b) Intensity along the same axonal segment shown in (a) was plotted to show the correlation between the three markers. (c) Co-localisation of endogenous Rab10 and Rab5 was analysed comparing axons from starved neurons versus incubated 30 min with brain-derived neurotrophic factor (BDNF). Confined-displacement algorithm (CDA) has been used to compute Manders coefficients (Welch’s corrected unpaired Student’s t-test; M1: t(46.27), p-value = 0.0244; M2: t(48.94), p-value = 0.4794). Data points showing significant co-localisation compared to random distribution are marked with coloured dots. No significant differences were found between starved and BDNF-stimulated neurons. (d) Co-localisation of endogenous Rab10 and Rab7 was analysed in a similar experimental set-up (Welch’s corrected unpaired Student’s t-test; M1: t(72.32), p-value = 0.0621; M2: t(62.33), p-value = 0.1043). (e) Labelled HCT and anti-TrkB were co-internalised in the presence of BDNF for 30, 60, and 90 min, and their level of overlap with endogenous Rab10 in axons was evaluated using confocal microscopy. Relative areas positive for HCT and TrkB are shown in cyan (normalised to 30 min) and the fraction of the normalised area that was triple positive for HCT, TrkB and Rab10 is plotted in white. Whereas the double TrkB/HCT-positive area significantly increased by 90 min (one-way ANOVA, F(2,72), p-value <0.0001; Bonferroni multiple comparison test p value is shown in the plot), the triple TrkB/HCT/Rab10 surface remained low and fairly constant at all time points (one-way ANOVA, F(2,72), p-value = 0.2730; Bonferroni multiple comparisons test for 60 vs. 90 min, t(72), p-value >0.9999). (f) Representative SRRF microscopy from the same three time points. Double-positive puncta for TrkB (green) and HCT (purple) is indicated with cyan arrowheads. Triple-positive puncta of TrkB/HCT (cyan) and Rab10 (orange) are indicated with white empty triangles. Scale bar = 5 µm. Source data of the plots have been included in Figure 3—source data 1.
-
Figure 3—source data 1
Data tables for each plot presented in Figure 3 are given as individual CSV files.
- https://cdn.elifesciences.org/articles/81532/elife-81532-fig3-data1-v1.zip
Figure 3—figure supplement 1
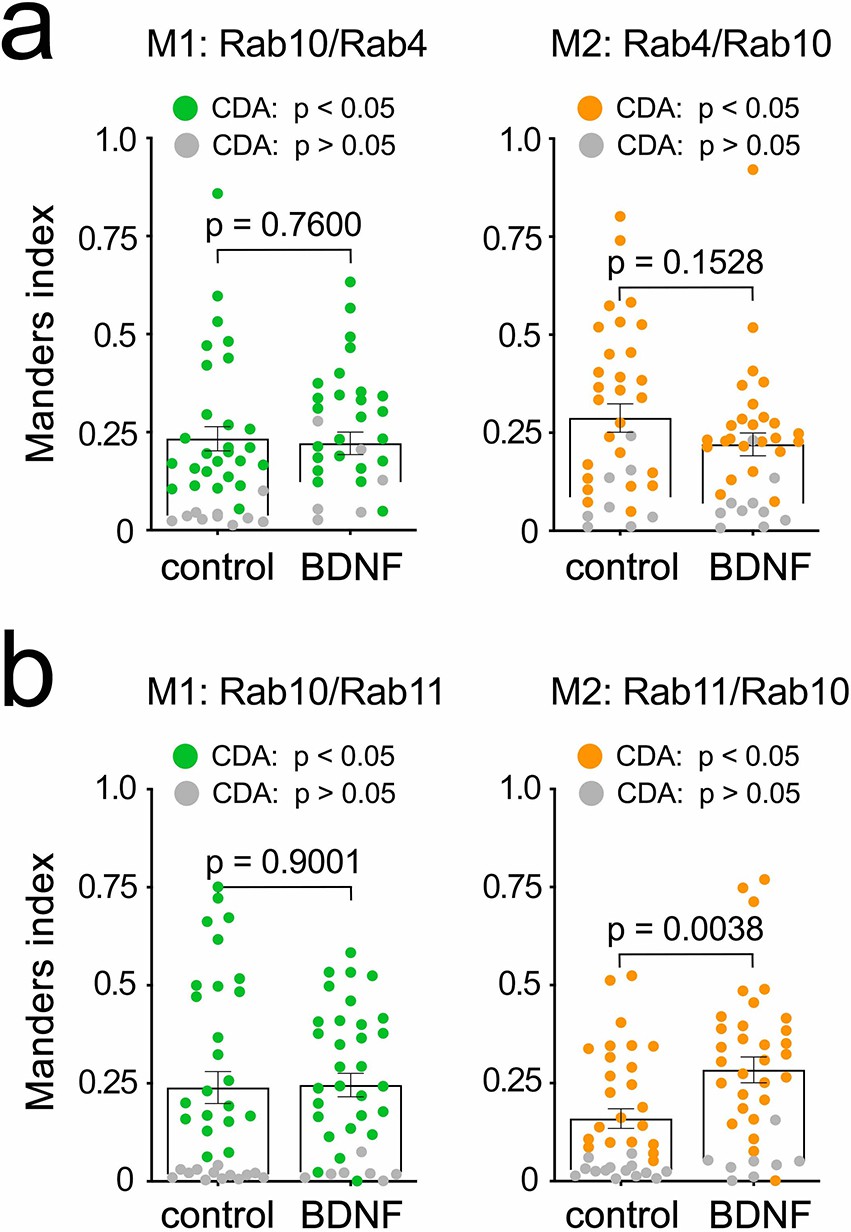
Co-localisation of Rab10 with Rab4 and Rab11.
Expansion of the analysis in Figure 3c and d to include Rabs related to recycling endosomes. (a) Manders coefficients for Rab10 and Rab4 in the axon of hippocampal neurons treated or not with 50 ng/mL brain-derived neurotrophic factor (BDNF) for 30 min. Welch’s corrected unpaired Student’s t-test; M1: t(76.31), p-value = 0.7600; M2: t(65.11), p-value = 0.1528. (b) Manders coefficients for Rab10 and Rab11 in the axon of hippocampal neurons treated or not with 50 ng/mL BDNF for 30 min. Welch’s corrected unpaired Student’s t-test; M1: t(64.71), p-value = 0.9001; M2: t(66.74), p-value = 0.0038.
Figure 4
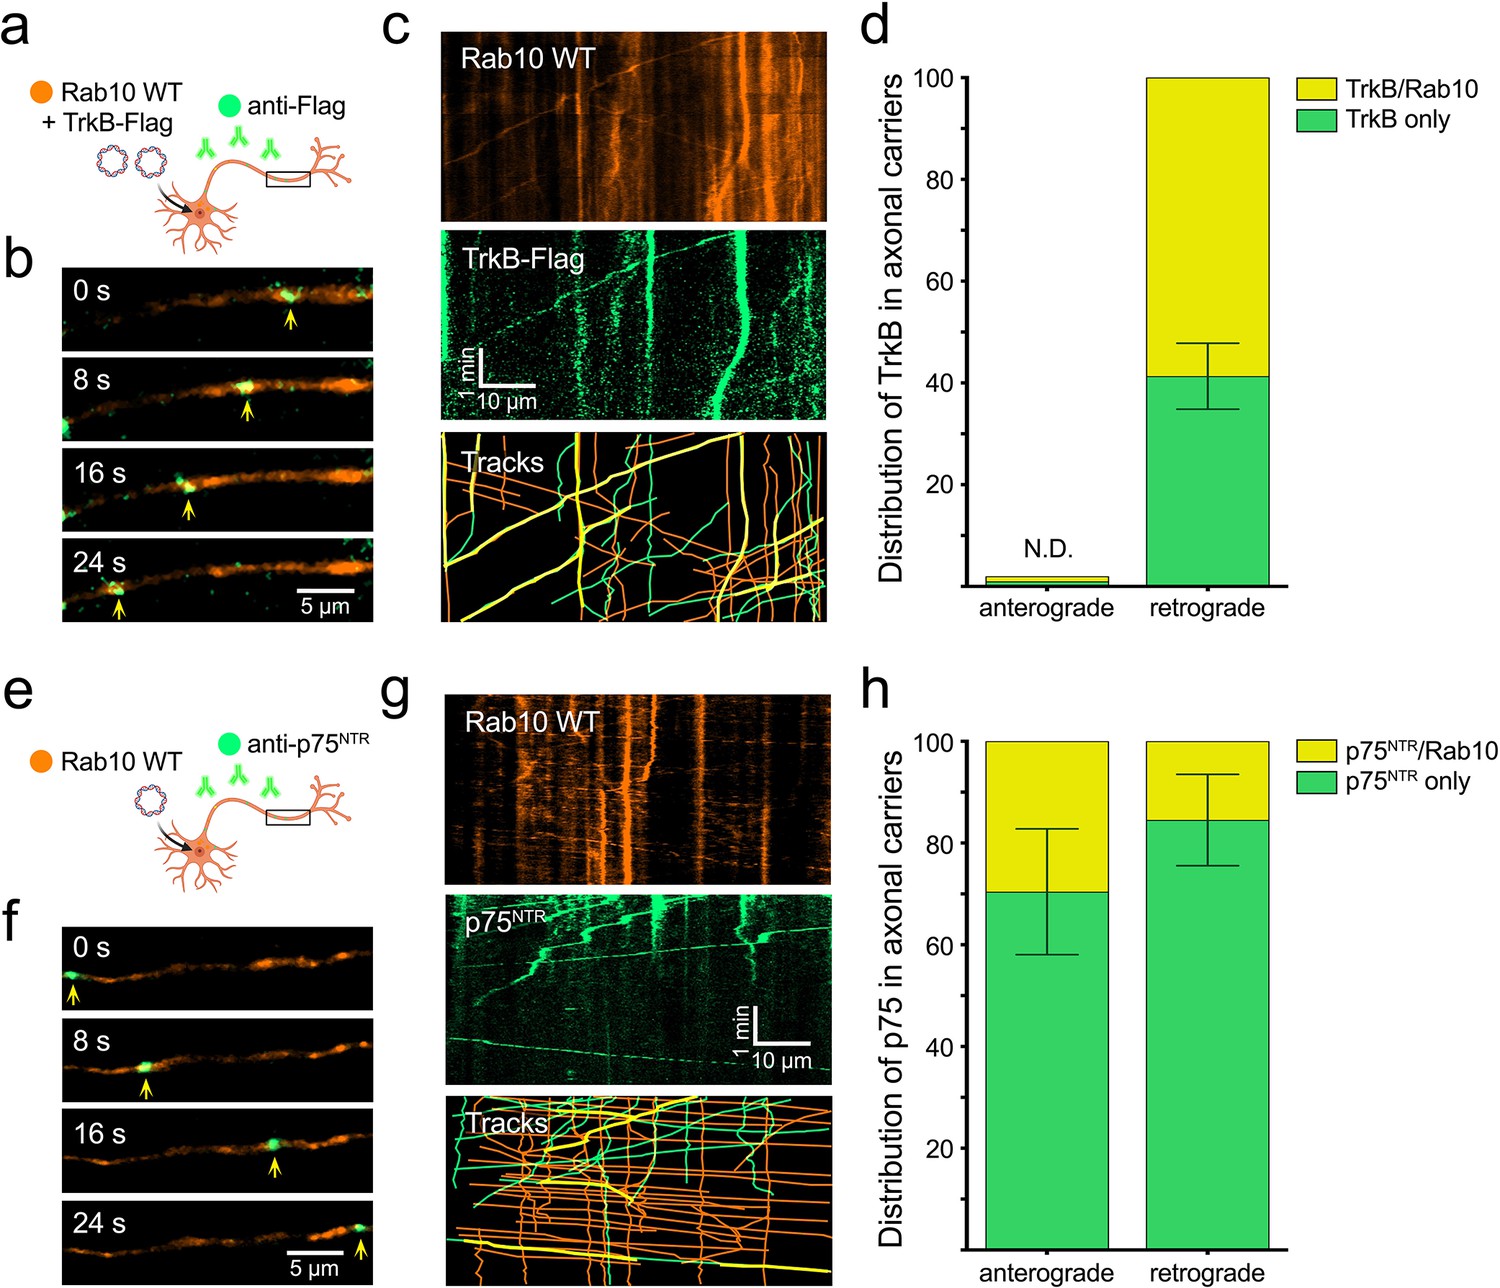
Over-expressed Rab10 is co-transported with TrkB and p75 receptors in the axon.
(a) Hippocampal neurons in mass culture were co-transfected with EGFP-Rab10 and TrkB-Flag plasmids. Fluorescently labelled anti-Flag antibodies were internalised in the presence of brain-derived neurotrophic factor (BDNF) and their axonal dynamics monitored by time-lapse microscopy. (b) Representative images of the axon of a double transfected neuron, where a double-positive organelle for EGFP-Rab10 (orange) and anti-Flag (green) is indicated with yellow arrowheads. Scale bar = 5 µm. (c) Representative kymograph of the axon of a double transfected neuron during 5 min of imaging showing Rab10 and TrkB-Flag channels. Double-positive tracks (in yellow) show transport predominantly in the retrograde direction (right to left). Scale bar = 10 µm. (d) Quantification of five experiments showing the proportion of TrkB-containing mobile organelles that were positive for Rab10. No anterograde TrkB organelles were found; therefore, presence of Rab10 could not be determined (N.D.). (e) An equivalent experiment was performed by transfecting EGFP-Rab10 and visualising it together with endocytosed fluorescently-labelled anti-p75NTR antibodies. (f) Representative frames from a time-lapse movie displaying a double-positive organelle for Rab10 (orange) and p75NTR (green) moving anterogradely. Scale bar = 5 µm. (g) Representative kymograph showing Rab10 and p75NTR channels. Double-positive tracks (in yellow) show transport in both anterograde (left to right) and retrograde directions. Scale bar = 10 µm. (h) Quantification of five experiments displaying the proportion of p75NTR mobile organelles positive for Rab10 moving in the anterograde and retrograde direction. Source data of the plots have been included in Figure 4—source data 1.
-
Figure 4—source data 1
Data tables for each plot presented in Figure 4 are given as individual CSV files.
- https://cdn.elifesciences.org/articles/81532/elife-81532-fig4-data1-v1.zip
Figure 5 with 4 supplements
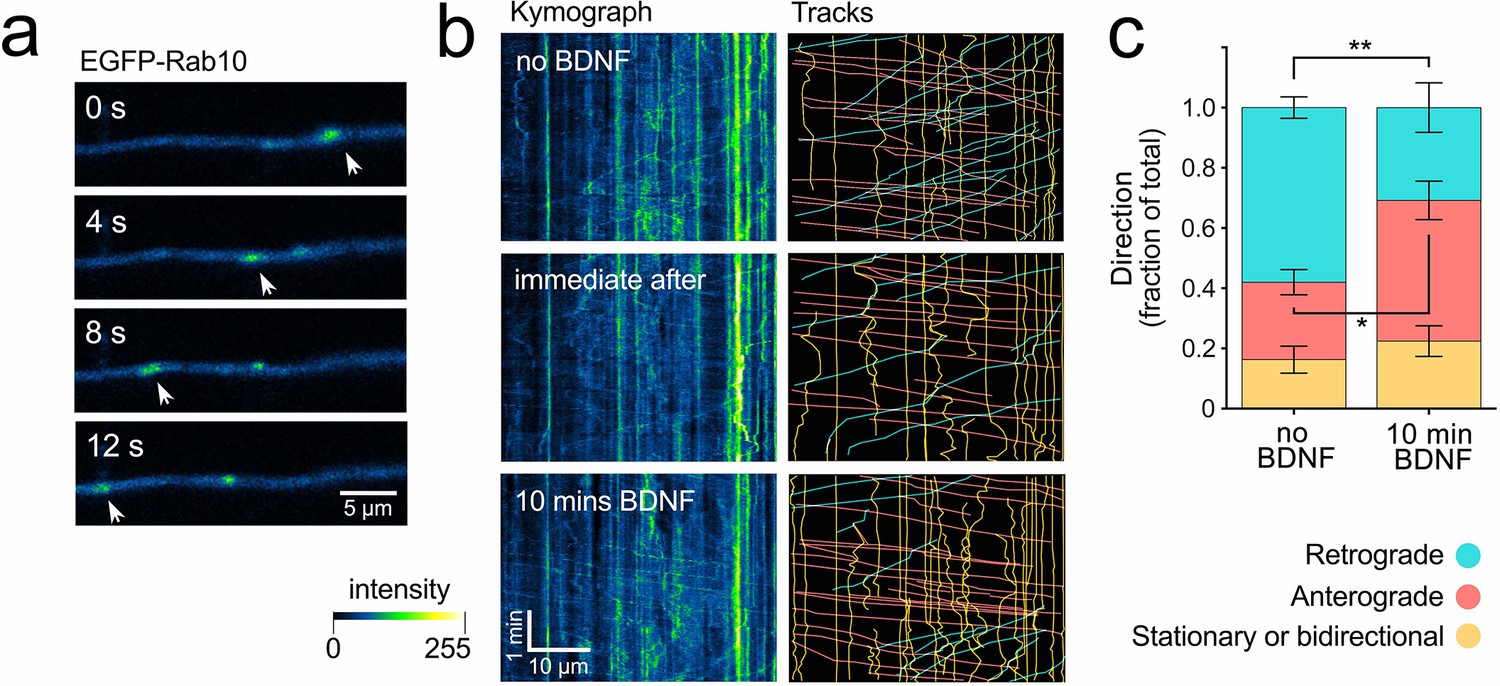
Brain-derived neurotrophic factor (BDNF) regulates the directionality of Rab10 organelles.
Hippocampal neurons in mass culture were transfected with EGFP-Rab10 and depleted of BDNF for 60 min. (a) Representative axon of a live neuron showing retrograde (right to left) transport of a Rab10-positive organelle (white arrowheads) in the absence of BDNF. Scale bar = 5 µm. (b) In the panels on the left, representative kymographs (colour-coded as in a) are presented from the same axon upon BDNF depletion (top), immediately after the addition of 50 ng/mL of BDNF (middle), and 10 min thereafter (bottom). In the panels on the right, tracks have been traced and categorised as retrograde (cyan), anterograde (pink), or stationary/bidirectional (yellow). Scale bar = 10 µm. (c) The frequencies of tracks from each of the three categories have been quantified and plotted, comparing no BDNF and 10 min post-addition of 50 ng/mL BDNF. N = 14 axonal segments from 10 independent experiments. Unpaired Student’s t-test, t(14), showed a significant increase in anterograde carriers (p-value = 0.0150, *) at the expense of retrograde carriers (p-value = 0.003, **). Stationary and bidirectional carriers did not show any significant change (p-value = 0.4278). See Figure 5—video 1 for a video. Source data of the plots have been included in Figure 5—source data 1.
-
Figure 5—source data 1
Data tables for each plot presented in Figure 5 are given as individual CSV files.
- https://cdn.elifesciences.org/articles/81532/elife-81532-fig5-data1-v1.zip
Figure 5—figure supplement 1
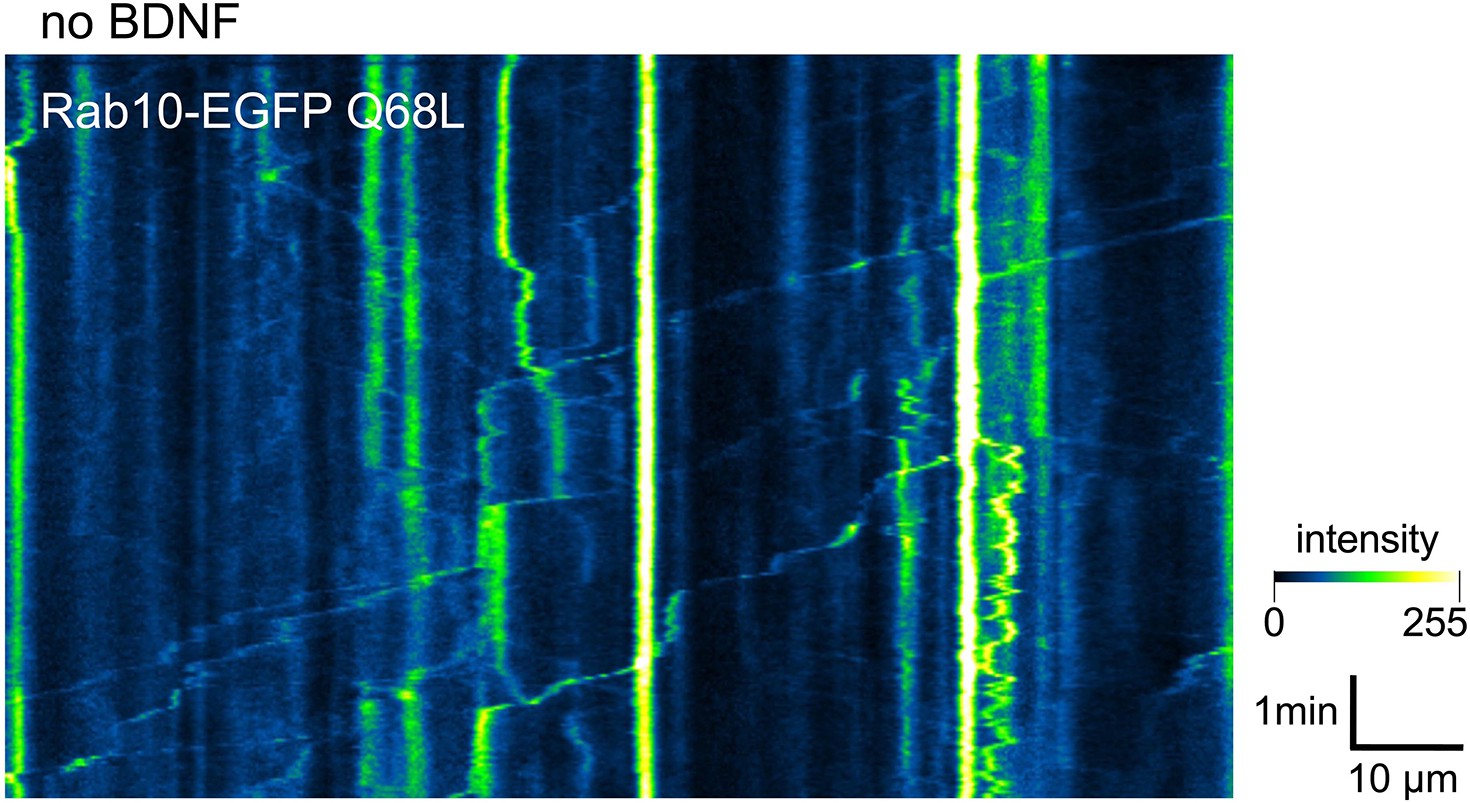
Example of a kymograph showing the dynamics of the constitutively-active EGFP-Rab10 Q68L mutant in a representative axon depleted of brain-derived neurotrophic factor (BDNF).
Figure 5—video 1
Representative axon in mass culture expressing EGFP-Rab10 (with intensity colour-coded as in Figure 5a) before and after being stimulated with 50 ng/mL brain-derived neurotrophic factor (BDNF).
Dimensions and speed are indicated in the video.
Figure 5—video 2
Representative time-lapse microscopy video of EGFP-Rab10 (with intensity colour-coded as in Figure 5) after 10 min upon stimulation with 50 ng/mL brain-derived neurotrophic factor (BDNF).
A moving Rab10-positive organelle is indicated with a green arrowhead on the left, while in the centre a stationary organelle is indicated with a red arrowhead. The first endosome is moving anterogradely, and when it runs next to the stationary organelle, they partially merge and continue moving. Dimensions and speed are indicated.
Figure 5—video 3
Neuron in mass culture expressing EGFP-Rab10 (with intensity colour-coded as in Figure 5a) at steady state.
The video is focused on an area of the cell body at the base of a primary neurite and show several Rab10- positive tubular structures moving in different directions, labelled with orange arrowheads. Dimensions and speed are indicated.
Figure 6 with 2 supplements
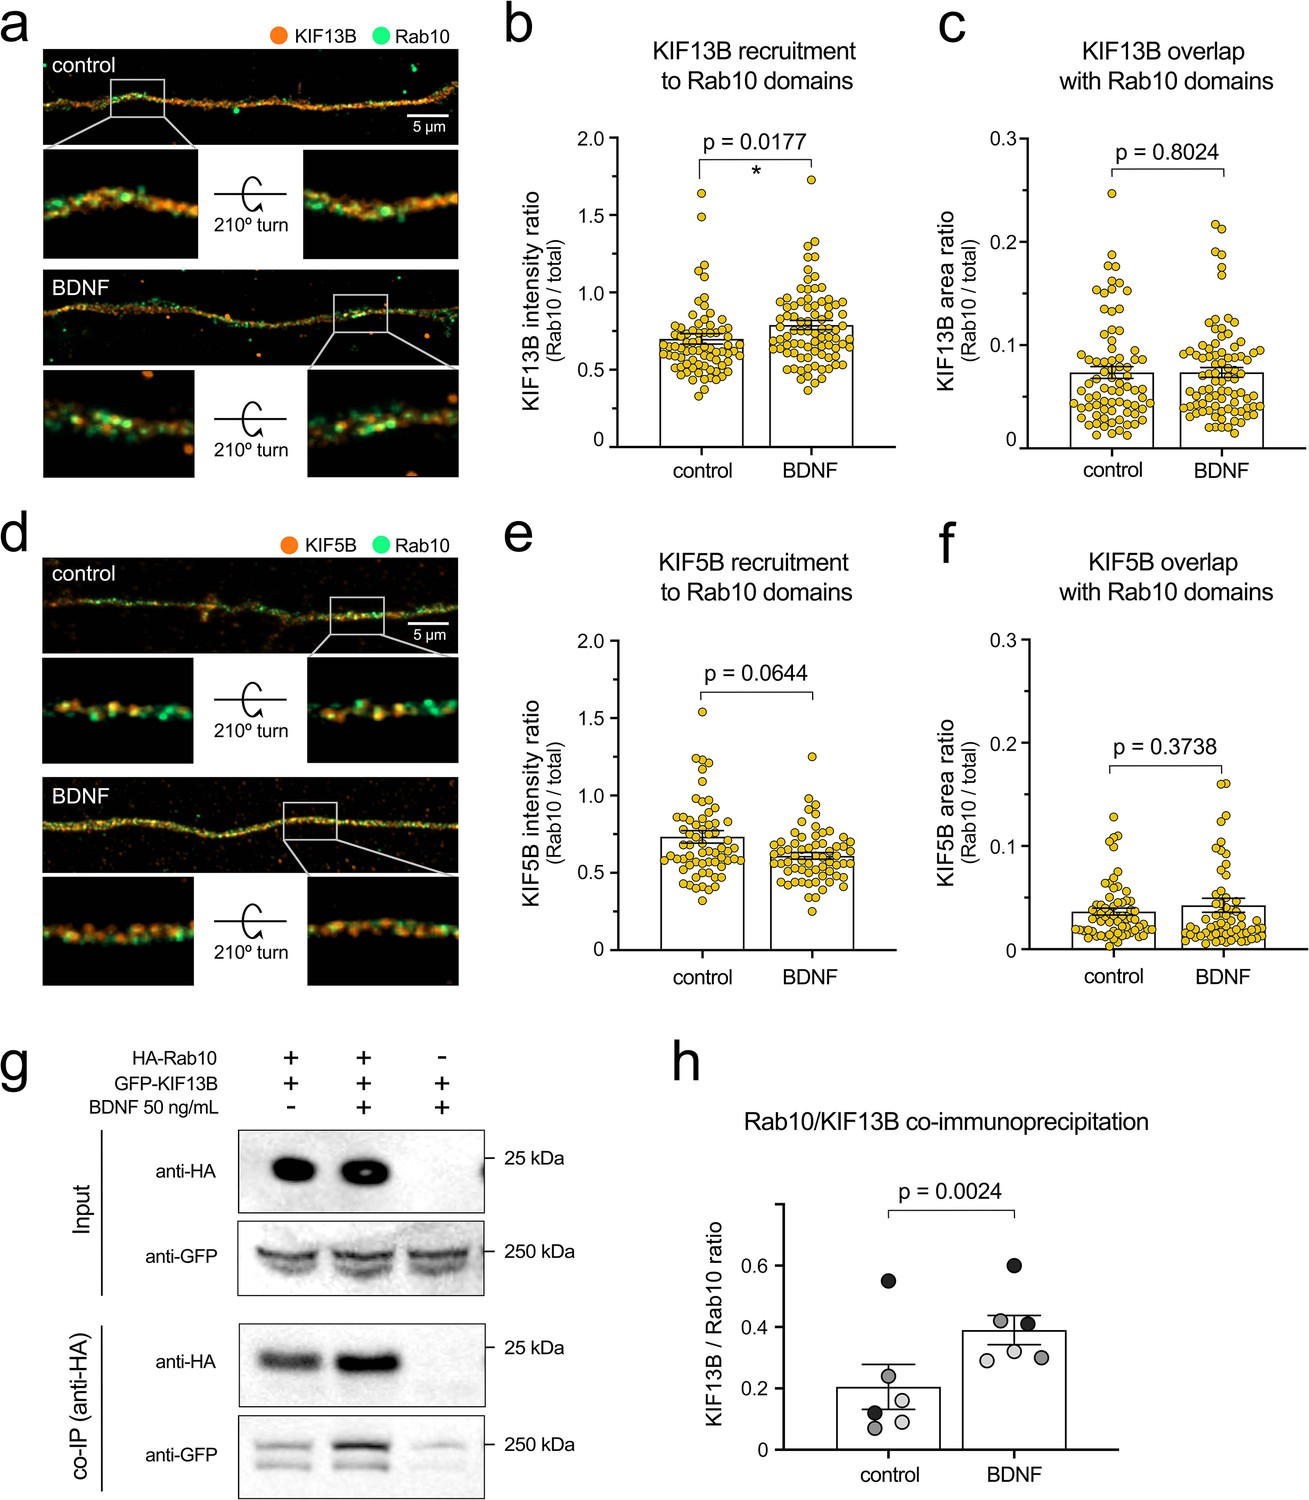
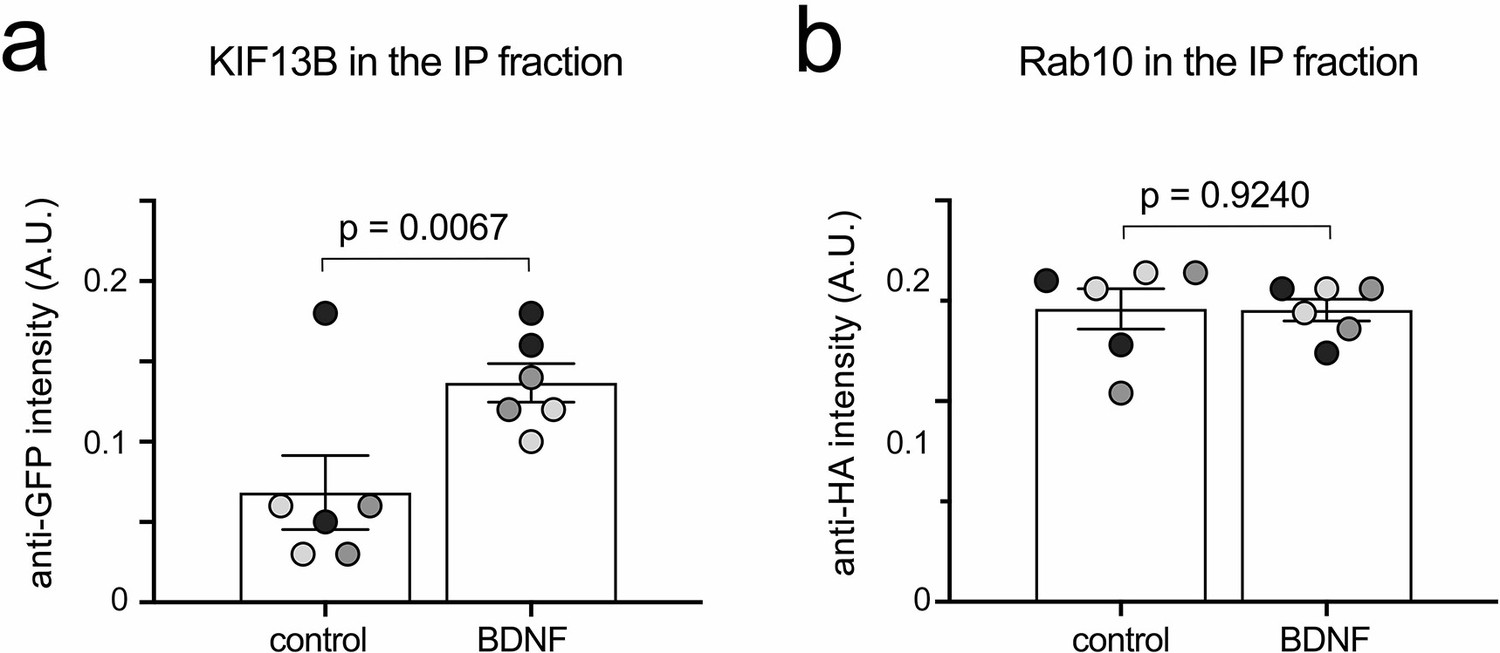
Brain-derived neurotrophic factor (BDNF) increases recruitment of KIF13B to Rab10 domains.
(a) The co-distribution of endogenous KIF13B (orange) and Rab10 (green) was monitored using high-resolution Airyscan confocal microscopy in axons of neurons with or without BDNF for 30 min. Top images correspond to maximum projection of z-stacks, scale bar = 5 µm. A 3D reconstruction of the inset area (grey frame) is shown for each top image on its original position and after turning the image 210° around the x axis. (b) KIF13B intensity was measured in the entire axon segment and in Rab10-positive areas, and the intensity ratio was plotted and analysed showing a significant enrichment of KIF13B in Rab10 areas upon 30 min of BDNF stimulation (Kolmogorov–Smirnoff nonparametric t test, t(79.5), p-value = 0.0177). (c) Ratio between KIF13B-positive area that overlaps with Rab10 from total KIF13B area was plotted, finding no difference between neurons starved or incubated with BDNF 30 min (Kolmogorov–Smirnoff nonparametric t test, t(79.5), p-value = 0.8024). (d) Co-distribution of KIF5B (orange) and Rab10 (green) was also analysed and displayed as in (a). Scale bar = 5 µm. Insets show 3D reconstructions on their original and rotated position. (e) Quantification of intensity ratio of KIF5B in Rab10 domains versus total KIF5B in the axon shows no significant difference between starved and BDNF-treated neurons (Kolmogorov–Smirnoff nonparametric t test, t(62.5), p-value = 0.0644). (f) Proportion of the KIF5B-positive area that overlaps with Rab10 is lower than KIF13B and is not altered by BDNF stimulation (Kolmogorov–Smirnoff nonparametric t test, t(62.5), p-value = 0.3738). (g) The interaction of HA-Rab10 and GFP-KIF13B from N2A cells is modulated by BDNF. Top panel: representative western blot showing the presence of both proteins in the lysate (input). Bottom panel: Western blot of co-immunoprecipitated samples from the same experiment using an antibody against the HA tag. (h) Quantification of the ratio between normalised KIF13B and Rab10 in three independent experiments. Western blots have been done in duplicate, and the corresponding paired experiments are indicated by data points of the same shade of grey. Groups were compared using paired Student’s t test, t(6), p-value = 0.0024. Source data of the plots have been included in Figure 6—source data 1.
-
Figure 6—source data 1
Data tables for each plot presented in Figure 6 are given as individual CSV files, as well as unedited representative blots used in Figure 6g.
Total cell extracts are labelled as input, and eluates from the immunoprecipitation are labelled as immunoprecipitation. Antibodies used for each membrane are indicated. Red frames indicate the bands that are shown in the main figure.
- https://cdn.elifesciences.org/articles/81532/elife-81532-fig6-data1-v1.zip
Figure 6—figure supplement 1
Co-immunoprecipitation of HA-Rab10 and GFP-KIF13B.
Quantification of the GFP-KIF13B (a) and HA-Rab10 (b) pulled down used to compute the ratio of the Figure 6h.
Figure 6—figure supplement 2
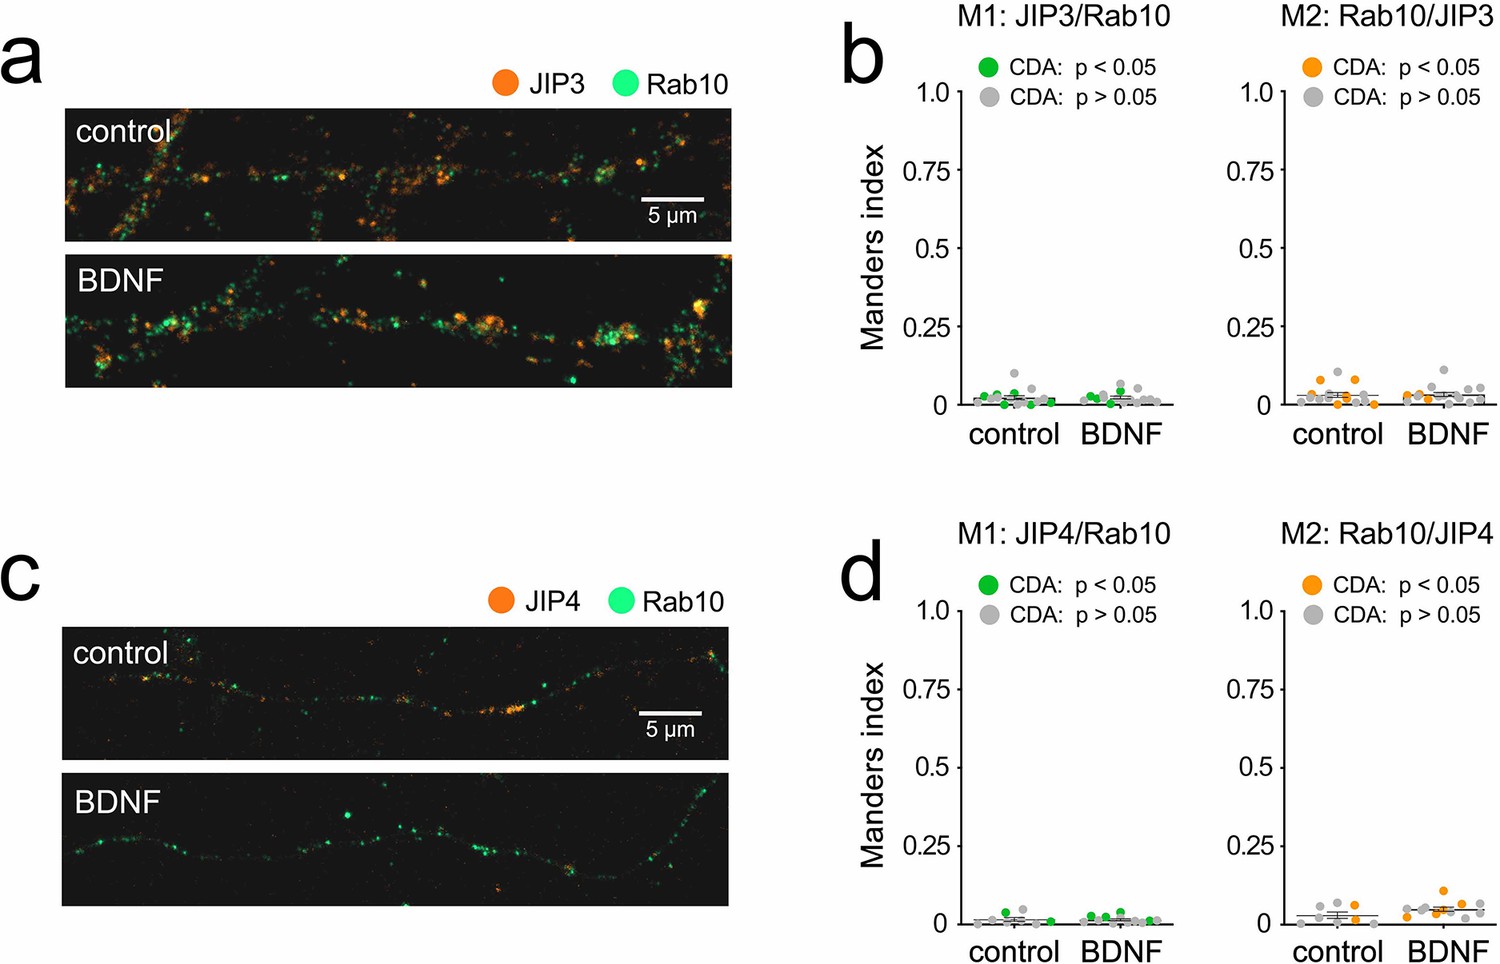
Co-localisation of Rab10 and JIP3/JIP4.
Preliminary results showing (a and c) representative images of axons stained for Rab10 (green) and JIP3 or JIP4 (orange) and (b and d) Manders co-localisation coefficients for control versus brain-derived neurotrophic factor (BDNF)-treated axons, showing that only ~2% of JIP3 or JIP4 is in Rab10-positive domains, with no change upon treatment with 50 ng/mL BDNF for 30 min.
Figure 7

Rab10 regulates sorting of TrkB out of early endosomes.
(a) Main hypotheses about the role of Rab10 regulating the sorting of TrkB to signalling endosomes include recycling back to the plasma membrane or sorting of TrkB receptors out of early endosomes to retrograde carriers. (b) Top: diagram of the experiment showing TrkB-Flag receptors on the axonal surface bound to anti-Flag antibodies (green). After internalisation, the remaining anti-Flag is removed from the surface and the labelled receptor that recycled to the plasma membrane is chased with a secondary antibody (orange). Bottom: representative examples of internalised TrkB (green) and recycled TrkB (orange) in axons from neurons transfected with EGFP or a Rab10 DN mutant. (c) Normalised recycling shows no difference between EGFP and Rab10 DN transfected neurons. Unpaired Student’s t-test, t(60.40), p-value = 0.3914. (d) Top: diagram of the internalisation of TrkB-flag labelled with anti-Flag antibodies (orange) to Rab5-positive early endosomes (green). Bottom: representative thresholded microscopy images from the axon of neurons transfected with EGFP or Rab10DN mutant. While the amount of orange puncta is similar in both conditions, yellow areas showing co-localisation of internalised TrkB and Rab5 are increased upon Rab10 DN expression. (e) Quantification of co-localisation between internalised TrkB-Flag and endogenous Rab5 is significantly higher in neurons expressing Rab10DN compared to EGFP. Unpaired Student’s t-test, t(38.22), p-value = 0.008. Significant co-localisation according to confined-displacement algorithm (CDA) (p-value < 0.05 compared to randomised signal) is shown with black circles, while inconclusive co-localisation (p-value > 0.05) is shown in grey. Scale bars = 5 µm. Source data of the plots have been included in Figure 7—source data 1.
-
Figure 7—source data 1
Data tables for each plot presented in Figure 7 are given as individual CSV files.
- https://cdn.elifesciences.org/articles/81532/elife-81532-fig7-data1-v1.zip
Figure 8
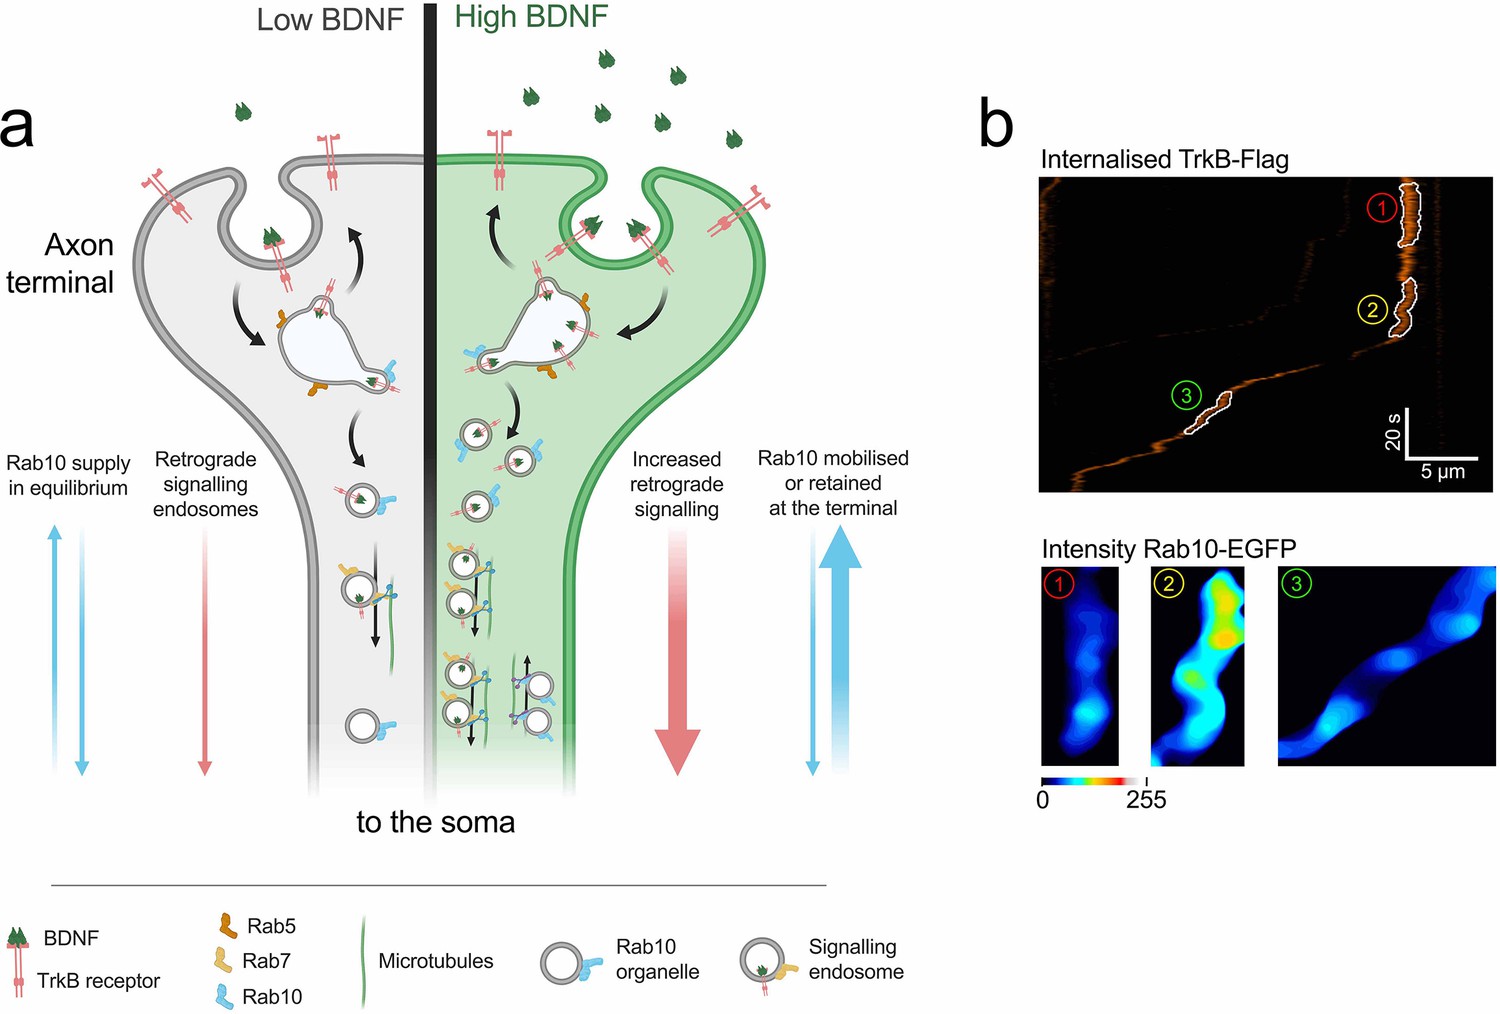
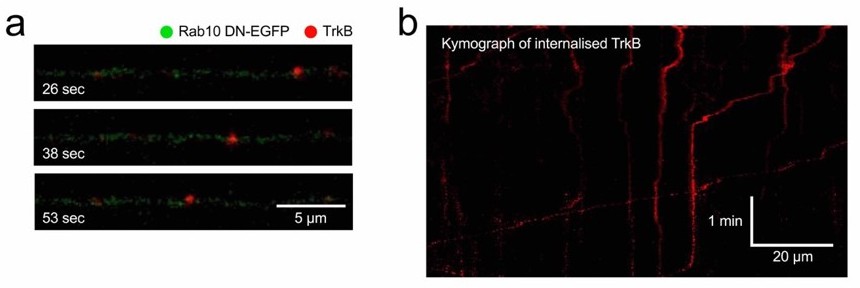
Model: role of Rab10 in the sorting of TrkB to retrograde axonal transport.
(a) At steady state, low concentrations of BDNF (grey side of the terminal) induce basal levels of TrkB internalisation. Rab10 supply (blue arrows) is in equilibrium and it mediates a baseline level of TrkB retrograde transport (pink arrows). Upon increase of BDNF (green side of the axon terminal), TrkB endocytosis as well as the proportion of Rab10 organelles moving towards the axon terminal are increased. Increased amounts of Rab10 result in further facilitation of the sorting of TrkB out of early endosome and an augmented flow of retrograde signalling carriers. (b) This model predicts that the transition from stationary early endosomes to processive retrograde carriers would be preceded by the focal recruitment of Rab10. The top panel shows an example of a kymograph of internalised TrkB-Flag in the axon. In the kymograph, three segments have been highlighted: (1) stationary phase, (2) transition phase, and (3) retrograde transport phase. The bottom panel shows the levels of EGFP-Rab10 in these segments, which clearly demonstrates the enhanced recruitment of Rab10 during the transition phase, before onset of transport.
Author response image 1
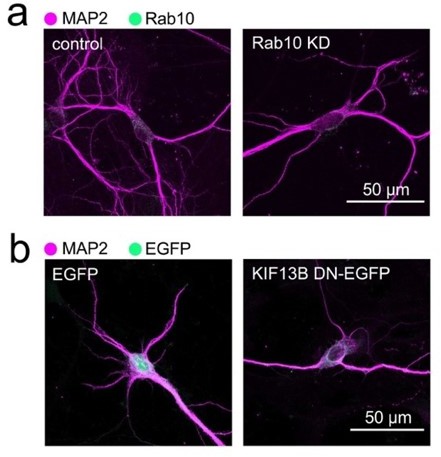
Comparison of the morphological changes of hippocampal neurons treated with shRNA directed against Rab10 or transfected with a dominant negative version of KIF13B. Neurons in (a) have been transduced with a doxycycline-inducible shRNA system to knock down Rab10 and treated with doxycycline for 48 hours, as indicated in the main Figure 1. In this example, the decrease of Rab10 expression is concomitant with a reduction of dendritic complexity similar to the observed in neurons that have been expressing a motorless mutant of KIF13B (KIF13B DN) for 48 hours (b). Scale bars, 50 µm.
Author response image 2
Retrograde transport of TrkB in neurons expressing Rab10 DN.
Using the same methods illustrated in Figure 4ad, TrkB-Flag was internalised and axons of neurons expressing Rab10 DN were imaged. (a) Example of a retrograde TrkB carrier. (b) Kymograph showing several cargoes with different degrees of processivity and pausing frequency.
Author response image 3
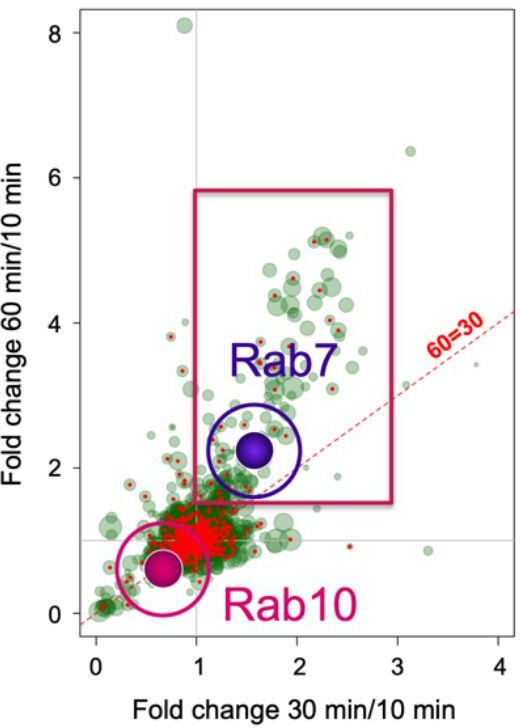
Rab10 and Rab7 show different recruitment behaviour in signalling endosomes.
Cross correlation of the enrichment of >2,000 proteins detected from immunoisolated HcT-containing signalling endosomes purified from mouse stem cell-derived motor neurons. Rab7 has been highlighted as example of a protein that is enriched at later time points, whereas Rab10 is preferentially associated to early compartments. Modified from Debaisieux et al. 2016 [ref. 18].
Author response image 4

Tables
Key resources table
| Reagent type (species) or resource | Designation | Source or reference | Identifiers | Additional information |
|---|---|---|---|---|
| Antibody | Goat polyclonal anti-Rab10 | Santa Cruz Biotechnologies | Cat#sc-6564; RRID:AB_2237844 | 1:50 |
| Antibody | Mouse monoclonal anti-Rab10 | Abcam | Cat#ab104859; RRID:AB_10711207 | 1:200 |
| Antibody | Rabbit monoclonal anti-Rab10 | Cell Signalling | Cat#8127; RRID:AB_10828219 | 1:200 |
| Antibody | Rabbit monoclonal anti-TrkB | Merck (Millipore) | Cat#AB9872; RRID:AB_11214317 | 1:200 |
| Antibody | Chicken polyclonal anti-tubulin ßIII | Synaptic Systems | Cat#302 306; RRID:AB_2620048 | 1:300 |
| Antibody | Rabbit monoclonal anti-phosphorylated CREB | Abcam | Cat#ab32096; RRID:AB_731734 | 1:250 |
| Antibody | Mouse monoclonal anti-Rab7 | Abcam | Cat#ab50533, RRID:AB_882241 | 1:200 |
| Antibody | Rabbit polyclonal anti-Rab5 | Abcam | Cat#ab13253; RRID:AB_299796 | 1:200 |
| Antibody | Rabbit polyclonal anti-KIF13B | Bioss | Cat#bs-12387R; RRID:AB_2895287 | 1:200 |
| Antibody | Rabbit polyclonal anti-KIF5B | Abcam | Cat#ab5629; RRID:AB_2132379 | 1:200 |
| Antibody | Mouse monoclonal anti-GFP (B-2) | Santa Cruz Biotechnologies | Cat#sc-9996; RRID: AB_627695 | 1:1000 |
| Antibody | Mouse monoclonal anti-HA (12CA5) | Cancer Research UK | Cat#12CA5; RRID:AB_2920713 | 1:1000 |
| Antibody | Mouse monoclonal anti-Flag (M1) | Sigma | Cat#F3040; RRID:AB_439712 | 1:200 |
| Antibody | Rabbit polyclonal anti-p75NTR | Cancer Research UK | Cat#CRD5410; RRID:AB_2864325 | 1:200 |
| Recombinant DNA reagent | TET ON Advance | Takara Bio (Clontech) | Cat#630930 | |
| Recombinant DNA reagent | pLVX shRNA Rab10 | This study | The shRNA MSH031352 from GeneCopoeia targeting Rab10 has been cloned into a pLVX tight puro plasmid | |
| Recombinant DNA reagent | pLVX mCherry-Rab10 | This study | A mouse mCherry-Rab10 has been cloned into a pLVX tight puro inducible lentiviral vector using XbaI/NheI | |
| Recombinant DNA reagent | pLVX myc-Rab10 (shRNA resistant) | This study | From the pLVX mCherry-Rab10, mCherry has been replaced by myc, and 3 silent mutations have been introduced | |
| Recombinant DNA reagent | pEGFP-C1 | Clontech | Discontinued | |
| Recombinant DNA reagent | EGFP-Rab10 WT | DOI:10.1111/j.1462–5822.2010.01468.x | RRID:Addgene_49472 | Marci Scidmore lab |
| Recombinant DNA reagent | EGFP-Rab10 T23N; Rab10DN | DOI:10.1111/j.1462–5822.2010.01468.x | RRID:Addgene_49545 | Marci Scidmore lab |
| Recombinant DNA reagent | EGFP-Rab10 Q68L | DOI:10.1111/j.1462–5822.2010.01468.x | RRID:Addgene_49544 | Marci Scidmore lab |
| Recombinant DNA reagent | HA-Rab10 WT | MRC Protein Phosphorylation and Ubiquitylation Unit | DU44250 | Dario Alessi lab |
| Recombinant DNA reagent | GFP-KIF13B | 10.1111/tra.12692 | RRID:Addgene_134626 | Marvin Bentley lab |
| Recombinant DNA reagent | TrkB-FLAG | 10.1091/mbc.e05-07-0651 | Francis Lee lab |
Table 1
Statistical summary.
| Figure | Variable | Test | Groups | Degrees of freedom | p value | |
|---|---|---|---|---|---|---|
| Figure 1 | b | Cells per field | Two-way ANOVA | Knock down; time; interaction | F(1,68) | 0.0270; 0.0406; 0.2114 |
| Multiple comparisons | Control: shRNA Rab10 at 24 hr | t(68) | >0.9999 | |||
| Multiple comparisons | Control: shRNA Rab10 at 48 hr | t(68) | 0.0183 | |||
| c | Rab10 expression | Two-way ANOVA | Knock down; time; interaction | F(1,653); F(2,653); F(2,653) | <0.0001 | |
| Multiple comparisons | Control: shRNA Rab10 at 12 hr | t(653) | 0.2012 | |||
| Multiple comparisons | Control: shRNA Rab10 at 24 hr | t(653) | <0.0001 | |||
| Multiple comparisons | Control: shRNA Rab10 at 48 hr | t(653) | <0.0001 | |||
| Figure 2 | d | TrkB accumulation | Unpaired Student’s t | Control: shRNA Rab10 | t(140) | <0.0001 |
| e | TrkB accumulation and Rab10 expression | Pearson r | Control: shRNA Rab10 | XY pairs = 131 | <0.0001 | |
| g | pCREB abundance | One-way ANOVA | Control, shRNA Rab10 and rescue | F(2,280) | <0.0001 | |
| Multiple comparisons | Control: shRNA Rab10 | t(280) | <0.0001 | |||
| Multiple comparisons | Control: rescue | t(280) | 0.0336 | |||
| Figure 3 | c | Co-localisation Rab10 and Rab5 | Unpaired Student’s t | M1 control: BDNF | t(46.27) | 0.0244 |
| Unpaired Student’s t | M2 control: BDNF | t(48.94) | 0.4794 | |||
| d | Co-localisation Rab10 and Rab7 | Unpaired Student’s t | M1 control: BDNF | t(72.32) | 0.0621 | |
| Unpaired Student’s t | M2 control: BDNF | t(62.33) | 0.1043 | |||
| e | Area of overlay HcT and TrkB (retrograde TrkB) | One-way ANOVA | 30, 60, and 90 min | F(2,72) | <0.0001 | |
| Multiple comparisons | 30:60 min | t(72) | >0.9999 | |||
| Multiple comparisons | 60:90 min | t(72) | 0.0002 | |||
| Area of overlay retrograde TrkB and Rab10 | One-way ANOVA | 30, 60, and 90 min | F(2,72) | 0.2730 | ||
| Multiple comparisons | 30:60 min | t(72) | 0.5717 | |||
| Multiple comparisons | 60:90 min | t(72) | >0.9999 | |||
| Figure 5 | c | Direction of Rab10 organelles | Unpaired Student’s t | Anterograde pre: post BDNF | t(14) | 0.0150 |
| Unpaired Student’s t | Retrograde pre: post BDNF | t(14) | 0.0030 | |||
| Unpaired Student’s t | Non-mobile pre: post BDNF | t(14) | 0.4278 | |||
| Figure 6 | b | KIF13B intensity ratio | Kolmogorov–Smirnov Student’s t | Control: BDNF | t(79.5) | 0.0177 |
| c | KIF13B area occupancy ratio | Kolmogorov–Smirnov Student’s t | Control: BDNF | t(79.5) | 0.8024 | |
| e | KIF5B intensity ratio | Kolmogorov–Smirnov Student’s t | Control: BDNF | t(62.5) | 0.0644 | |
| f | KIF5B area occupancy ratio | Kolmogorov–Smirnov Student’s t | Control: BDNF | t(62.5) | 0.3738 | |
| h | KIF13B co-immunoprecipitation | Paired Student’s t | Control: BDNF | t(6) | 0.0024 | |
| Figure 7 | c | Recycling of TrkB | Unpaired Student’s t | EGFP: Rab10 DN | t(60.40) | 0.3914 |
| e | Co-localisation TrkB and Rab5 | Unpaired Student’s t | EGFP: Rab10 DN | t(38.22) | 0.0080 | |
Additional files
Download links
A two-part list of links to download the article, or parts of the article, in various formats.
Downloads (link to download the article as PDF)
Open citations (links to open the citations from this article in various online reference manager services)
Cite this article (links to download the citations from this article in formats compatible with various reference manager tools)
Rab10 regulates the sorting of internalised TrkB for retrograde axonal transport
eLife 12:e81532.
https://doi.org/10.7554/eLife.81532


