Species-specific chromatin landscape determines how transposable elements shape genome evolution
- Department of Ecology and Evolutionary Biology, University of California, Irvine, United States
Figures
Figure 1 with 8 supplements
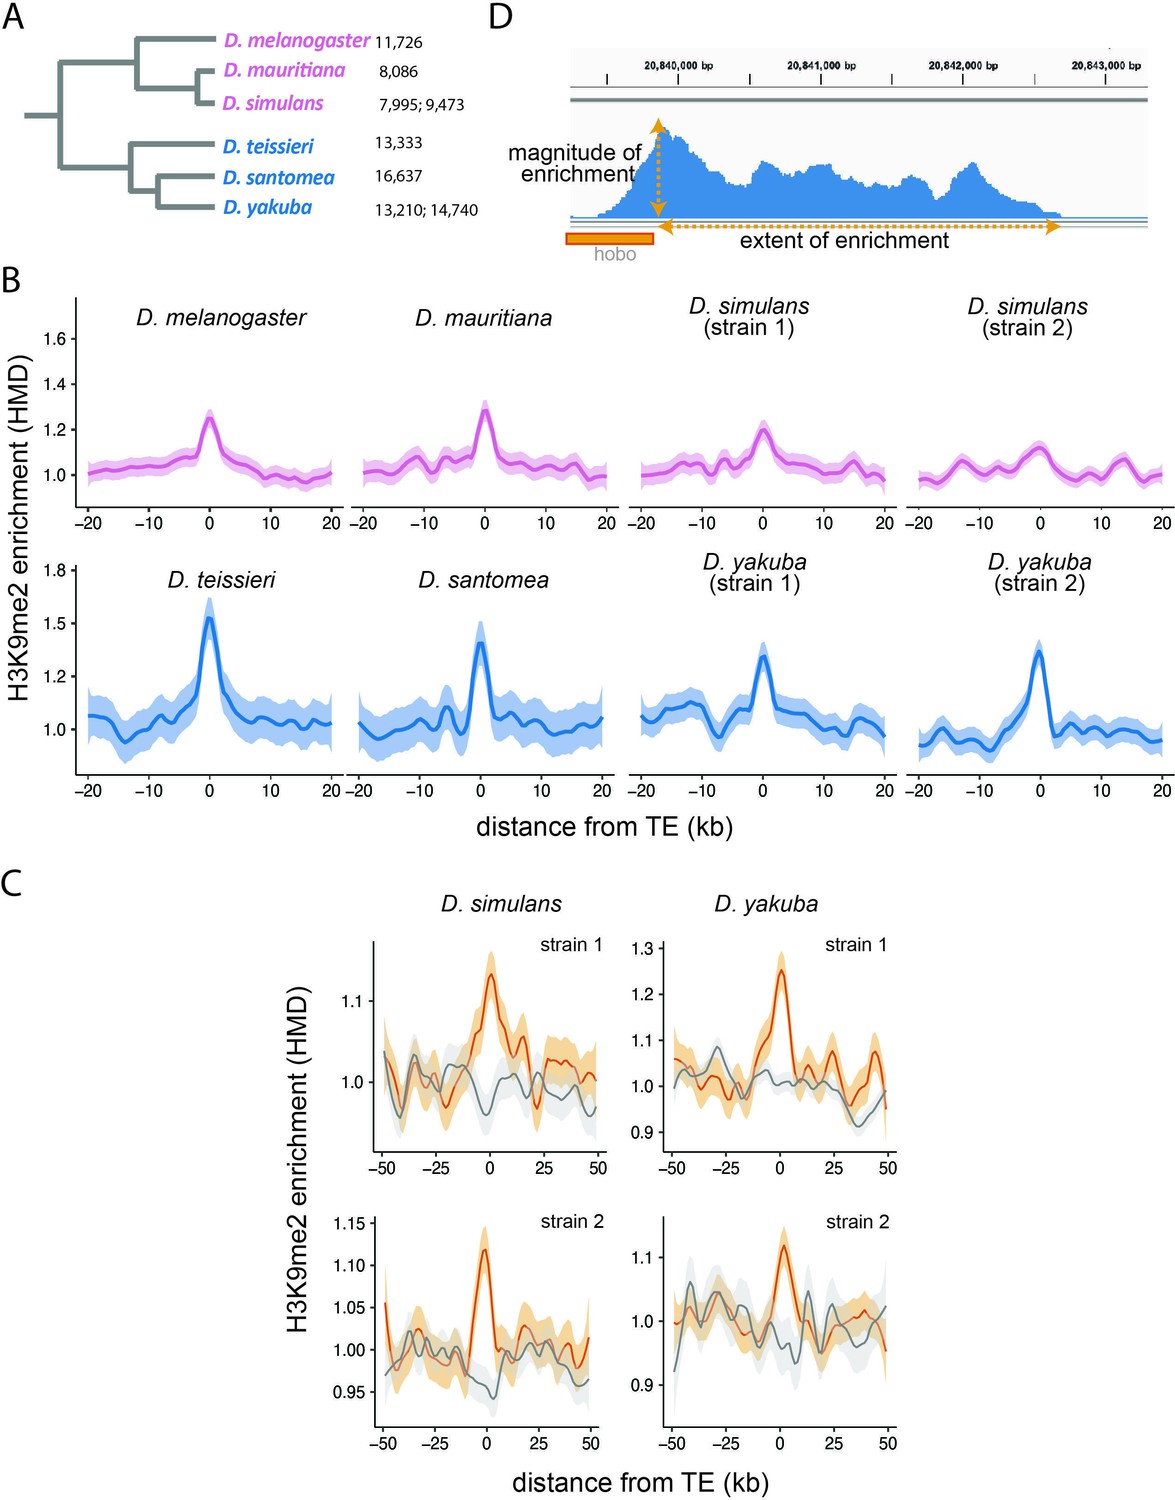
Enrichment of H3K9me2 around euchromatic transposable elements (TEs) across species.
(A) Phylogenetic relationship among species included in this study. Species in the Drosophila melanogaster complex are in pink, while those in Drosophila yakuba complex are in blue. Numbers after each species denote the number of euchromatic TEs called by RepeatModeler2, before assignment into TE families and merging of adjacent copies (see Materials and methods). (B) Genome-wide average H3K9me2 HMD levels around euchromatic TEs with LOESS smoothing (span = 15%) in studied genomes; 95% confidence interval around smooth is shown as shaded areas. (C) Genome-wide average H3K9me2 HMD levels at homologous sequences in the presence (orange) and absence (gray) of euchromatic TEs in species that have data for two strains (Drosophila simulans and D. yakuba). The average H3K9me2 HMD level was smoothed with LOESS (span = 15%) with 95% confidence intervals around smooth shown as the shaded areas. (D) An Integrated-Genome-Viewer view showing the local enrichment of H3K9me2 around a hobo TE, and the two estimates (magnitude and extent of H3K9me2 enrichment) estimated for quantifying the epigenetic effects of individual TE.
Figure 1—figure supplement 1
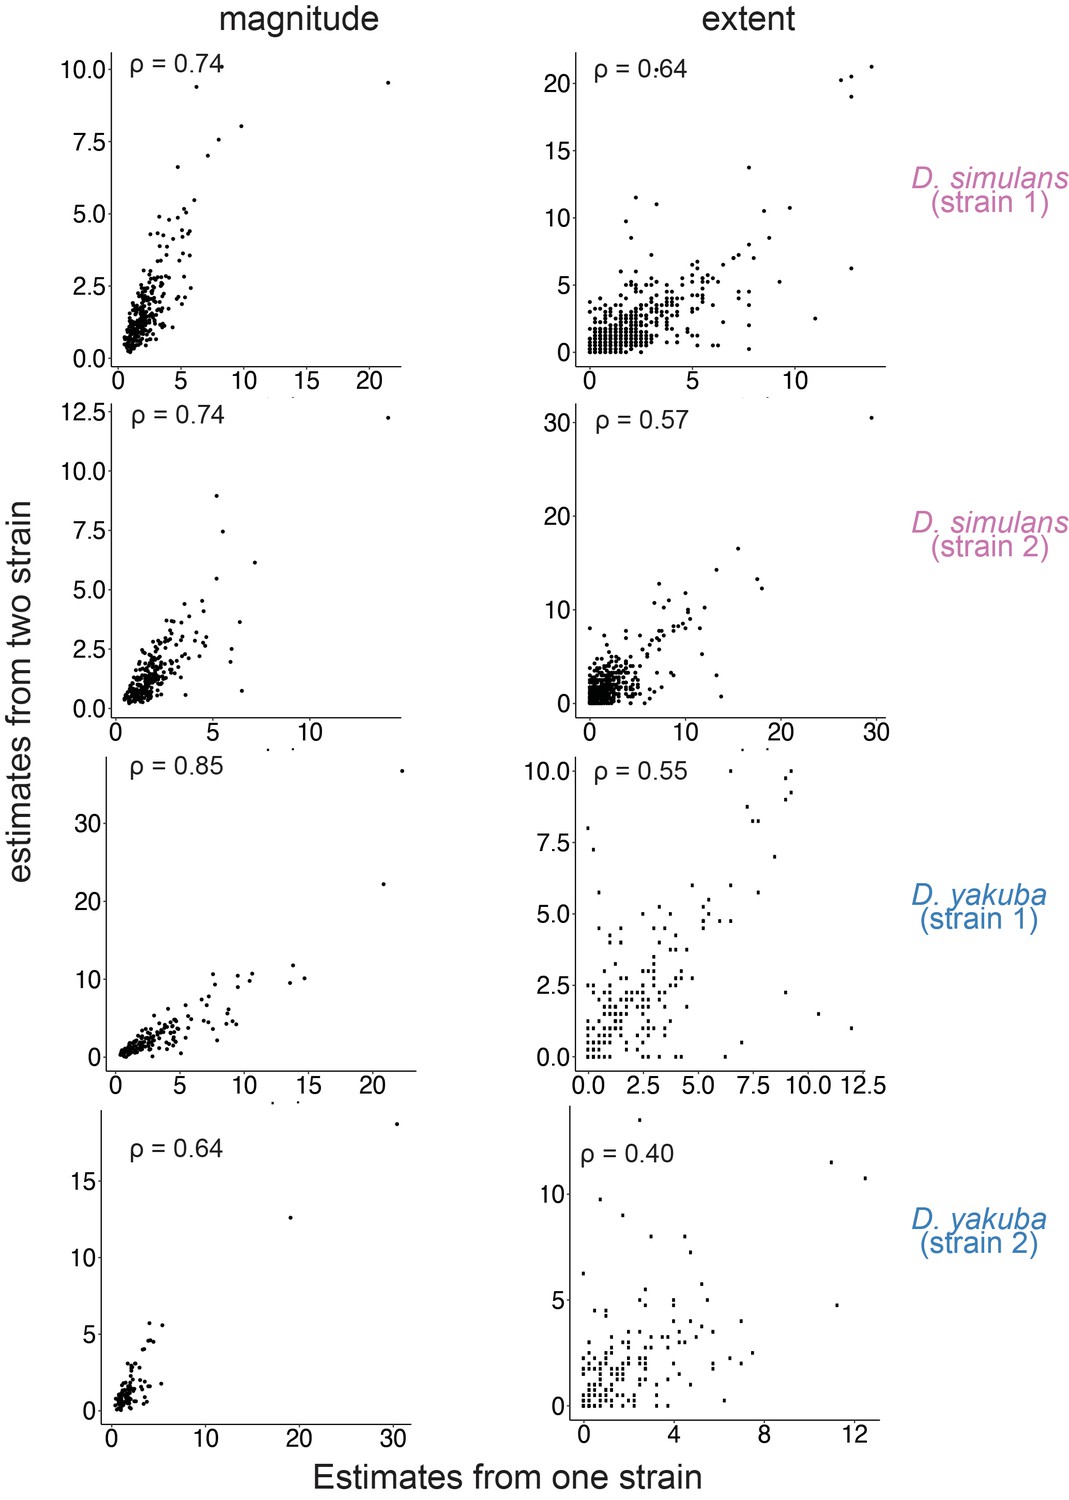
Associations between estimates for the magnitude and extent of transposable element (TE)-mediated H3K9me2 enrichment that are based on one genome (x-axis) or two genomes (y-axis).
Estimates based on one genome or two genomes strongly correlate, despite differences in the baseline used in estimating them. For estimates based on one genome, the magnitude is estimated as the H3K9me2 enrichment in 1 kb window left and right to a TE insertion. The extent is estimated as the farthest 1 kb window in which the H3K9me2 enrichment was consecutively above one. For estimates based on two genomes, the magnitude of the focal strain is normalized to the H3K9me2 enrichment at the homologous sequence in the alternative strain without the focused TE insertion. The extent is estimated as the farthest 1 kb window in which the H3K9me2 enrichment in the focal strain was consecutively above that in the alternative strain without the focused TE insertion. See Materials and methods for details. Spearman correlation coefficients (ρ) are all significantly different from 0 (p<10–10).
Figure 1—figure supplement 2
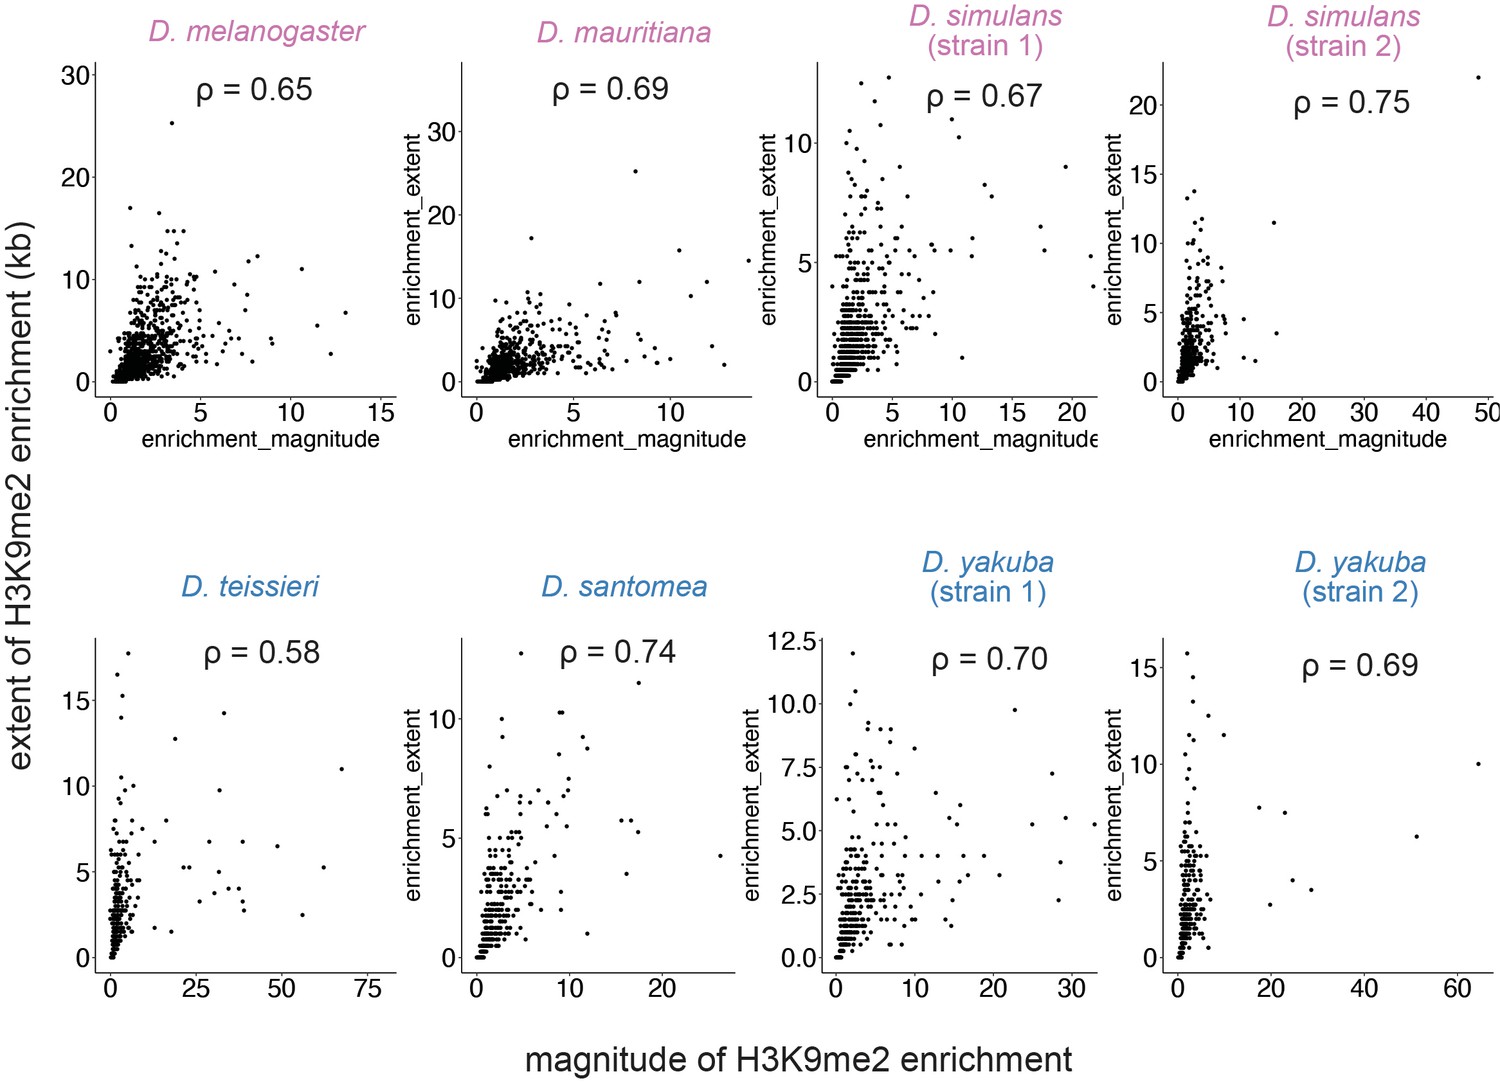
Associations between the magnitude and extent of transposable element (TE)-mediated H3K9me2 enrichment.
These two estimates strongly correlate in all genomes studied. Spearman correlation coefficients (ρ) are all significantly different from 0 (p<2.2e–16).
Figure 1—figure supplement 3

Associations between the magnitude/extent of transposable element (TE)-mediated H3K9me2 enrichment and TE length.
These two estimates weakly correlate in most species studied. The Spearman correlation coefficients (ρ) are significantly different from 0 at **p<0.01 and *p<0.05.
Figure 1—figure supplement 4

The magnitude and extent of transposable element (TE)-mediated H3K9me2 enrichment for TEs that are full length (at least 70% of canonical sequence length) and truncated.
Categorization using different length thresholds (60% and 80%) reached similar conclusions. Mann-Whitney U test, ***p<0.001, **p<0.01, *p<0.05.
Figure 1—figure supplement 5
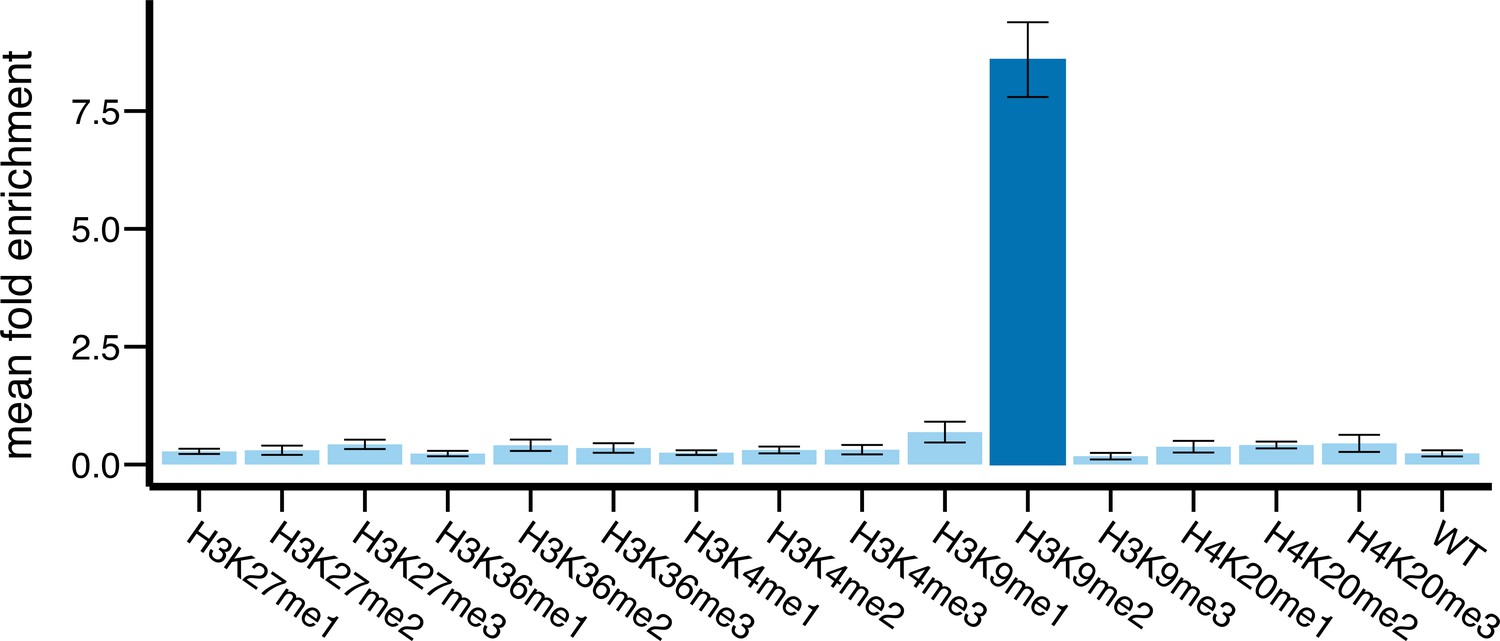
Antibody specificity assay using SNAP-ChIP K-MetStat Panel.
Mean fold enrichment of IP to input samples for different histone modifications in the SNAP-ChIP K-MetStat Panel shows that the antibody used (abcam 1220) is highly specific to H3K9me2, the targeted histone modification. Fold enrichment is estimated as (% of reads in IP)/(% of reads in input), with % of reads as the percentage of reads mapped to a specific histone modification among all the reads mapped to SNAP-ChIP K-MetStat Panel barcodes. WT is for histones without modifications.
Figure 1—figure supplement 6
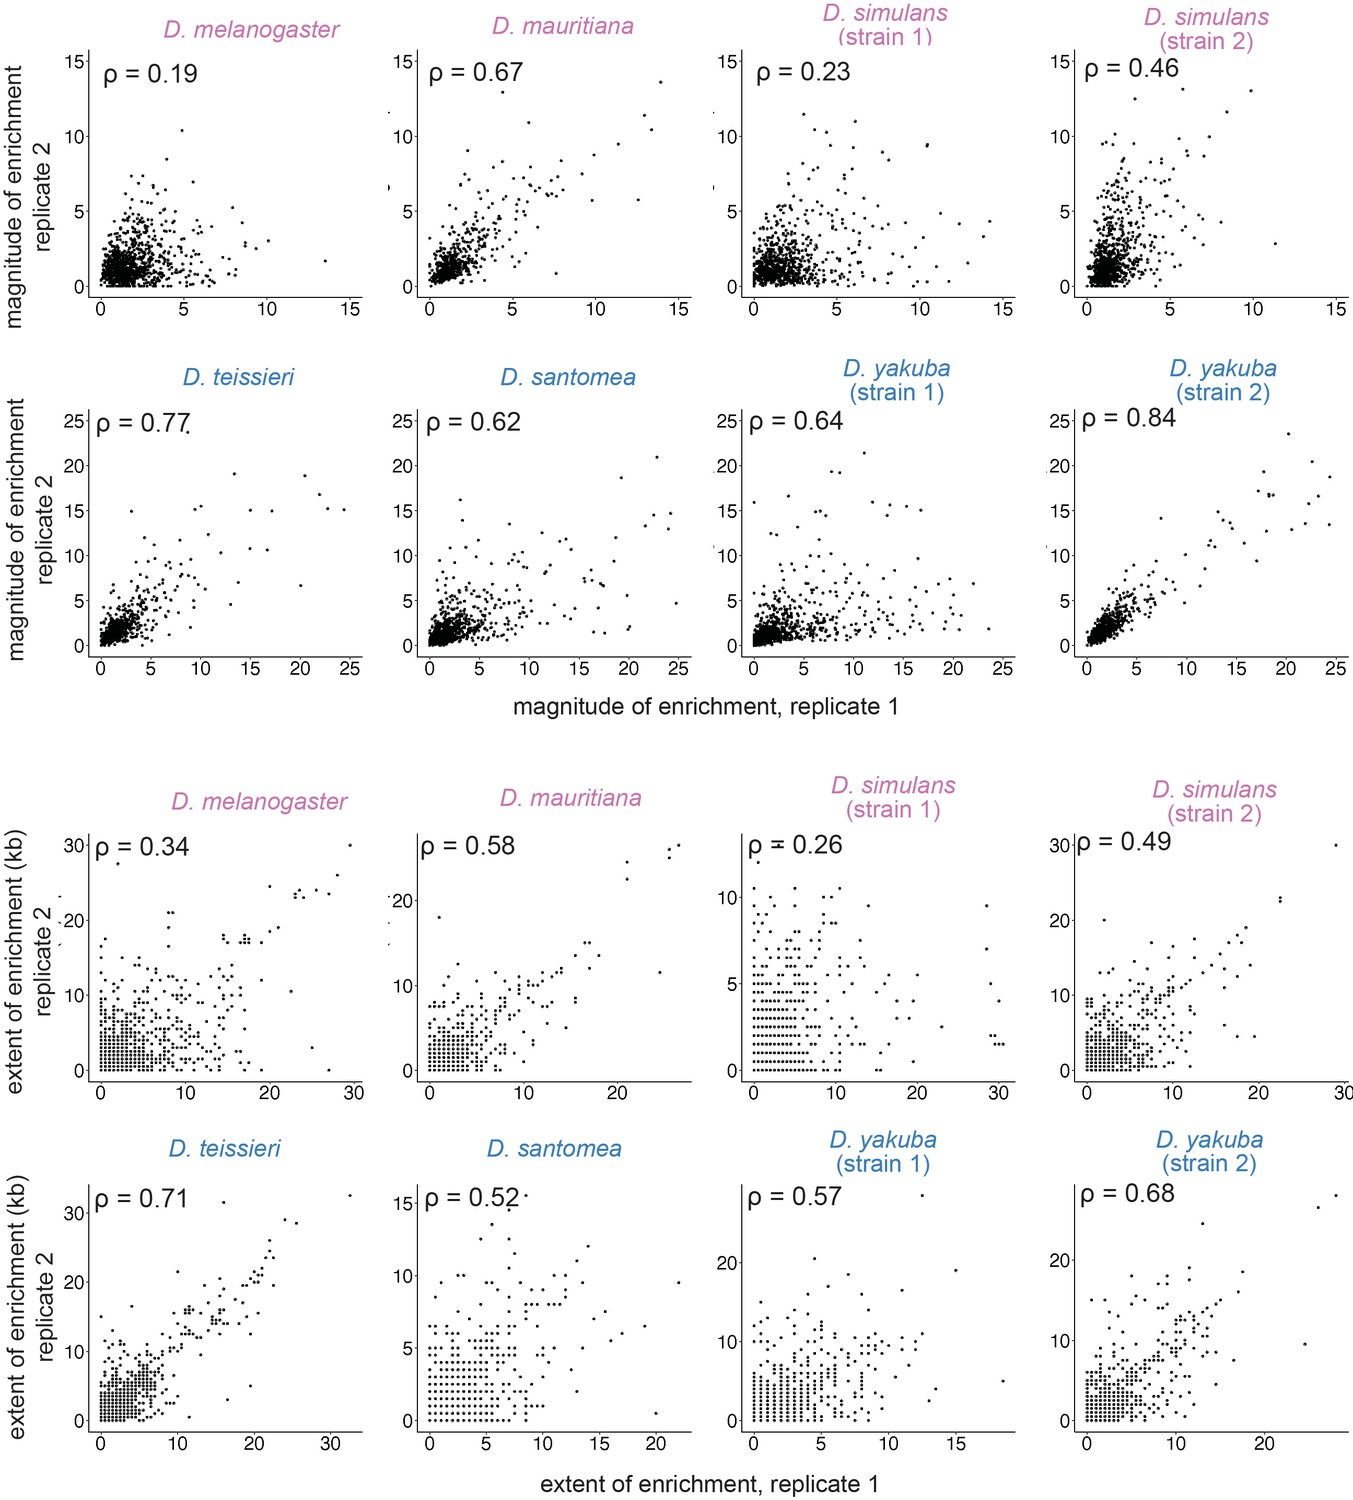
Associations between replicates for the magnitude and extent of transposable element (TE)-mediated H3K9me2 enrichment.
Estimates strongly correlate between replicates. Spearman rank correlation coefficients (ρ) are all significantly different from 0 (p<10–8).
Figure 1—figure supplement 7
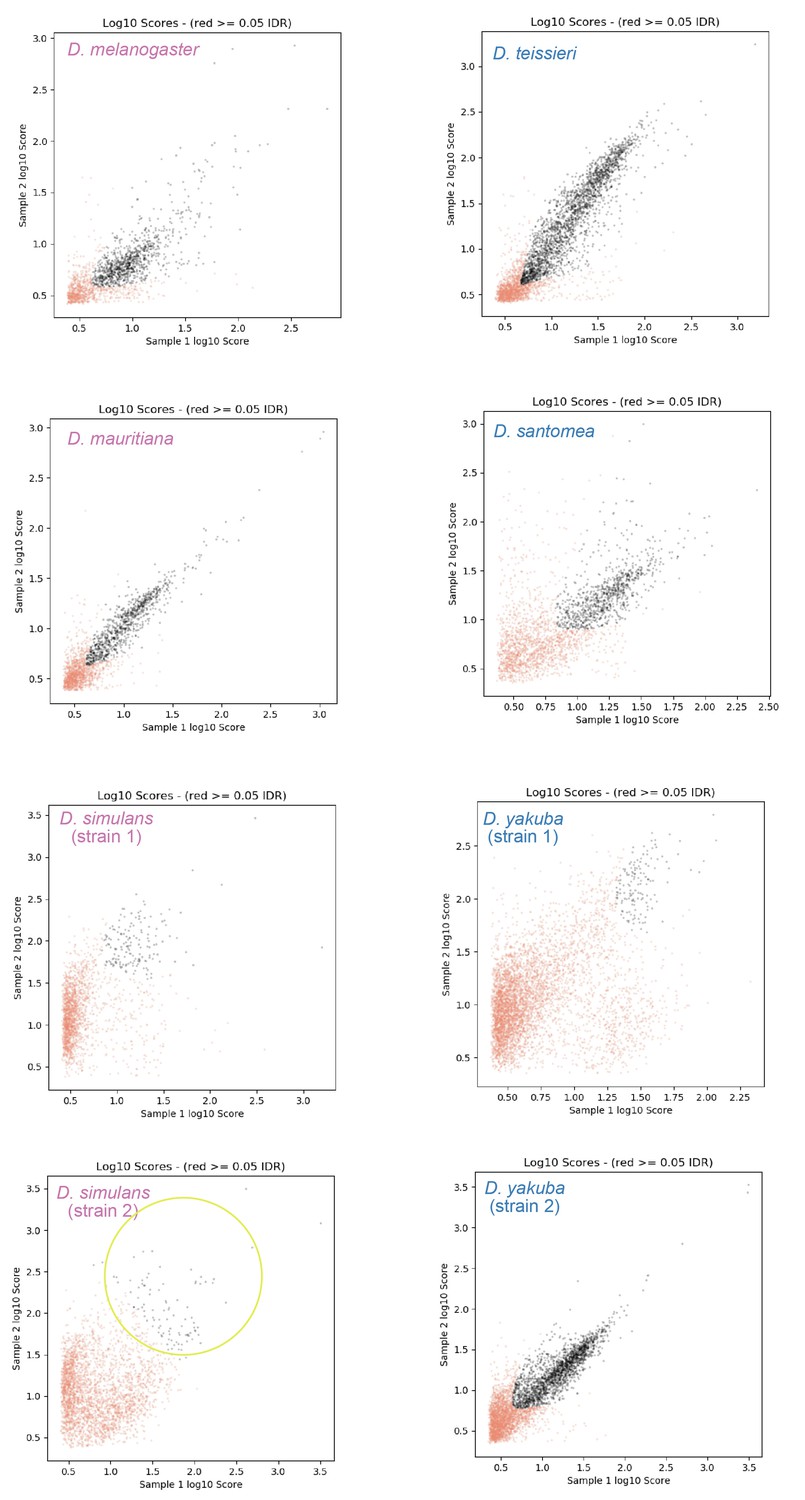
The –log10 scores for the significance of called peaks in replicates are shown on the X-Y plot, or diagnostic IDR plots.
Drosophila simulans strain 2 (yellow circle) has lower consistency among replicates than other samples (see texts for discussions).
Figure 1—figure supplement 8
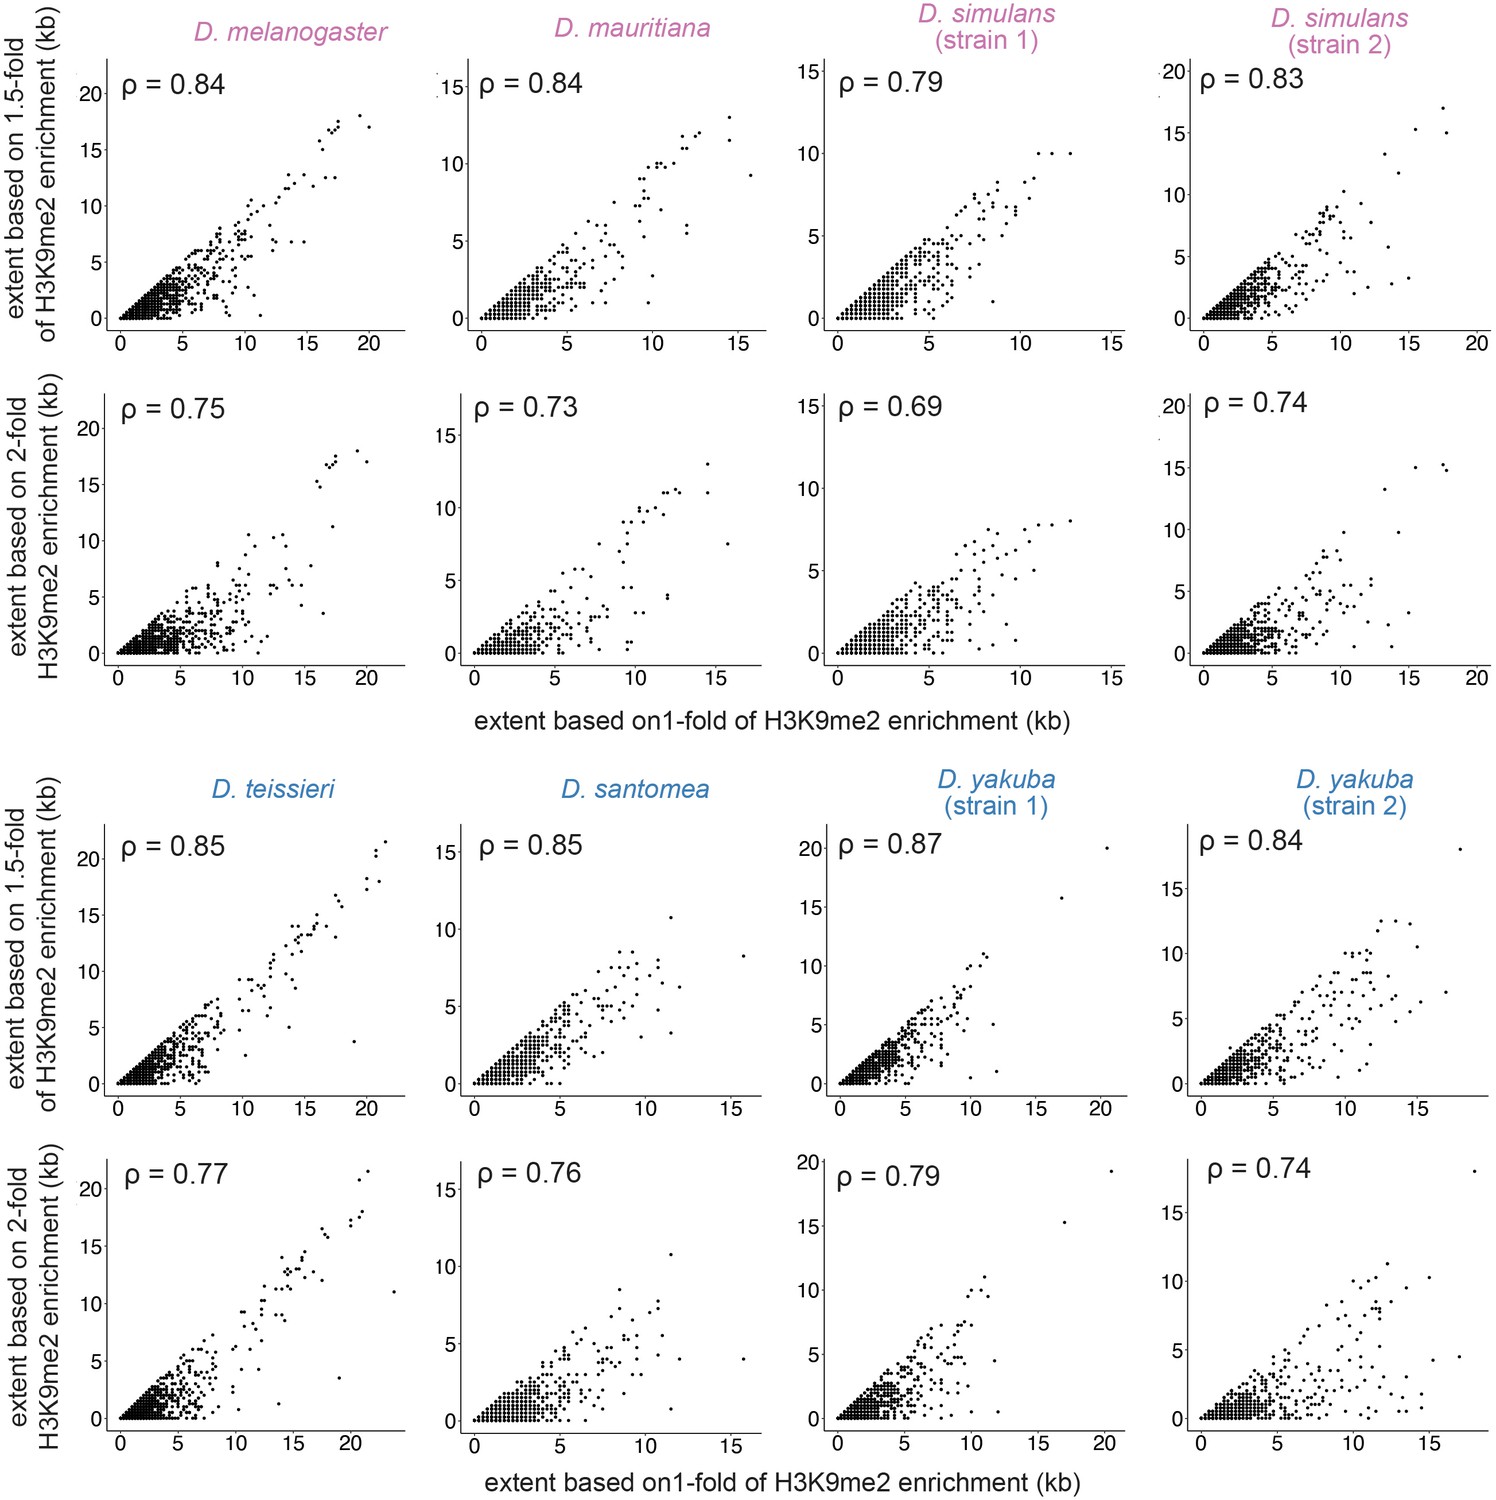
Associations for the extent of transposable element (TE)-mediated H3K9me2 enrichment with different HMD cutoffs: HMD > 1 (used threshold throughout the study), HMD > 1.5, and HMD > 2.
Estimates based on different HMD thresholds strongly correlate. Spearman rank correlation coefficients (ρ) are all significantly different from 0 (p<10–16).
Figure 2 with 4 supplements
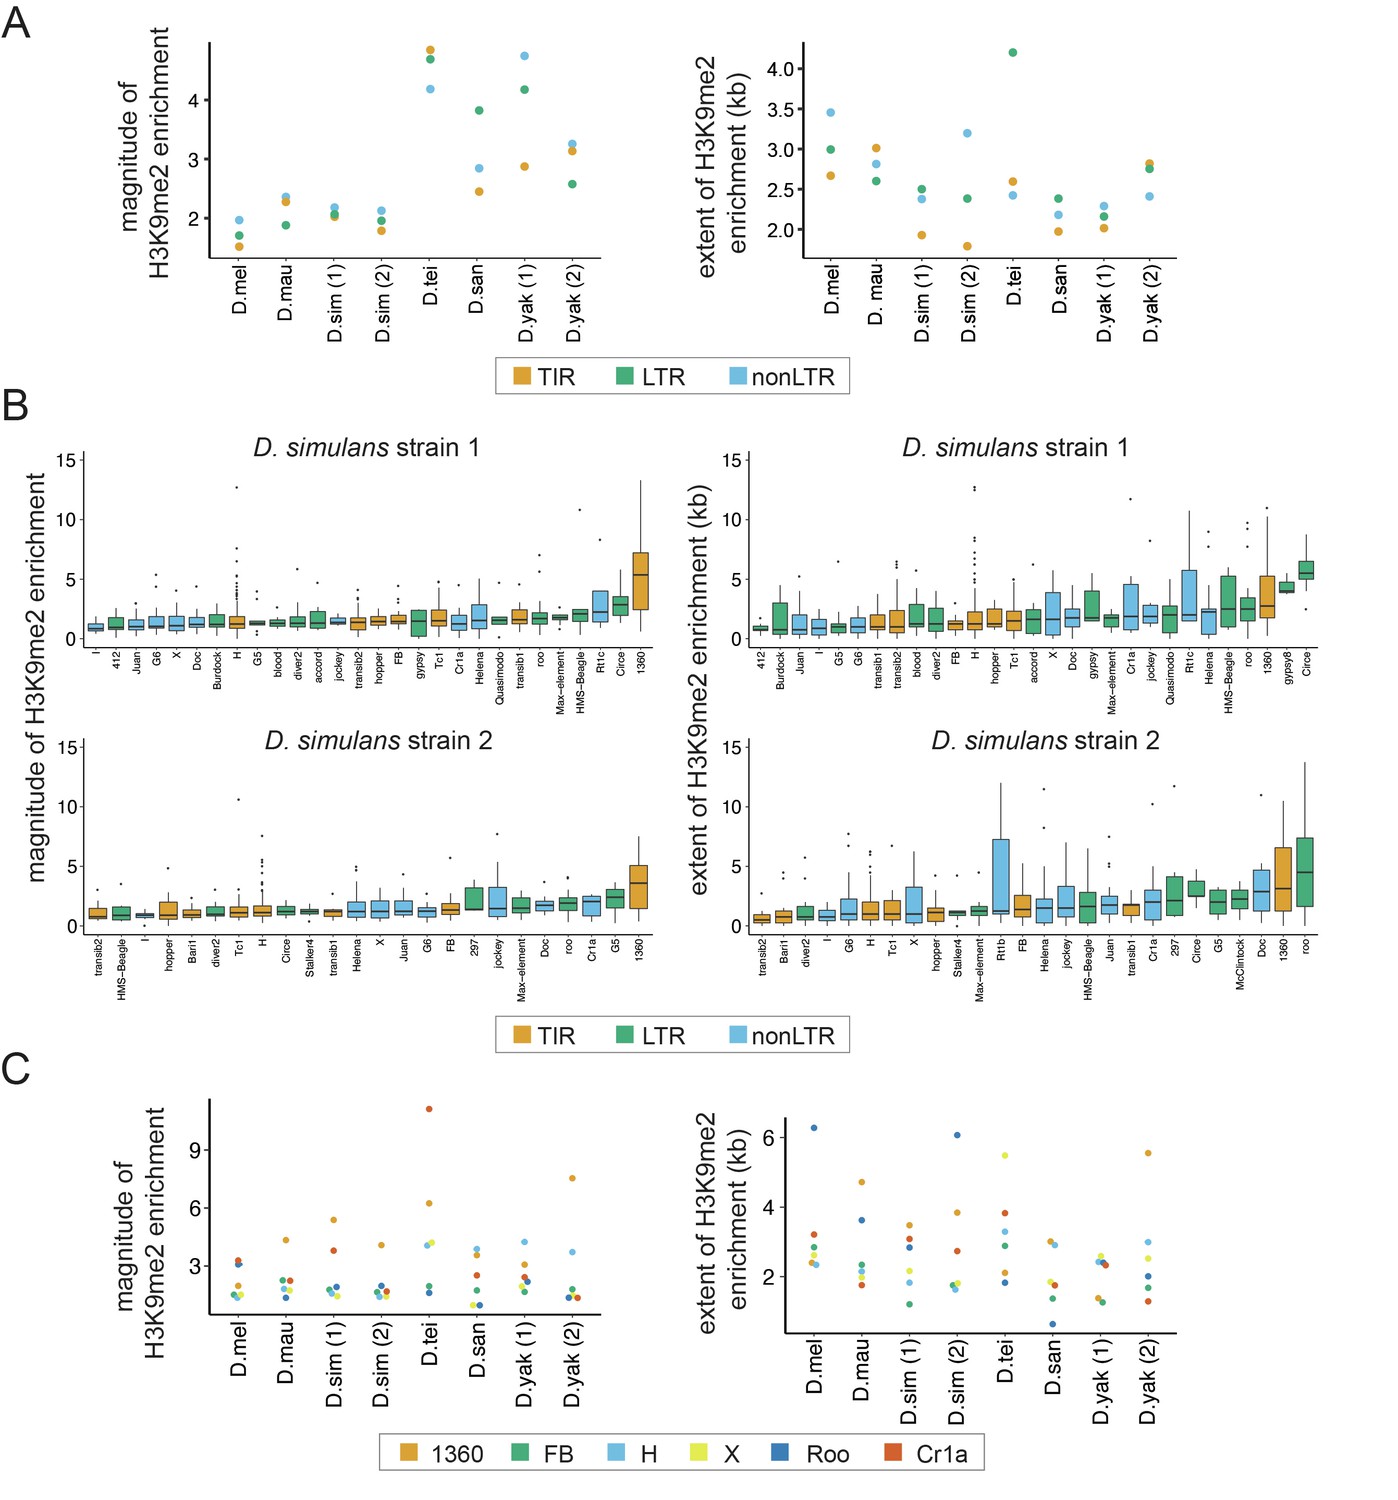
Variation in the epigenetic effects of transposable elements (TEs) within genomes.
(A) The mean magnitude (left) and extent (right) of TE-induced H3K9me2 enrichment for different types of TEs in eight genomes from six species are shown. Different colors represent TEs of different classes, including Terminal Inverted Repeat (TIR), Long Terminal Repeat (LTR), and non-Long Terminal Repeat (non-LTR, also known as LINE) insertions. (B) The magnitude (left) and extent (right) of TE-induced H3K9me2 enrichment for different TE families in the two strains of Drosophila simulans. Only TE families with at least five identified copies in a genome were included. See Figure 2—figure supplements 2 and 3 for other genomes. (C) The median magnitude (left) and extent (right) of TE-induced H3K9me2 enrichment for six TE families with at least five copies in all genomes studied.
Figure 2—figure supplement 1
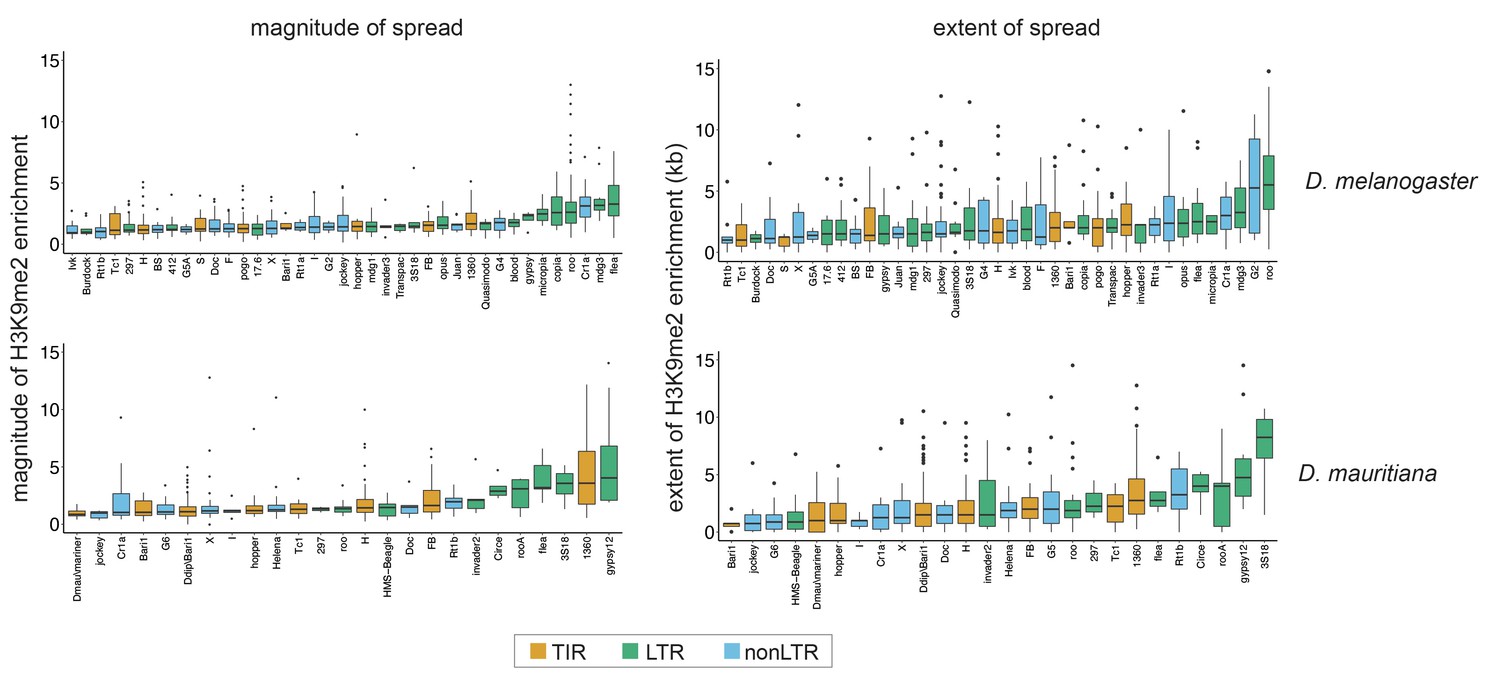
The magnitude and extent of transposable element (TE)-mediated H3K9me2 enrichment of different families for other melanogaster complex species (Drosophila melanogaster and Drosophila mauritiana).
Figure 2—figure supplement 2
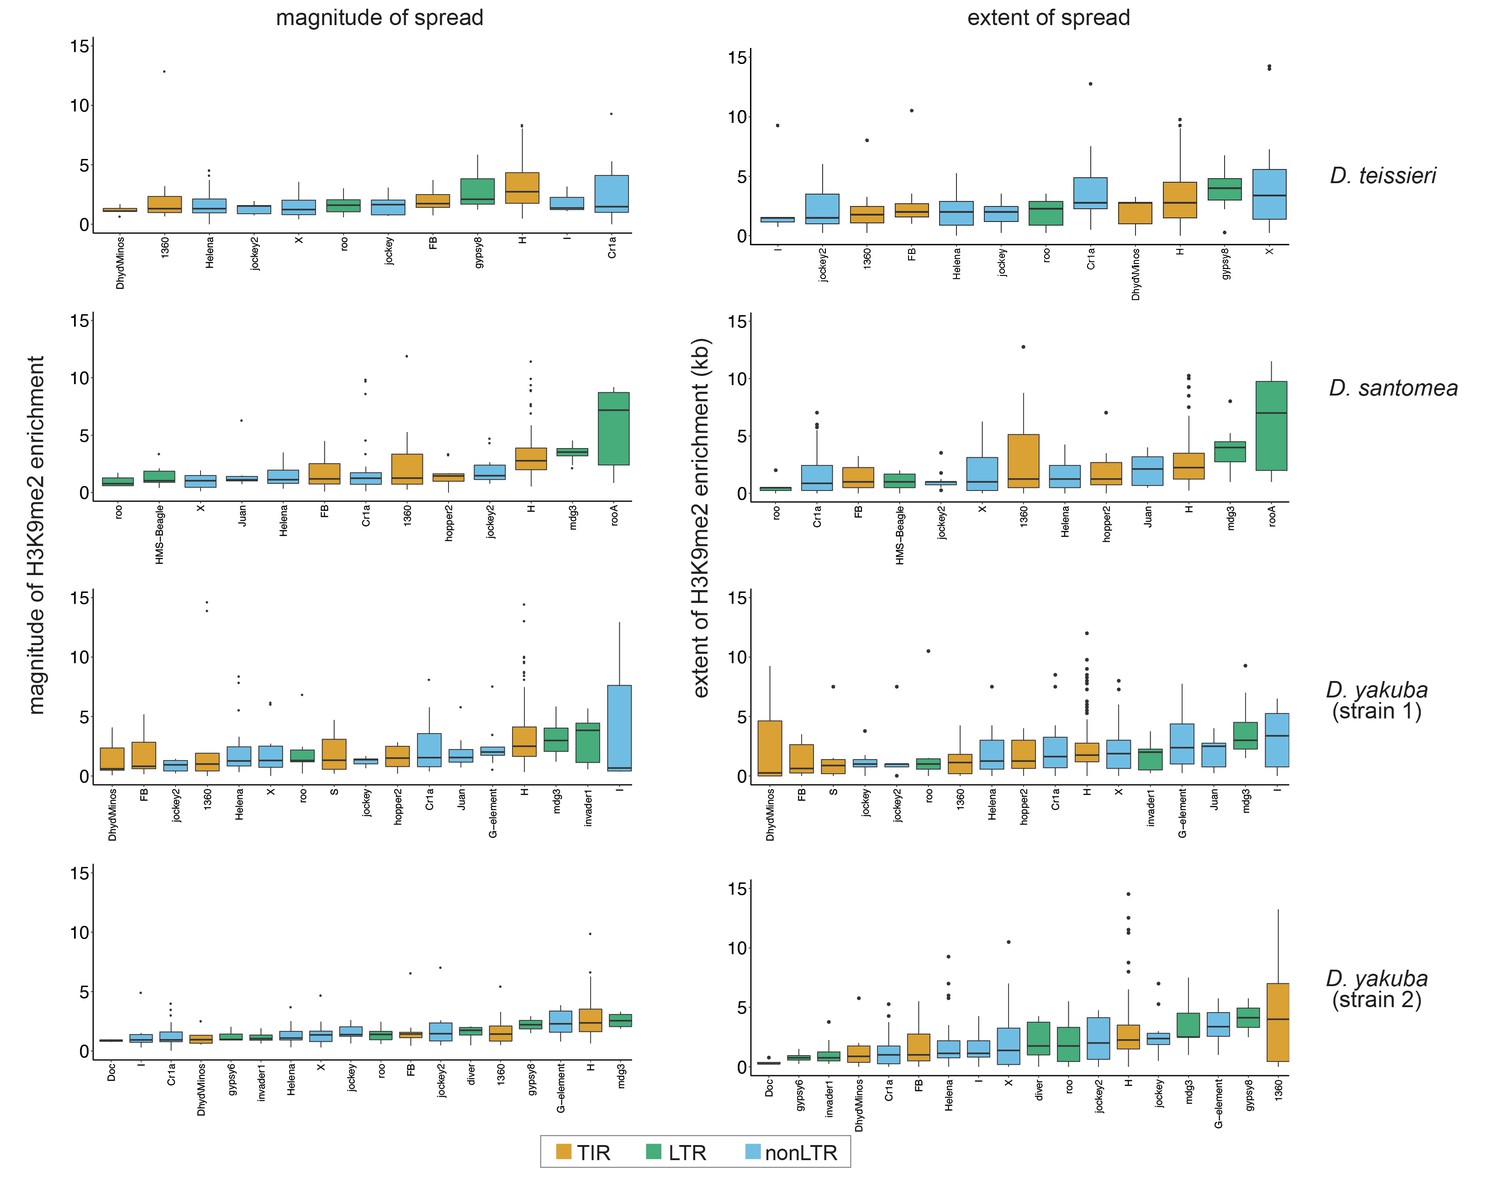
The magnitude and extent of transposable element (TE)-mediated H3K9me2 enrichment of different families for yakuba complex species (Drosophila teissieri, Drosophila santomea, and Drosophila yakuba).
Figure 2—figure supplement 3
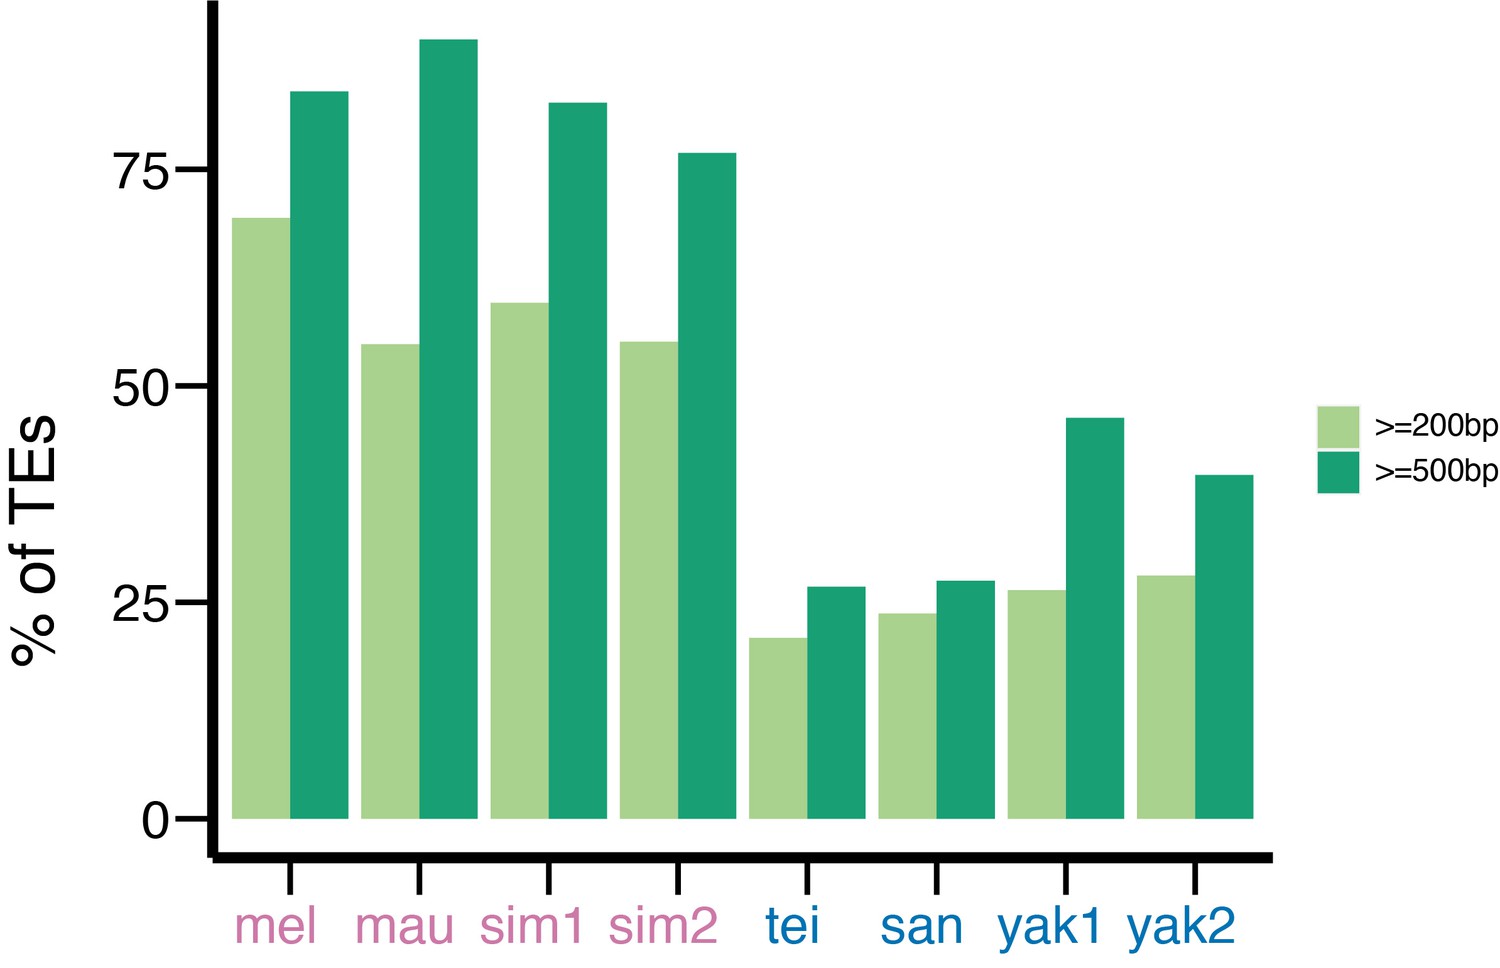
The percentage of transposable elements (TEs) assigned to a TE family based on blast analysis.
This percentage is influenced by the minimum size of TEs (200 bp vs. 500 bp) and is biased against those in species in the yakuba complex.
Figure 2—figure supplement 4
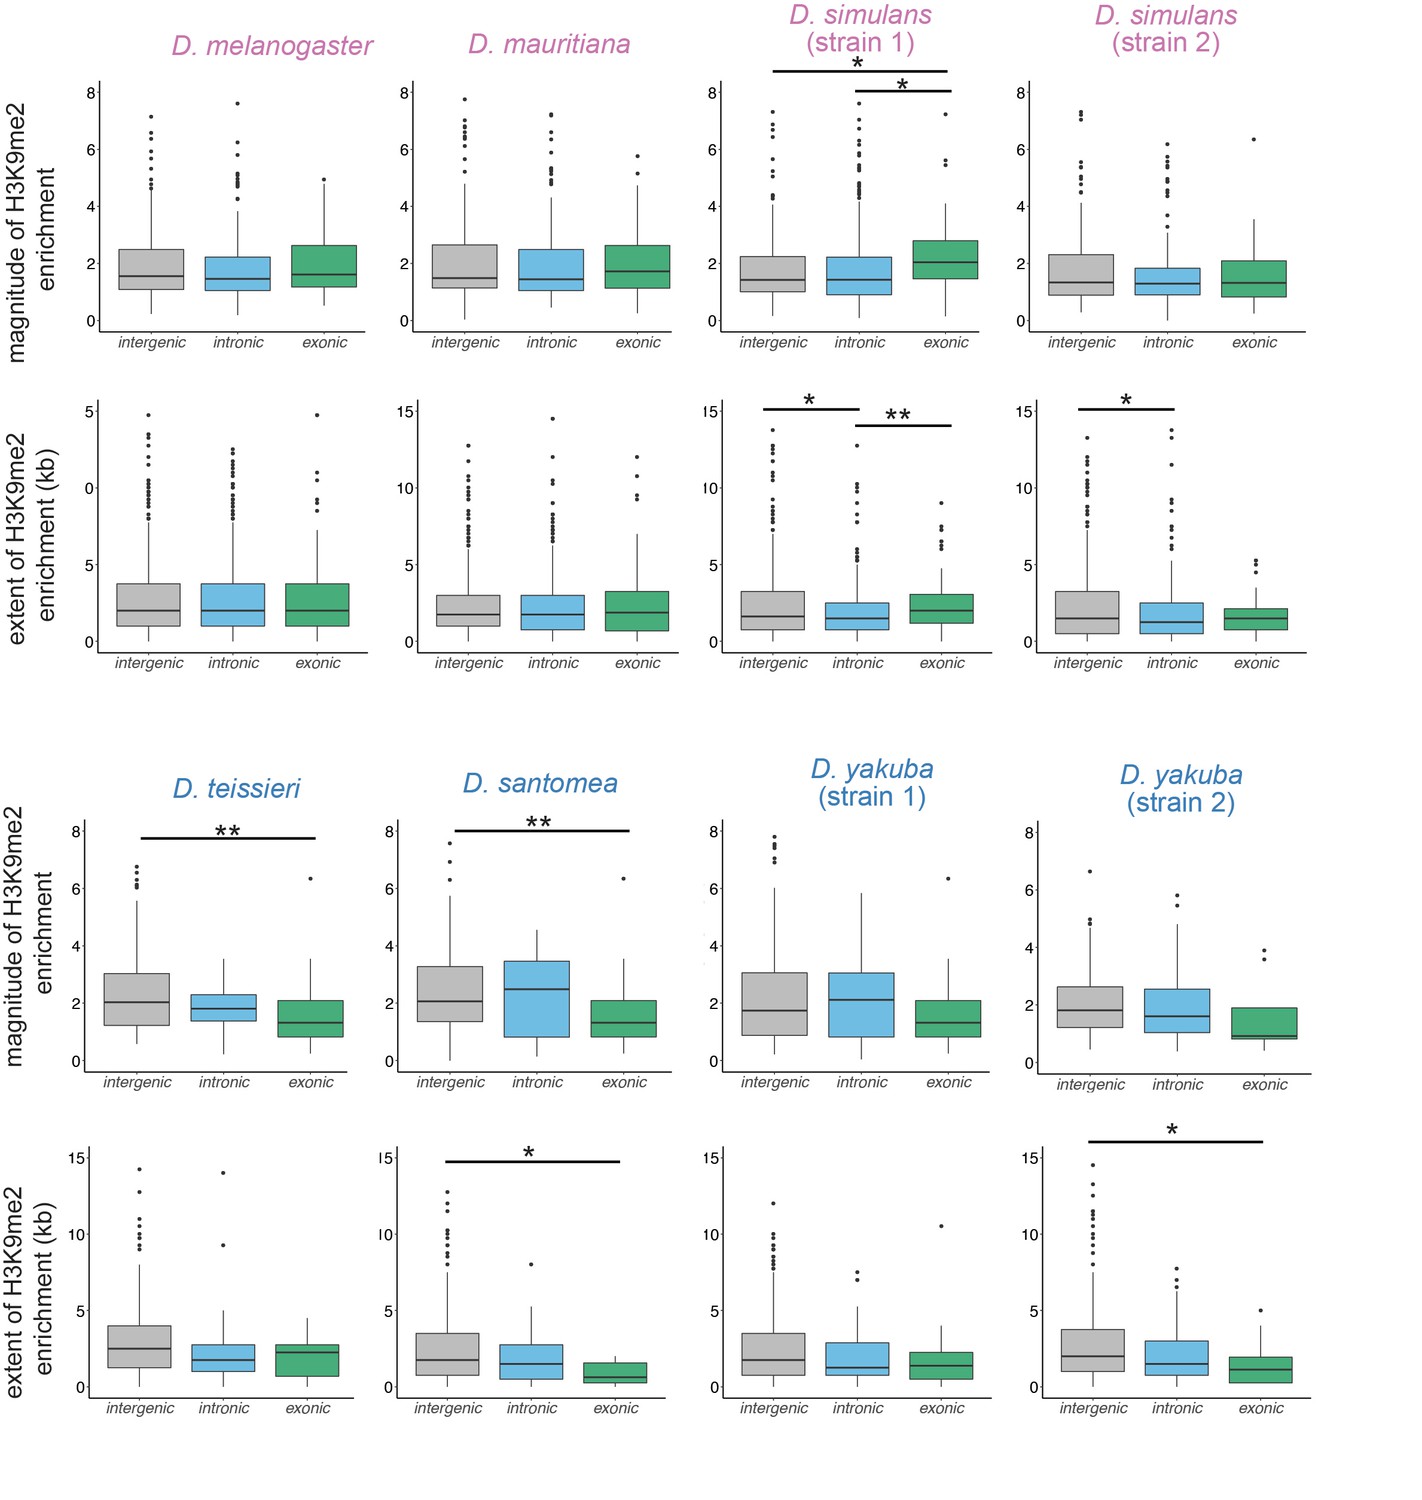
Comparisons of the magnitude and extent of transposable element (TE)-mediated H3K9me2 for intergenic, intronic, and exonic TEs.
Mann-Whitney U test, ***p<0.001, **p<0.01, *p<0.05.
Figure 3 with 13 supplements
Associations between transposable element (TE)-mediated H3K9me2 enrichment and the epigenetic states and expression of neighboring genes.
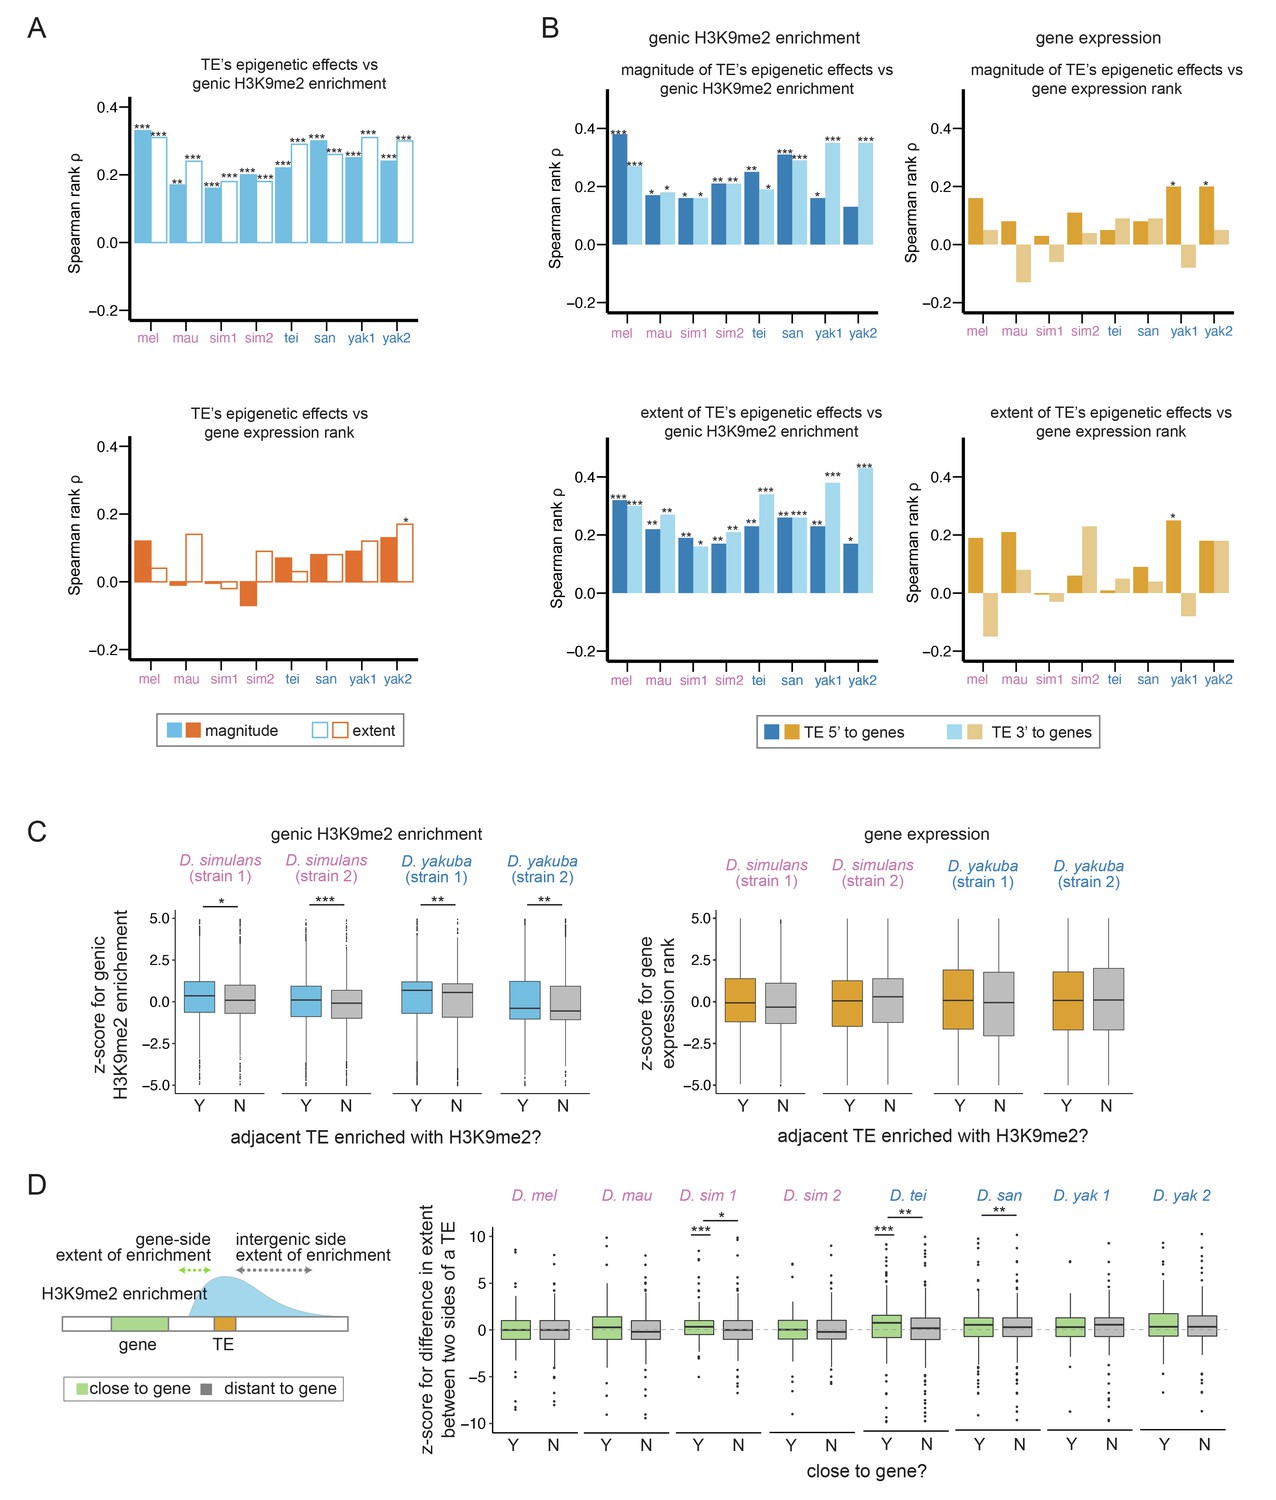
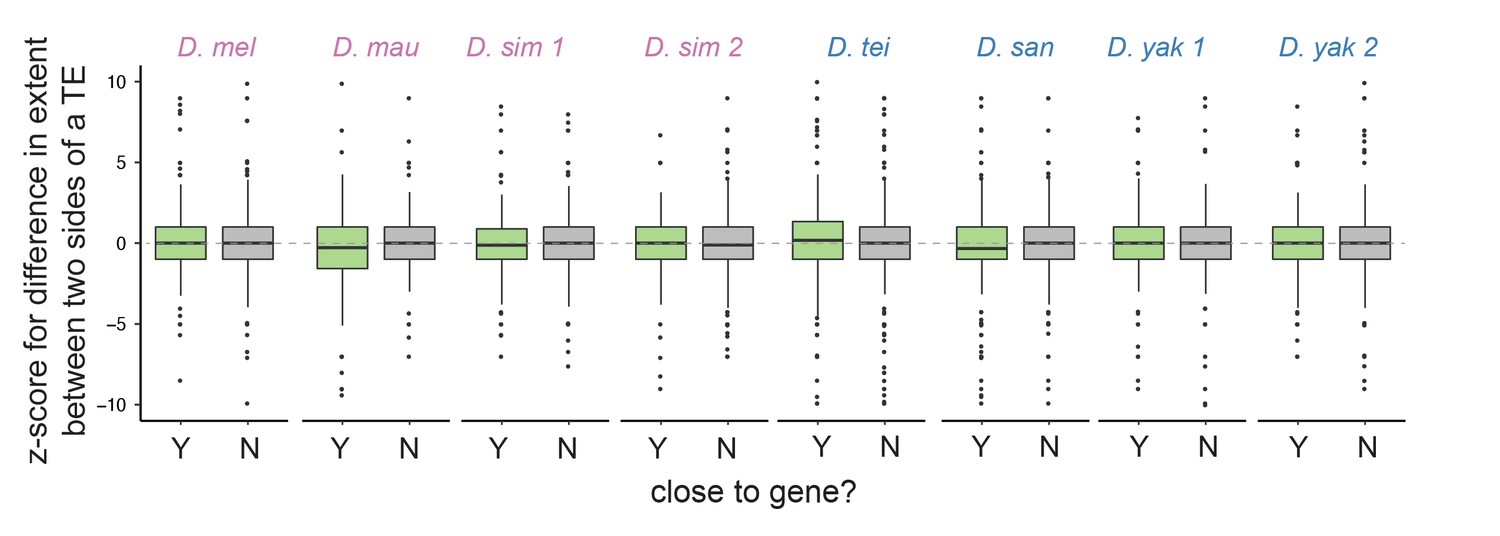
(A) Spearman rank correlation coefficients (ρ) between the magnitude (filled bars) and extent (open bars) of TE-mediated H3K9me2 enrichment and genic H3K9me2 enrichment level (top) and gene expression rank (higher rank means lower expression; bottom) of nearby genes. Most of the Spearman rank correlation coefficients are significantly different from 0 for comparisons of genic H3K9me2 enrichment level (top), but not for comparisons of gene expression rank (bottom). (B) Spearman rank correlation coefficients (ρ) between the magnitude (top) and extent (bottom) of TE-mediated H3K9me2 enrichment and the H3K9me2 enrichment level (left) and gene expression rank (right) of nearby genes for TEs 5’ (dark blue/orange) and 3’ (light blue/light orange) to genes. For the genic H3K9me2 enrichment, all Spearman rank correlation coefficients are significantly different from 0 except for one test. For gene expression rank, few correlations are significantly different from 0. (C) z-Scores for comparing the H3K9me2 enrichment (left) and expression rank (right) of homologous genic alleles whose nearby TEs with (blue/orange) or without (gray) epigenetic effects (as defined as the magnitude of H3K9me2 enrichment >1; see Figure 3—figure supplement 7 for categorizing TEs with the extent of H3K9me2 enrichment, which gives similar results). A positive z-score means the allele with TE has higher H3K9me2 enrichment or larger expression rank (i.e., lower expression level) than the homologous allele without TE in another strain. (D) A cartoon describing the ‘genic side’ and ‘intergenic side’ extent of H3K9me2 enrichment mediated by TEs is shown on the left. z-Scores for comparing the extent of TE-mediated H3K9me2 enrichment on the intergenic side and on the genic side for TEs close to (green) and far (gray) from genes whose expression is at least 10 RPKM. A positive z-score means that the extent of TE-mediated H3K9me2 enrichment is more restricted on the genic side than the intergenic side. In several genomes, z-scores for TEs close to genes are significantly different from 0 and/or larger than those for TEs distant to genes. mel: Drosophila melanogaster, mau: Drosophila mauritiana, sim1: Drosophila simulans strain 1, sim2: D. simulans strain 2, tei: Drosophila teissieri, san: Drosophila santomea, yak1: Drosophila yakuba strain 1, yak2: D. yakuba strain 2. ***p<0.001, **p<0.01, *p<0.05 for Spearman rank correlation tests (A, B) and Mann-Whitney U tests (C, D).
Figure 3—figure supplement 1
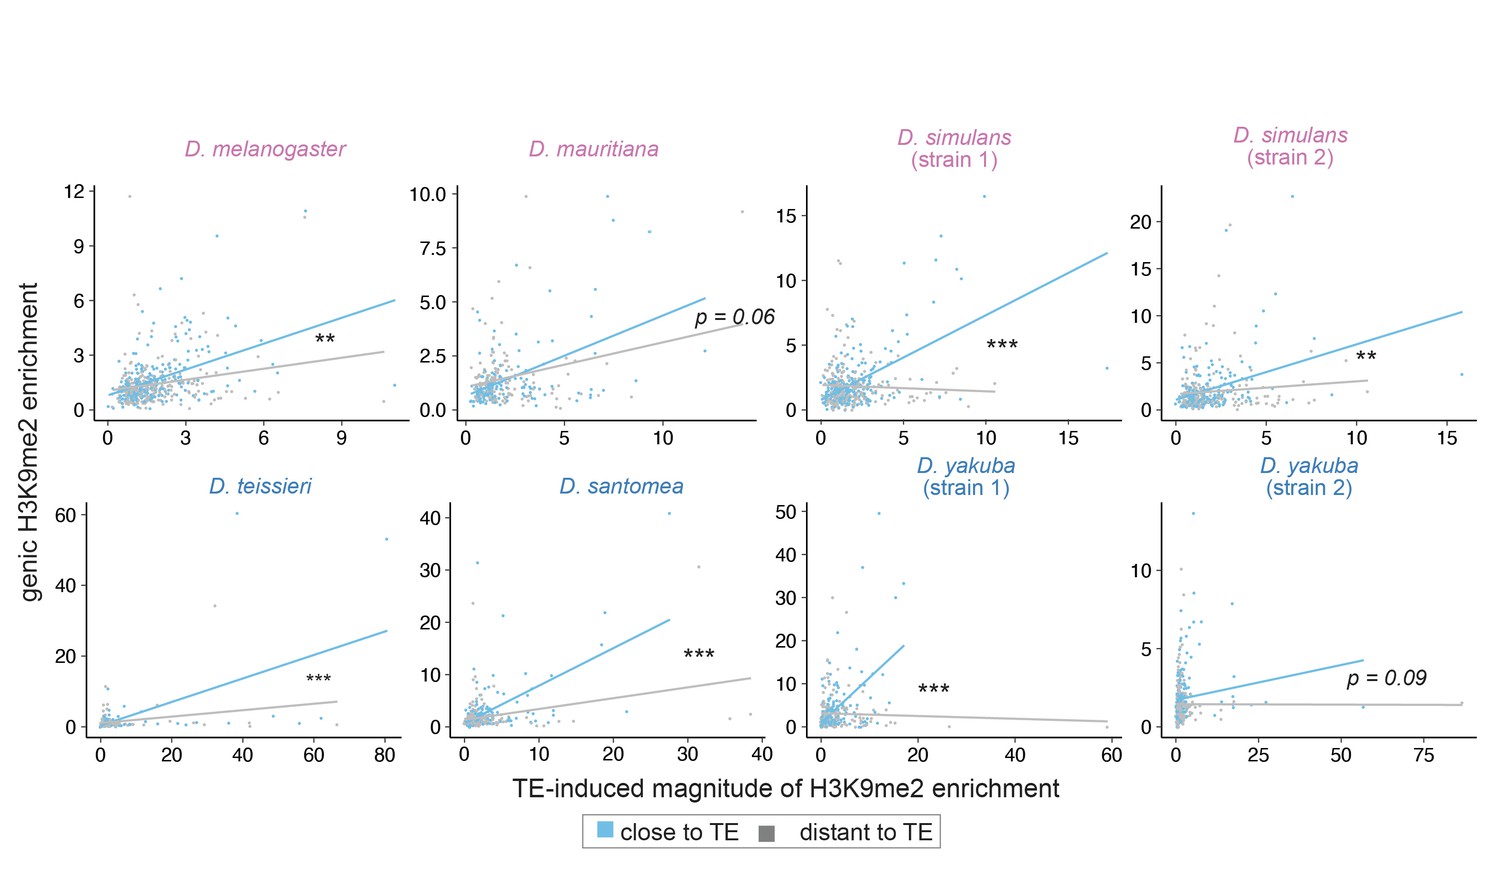
Associations between the magnitude of transposable element (TE)-mediated H3K9me2 enrichment and genic H3K9me2 enrichment are much stronger for genes close to TEs (distance to a TE is smaller than the 50% quantile, blue) than for genes distant to TEs (gray; see Figure 3—figure supplement 2 for the extent of TE-mediated H3K9me2 enrichment).
For regression interaction term, ***p<0.001, **p<0.01, *p<0.05 (see text).
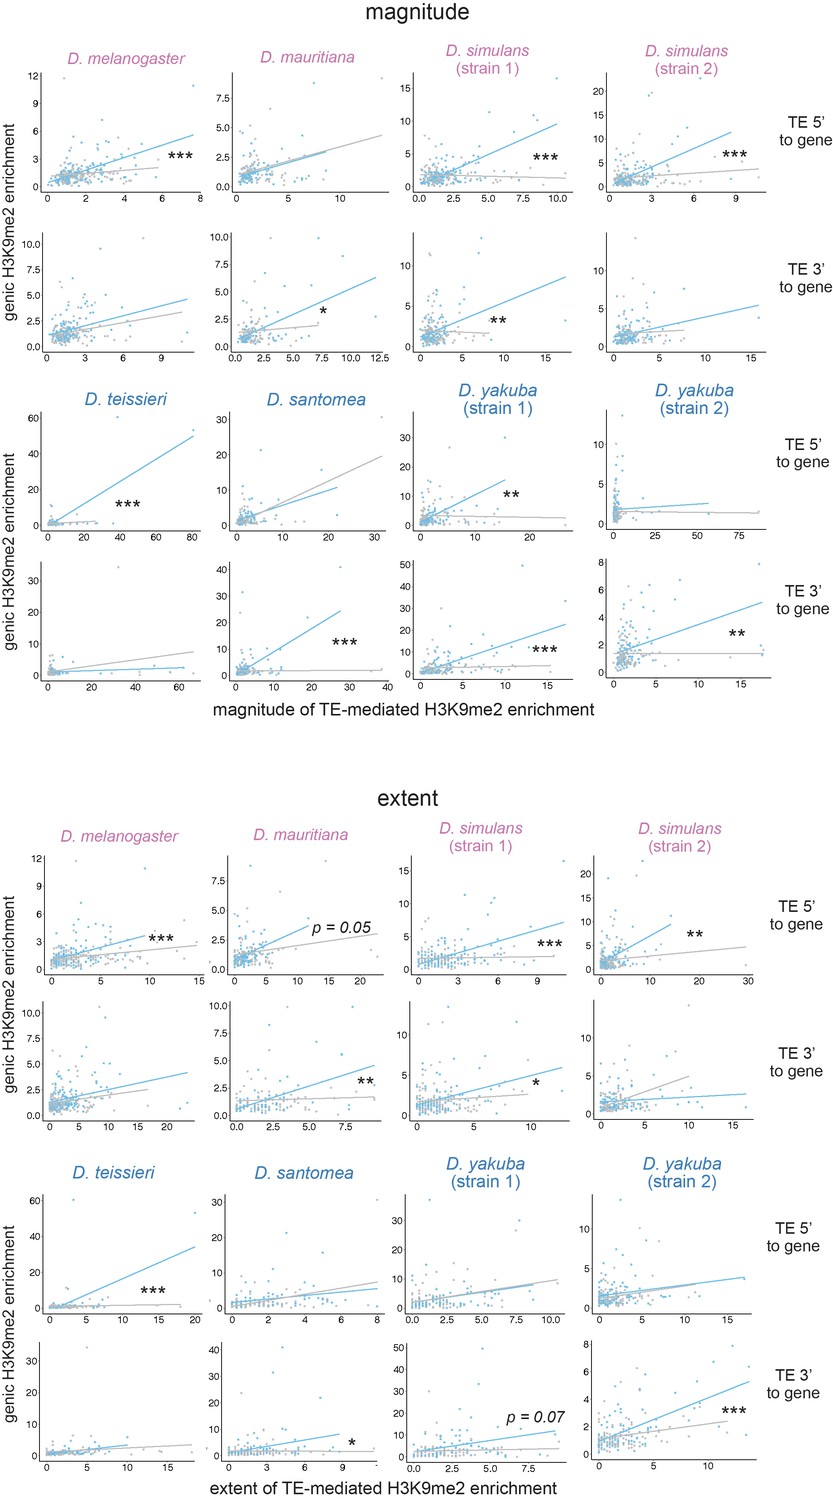
Figure 3—figure supplement 2
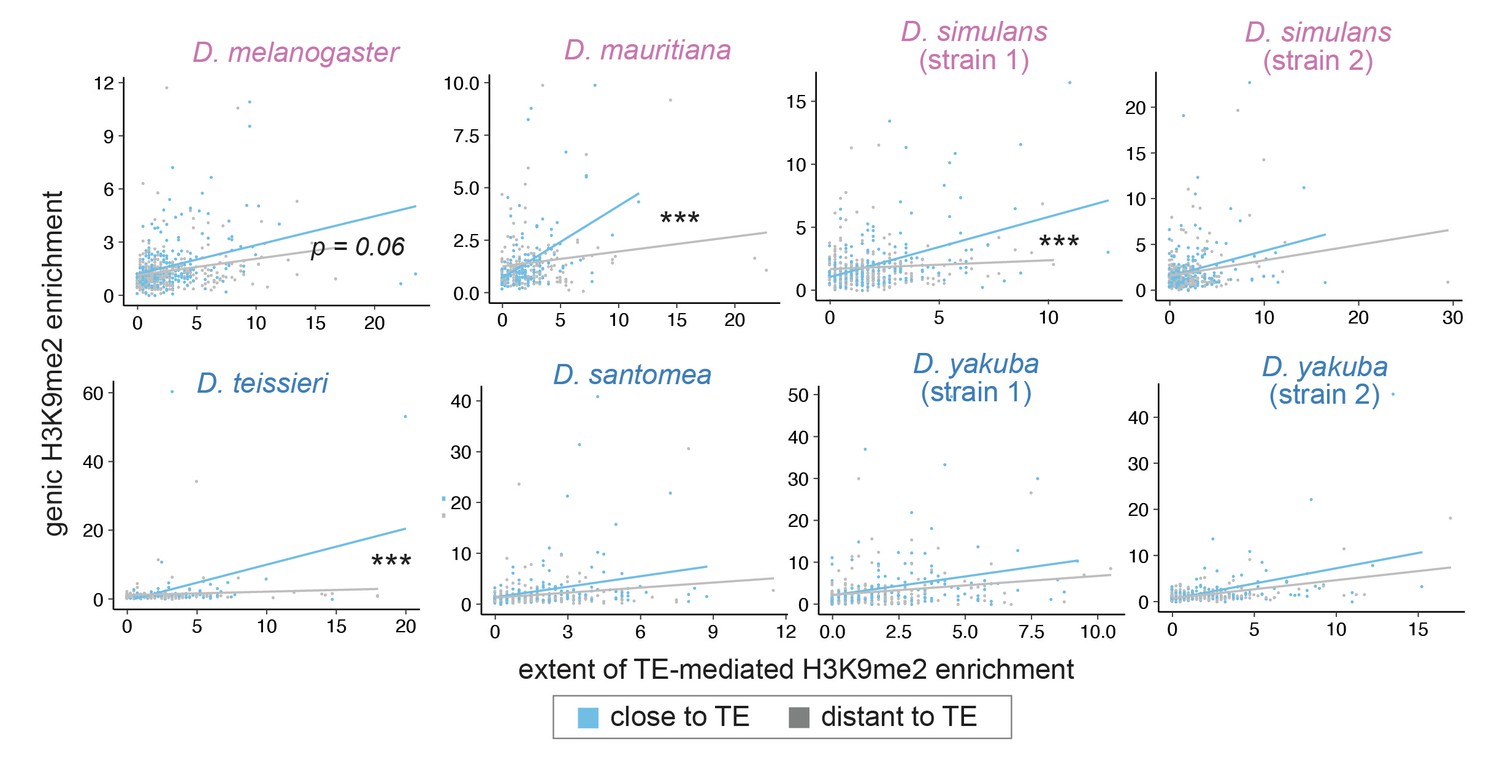
Associations between the extent of transposable element (TE)-mediated H3K9me2 enrichment and genic H3K9me2 enrichment differ between genes close (distance to a TE is smaller than the 50% quantile, blue) and distant (gray) to TEs.
For regression interaction term, ***p<0.001, **p<0.01, *p<0.05 (see text).
Figure 3—figure supplement 3
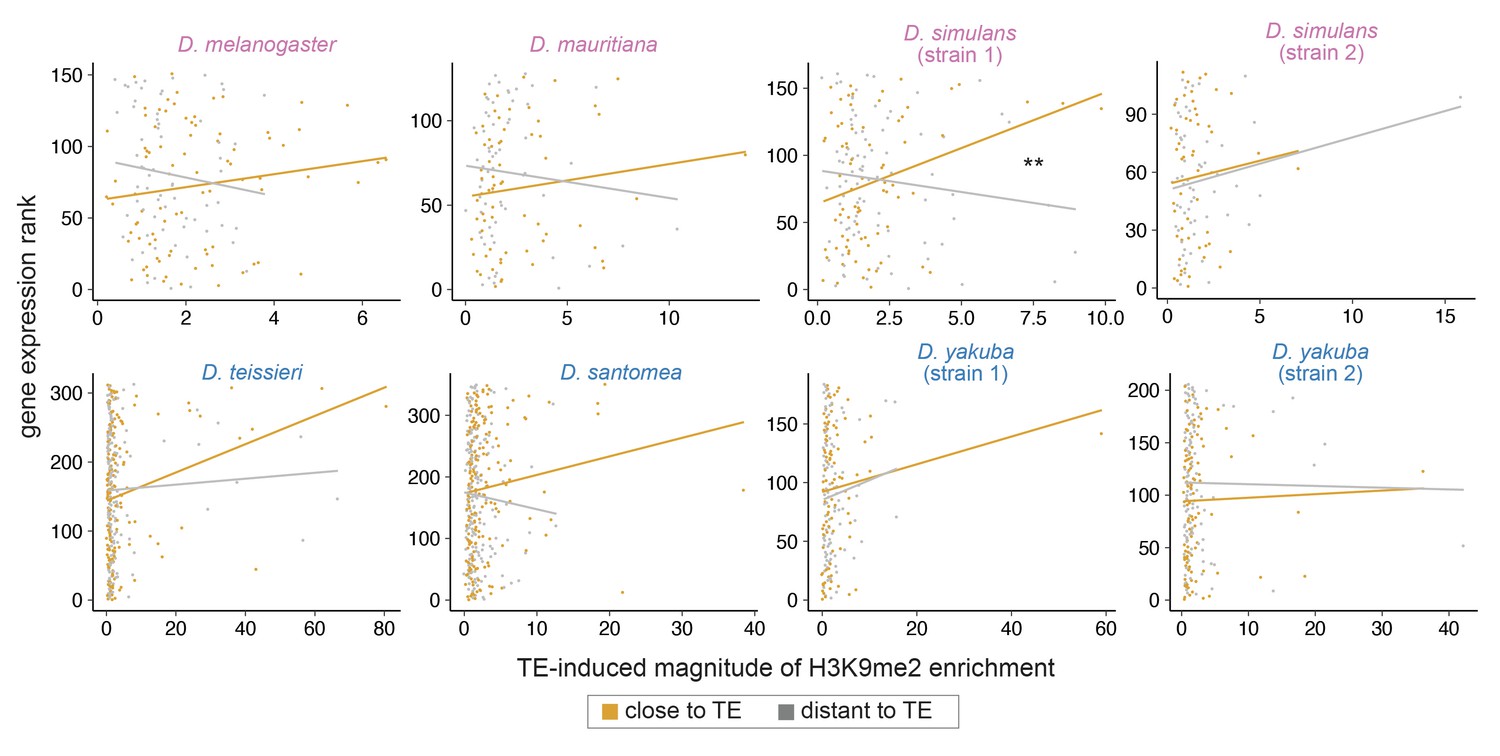
Associations between the magnitude of transposable element (TE)-mediated H3K9me2 enrichment and gene expression rank (lower rank suggests higher expression) do not differ between genes close (distance to a TE is smaller than the 50% quantile, orange) and distant (gray) to TEs (see Figure 3—figure supplement 4 for the extent of TE-mediated H3K9me2 enrichment).
Note that the trend line is highly sensitive to outliers and may not be indicative of true associations (see text). For regression interaction term, **p<0.01.
Figure 3—figure supplement 4
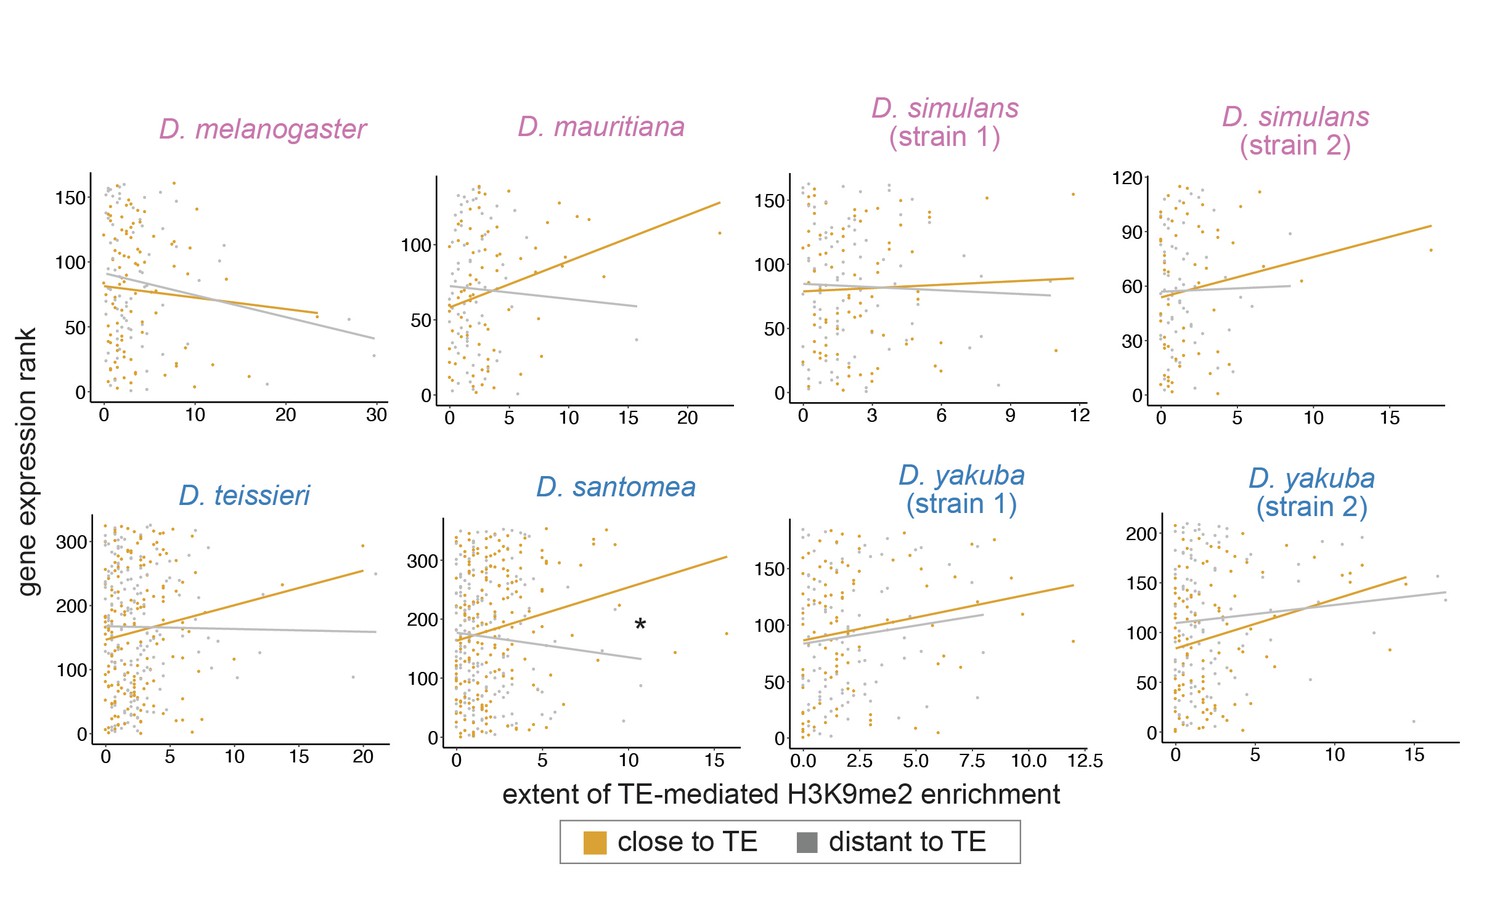
Associations between the extent of transposable element (TE)-mediated H3K9me2 enrichment and gene expression rank do not differ between genes close (distance to a TE is smaller than the 50% quantile, orange) and distant (gray) to TEs for most genomes.
Note that the trend line is highly sensitive to outliers and may not be indicative of true associations (see text). For regression interaction term, *p<0.05.
Figure 3—figure supplement 5
Associations between the magnitude (top) and extent (bottom) of transposable element (TE)-mediated H3K9me2 enrichment and genic H3K9me2 enrichment differ between genes close (distance to a TE is smaller than the 50% quantile, blue) and distant (gray) to TEs for both TEs 5’ and 3’ to genes.
For regression interaction term, ***p<0.001, **p<0.01, *p<0.05.
Figure 3—figure supplement 6
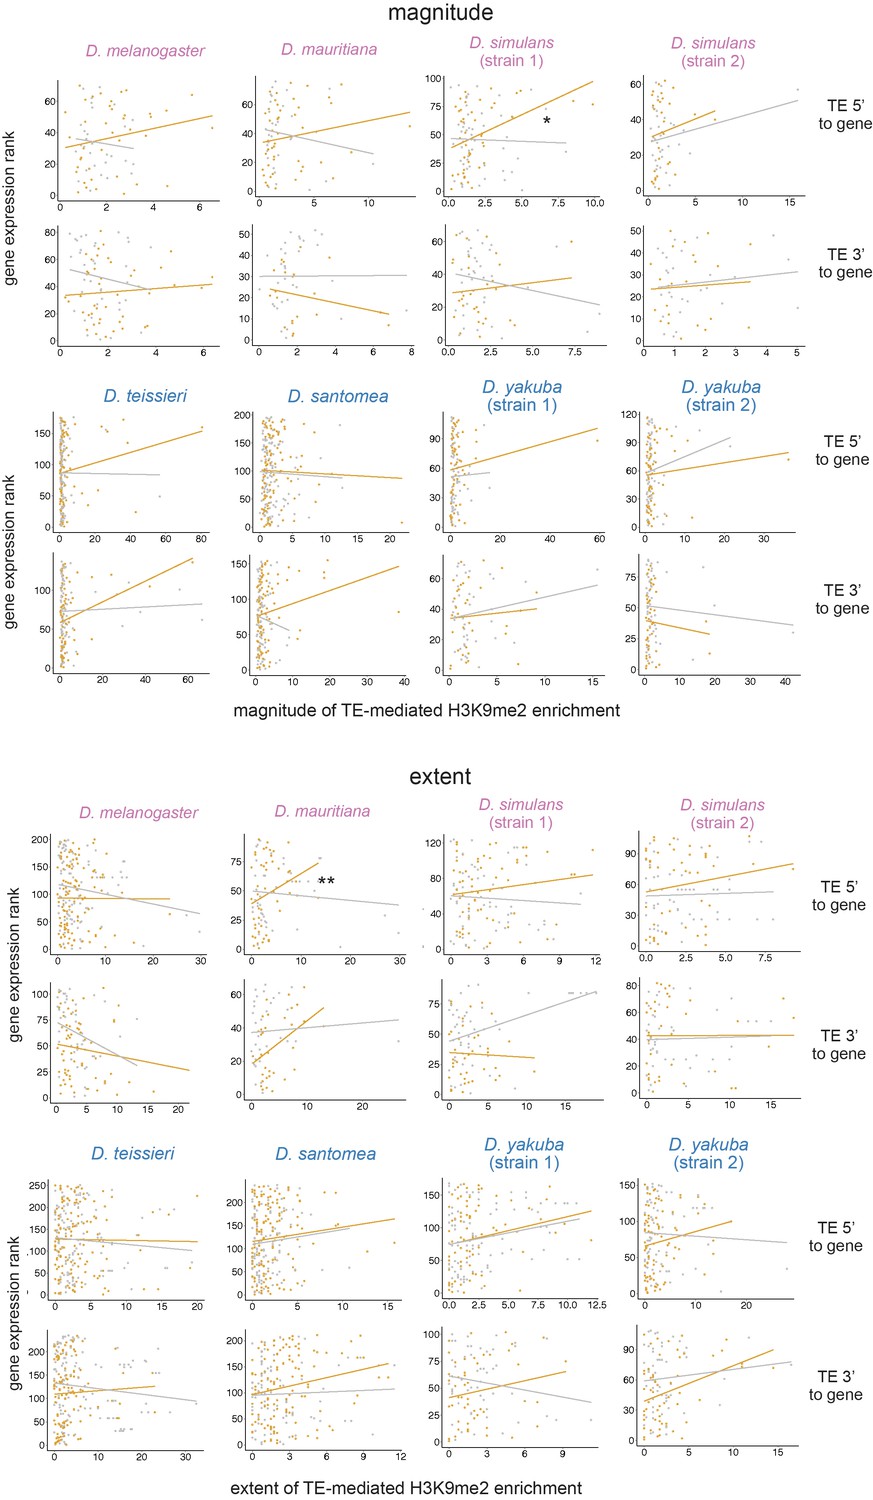
Associations between the magnitude (top) and extent (bottom) of transposable element (TE)-mediated H3K9me2 enrichment and gene expression rank (lower rank suggests higher expression) do not differ between genes close (distance to a TE is smaller than the 50% quantile, orange) and distant (gray) to TEs for TEs 5’ and 3’ to genes.
Note that the trend line is highly sensitive to outliers and may not be indicative of true associations (see text). For regression interaction term, **p<0.01, *p<0.05.
Figure 3—figure supplement 7
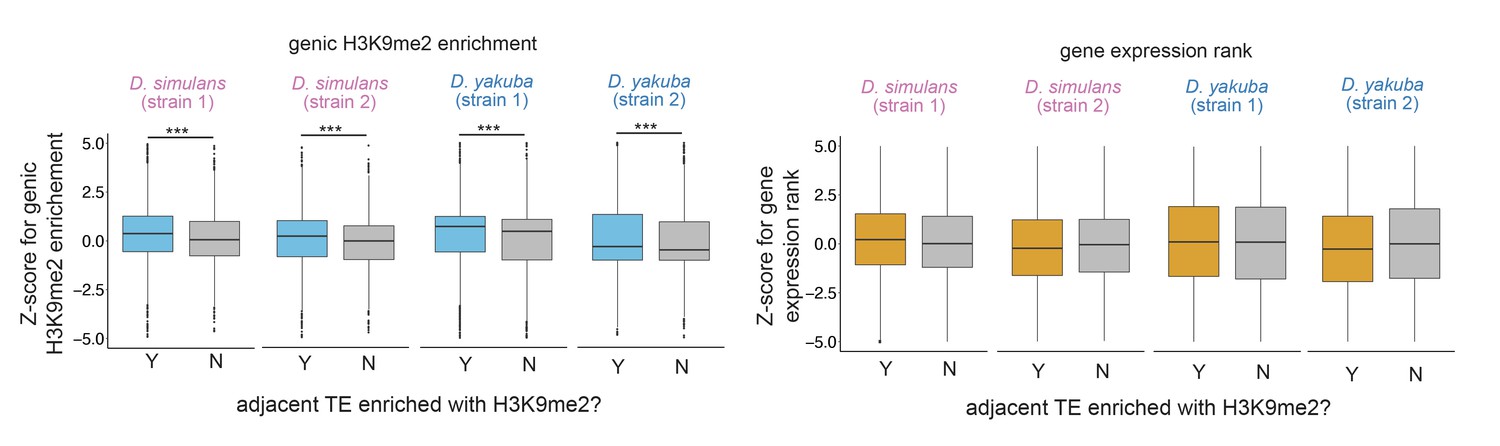
z-Scores for comparing the H3K9me2 enrichment (left) and expression rank (right) of homologous genic alleles whose nearby transposable elements (TEs) with (blue/orange) or without (gray) epigenetic effects (as defined as the extent of H3K9me2 enrichment >1 kb; see Figure 3C for categorizing TEs with the magnitude of H3K9me2 enrichment, which gives similar results).
Positive Z-score means the allele with TE has higher H3K9me2 enrichment or larger expression rank (i.e., lower expression level) than the homologous allele without TE in another strain. Mann-Whitney U test, ***p<0.001.
Figure 3—figure supplement 8
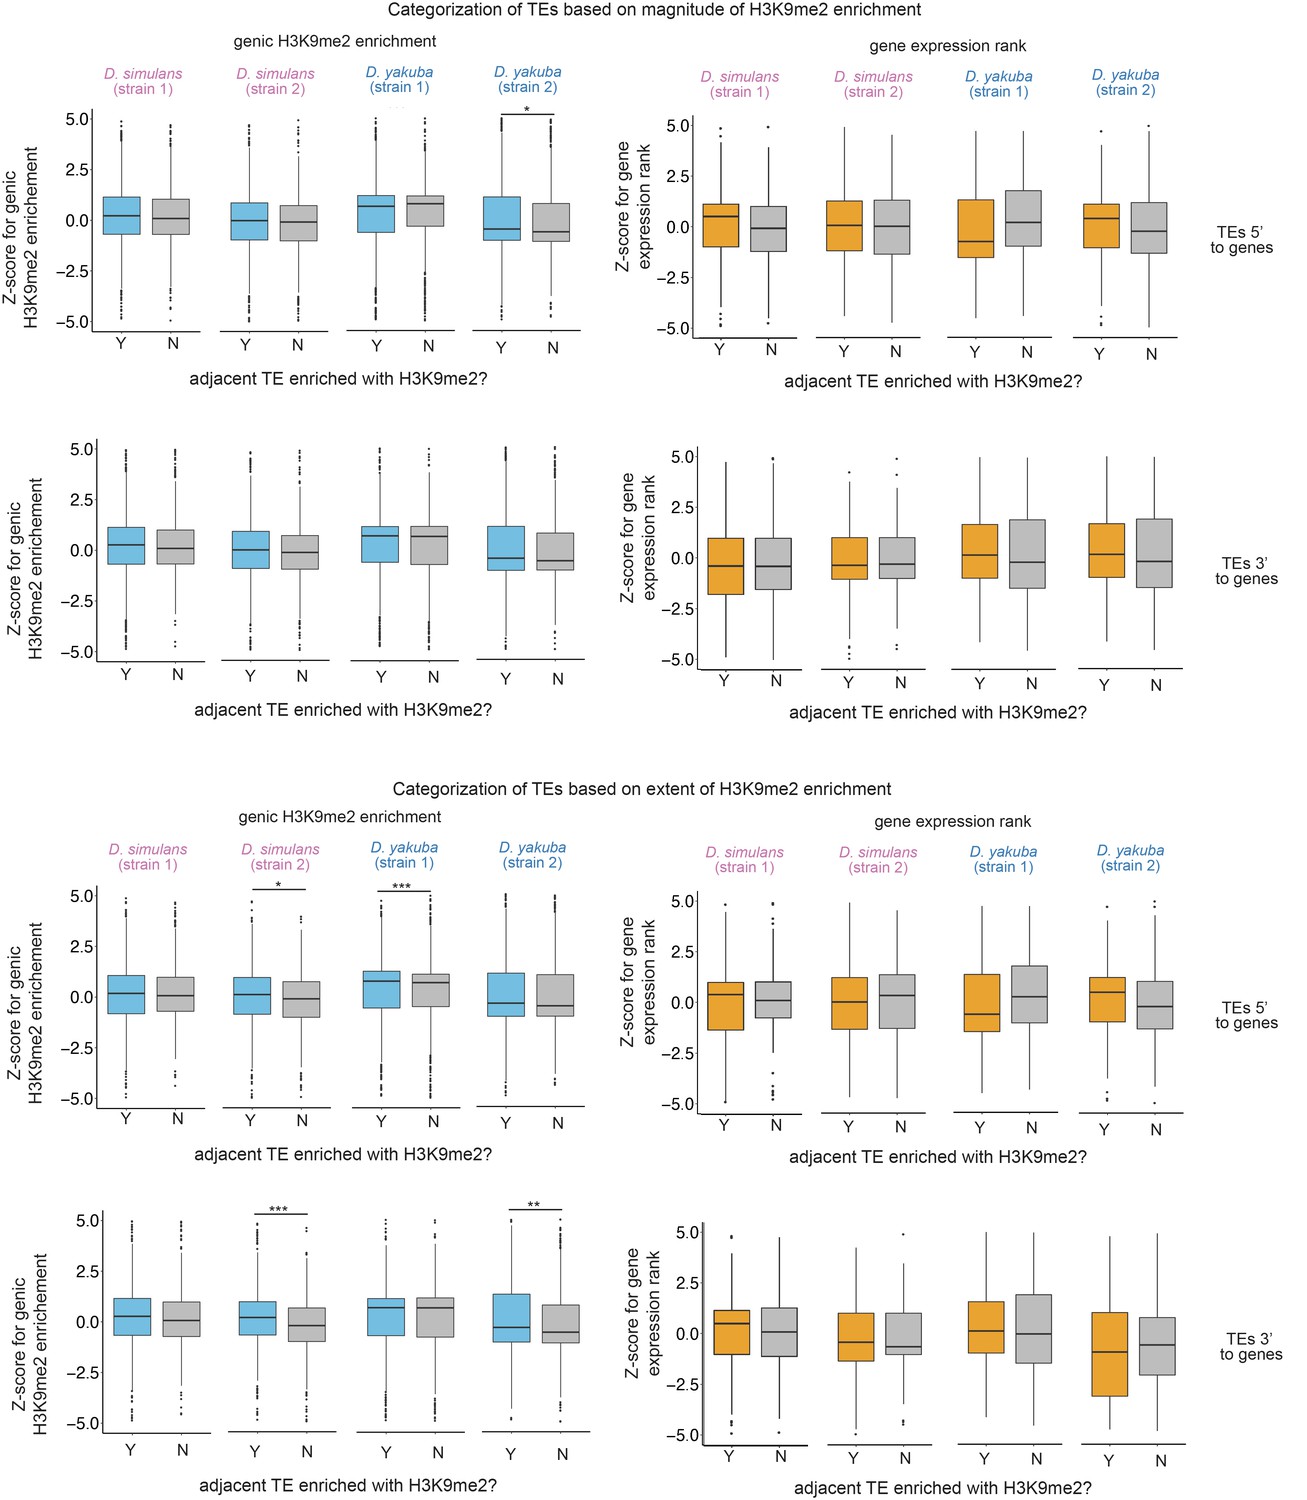
z-Scores for comparing the H3K9me2 enrichment (left) and expression rank (right) of homologous genic alleles whose nearby 5’ or 3’ transposable elements (TEs) with (blue/orange) or without (gray) epigenetic effects as defined as the magnitude of H3K9me2 enrichment >1 (top) or the extent of H3K9me2 enrichment >1 kb (bottom).
Positive z-score means the allele with TE has higher H3K9me2 enrichment or larger expression rank (i.e., lower expression level) than the homologous allele without TE in another strain. Mann-Whitney U test, ***p<0.001, **p<0.01, *p<0.05.
Figure 3—figure supplement 9
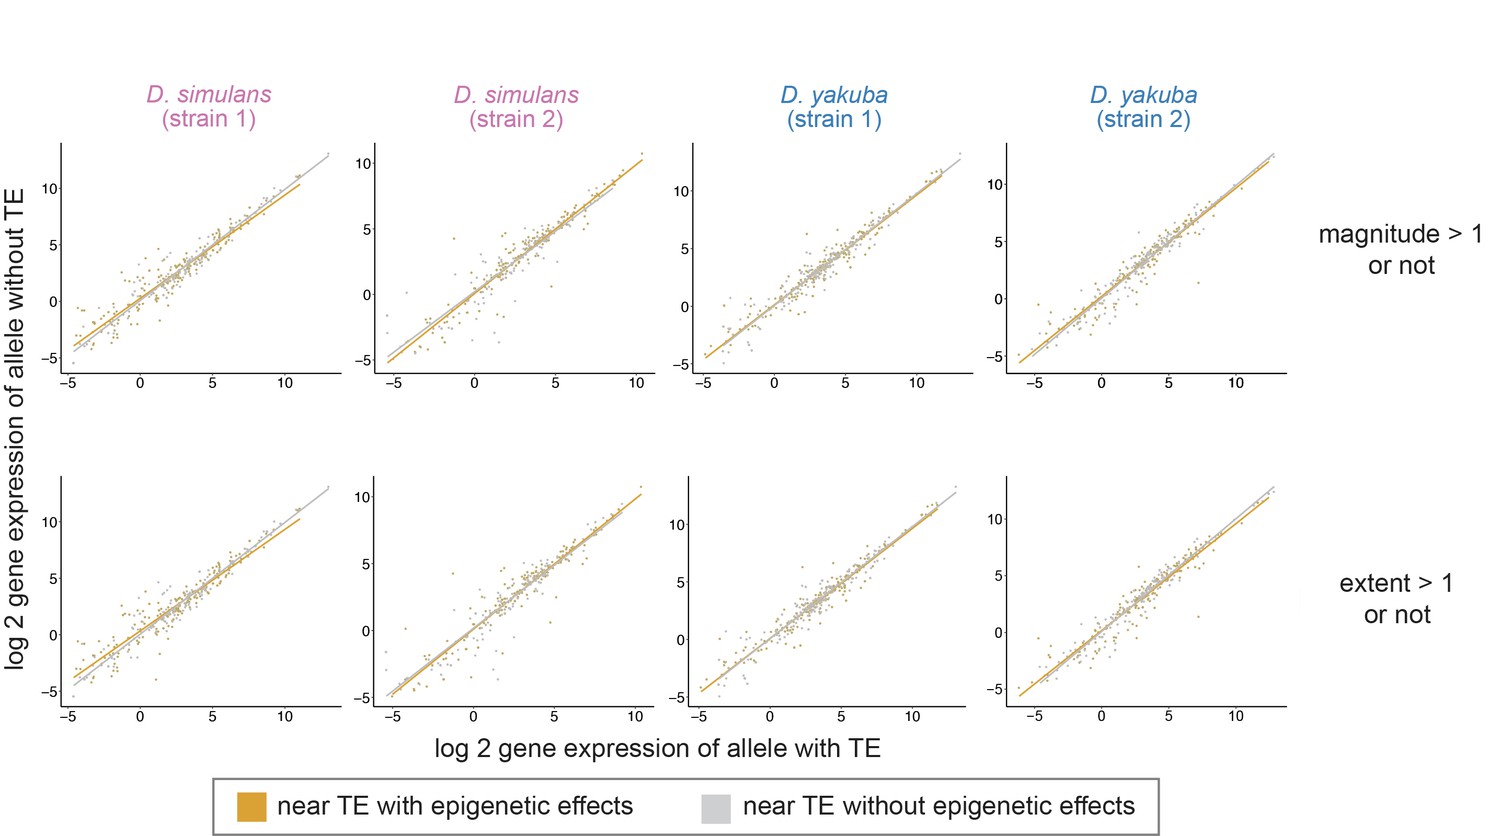
The log2 gene expression level (RPKM) for homologous alleles with (x-axis) and without (y-axis) nearby transposable elements (TEs).
The associations between the expression of alleles with and without TE do not depend on whether the nearest TE exerts epigenetic effects (orange) or not (gray; regression model: expression of the allele without TE ~expression of the allele with TE + TE with/without epigenetic effects + interaction term; interaction term p-value > 0.05 for all genomes). TEs are categorized as having epigenetic effects according to whether the magnitude is greater than 1 (above) or whether the extent of H3K9me2 enrichment is greater than 1 kb (below).
Figure 3—figure supplement 10
Z-scores for comparing the magnitude of transposable element (TE)-mediated H3K9me2 enrichment on the intergenic side and on the genic side for TEs close to (green) and far (gray) from genes whose expression is at least 10 RPKM.
The z-scores are not significantly different from 0 nor differ between TEs close/distant to genes. Mann-Whitney U tests are insignificant (p>0.05) for all comparisons.
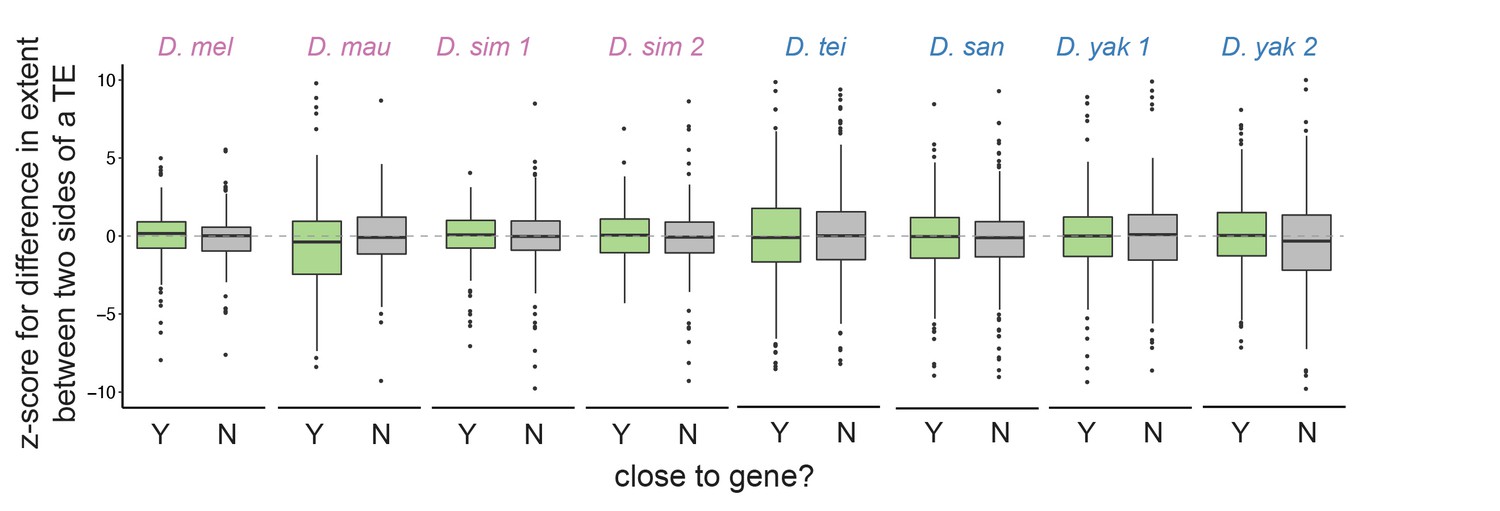
Figure 3—figure supplement 11
Z-scores for comparing the extent of transposable element (TE)-mediated H3K9me2 enrichment on the intergenic side and on the genic side for TEs close to (green) and far (gray) from genes whose expression is smaller than 10 RPKM.
The z-scores are not significantly different from 0 nor differ between TEs close/distant to genes. Mann-Whitney U tests are insignificant (p>0.05) for all comparisons.
Figure 3—figure supplement 12
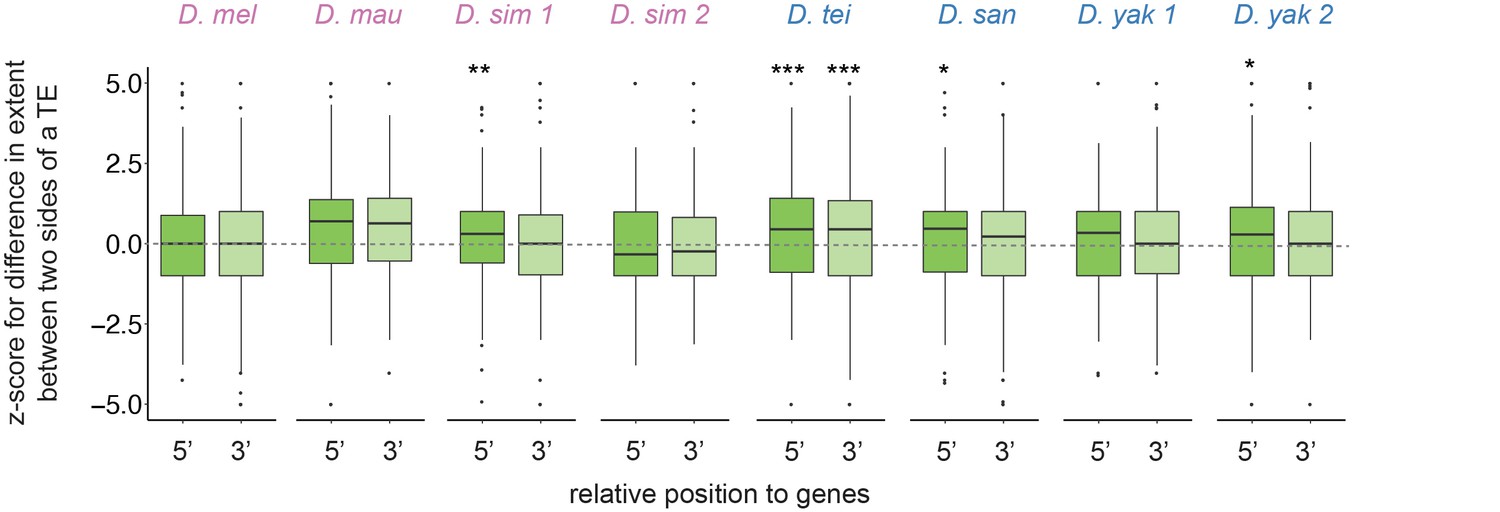
Z-scores for comparing the extent of transposable element (TE)-mediated H3K9me2 enrichment on the intergenic side and on the genic side for TEs 5’ (dark green) and 3’ (light green) to genes whose expression is greater than 10 RPKM.
The z-scores are significantly different from 0 mainly for TEs 5’ to genes. Mann-Whitney U tests, ***p<0.001, **p<0.01, *p<0.05.
Figure 3—figure supplement 13
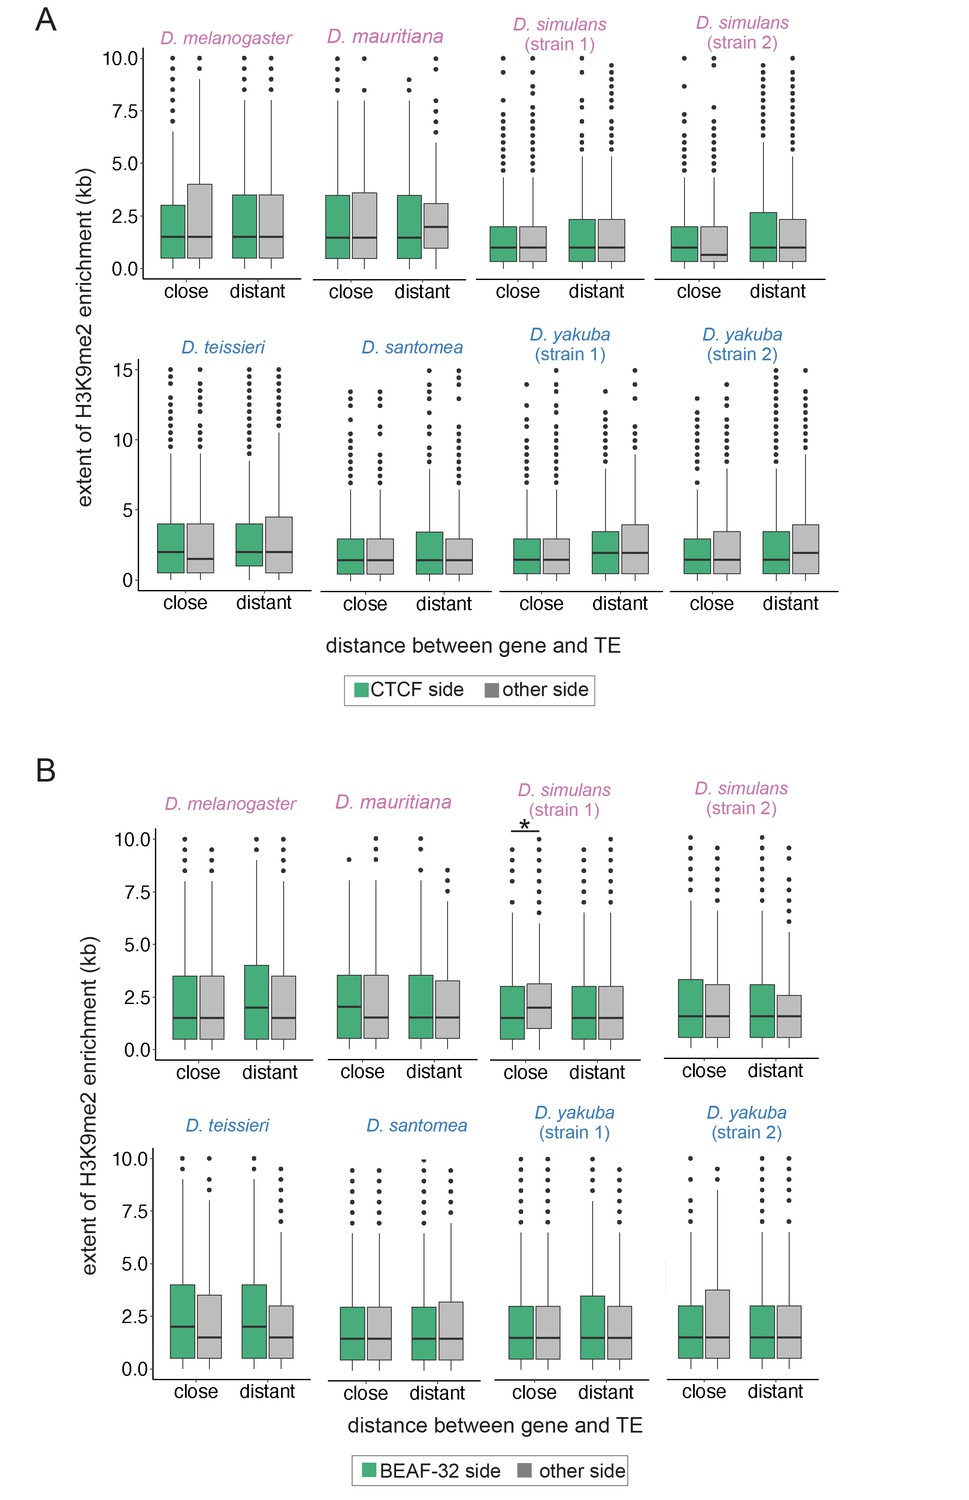
The extent of transposable element (TE)-induced H3K9me2 enrichment on the side facing insulator sequences CTCF (A) and BEAF-32 (B) or on the other side.
In contrast to Figure 3D, the extent of H3K9me2 enrichment from TE is similar between sides facing or not facing an insulator sequence, except for one strain of Drosophila simulans. CTCF and BEAF-23 sequences are from Nègre et al., 2011. Paired Mann-Whitney U or Mann-Whitney U test, *p<0.05.
Figure 4
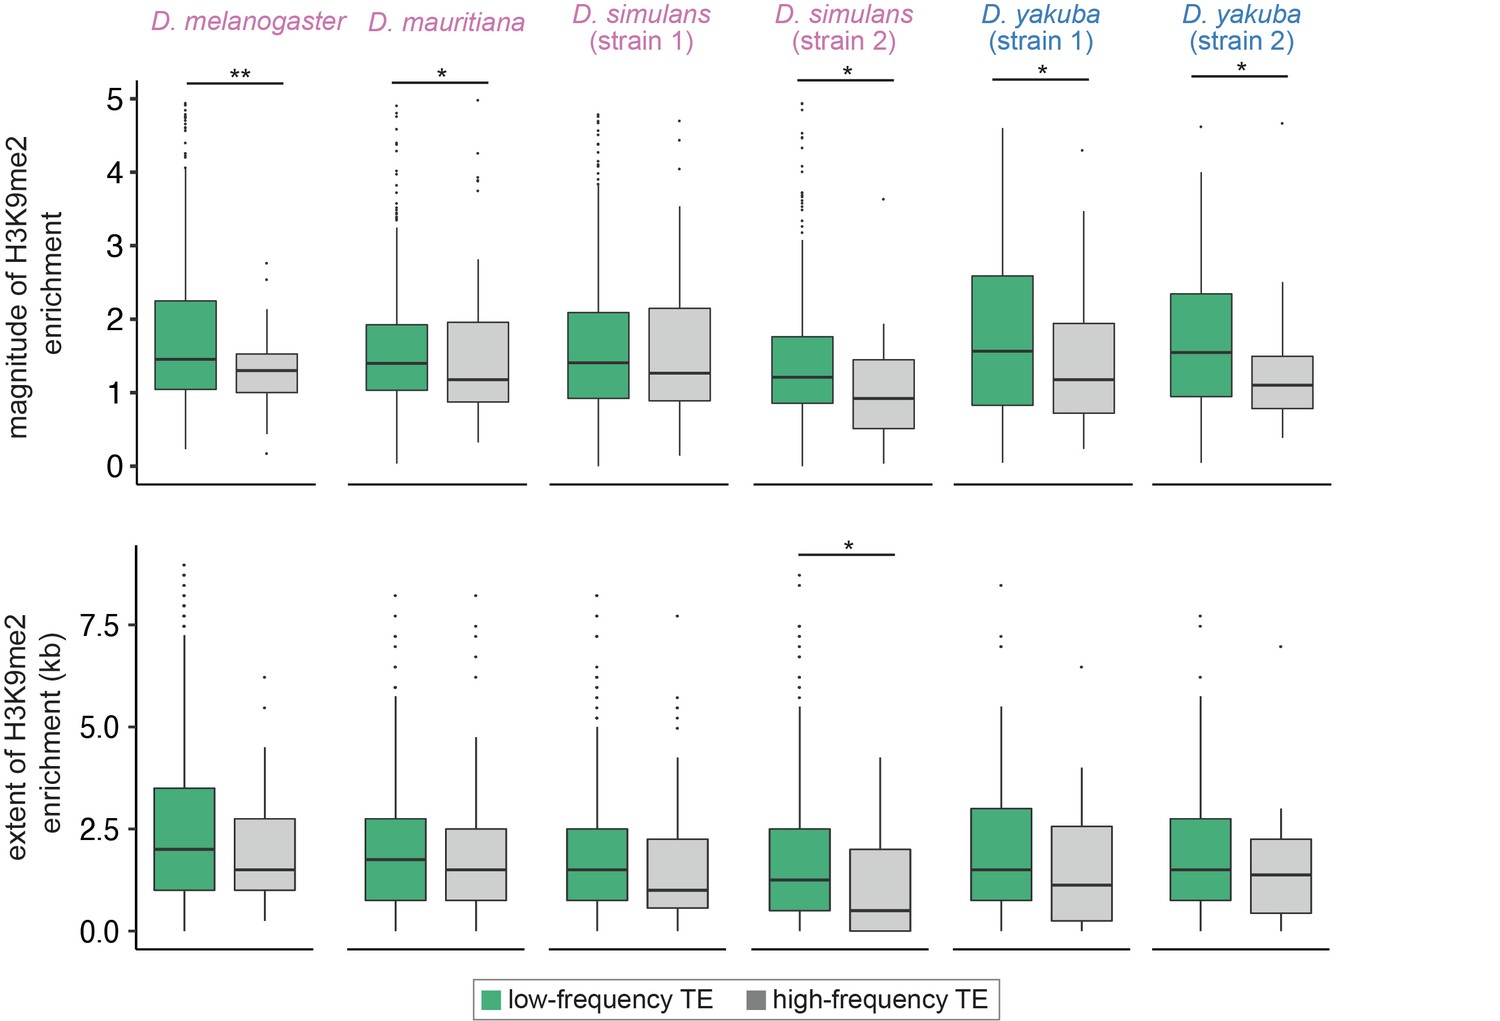
Associations between the population frequencies and epigenetic effects of transposable elements (TEs).
The magnitude (top) and extent (bottom) of TE-mediated enrichment of H3K9me2 for low-frequency TEs (usually considered as strongly selected, green) and high-frequency TEs (gray) in Drosophila melanogaster, Drosophila mauritiana, Drosophila simulans, and Drosophila yakuba. Low-frequency TEs are those that are only found in the focused genome, while high-frequency TEs are identified in both the focused genome and the population of genomes. Mann-Whitney U test, **p<0.01, *p<0.05.
Figure 5
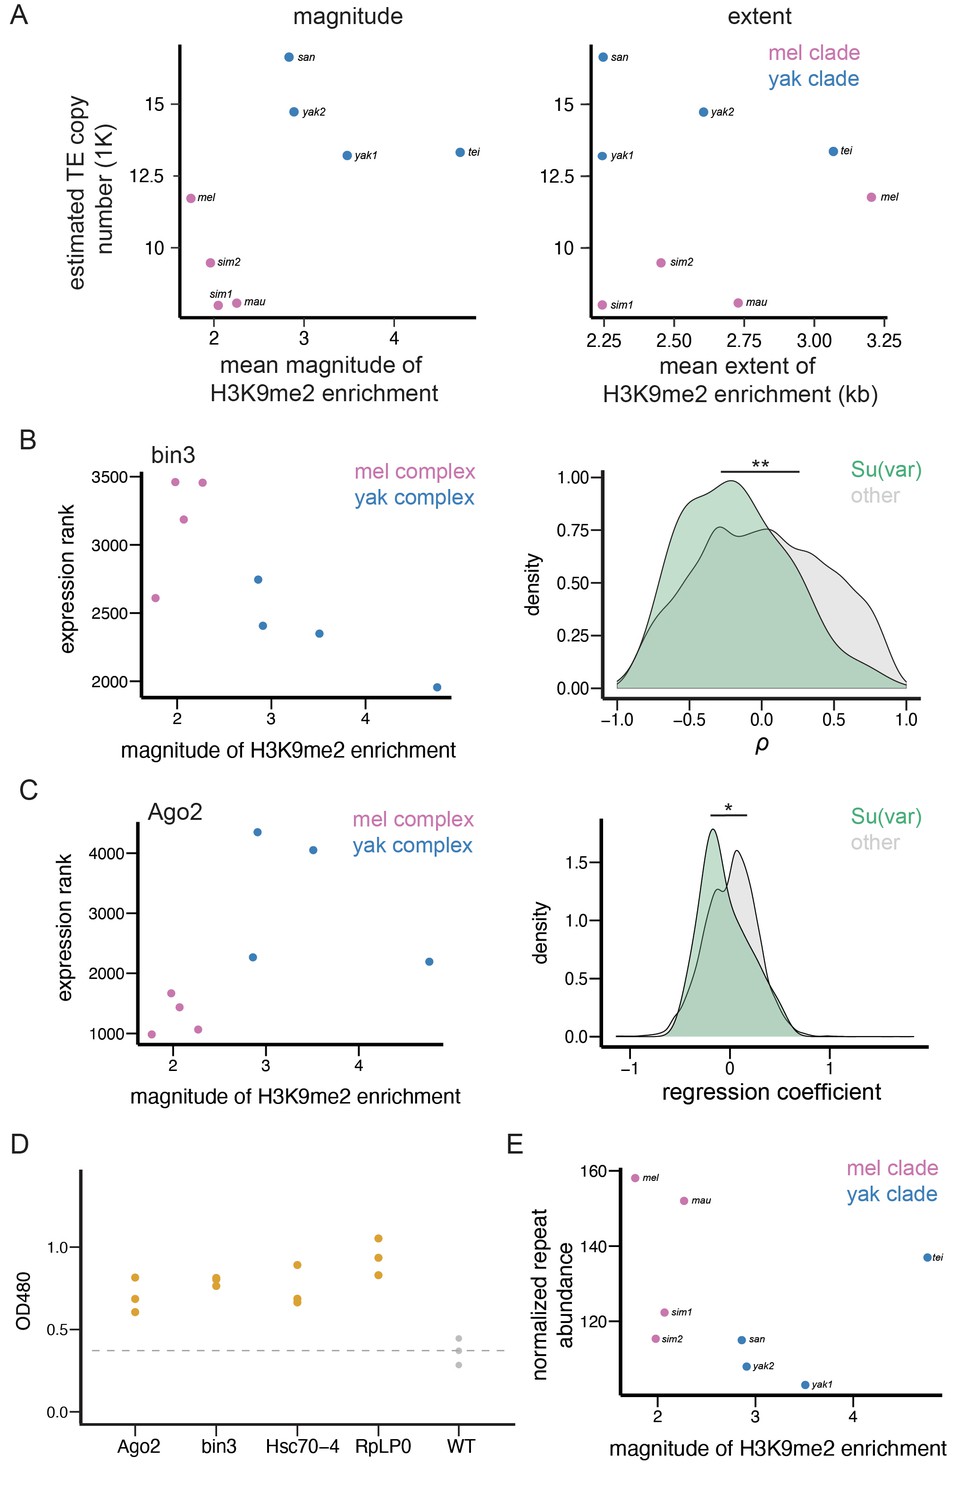
Transposable element (TE)-mediated epigenetic effects associate with genomic TE abundance and repressive chromatin landscape.
(A) The associations between the mean magnitude (left)/extent (right) of TE-mediated enrichment of H3K9me2 and the number of estimated euchromatic TEs across species. (B) An example gene (bin3) whose expression rank negatively correlates with the mean magnitude of TE-mediated H3K9me2 enrichment across species (left). The distributions of Spearman rank correlation coefficient (ρ) between the magnitude of TE-mediated H3K9me2 enrichment and the expression ranks significantly differ between Su(var) genes (green) and other genes in the genome (gray; right). (C) An example gene (Ago2) whose expression rank negatively correlates with the magnitude of TE-mediated H3K9me2 enrichment between species within species complex, but differs significantly between species complex (left). The distributions of regression coefficients for the effect of a gene’s expression on the magnitude of TE-mediated H3K9me2 enrichment significantly differs between Su(var) genes (green) and other genes in the genome (gray, right). (D) The reduced dosage of Su(var) genes influences the epigenetic silencing effect of 1360. For each candidate Su(var), we performed three replicates (three independent crosses), and one dot represents one cross. (E) The mean magnitude of TE-mediated enrichment of H3K9me2 associates with the abundance of H3K9me2-enriched Kmers. **p<0.01 and *p<0.05 for Mann-Whitney U test or Kolmogorov-Smirnov test (see text).
Figure 6
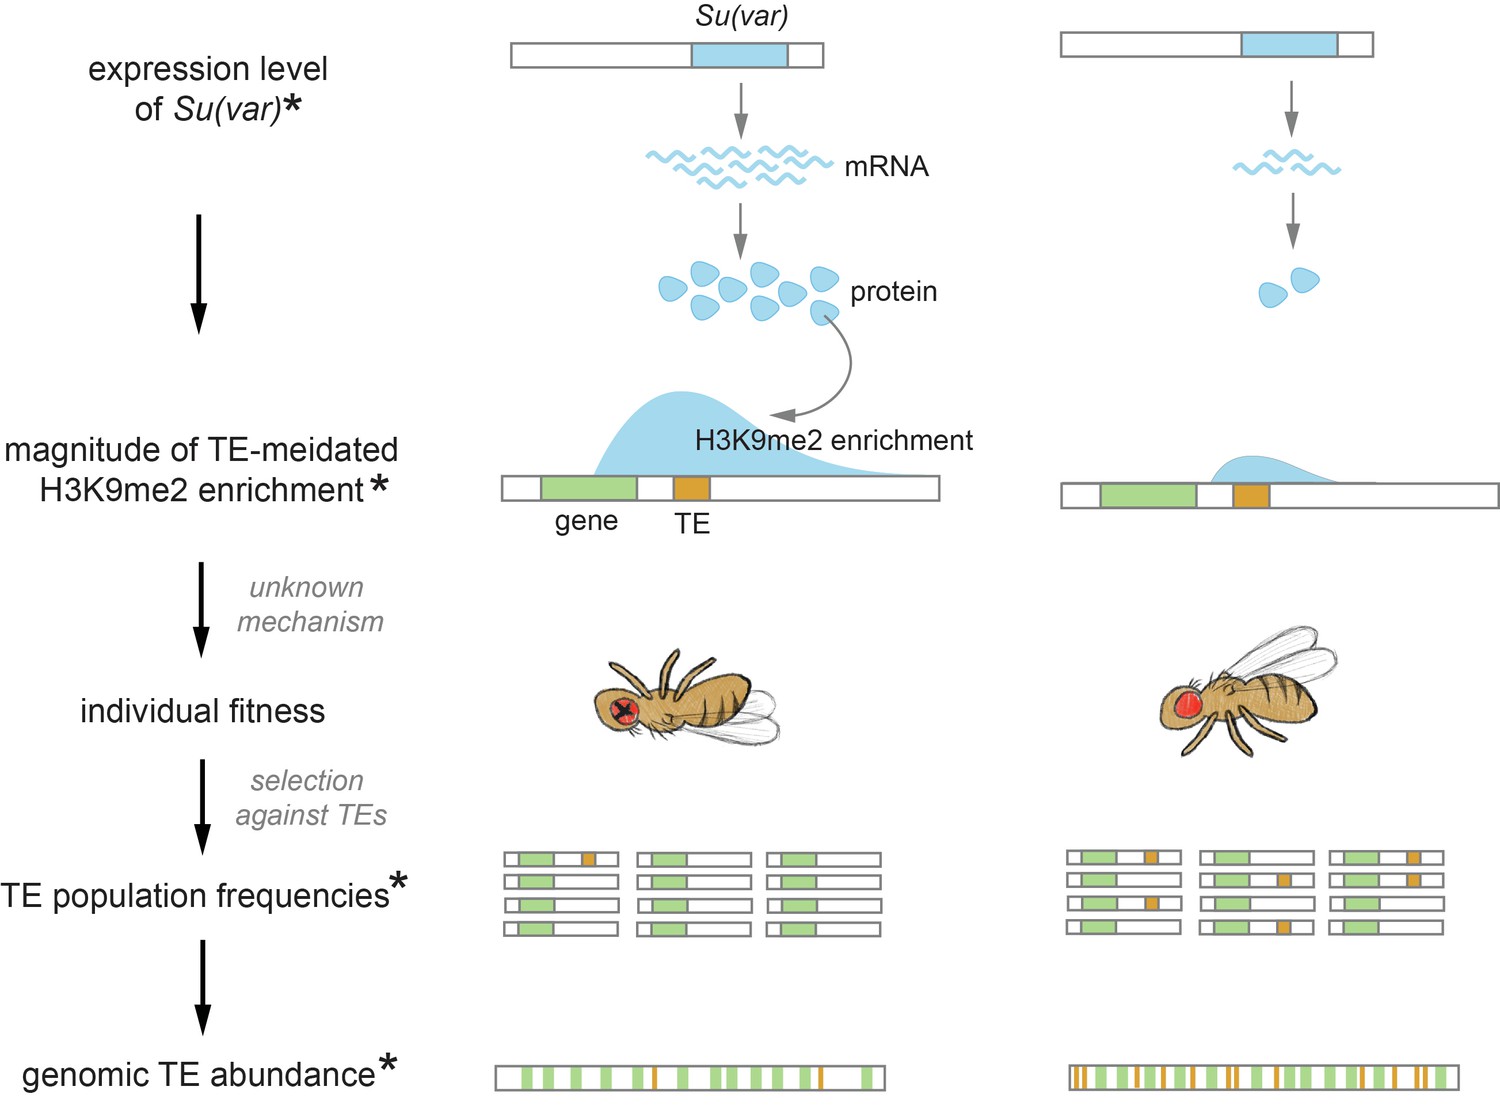
Proposed role of the chromatin landscape in determining genomic transposable element (TE) abundance.
Our observations suggest that higher expression of Su(var)s, which promote a repressive chromatin environment, would result in stronger TE-mediated epigenetic effects (e.g., species on the left). With mechanisms that are yet to be revealed (see Discussion), the stronger epigenetic effects of TEs would reduce individual fitness, resulting in stronger selection against TEs and thus their lower population frequencies. Under the assumptions that the rate of TE increase through transposition is similar across species and the changes in TE copy number is at equilibrium, genomic TE abundance is determined by the strength of selection against TEs. Accordingly, the stronger epigenetic effects of TEs and the associated stronger selection removing them could drive an overall lower genomic TE abundance (e.g., species on the left). Observations made in this study are denoted with *.
Author response image 1

Tables
Table 1
Logistic regression coefficients for the effects of transposable element (TE) length and TE-mediated H3K9me2 enrichment (magnitude and extent) on the population frequencies of TEs.
| Magnitude of H3K9me2 enrichment | Extent of H3K9me2 enrichment | |||
|---|---|---|---|---|
| TE length | Magnitude | TE length | Extent | |
| D. melanogaster | –4.95E-04 | –4.59E-01* | –5.22E-04 | –8.63E-05 |
| D. mauritiana | –1.83E-03 | –2.74E-02 | –1.87E-03 | 1.55E-05 |
| D. simulans (strain 1) | –2.56E-04 | 1.07E-01 | –2.52E-04 | 9.00E-06 |
| D. simulans (strain 2) | –3.13E-03 | –2.50E-01 | –3.21E-03 | –2.41E-04 |
| D. yakuba (strain 1) | –3.63E-04 | –1.68E-01 | –3.73E-04 | –7.77E-05 |
| D. yakuba (strain 2) | –4.66E-04 | –1.27E-01 | –4.72E-04 | –2.87E-04 |
-
Negative regression coefficients for TE-mediated epigenetic effects on TE population frequencies are in bold. *p<0.05.
Table 2
Logistic regression coefficients for the effects of transposable element (TE) length and TE-mediated H3K9me2 enrichment (magnitude and extent) on the population frequencies of TEs from different families.
| Magnitude of H3K9me2 enrichment | Extent of H3K9me2 enrichment | |||
|---|---|---|---|---|
| TE family | TE length | Magnitude | TE length | Extent |
| D. melanogaster | ||||
| BS | –8.10E-03 | –2.65E+00 | –5.18E-03 | –5.16E+02 |
| 297 | –4.86E-04 | –1.43E+00 | –5.12E-04 | –1.10E-04 |
| jockey | 2.17E-04 | –1.30E+00 | 2.50E-04 | –1.42E-03 |
| pogo | 9.46E-04 | –1.04E+00 | 9.18E-04 | 9.47E-05 |
| Doc | 2.65E-04 | 2.20E-01 | 2.96E-04 | 2.55E-04 |
| hopper | –1.53E-04 | 1.36E+00 | –1.63E-04 | –2.14E-04 |
| D. mauritiana | ||||
| HB | –2.94E-03 | –2.10E-01 | –2.96E-03 | –3.23E-05 |
| Bari | –4.78E-03 | 6.58E-01 | –4.96E-03 | 3.65E-04 |
| hopper | 6.66E-03 | –1.96E+00 | 8.70E-03 | –3.72E-04 |
| D. simulans (strain 1) | ||||
| H | 1.84E-02 | –9.70E-02 | 1.76E-02 | –3.08E-04 |
| transib2 | –3.69E-03 | –1.26E+00 | –3.71E-03 | –3.08E-04 |
| Tc1 | –1.19E-01 | –3.56E-01 | –1.16E-01 | –2.33E-04 |
| 1,360 | –3.84E-02 | 1.37E-01 | –4.02E-02 | 8.88E-05 |
| diver2 | 2.16E-04 | –1.39E-01 | –2.54E-04 | –1.39E-03 |
| Helena | –3.99E-03 | 2.85E-01 | –3.62E-03 | 4.20E-04 |
| HB | –2.45E+00 | –4.26E+00 | –2.48E+00 | –1.61E-03 |
| roo | –4.01E-04 | –2.71E-01 | –5.67E-04 | 4.10E-04 |
| D. simulans (strain 2) | ||||
| H | –4.97E-03 | –6.63E-01 | –4.94E-03 | –3.02E-05 |
| Tc1 | –2.28E-03 | –8.68E-01 | –2.46E-03 | –7.59E-04 |
| D. yakuba (strain 1) | ||||
| H | –1.80E-03 | –3.79E-01 | –1.50E-03 | –2.75E-04 |
| Cr1a | 9.53E-05 | –6.66E-01 | –1.05E-04 | –3.35E-04 |
| D. yakuba (strain 2) | ||||
| H | –2.29E-02 | –3.89E-01 | –5.48E-02 | –8.98E-03* |
| Cr1a | 1.32E-03 | –1.32E+00* | 4.42E-04 | –1.27E-04 |
-
Negative regression coefficients for TE-mediated epigenetic effects on TE population frequencies are in bold. *p<0.05.
Additional files
-
Supplementary file 1
Correlation coefficient and regression coefficient for the associations between Su(var) expression rank and the magnitude of transposable element (TE)-mediated H3K9me2 enrichment.
Genome-wide percentiles for correlation coefficient: –0.7142 (5%) and –0.5952 (10%); genome-wide percentiles for regression coefficient: –0.4208 (5%) and –0.3208 (10%).
- https://cdn.elifesciences.org/articles/81567/elife-81567-supp1-v1.xlsx
-
MDAR checklist
- https://cdn.elifesciences.org/articles/81567/elife-81567-mdarchecklist1-v1.docx
Download links
A two-part list of links to download the article, or parts of the article, in various formats.
Downloads (link to download the article as PDF)
Open citations (links to open the citations from this article in various online reference manager services)
Cite this article (links to download the citations from this article in formats compatible with various reference manager tools)
Species-specific chromatin landscape determines how transposable elements shape genome evolution
eLife 11:e81567.
https://doi.org/10.7554/eLife.81567


