Regulated degradation of the inner nuclear membrane protein SUN2 maintains nuclear envelope architecture and function
- Sir William Dunn School of Pathology, University of Oxford, United Kingdom
- Nuffield Department of Medicine, Target Discovery Institute, University of Oxford, United Kingdom
Figures
Figure 1 with 1 supplement
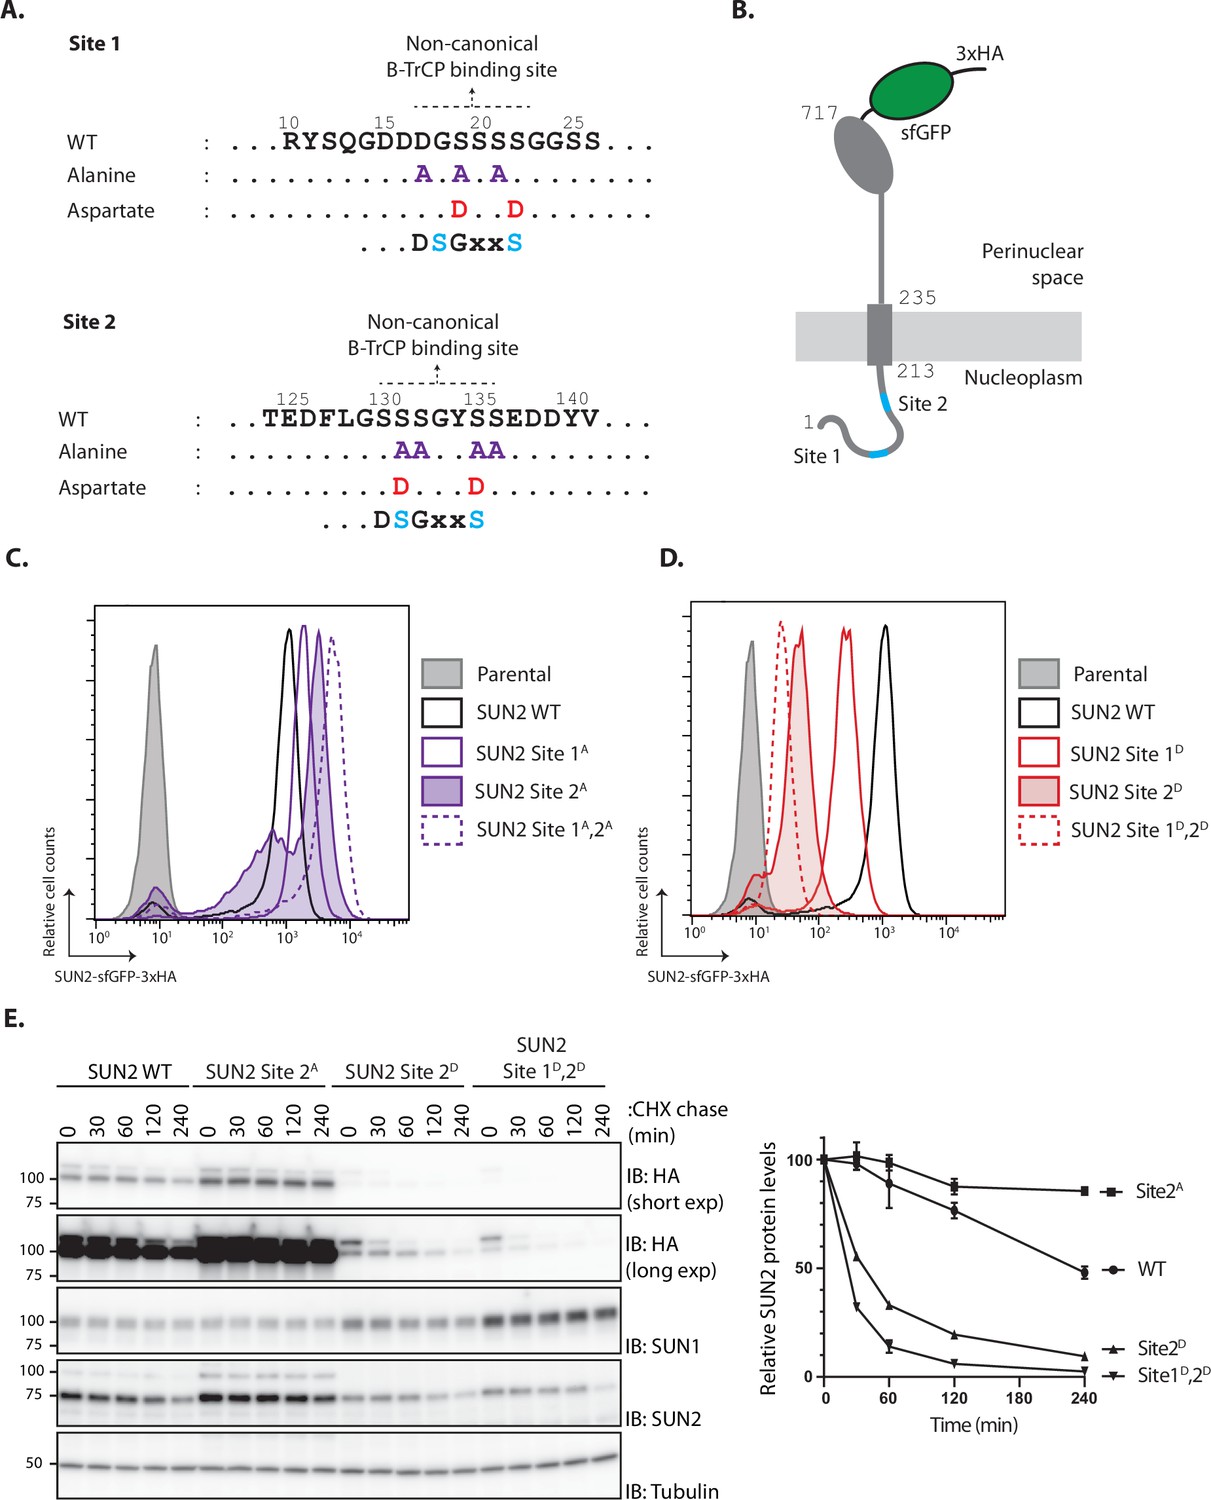
SUN2 stability depends on a non-canonical recognition motif for the SCFβTrCP ubiquitin ligase.
(A) SUN2 nucleoplasmic regions containing non-canonical recognition motifs for the SCFβTrCP hereafter called Sites 1 and 2. In each case, the residues mutated to Alanine (purple) or to Aspartate (red) are indicated. The canonical SCFβTrCP recognition motif (DSGXXS) is indicated. SCFβTrCP binding occurs only to serine residues (Cyan) that are phosphorylated. (B) Schematic representation of SUN2-GFP-3HA construct used in most experiments. Sites 1 and 2 in the SUN2 nucleoplasmic region are indicated in Cyan. (C, D) Flow cytometry analysis of doxycycline-induced expression of SUN2 WT or derivatives in HEK TF cells. Analysis was performed 24 hr after SUN2 expression. (E) Analysis of the stability of SUN2 WT and the indicated mutants after inhibition of protein synthesis by cycloheximide (CHX). Cell extracts were analyzed by sodium dodecyl sulfate–polyacrylamide gel electrophoresis (SDS–PAGE) and immunoblotting. Transgenic WT and mutant SUN2 were detected with anti-HA antibody. Endogenous SUN2 was detected with anti-SUN2 antibody. This antibody recognizes the C-terminal peptide of SUN2 and is deficient in recognizing SUN2 if tagged C-terminally. Endogenous SUN1 was detected with anti-SUN1 antibody. Tubulin was used as a loading control and detected with an anti-Tubulin antibody.
-
Figure 1—source data 1
File contains original immunoblots for Figure 1E.
- https://cdn.elifesciences.org/articles/81573/elife-81573-fig1-data1-v2.zip
Figure 1—figure supplement 1
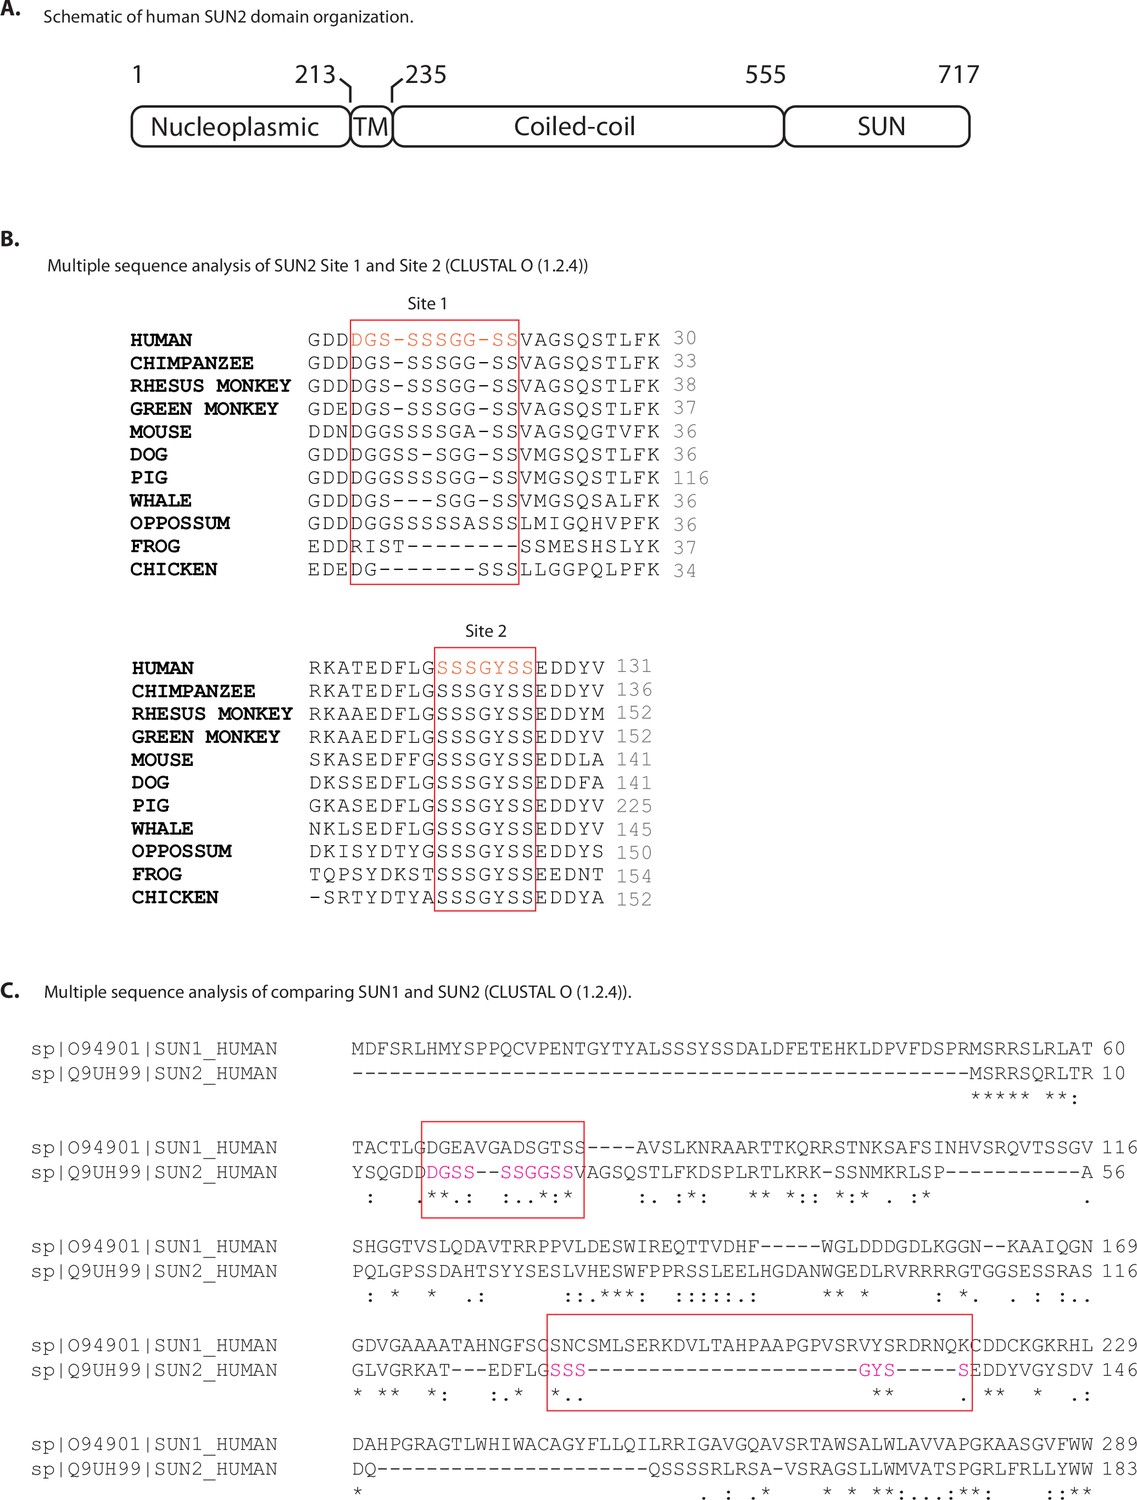
Evolutionary conservation analysis of SUN2 protein sequence.
(A) Schematic of human SUN2 domain organization. (B) Multiple sequence analysis of SUN2 Site 1 (top) and Site 2 (bottom) among primates (chimpanzee, rhesus, and green monkeys), other mammals (mouse and dog) and marsupial (Oppossum), amphibian (frog), and bird (chicken). Regions corresponding to human SUN2 Sites 1 and 2 are indicated by boxes. (C) Multiple sequence analysis of nucleoplasmic sequences of human SUN1 and SUN2 proteins. Regions corresponding to human SUN2 Sites 1 and 2 are indicated by boxes. Gaps are represented as dash (-). The asterisk (*), colon (:), and dot (.) indicate identical amino acid residues, conserved substitution, and semi-conserved substitutions, respectively, in the sequence alignment.
Figure 2 with 1 supplement

Inner nuclear membrane (INM) degradation of SUN2 by an ERAD-like process.
(A) Flow cytometry analysis of tetracycline-induced expression of SUN2 WT, Sites 2A and 2D in HEK TF cells. Analysis was performed 24 hr post-induction in cells left untreated, incubated 4 hr with inhibitors to SCFβTrCP neddylation (MLN-4924; 1 µM), p97 (CB-5083; 2.5 µM, CB), or the proteasome (Bortezomib; 1 µM, Btz). (B) Analysis of SUN2 WT steady-state levels in HEK TF cells. Analysis was performed 24 hr post-induction in cells left untreated, incubated 4 hr with inhibitors to SCFβTrCP neddylation (MLN-4924; 1 µM), p97 (CB-5083; 2.5 µM, CB), or the proteasome (Bortezomib; 1 µM, Btz). Cell extracts were analyzed by sodium dodecyl sulfate–polyacrylamide gel electrophoresis (SDS–PAGE) and immunoblotting. SUN2 WT was detected with anti-HA antibodies. GAPDH was used as a loading control and detected with an anti-GAPDH antibody. (C) Analysis of SUN2 Site 2D steady-state levels in HEK TF cells. Analysis was performed 24 hr post-induction in cells incubated 4 hr with Dimethyl Sulfoxide (DMSO) (vehicle) or the inhibitors to SCFβTrCP neddylation (MLN-4924; 1 µM), p97 (CB-5083; 2.5 µM, CB), the proteasome (Bortezomib; 1 µM, Btz and 10 µM MG132), or incubated 6 hr with bafilomycin A (1 µM, Baf) that inhibits lysosomal delivery. Cell extracts were analyzed by SDS–PAGE and immunoblotting. SUN2 Site 2D was detected with anti-HA antibodies. LC3B was analyzed to confirm effectiveness of bafilomycin A treatment and was detected with an anti-LC3B antibody. GAPDH was used as a loading control and detected with an anti-GAPDH antibody. (D) Immunofluorescence in HeLa cells expressing SUN2 Site 2D. Expression of SUN2 Site 2D was induced with Dox for 24 hr and incubated for 4 hr with DMSO (vehicle) or the inhibitors to SCFβTrCP neddylation (MLN-4924; 1 µM), p97 (CB-5083; 2.5 µM, CB), and the proteasome (Bortezomib; 1 µM, Btz). SUN2 Site 2D was detected with anti-HA antibodies. The ER marker Calnexin was detected with an anti-Calnexin antibody and DNA was labelled with 4',6-diamidino-2-phenylindole (DAPI). Scale bar: 10 µm.
-
Figure 2—source data 1
File contains original immunoblots for Figure 2B.
- https://cdn.elifesciences.org/articles/81573/elife-81573-fig2-data1-v2.zip
-
Figure 2—source data 2
File contains original immunoblots for Figure 2C.
- https://cdn.elifesciences.org/articles/81573/elife-81573-fig2-data2-v2.zip
Figure 2—figure supplement 1
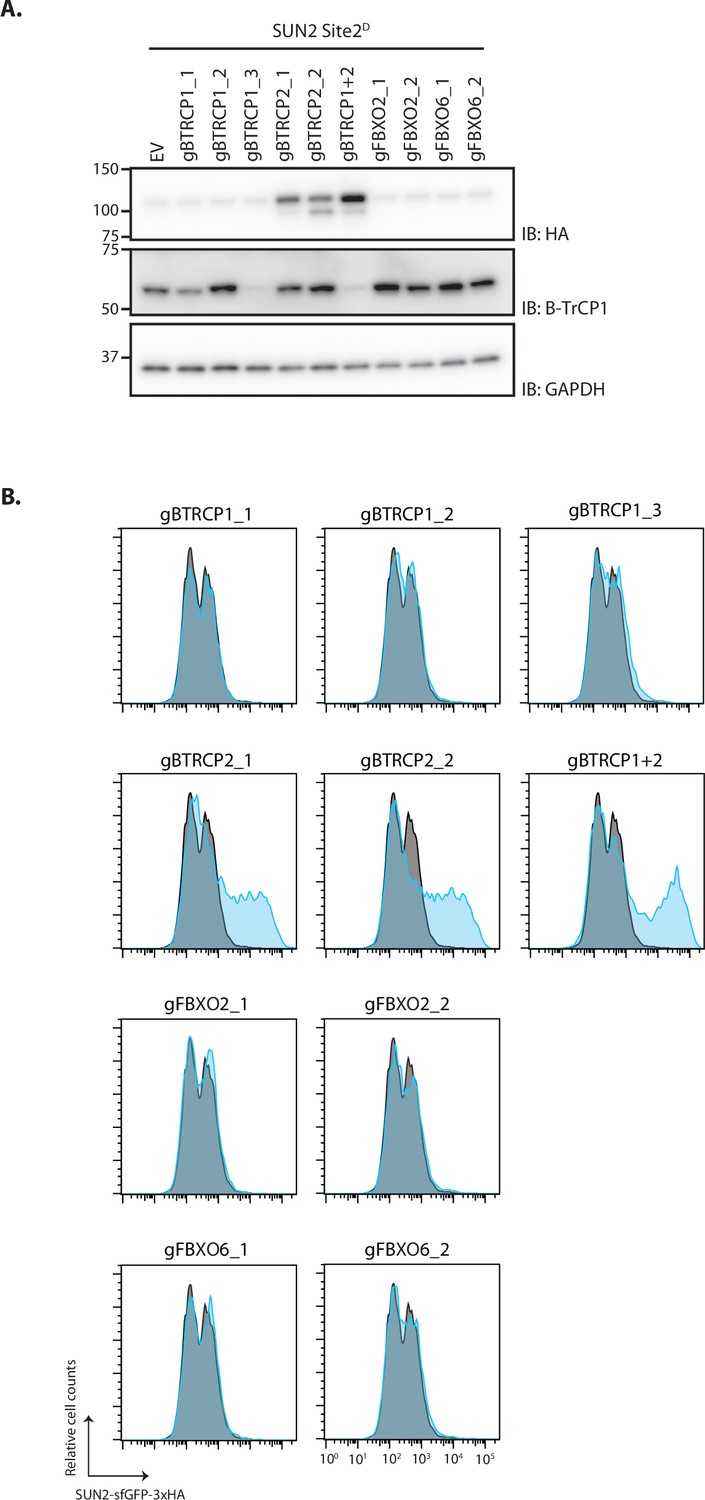
Depletion of β-TrCP1/2 stabilizes SUN2 Site 2D.
(A) Western blot analysis of SUN2 Site 2D steady-state levels in HEK TF cells transfected with an empty vector (EV), sgRNAs against βTrCP1 (three independent gRNAs), βTrCP2 (two independent gRNAs), or both. sgRNAs targeting unrelated F-Box genes FBXO2 and FBXO6 were included as specificity control. Cell extracts were analyzed by sodium dodecyl sulfate–polyacrylamide gel electrophoresis (SDS–PAGE) and immunoblotting. Transgenic SUN2 was detected with anti-HA antibody. Depletion of βTrCP1 is detected with anti-βTrCP1 antibody. Tubulin was used as a loading control and detected with an anti-Tubulin antibody. (B) Flow cytometry analysis of SUN2 Site 2D steady-state levels in HEK TF cells treated as in (A). Cells transfected with EV are shown in grey and specific gRNA for specific genes in blue.
-
Figure 2—figure supplement 1—source data 1
File contains original immunoblots for Figure 2—figure supplement 1A.
- https://cdn.elifesciences.org/articles/81573/elife-81573-fig2-figsupp1-data1-v2.zip
Figure 3
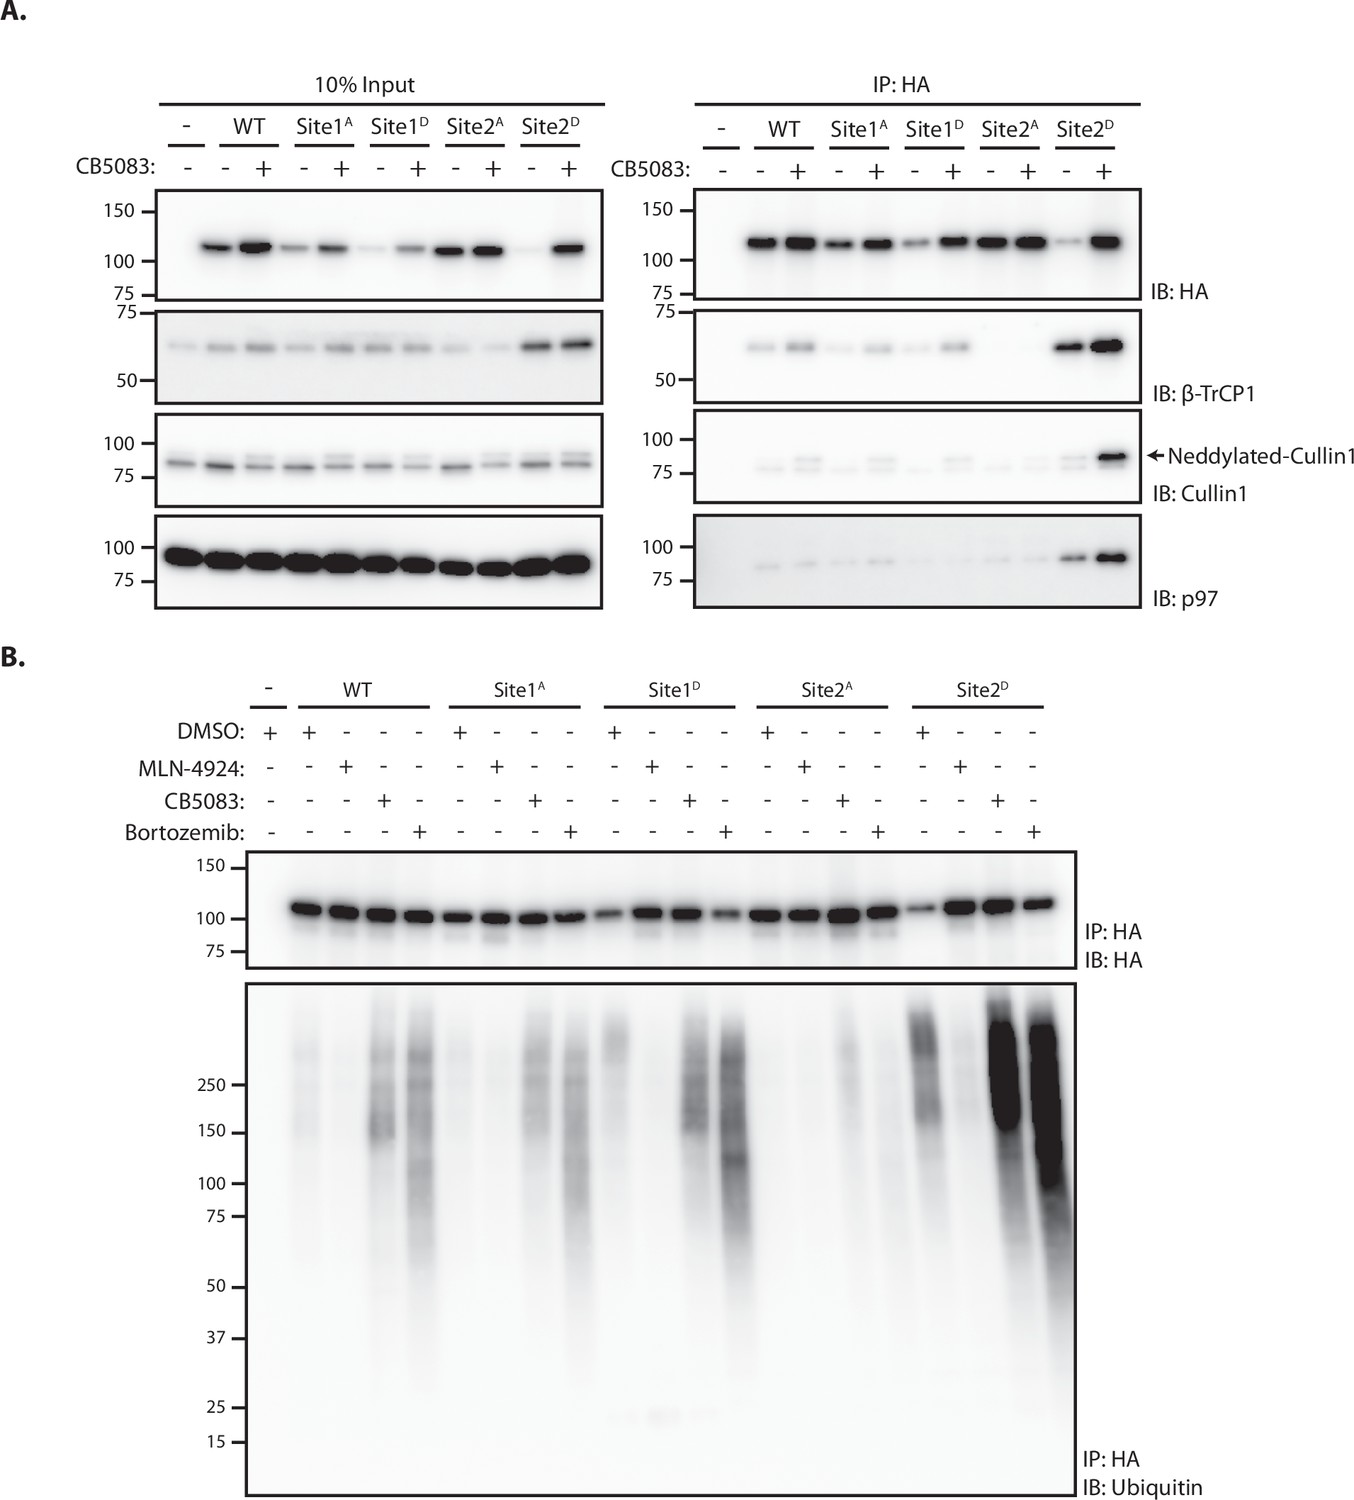
Site 2 is critical for SUN2 recognition and ubiquitination by SCFβTrCP.
(A) Binding of WT and the indicated SUN2 mutants to subunits of the ubiquitin ligase SCFβTrCP and the ATPase p97 analyzed by immunoprecipitation. Expression of SUN2 derivatives was induced with Dox for 24 hr and treated with DMSO (−) or CB-5083 (+) for 4 hr before cell lysis and immunoprecipitation with anti-HA coated beads. Eluted proteins were separated by sodium dodecyl sulfate–polyacrylamide gel electrophoresis (SDS–PAGE) and analyzed by western blotting with the indicated antibodies. (B) Ubiquitination of WT and the indicated SUN2 mutants in cells incubated 4 hr with DMSO (vehicle) or the inhibitors to SCFβTrCP neddylation (MLN-4924; 1 µM), p97 (CB-5083; 2.5 µM, CB), and the proteasome (Bortezomib; 1 µM, Btz). Upon immunoprecipitation with anti-HA coated beads, eluted proteins were separated by SDS–PAGE and analyzed by western blotting with anti-HA and anti-ubiquitin antibodies.
-
Figure 3—source data 1
File contains original immunoblots for Figure 3A.
- https://cdn.elifesciences.org/articles/81573/elife-81573-fig3-data1-v2.zip
-
Figure 3—source data 2
File contains original immunoblots for Figure 3B.
- https://cdn.elifesciences.org/articles/81573/elife-81573-fig3-data2-v2.zip
Figure 4 with 1 supplement
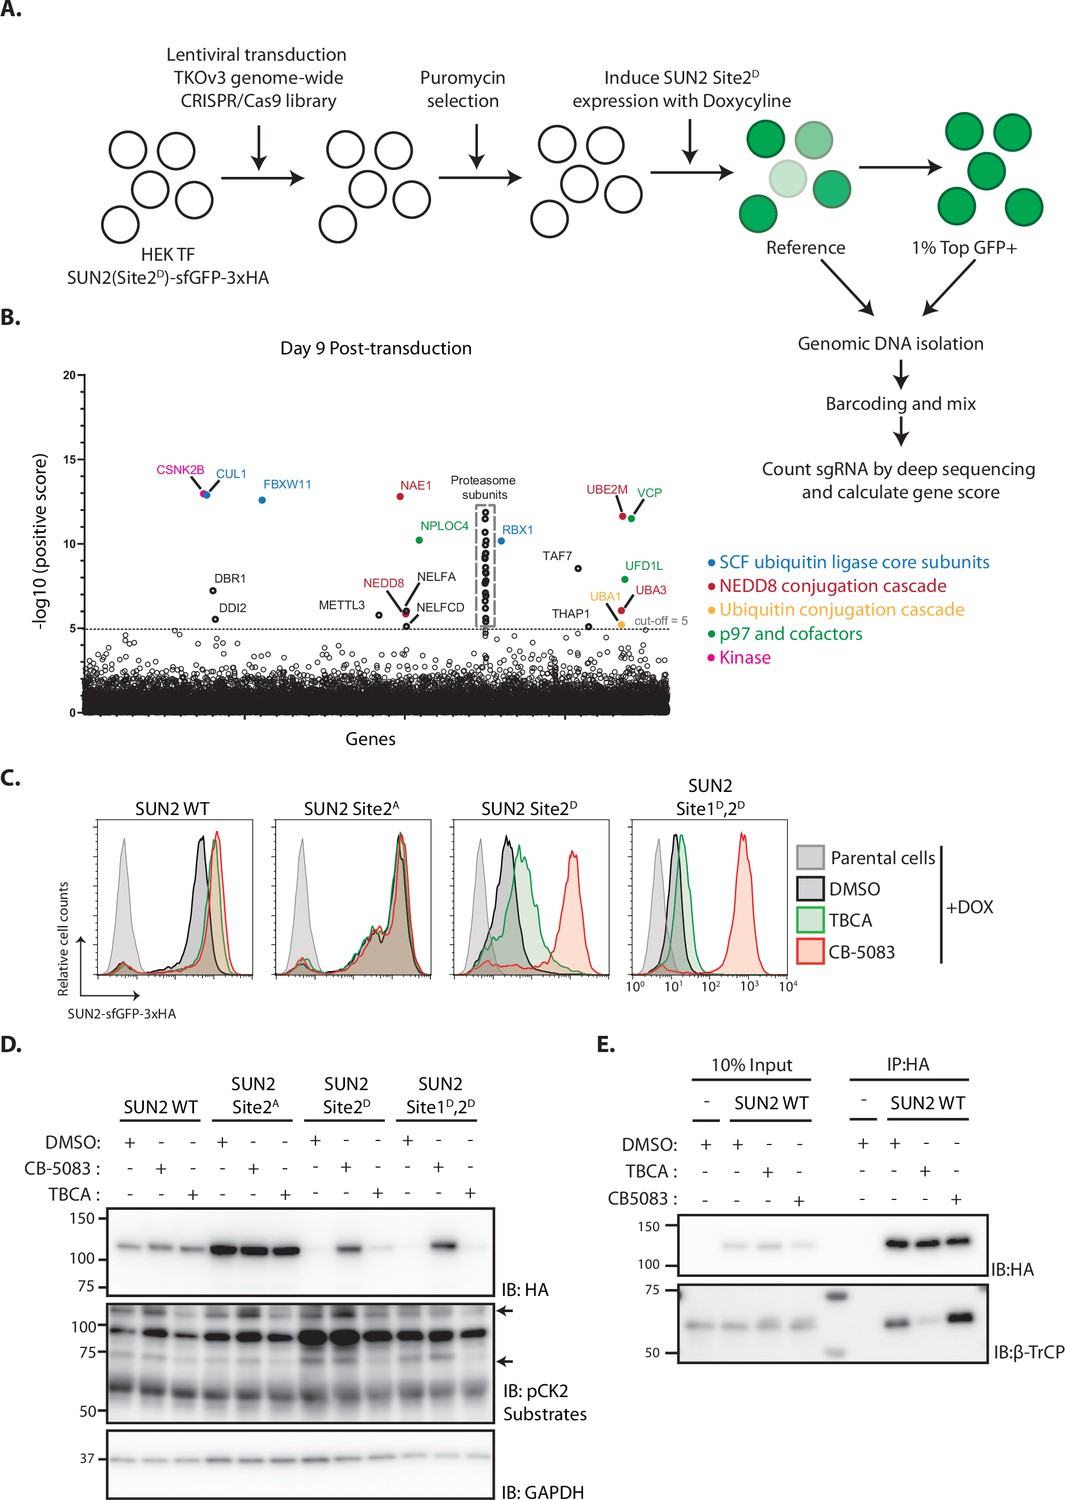
Genome-wide screening identifies Casein Kinase 2 as a positive regulator of SUN2 degradation.
(A) Workflow of the CRISPR-Cas9 genome-wide screen. (B) Significance score of the genes analyzed in the screen calculated by the MAGeCK algorithm. The x-axis represents the genes in alphabetical order. The y-axis shows the −log(αRRA) significance value. The −log(αRRA) cut-off was arbitrarily set at 5 (dashed line). Significantly enriched genes are annotated and colour coded: genes related to SCF ubiquitin ligase core subunits (blue), NEDD8 conjugation cascade (red), ubiquitin conjugation cascade (orange), p97 and co-factors (green), and kinase (pink). Proteasome subunits are shown in a grey dotted box. Flow cytometry (C) and western blotting (D) analysis of Dox-induced expression of WT, Sites 2A, 2D, and Sites 1D, 2D SUN2 in HEK TF cells. Analysis was performed 24 hr post-induction in cells incubated 6 hr with inhibitors to Casein Kinase 2 (tetrabromocinnamic acid, TBCA; 100 µM) and p97 (CB-5083; 2.5 µM, CB). SUN2 derivatives were detected with anti-HA antibody. CK2 inhibition was confirmed by blotting with anti-phospho-CK2 substrates antibody. GAPDH was used as a loading control and detected with an anti-GAPDH antibody. (E) Immunoprecipitation of SUN2 WT from cells incubated 6 hr with DMSO (vehicle), Casein Kinase 2 inhibitor (TBCA; 100 µM), and p97 inhibitor (CB-5083; 2.5 µM, CB). Cell lysates were immunoprecipitated with anti-HA coated beads. Eluted proteins were separated by sodium dodecyl sulfate–polyacrylamide gel electrophoresis (SDS–PAGE) and analyzed by western blotting with the indicated antibodies.
-
Figure 4—source data 1
File contains original immunoblots for Figure 4D.
- https://cdn.elifesciences.org/articles/81573/elife-81573-fig4-data1-v2.zip
-
Figure 4—source data 2
File contains original immunoblots for Figure 4E.
- https://cdn.elifesciences.org/articles/81573/elife-81573-fig4-data2-v2.zip
Figure 4—figure supplement 1
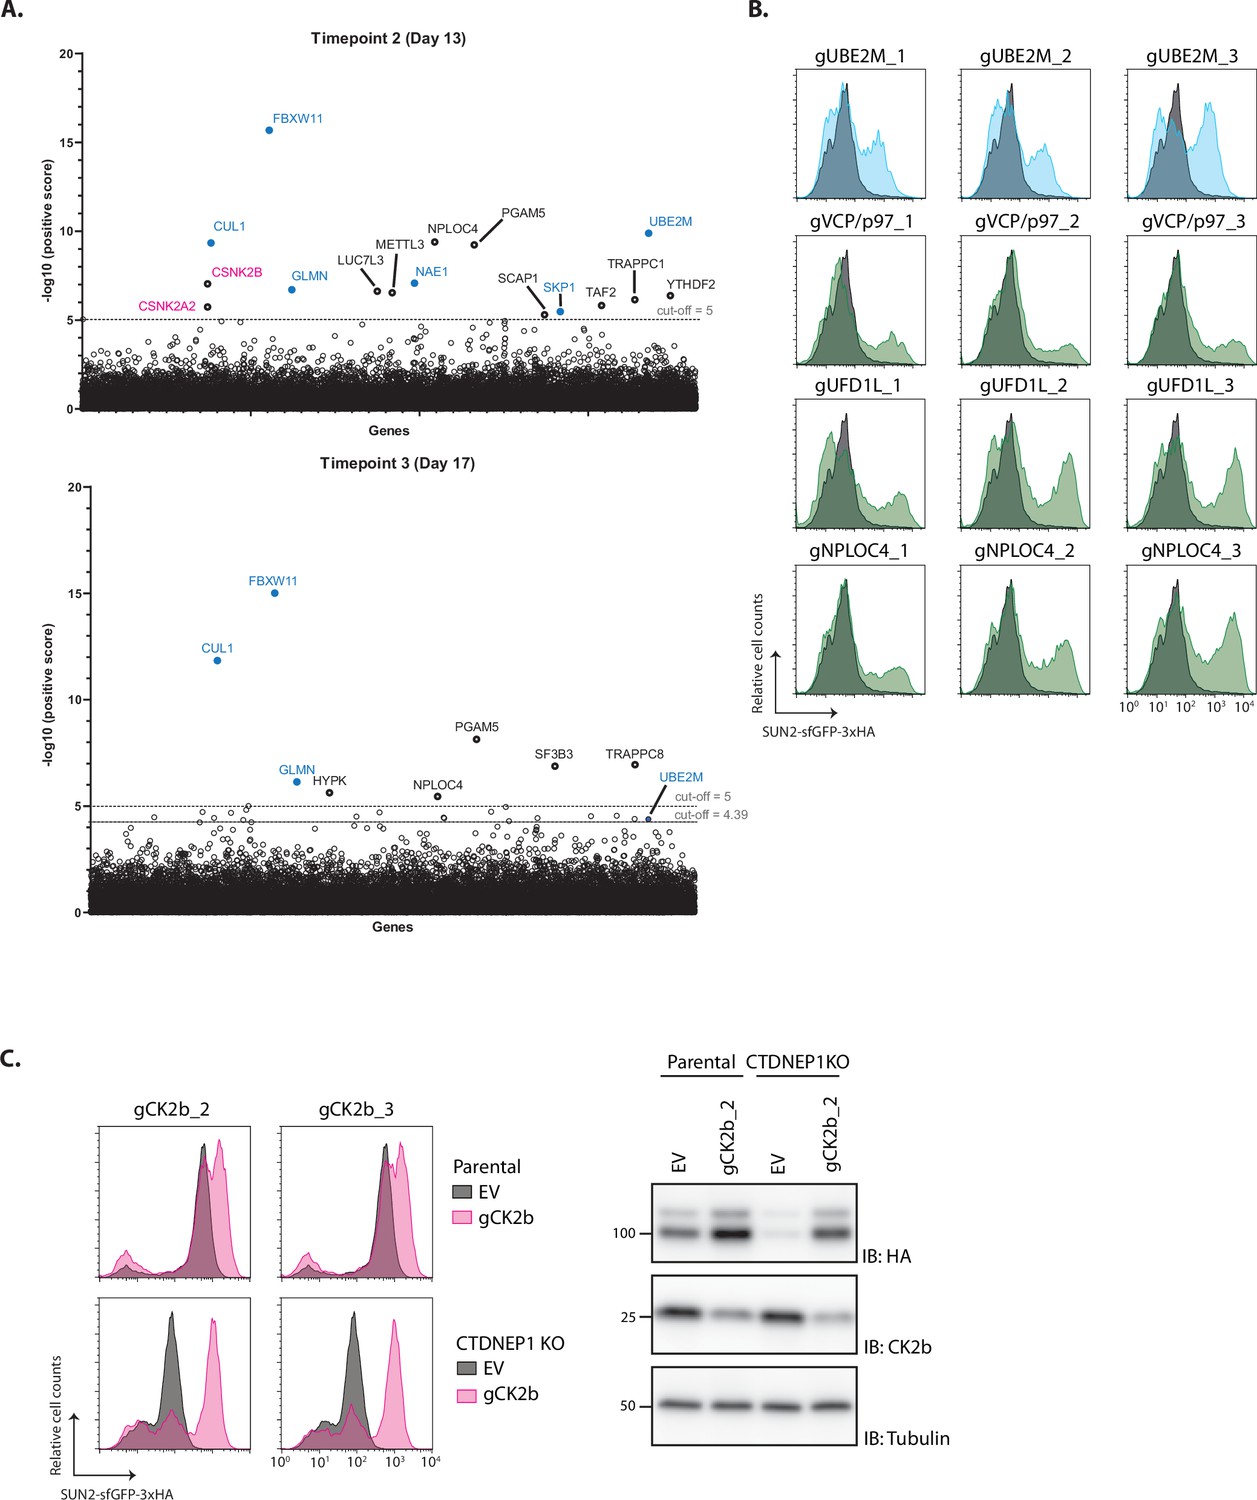
Analysis of genome-wide CRISPR/Cas9 genetic screening.
(A) Significance score of the genes analyzed in the genome-wide CRISPR/Cas9 genetic screen calculated by the MAGeCK algorithm as done in Figure 5 for additional timepoints at days 13 (top) and 17 (bottom) post-TKO lentivirus transduction. Core and regulatory subunits of the SCF ubiquitin ligase are indicated in blue. (B) Flow cytometry analysis of validation of several hits from the screen with three independent gRNAs in HEK TF SUN2 Site 2D cells. Cells transfected with EV are shown in grey and with specific gRNA for specific genes in blue (a regulatory component of SCF ubiquitin ligase) and green (p97 and p97 co-factors). (C) Flow cytometry (left) and western blot (right) analysis of SUN2 WT steady-state levels in parental HEK TF cells and CTDNEP1 KO cells, which display lower SUN2 levels (see Figure 5), transfected with an empty vector (EV) or sgRNAs targeting CK2b. On the left, cell extracts were analyzed by sodium dodecyl sulfate–polyacrylamide gel electrophoresis (SDS–PAGE) and SUN2 was detected with anti-HA antibody. Depletion of CK2b was confirmed with an anti-CK2b antibody. Tubulin was used as a loading control and detected with an anti-Tubulin antibody.
-
Figure 4—figure supplement 1—source data 1
File contains original immunoblots for Figure 4—figure supplement 1.
- https://cdn.elifesciences.org/articles/81573/elife-81573-fig4-figsupp1-data1-v2.zip
Figure 5 with 1 supplement
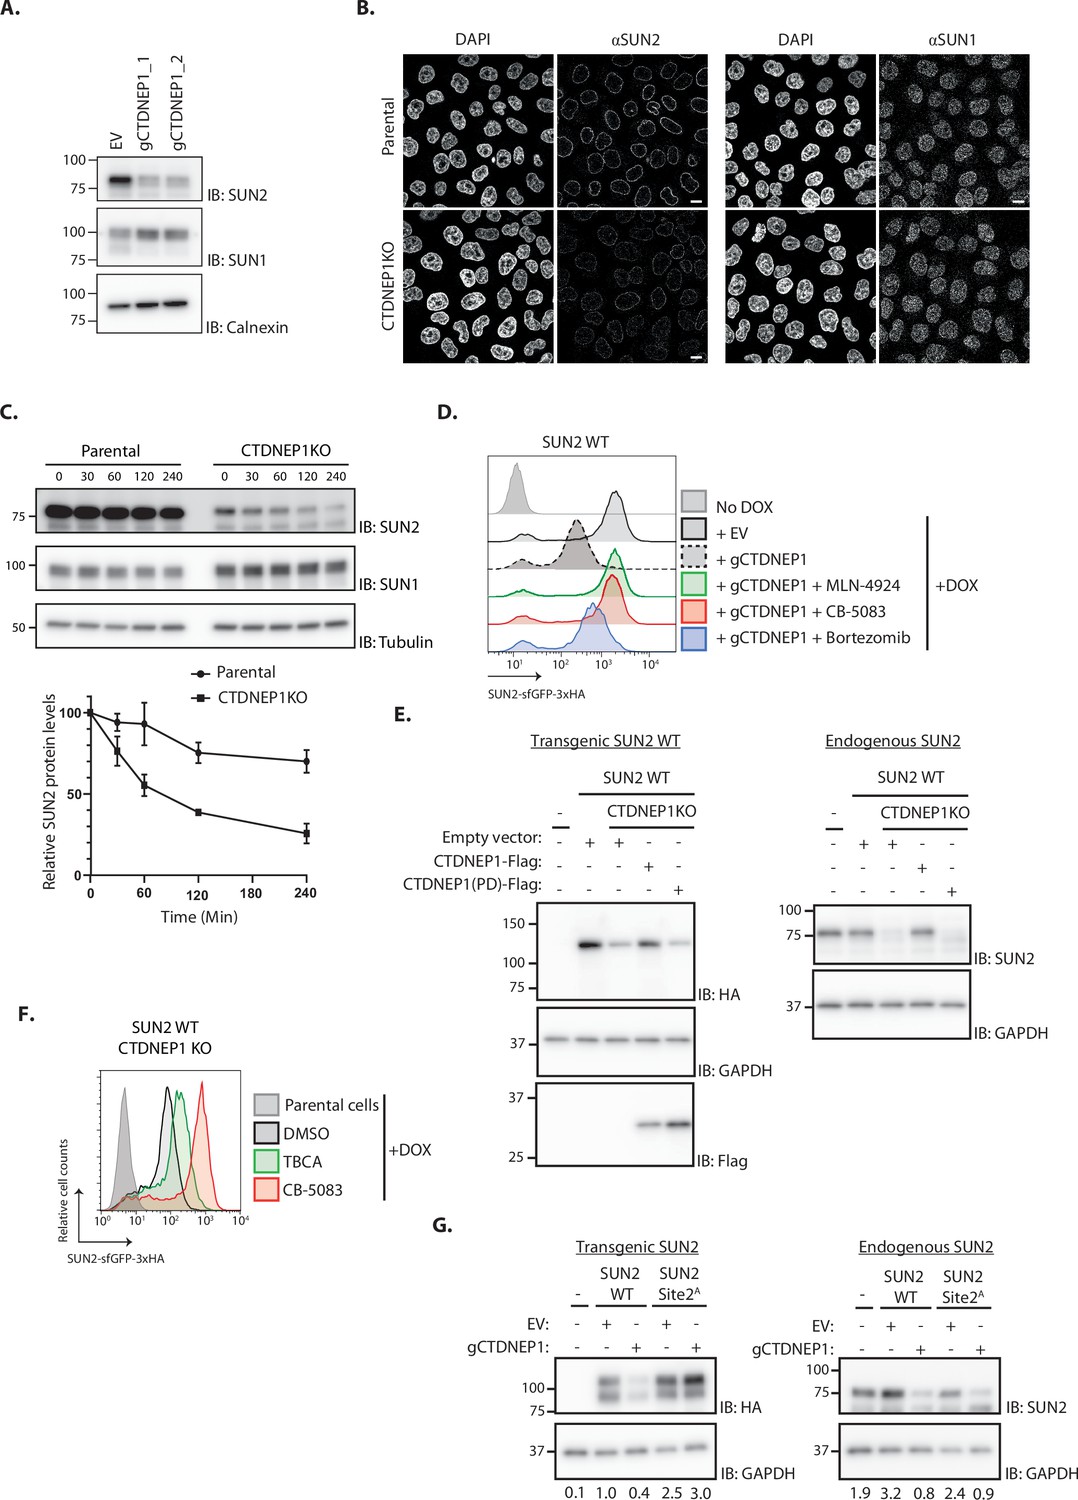
The phosphatase CTDNEP1 is a negative regulator of SUN2 degradation.
(A) Steady-state levels of endogenous SUN2 in HEK TF transfected with an empty vector (EV) or sgRNAs targeting CTDNEP1. Cell extracts were analyzed by sodium dodecyl sulfate–polyacrylamide gel electrophoresis (SDS–PAGE) and immunoblotting with anti-SUN2 and anti-SUN1 antibodies. Calnexin was used as a loading control and detected with an anti-Calnexin antibody. (B) Immunofluorescence in parental and CTDNEP1 KO HeLa cells. Expression of SUN2 Site 2D was induced with Dox for 24 hr. Endogenous SUN2 and SUN1 were detected with anti SUN2 and anti-SUN1 antibodies, respectively. DNA was labelled with DAPI. Scale bar: 10 µm. (C) Analysis of endogenous SUN2 stability after inhibition of protein synthesis by cycloheximide (CHX) in parental and CTDNEP1 KO HEK TF cells. Cell extracts were analyzed by SDS–PAGE and immunoblotting. Endogenous SUN2 and SUN1 were detected with anti SUN2 and anti-SUN1 antibodies, respectively. Tubulin was used as a loading control and detected with an anti-Tubulin antibody. Three independent experiments were quantified on the right. (D) Flow cytometry analysis of SUN2 WT in HEK TF cells transfected with an empty vector (EV) or with a sgRNA targeting CTDNEP1. Analysis was performed 24 hr post-Dox induction in cells left untreated or incubated 4 hr with inhibitors to SCFβTrCP neddylation (MLN-4924; 1 µM), p97 (CB-5083; 2.5 µM, CB), or the proteasome (Bortezomib; 1 µM, Btz). (E) Analysis of transgenic (+Dox; left) and endogenous SUN2 (No Dox; right) steady-state levels in HEK TF SUN2 WT-expressing parental and CTDNEP1 KO cells transfected with an empty vector (EV), a vector encoding FLAG-tagged WT CTDNEP1 or phosphatase dead CTDNEP1 (PD). Exogenous SUN2 WT and endogenous SUN2 were detected with anti-HA and anti-SUN2 antibodies, respectively. CTDNEP1-FLAG was detected with anti-FLAG antibodies. GAPDH was used as a loading control and detected with an anti-GAPDH antibody. (F) Flow cytometry analysis of SUN2 WT in CTDNEP1 KO HEK TF cells. Analysis was performed 24 hr post-Dox induction in cells incubated 6 hr with DMSO (vehicle), Casein Kinase 2 inhibitor (tetrabromocinnamic acid, TBCA; 100 µM), and p97 inhibitor (CB-5083; 2.5 µM, CB). (G) Analysis of transgenic (+Dox; left) and endogenous SUN2 (No Dox; right) steady-state levels in HEK TF SUN2 WT or Site 2 A cells transfected with an empty vector (EV) or with a sgRNA targeting CTDNEP1. Transgenic and endogenous SUN2 were detected with anti-HA and anti-SUN2 antibodies, respectively. GAPDH was used as a loading control and detected with an anti-GAPDH antibody. The abundance of SUN2 in relation to GAPDH was quantified and is shown below each lane.
-
Figure 5—source data 1
File contains original immunoblots for Figure 5A.
- https://cdn.elifesciences.org/articles/81573/elife-81573-fig5-data1-v2.zip
-
Figure 5—source data 2
File contains original immunoblots for Figure 5C.
- https://cdn.elifesciences.org/articles/81573/elife-81573-fig5-data2-v2.zip
-
Figure 5—source data 3
File contains original immunoblots for Figure 5E.
- https://cdn.elifesciences.org/articles/81573/elife-81573-fig5-data3-v2.zip
-
Figure 5—source data 4
File contains original immunoblots for Figure 5G.
- https://cdn.elifesciences.org/articles/81573/elife-81573-fig5-data4-v2.zip
Figure 5—figure supplement 1
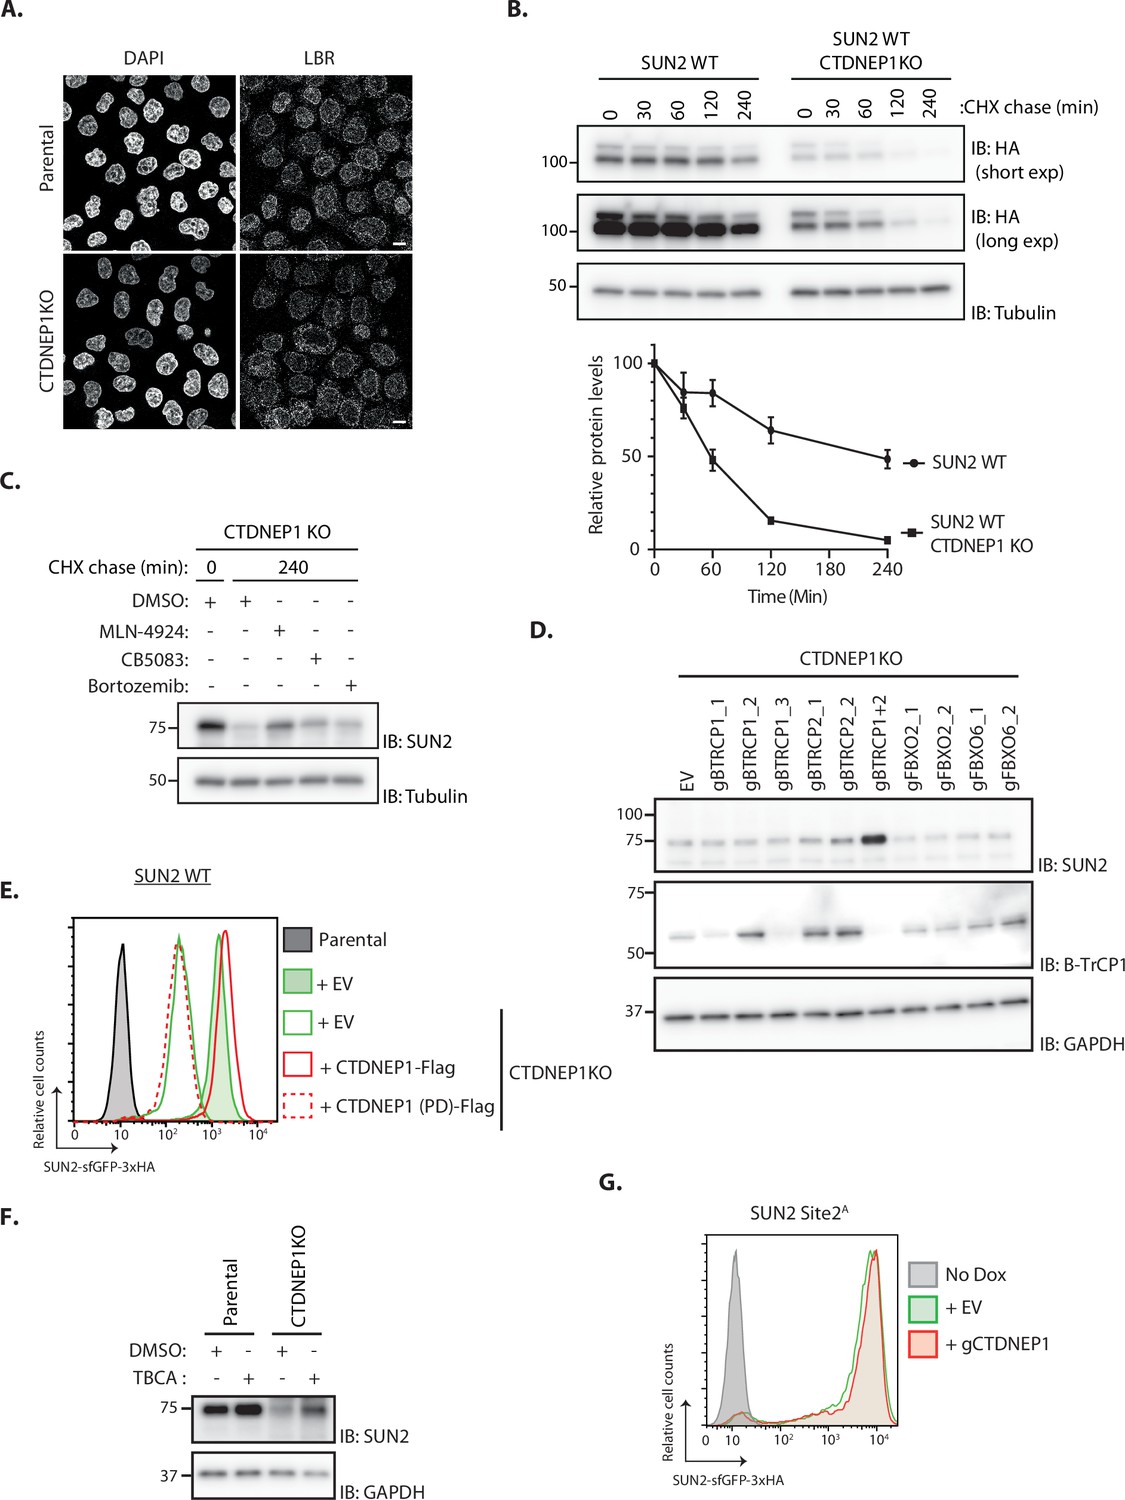
Characterization of the CTDNEP1 role in SUN2 degradation.
(A) Immunofluorescence in parental and CTDNEP1 KO HeLa cells. Expression of SUN2 Site 2D was induced with Dox for 24 hr. Endogenous Lamin-B receptor (LBR) was detected with anti-LBR antibody. DNA was labelled with DAPI. Scale bar: 10 µm. (B) Analysis of transgenic SUN2 stability after inhibition of protein synthesis by cycloheximide (CHX) in HEK TF SUN2 WT-expressing parental and CTDNEP1 KO cells. Cell extracts were analyzed by sodium dodecyl sulfate–polyacrylamide gel electrophoresis (SDS–PAGE) and immunoblotting. Transgenic SUN2 is detected with anti-HA. Tubulin was used as a loading control and detected with an anti-Tubulin antibody. Three independent experiments are quantified on the graph below. (C) The degradation of endogenous SUN2 in CTDNEP1 KO HEK TF cells is curbed by inhibitors to SCFβTrCP neddylation (MLN-4924; 1 µM), p97 ATPase (CB-5083; 2.5 µM, CB), or the proteasome (Bortezomib; 1 µM, Btz). Cell extracts were analyzed by SDS–PAGE and immunoblotting. Endogenous SUN2 was detected with anti SUN2 antibody. Tubulin was used as a loading control and detected with an anti-Tubulin antibody. (D) Western blot analysis of endogenous SUN2 steady-state levels in HEK TF cells transfected with an empty vector (EV), sgRNAs against βTrCP1 (three independent gRNAs), βTrCP2 (two independent gRNAs), or both. sgRNAs targeting unrelated F-Box genes FBXO2 and FBXO6 were included as specificity control. Cell extracts were analyzed by SDS–PAGE and immunoblotting. Endogenous SUN2 was detected with an anti-SUN2 antibody. Depletion of βTrCP1 is detected with anti-βTrCP1 antibody. Tubulin was used as a loading control and detected with an anti-Tubulin antibody. (E) Flow cytometry analysis of transgenic SUN2 steady-state levels in HEK TF SUN2 WT-expressing parental and CTDNEP1 KO cells transfected with an empty vector (EV), a vector encoding FLAG-tagged WT or phosphatase dead (PD) CTDNEP1. (F) Western blotting analysis of parental and CTDNEP1KO HEK TF cells incubated 6 hr with Casein Kinase 2 inhibitor (tetrabromocinnamic acid, TBCA; 100 µM) or DMSO as a control. SUN2 was detected with anti-SUN2 antibody. GAPDH was used as a loading control and detected with an anti-GAPDH antibody. (G) Flow cytometry analysis of transgenic SUN2 steady-state levels in HEK TF SUN2 Site 2A-expressing cells transfected with an empty vector (EV) or sgRNAs targeting CTDNEP1.
-
Figure 5—figure supplement 1—source data 1
File contains original immunoblots for Figure 5—figure supplement 1B.
- https://cdn.elifesciences.org/articles/81573/elife-81573-fig5-figsupp1-data1-v2.zip
-
Figure 5—figure supplement 1—source data 2
File contains original immunoblots for Figure 5—figure supplement 1C.
- https://cdn.elifesciences.org/articles/81573/elife-81573-fig5-figsupp1-data2-v2.zip
-
Figure 5—figure supplement 1—source data 3
File contains original immunoblots for Figure 5—figure supplement 1D.
- https://cdn.elifesciences.org/articles/81573/elife-81573-fig5-figsupp1-data3-v2.zip
-
Figure 5—figure supplement 1—source data 4
File contains immunoblots for Figure 5—figure supplement 1F.
- https://cdn.elifesciences.org/articles/81573/elife-81573-fig5-figsupp1-data4-v2.zip
Figure 6 with 1 supplement
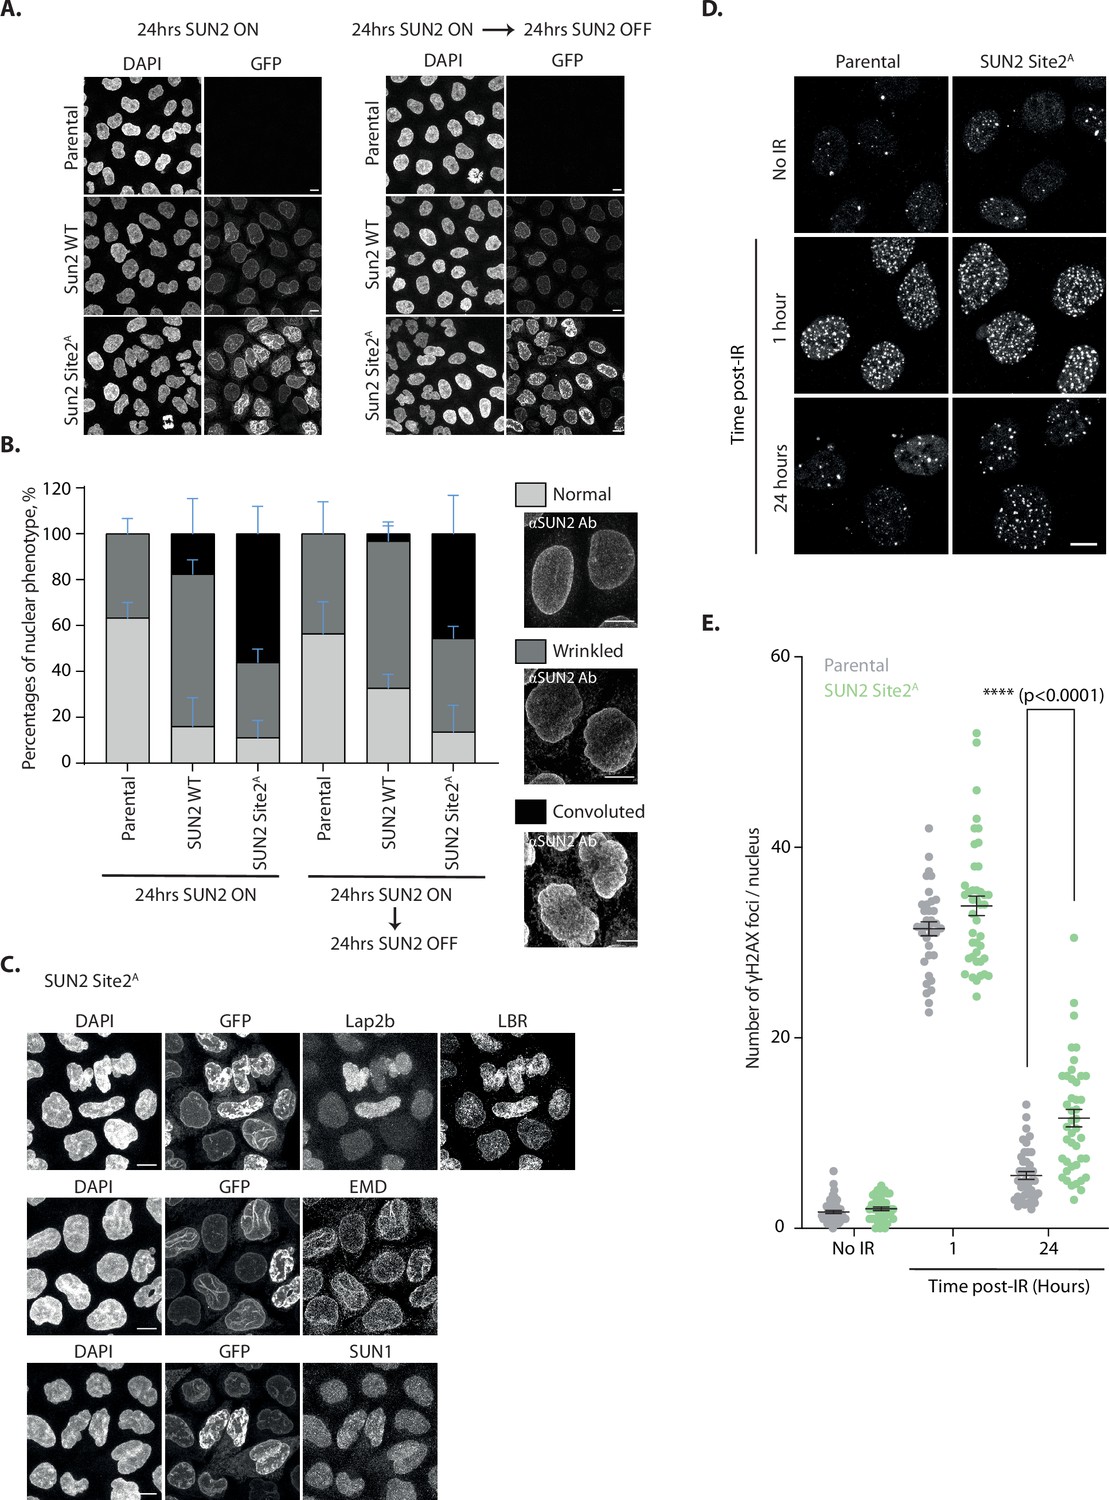
Accumulation of non-degradable SUN2 results in aberrant nuclear architecture and function.
(A) Micrographs of parental HeLa or cells expressing SUN2 WT or Site 2A. Cells were analyzed 24 hr after inducing SUN2 expression (left) or 24 hr after turning off SUN2 expression (right). SUN2 was detected with green fluorescent protein (GFP) and DNA was labelled with DAPI. (B) Quantification of nuclear morphology in HeLa cells as in (A). Three independent experiments, with 50–150 cells for each condition in each repeat were quantified. Representative examples of nuclear morphologies are shown on the right. Error bars indicate standard deviation. (C) Immunofluorescence in HeLa cells upon induction of SUN2 Site 2A expression for 24 hr. SUN2 Site 2A was detected with GFP. Anti-LAP2β, -LBR, -EMD, and -SUN1 antibodies were used to detect these inner nuclear membrane (INM) proteins. DNA was labelled with DAPI. (D) Immunofluorescence in U2OS parental and SUN2 Site 2A-expressing cells irradiated with 5 Gy ionizing radiation (IR). Time after irradiation is indicated. Non-irradiated cells were used as control (shown on the top). SUN2 Site 2A expression was induced 24 hr prior irradiation. γH2AX foci were detected with an anti-γH2AX antibody. Scale bar: 10 µm. (E) Quantification of γH2AX foci per nucleus detected in (D).Three independent experiments were analyzed and 30–40 nuclei were quantified for each condition in each replicate. Error bar represents standard error of the means (SEM). Ordinary one-way analysis of variance (ANOVA) and Tukey’s multiple comparisons were performed (****p < 0.0001).
Figure 6—figure supplement 1

Analysis of the accumulation of non-degradable SUN2 in mitotic progression.
(A) Flow cytometry analysis of transgenic SUN2 steady-state levels in HEK TF-expressing SUN2 WT (left) or Site 2A (right) either without (0 hr) or upon shut-off of the transgenes with washing out Dox for 24, 48, or 72 hr after an initial 24 hr DOX induction. Negative control indicates cells that were not treated with Dox. (B) Timelapse microscopy analysis of HeLa cells expressing SUN2 WT or Site 2A, filmed progressing through mitosis. SiR-Hoechst (DNA) is shown in white and transgenic SUN2 in green. All timings are from the final metaphase timepoint. Brightness and contrast is equal in all panels, apart from the bottom SUN2 WT (brightened) panel where the SUN2 WT signal has been increased for better visualization of its localization. (C) Quantification of timing between various events during mitosis in HeLa cells expressing SUN2 WT (pink) or Site 2A (light green) from timelapse microscopy experiment in (B). The last panel indicates quantification of percentage of multipolar cells observed in (B). At least 45 cells were quantified per experiment and three independent experiments were performed. Unpaired t-test statistical analysis was performed. (D) Quantification of percentage of HeLa cells expressing SUN2 WT (pink) or Site 2A (light green) that displayed delayed chromosome release from nuclear membrane (top left) and cells with lagging chromosomes (top right). In the bottom panel, quantification of timing between NEBD and loss of SUN2 from the membrane in HeLa cells expressing SUN2 WT (Pink) or Site 2A (Light green) from timelapse microscopy experiment in (B). At least 45 cells were quantified per experiment and three independent experiments were performed. Unpaired t-test statistical analysis was performed (*p < 0.05, ***p < 0.001).
Figure 7
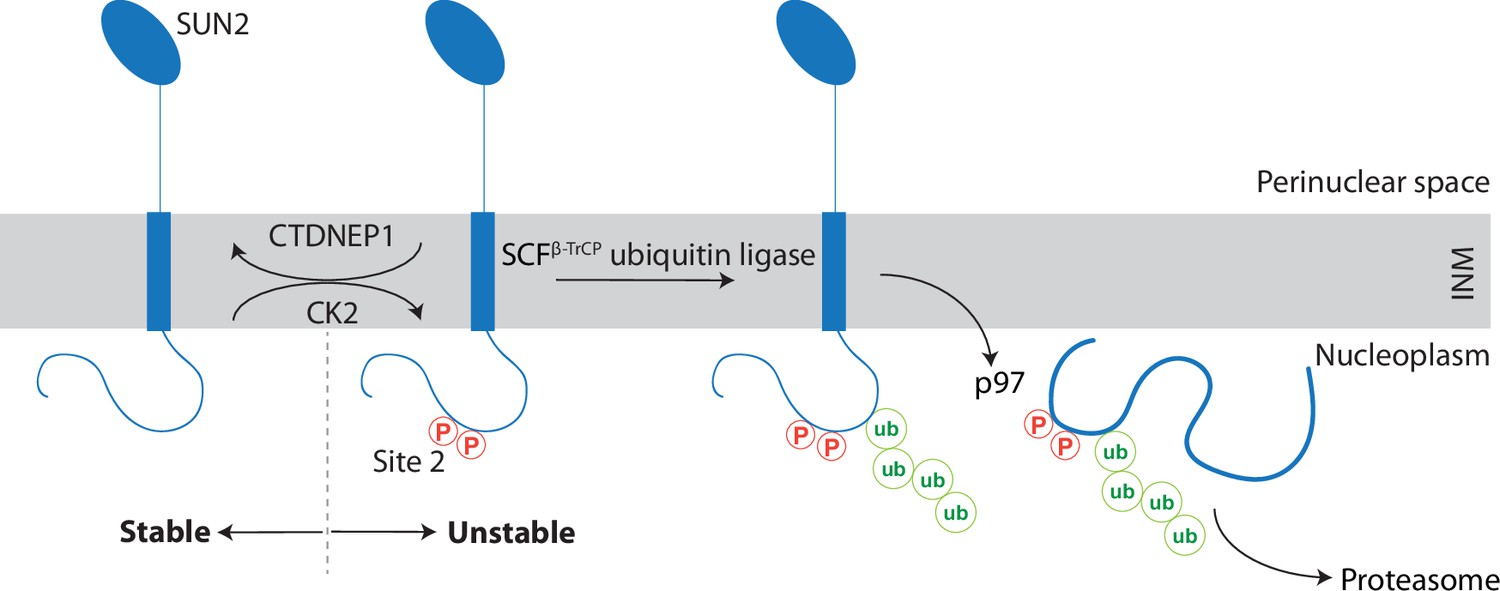
A kinase-phosphatase balance regulates ER-associated degradation of SUN2 from the inner nuclear membrane (INM).
The scheme illustrates the opposing effects of the kinase CK2 and the phosphatase CTDNEP1 on SUN2 degradation. Phosphorylation of SUN2 Site 2 promotes the binding of SCFβTrCP ubiquitin ligase and subsequent SUN2 ubiquitination, membrane extraction by the p97 ATPase complex and delivery to the proteasome for degradation. SUN2 is depicted as a monomer for simplicity however it functions as a homotrimer.
Author response image 1

CRISPR/Cas9-mediated depletion of Nesprin1 (SYNE1) and Nesprin2 (SYNE2) in SUN2 WT or SUN2 2D-expressing HEK TF cells.
Additional files
Download links
A two-part list of links to download the article, or parts of the article, in various formats.
Downloads (link to download the article as PDF)
Open citations (links to open the citations from this article in various online reference manager services)
Cite this article (links to download the citations from this article in formats compatible with various reference manager tools)
Regulated degradation of the inner nuclear membrane protein SUN2 maintains nuclear envelope architecture and function
eLife 11:e81573.
https://doi.org/10.7554/eLife.81573


