PTPN22 R620W gene editing in T cells enhances low-avidity TCR responses
- Center for Immunity and Immunotherapies, Seattle Children's Research Institute, United States
- Benaroya Research Institute at Virginia Mason, United States
- Department of Pediatrics and Immunology, University of Washington, United States
Figures
Figure 1 with 1 supplement
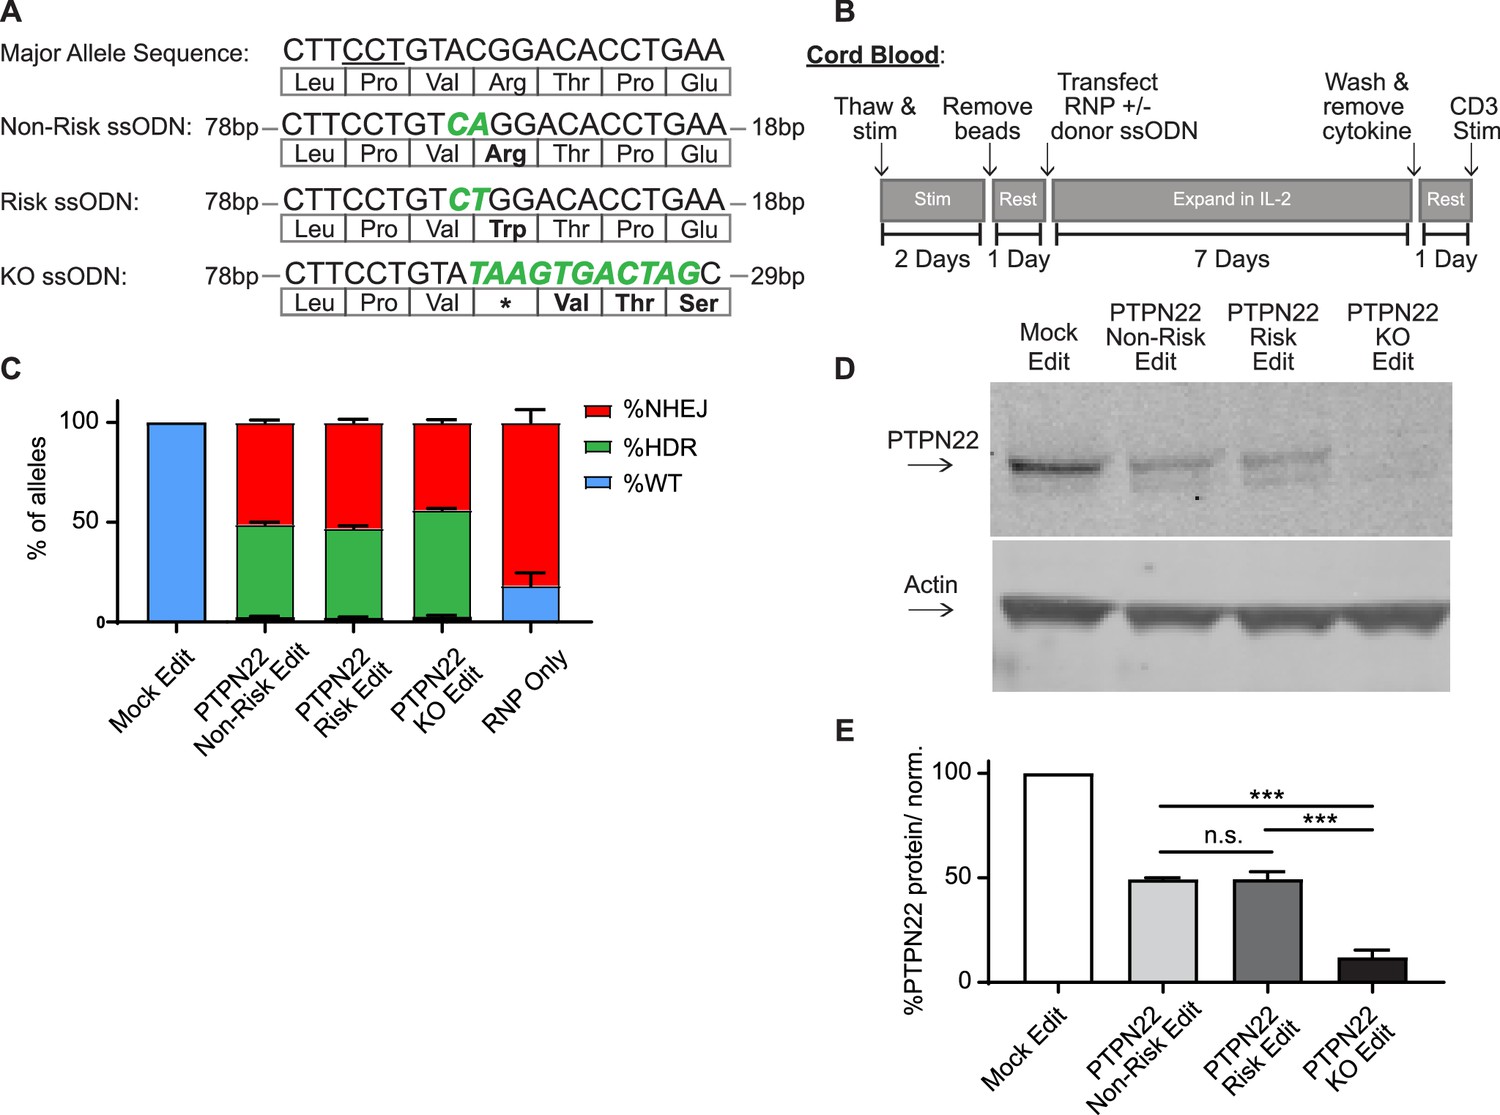
Gene editing protein tyrosine phosphatase non-receptor 22 (PTPN22) single nucleotide polymorphism (SNP) variants in cord blood CD4 T cells produces comparable populations.
CD4 T cells were isolated from human umbilical cord blood for Crispr/Cas9 gene editing. (A) ssODN repair templates electroporated with PTPN22 targeting Crispr/Cas9 RNP resulting in differently coded alleles upon HDR. Underlined nucleotides in major allele sequence indicate RNP protospacer adjacent motif (PAM) site. PTPN22 coding alterations for each population denoted with bolded/colored nucleotides, resulting changes to amino acid sequence displayed below. (B) Workflow used to produce and assay PTPN22 edited CD4 T cells and corresponding controls. (C) ddPCR analysis of editing outcomes in PTPN22 edited cells using corresponding ssODN repair templates or RNP alone. n=4 independent human donors. (D) Representative western blot of PTPN22 expression in mock edited, PTPN22 non-risk edited, PTPN22 risk edited, and PTPN22 knockout edited cord blood CD4 T cells from the same human donor. (E) Quantified PTPN22 protein expression relative to actin and normalized to unedited values from the same T cell donor. n=3 independent human donors, matched one-way ANOVA with Tukey’s correction. For summary graphs, lines and error bars represent mean ± SEM. RNP – ribonucleoprotein, ODN or ssODN – single stranded oligo deoxynucleotide, NHEJ – non-homologous end joining, HDR – homology directed repair. All data is from at least two independent experiments. ***p<0.001.
-
Figure 1—source data 1
Whole western blots.
- https://cdn.elifesciences.org/articles/81577/elife-81577-fig1-data1-v2.zip
-
Figure 1—source data 2
Protein tyrosine phosphatase non-receptor 22 (PTPN22) gene editing assessment.
- https://cdn.elifesciences.org/articles/81577/elife-81577-fig1-data2-v2.zip
Figure 1—figure supplement 1
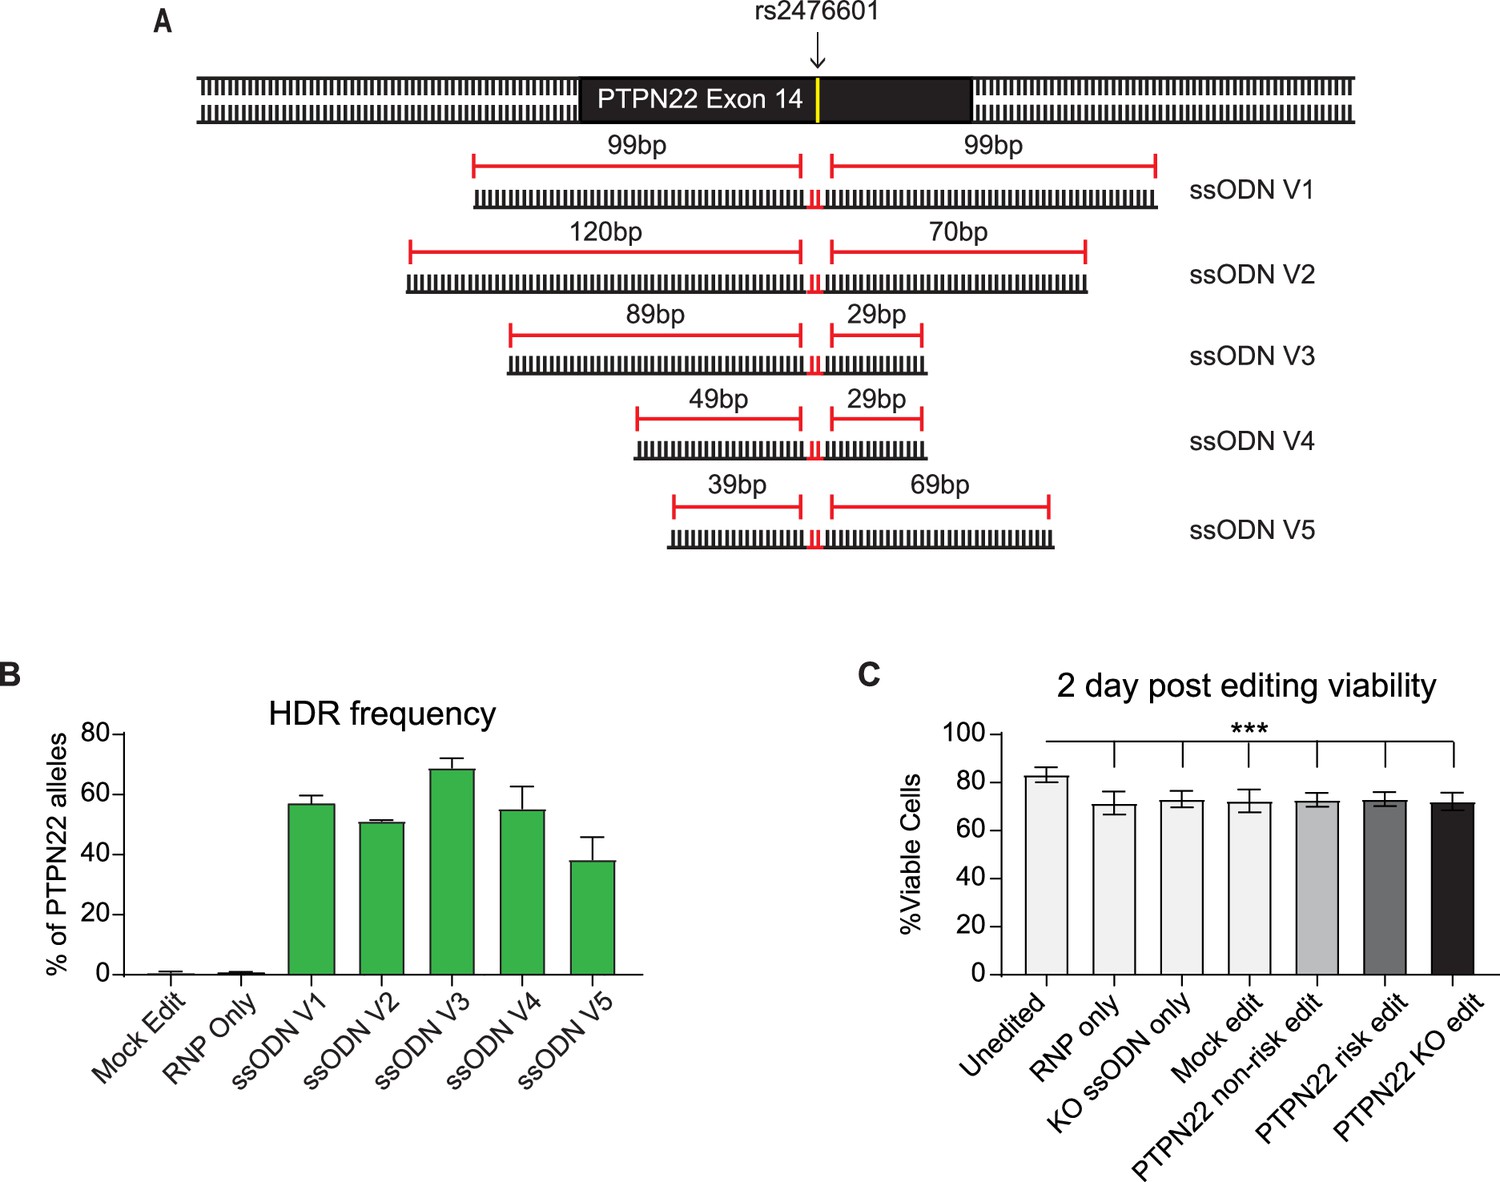
Gene editing efficiency of protein tyrosine phosphatase non-receptor 22 (PTPN22) single nucleotide polymorphism (SNP) variants is impacted by donor DNA template design.
(A) ssODN repair template designs tested to introduce PTPN22 risk SNP at rs2476601 site in non-risk T cells. Cells were electroporated with a PTPN22 targeting Crispr/Cas9 RNP (Figure 1A), and one of five ssODN variants, all introducing a 2 bp edit resulting in producing the R620W variant and blocking further binding of the Crispr/Cas9 RNP. All ssODN variants are complementary to the non-target strand of the RNP. (B) Average HDR rates resulting in the PTPN22 risk variant achieved with ssODN variants. CD4 T cells were edited as in Figure 1B and processed for gDNA 2 days post editing. Rates of HDR were determined by ddPCR analysis (n=2–4 independent donors, and 1–2 independent experiments). For ssODN design optimization CD4 T cells were derived from human adult PBMCs. (C) After editing with optimized ssODN templates, cord blood CD4 T cells were expanded in IL-2 for 7 days. At 2 days post editing, cells were stained with viability dye and assessed via flow cytometry. Percent viable reflects the percent of events collected from each culture that were identified as single, live, lymphocytes. n=4, independent human donors. For summary graphs lines and error bars represent mean ± SEM. Analyzed by matched one-way ANOVA with Tukey’s correction. RNP – ribonucleoprotein, ssODN – single stranded oligo deoxynucleotide, NHEJ – non-homologous end joining, HDR – homology directed repair. ***p<0.001.
-
Figure 1—figure supplement 1—source data 1
Protein tyrosine phosphatase non-receptor 22 (PTPN22) gene editing optimization.
- https://cdn.elifesciences.org/articles/81577/elife-81577-fig1-figsupp1-data1-v2.zip
Figure 2 with 1 supplement
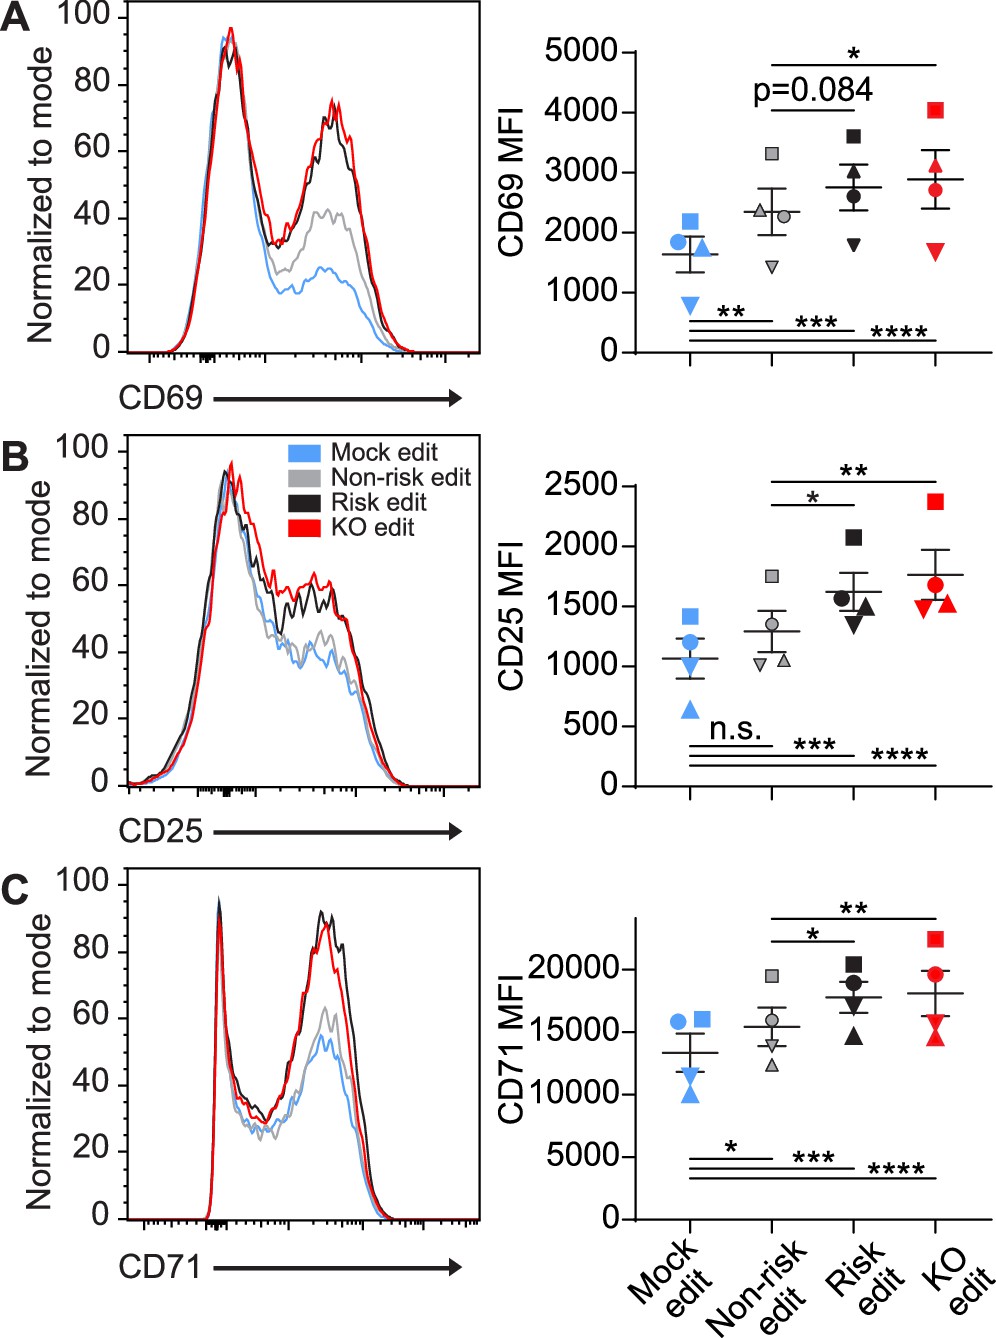
Protein tyrosine phosphatase non-receptor 22 (PTPN22) risk edited T cells mimic PTPN22 knockout (KO) in response to TCR stimulation.
Cord blood CD4 T cells from human donors were gene edited as described in Figure 1, then stimulated with plate bound anti-CD3 for up to 48 hr. (A–C) Representative flow overlays for CD69 (A), CD25 (B), and CD71 (C) with summary data for different editing conditions from the same donor. CD69 summary data reflects mean fluorescent intensity at 6 hr post CD3 stimulation, while CD25 and CD71 represent median values at 48 hr post stimulation. For all summary data n=4 independent donors (shapes correspond to individual donors), matched one-way ANOVA with Tukey’s correction. Lines and error bars represent mean ± SEM. All data is from two independent experiments. *p<0.05, **p<0.01, ***p<0.001, ****p<0.0001.
-
Figure 2—source data 1
CD3 stim, protein tyrosine phosphatase non-receptor 22 (PTPN22), edited cells.
- https://cdn.elifesciences.org/articles/81577/elife-81577-fig2-data1-v2.zip
Figure 2—figure supplement 1
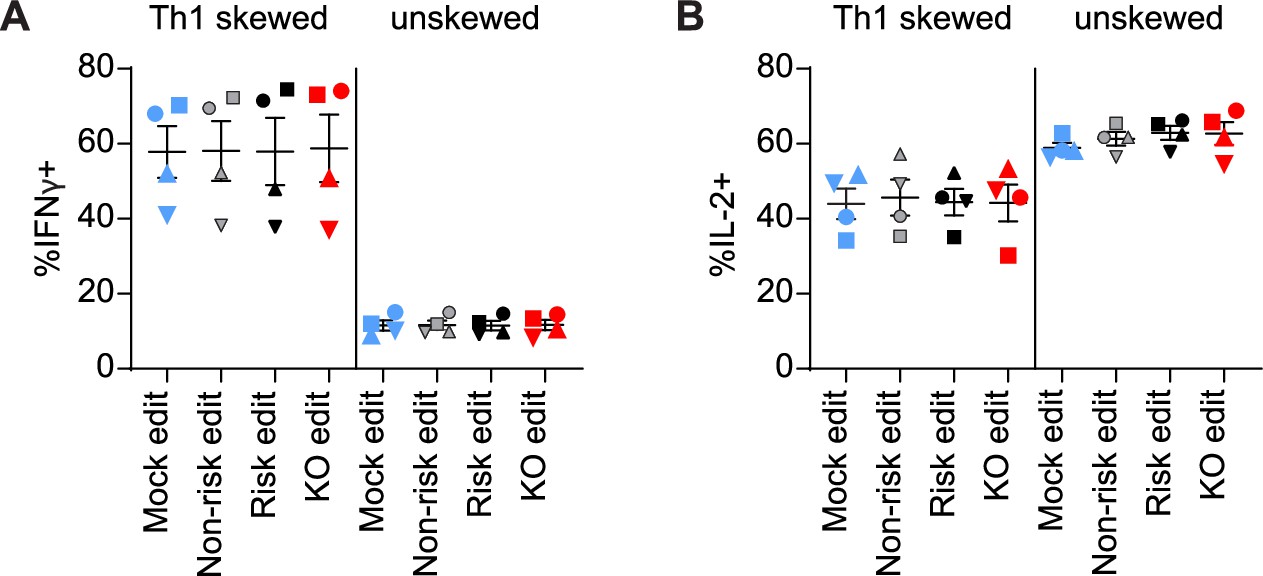
Protein tyrosine phosphatase non-receptor 22 (PTPN22) editing in T cells does not impact IL-12 induced Th1 skewing.
Cord blood CD4 T cells from human donors were edited as described in Figure 1, then stimulated with plate bound anti-CD3 for 3 days in either Th1 skewing media (IL-12, anti-IL-4, IL-2, and soluble anti-CD28) or non-skewing media (IL-2 and soluble anti-CD28). Cells were then stimulated with PMA and ionomycin with monensin for 5 hr, then fixed and stained for flow cytometry assessment of cytokine production of (A) IFNγ and (B) IL-2. n=4 independent donors (shapes correspond to individual donors), lines and error bars represent mean ± SEM. All data is from two independent experiments.
-
Figure 2—figure supplement 1—source data 1
Protein tyrosine phosphatase non-receptor 22 (PTPN22) gene editing does not impact cytokine skewing.
- https://cdn.elifesciences.org/articles/81577/elife-81577-fig2-figsupp1-data1-v2.zip
Figure 3 with 2 supplements
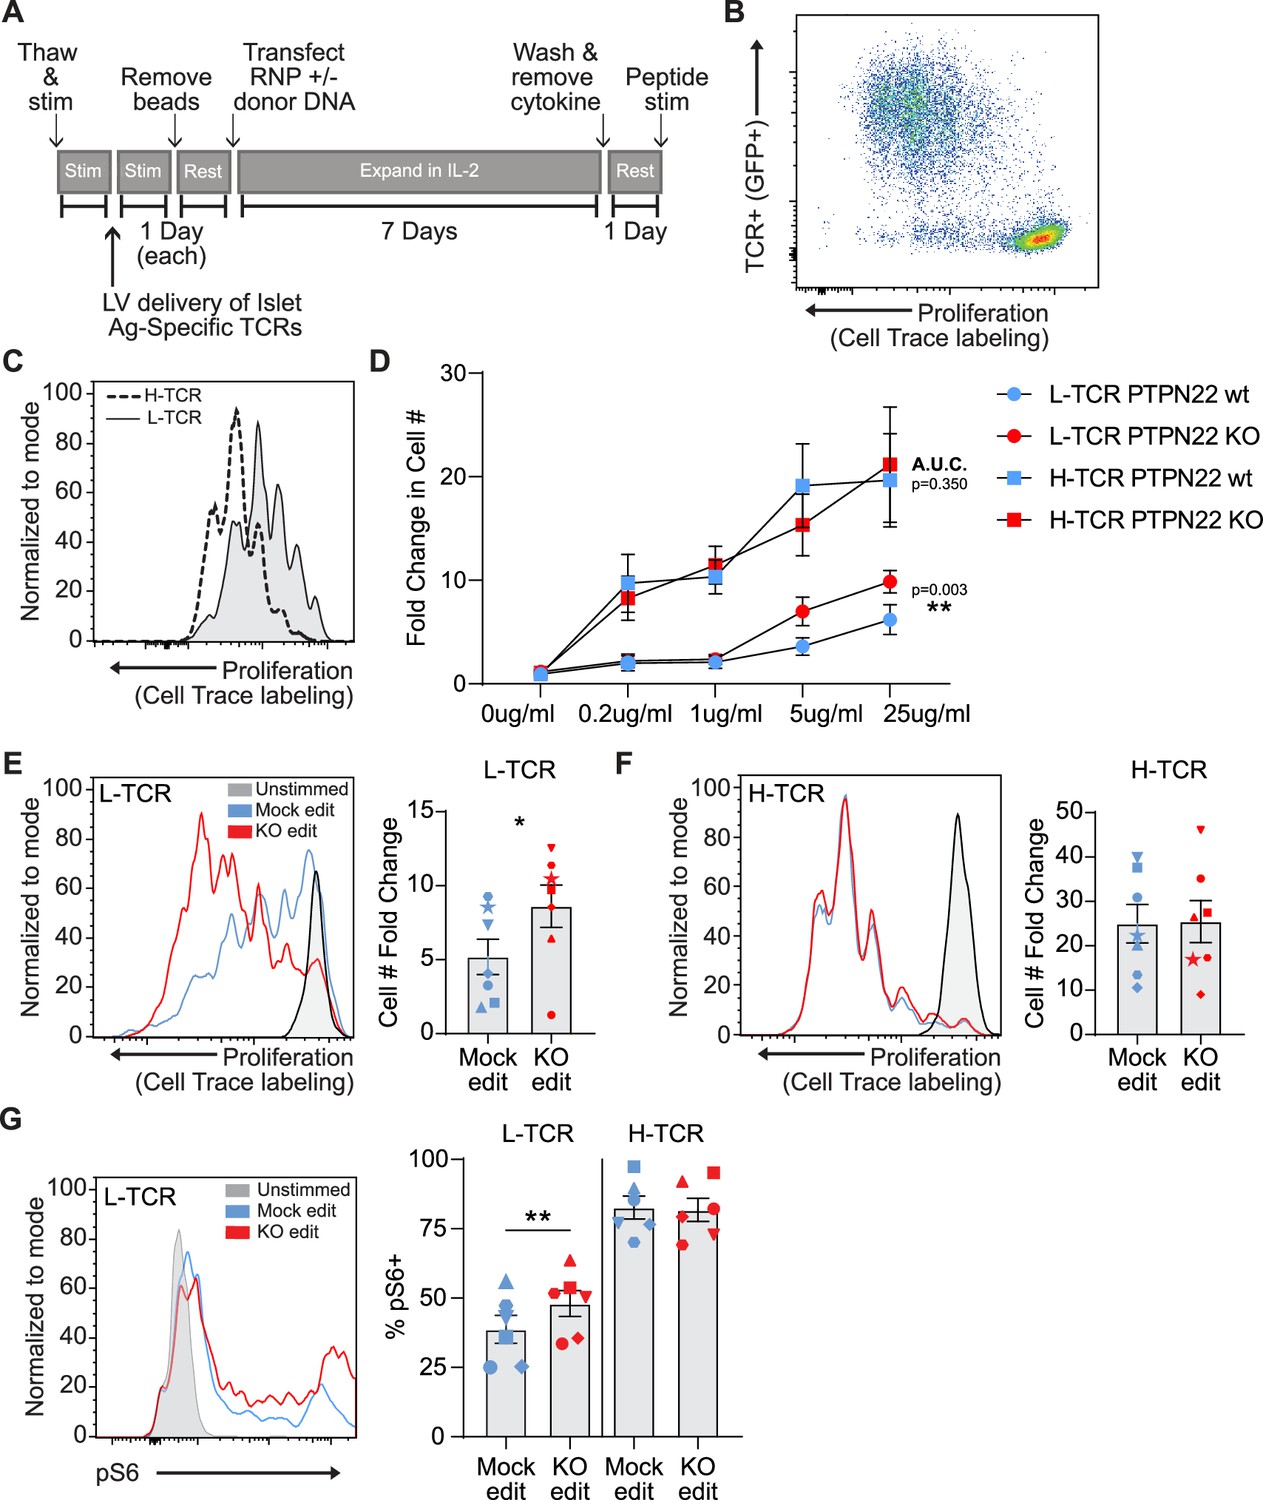
Low-avidity T cells lacking protein tyrosine phosphatase non-receptor 22 (PTPN22) exhibit increased proliferation upon peptide stimulation.
Cord blood CD4 T cells from human donors were transduced with lentivirus coding for antigen specific TCRs prior to gene editing as described in Figure 1, then stimulated with cognate peptide. (A) Workflow shown in Figure 1, modified to allow both gene editing of the PTPN22 locus and lentiviral delivery of antigen specific TCRs. (B) Representative flow plot of H-TCR+ T cell proliferation after 3 days of peptide stimulation. (C) Representative flow overlay of 3-day peptide induced proliferation caused by either H-TCR stimulation or L-TCR stimulation in T cells from the same donor. (D) Summary data of 3-day T cell proliferation (fold change over input cell number) at various peptide doses in cells expressing transgenic TCRs with and without PTPN22 knockout (KO) editing. Proliferation induced by TCRs was compared by computing area under the curve (AUC) for each TCR/editing combination for all peptide doses tested, then performing a paired t test on the computed areas. (E) Representative flow overlay of proliferation in L-TCR+/ PTPN22 gene edited cells from the same donor and summary data of T cell proliferation (fold change over input cell number), n=7 independent donors (shapes correspond to individual donors). (F) Representative flow overlay of proliferation in H-TCR+/ PTPN22 gene edited cells from the same donor and summary data of T cell proliferation (fold change over input cell number), n=7 independent donors (shapes correspond to individual donors). (G) Representative flow overlay of different editing conditions from the same donor expressing L-TCR and summary data of flow values for phosphorylated S6 kinase in edited cells expressing transgenic TCRs, n=6 independent donors (shapes correspond to individual donors), paired t test by TCR expressed. Columns and error bars represent mean ± SEM. All data is from three or four independent experiments. *p<0.05, **p<0.01, ***p<0.001.
-
Figure 3—source data 1
Peptide stim model of protein tyrosine phosphatase non-receptor 22 (PTPN22) edited cells.
- https://cdn.elifesciences.org/articles/81577/elife-81577-fig3-data1-v2.zip
Figure 3—figure supplement 1
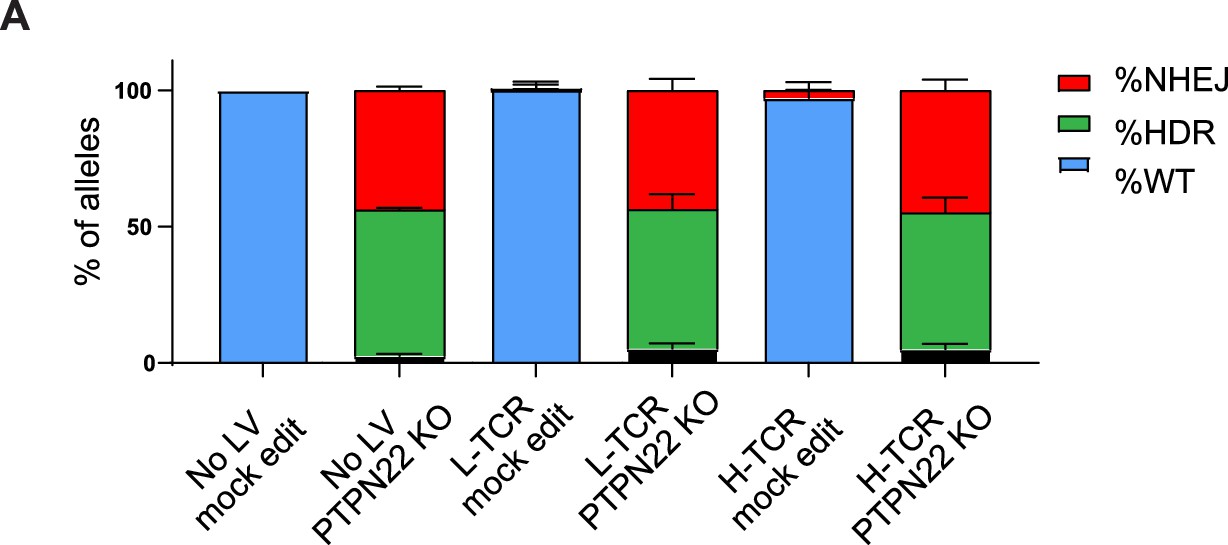
Protein tyrosine phosphatase non-receptor 22 (PTPN22) gene editing in cord blood CD4 T cells is not impacted by lentiviral transduction.
(A) Droplet digital PCR (ddPCR) analysis of PTPN22 editing in human cord blood CD4 T cells using a knockout (KO) single stranded oligo deoxynucleotides (ssODN) repair template (Figure 1A) after lentiviral (LV) delivery of antigen specific TCRs (Figure 3A). n=4–6 independent donors, columns and error bars represent mean ± SEM. Figure reflects data compiled across five independent experiments, with each column representing data from two to three independent experiments.
-
Figure 3—figure supplement 1—source data 1
Gene editing does not impact lenti transduction.
- https://cdn.elifesciences.org/articles/81577/elife-81577-fig3-figsupp1-data1-v2.zip
Figure 3—figure supplement 2
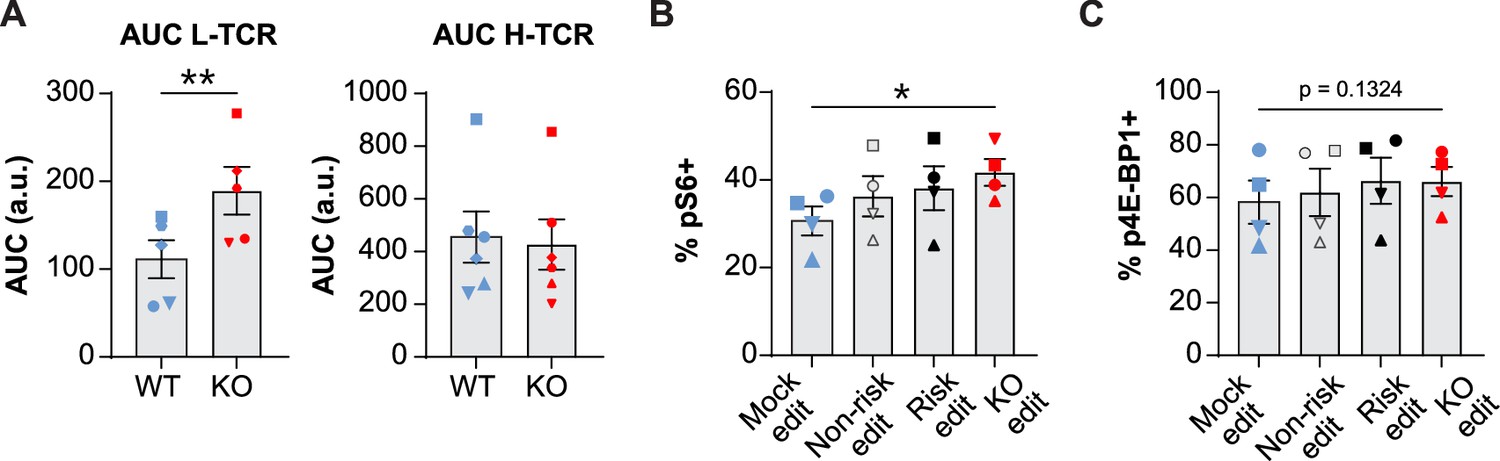
Protein tyrosine phosphatase non-receptor 22 (PTPN22) knockout (KO) cord blood CD4 T cells show increased proliferation and phosphorylation of activation responsive signaling markers.
(A) Summary data of area under the curves generated by peptide doses in Figure 3D. (B–C) Cord blood CD4 T cells from human donors were transduced with lentivirus coding for L-TCR prior to gene editing as described in Figures 1 and 3, then stimulated with cognate peptide loaded APCs for 24 hr. Data represents flow values for phosphorylated S6 kinase (B) and phosphorylated 4E-BP1 (C) in edited cells expressing the L-TCR, n=4 independent donors. (A) Analyzed by paired t test and (B–C) analyzed by paired one-way ANOVA with Tukey’s multiple comparison test. Columns and error bars represent mean ± SEM, and shapes correspond to individual human donors. All data is from two to three independent experiments. *p<0.05, **p<0.01.
-
Figure 3—figure supplement 2—source data 1
Impact of altered protein tyrosine phosphatase non-receptor 22 (PTPN22) on early phosphorylation signals.
- https://cdn.elifesciences.org/articles/81577/elife-81577-fig3-figsupp2-data1-v2.zip
Figure 4
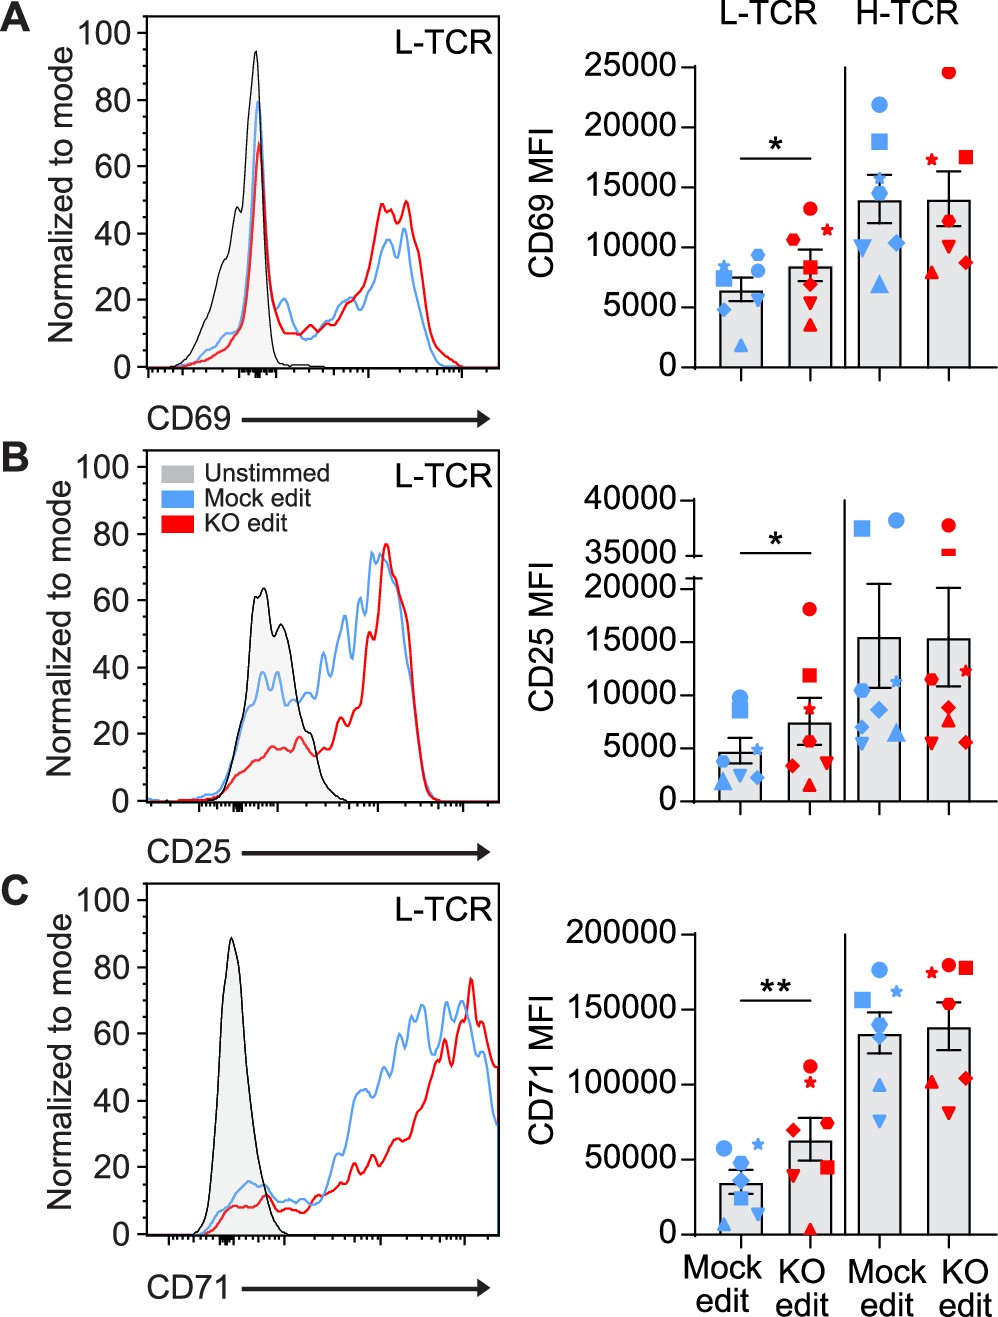
L-TCR stimulation of protein tyrosine phosphatase non-receptor 22 (PTPN22) knockout (KO) edited T cells produces enhanced surface activation marker expression.
Cord blood CD4 T cells from human donors were edited as described in Figure 3, then stimulated with peptide loaded APCs for up to 48 hr. (A–C) Representative flow overlays and summary data for CD69 (A), CD25 (B), and CD71 (C) expression in mock edited and PTPN22 KO populations from the same donor expressing the L-TCR. CD69 summary data reflects mean fluorescent intensity at 24 hr post peptide stimulation, while CD25 and CD71 represent median values at 48 hr post stimulation. For all summary data n=7 independent donors (shapes correspond to individual donors), paired t test by TCR expressed. Columns and error bars represent mean ± SEM. All data is from four independent experiments. *p<0.05, **p<0.01.
-
Figure 4—source data 1
Peptide stim activation response, protein tyrosine phosphatase non-receptor 22 (PTPN22) edited cells.
- https://cdn.elifesciences.org/articles/81577/elife-81577-fig4-data1-v2.zip
Figure 5 with 1 supplement
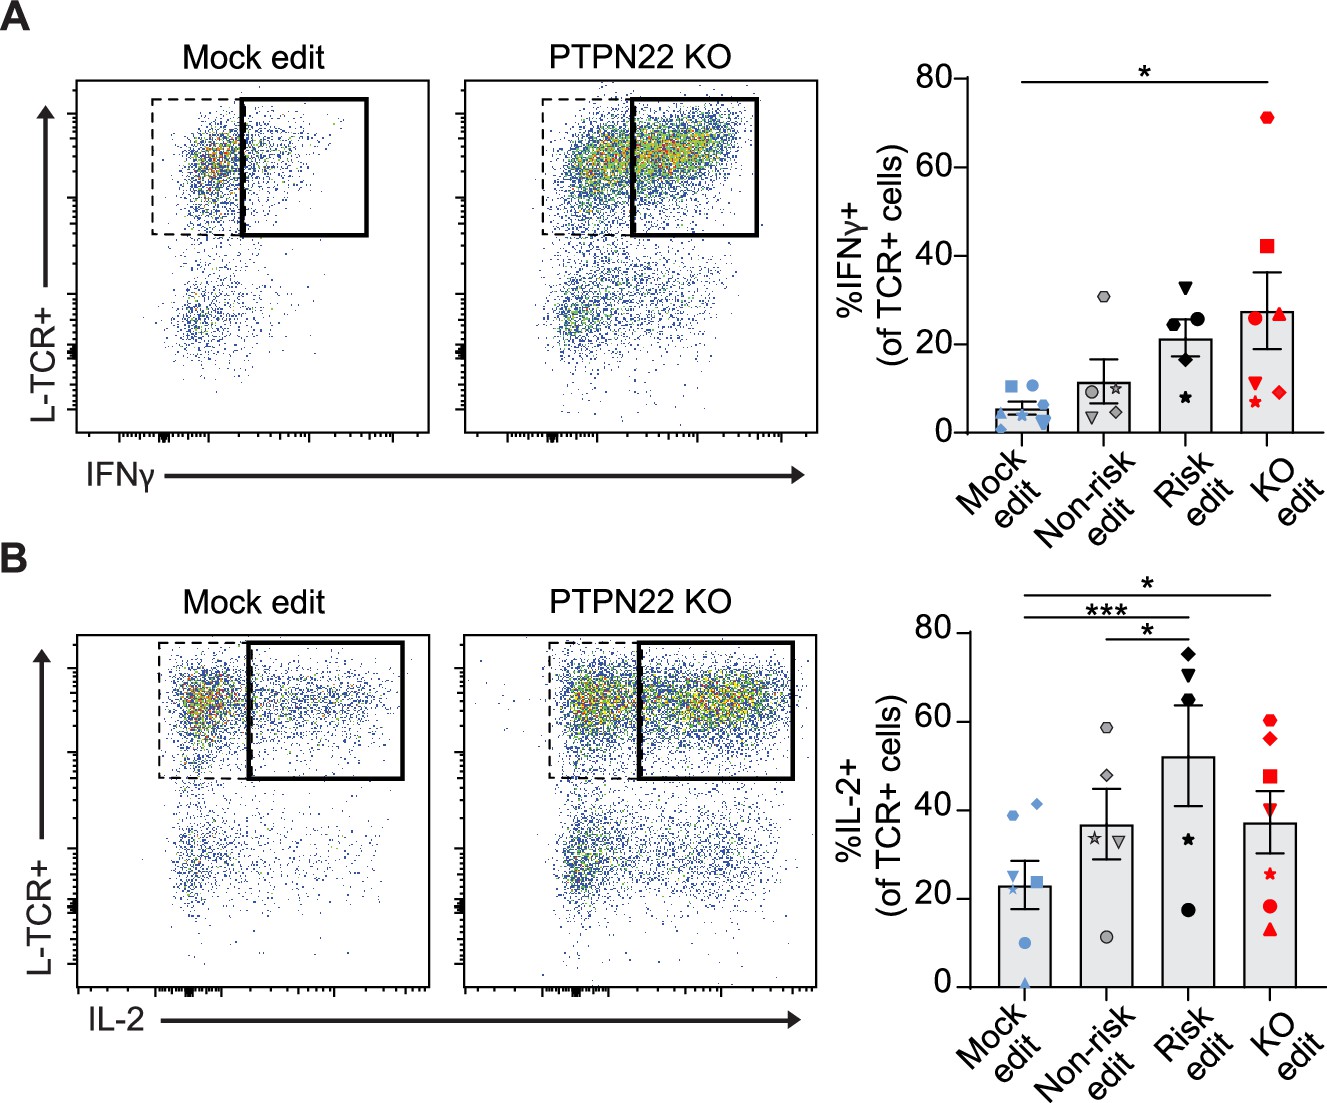
Protein tyrosine phosphatase non-receptor 22 (PTPN22) knockout (KO) and risk edited T cells are more likely to secrete pro-inflammatory cytokine in response to low-avidity TCR engagement.
Cord blood CD4 T cells from human donors were edited as described in Figure 3, then stimulated with peptide loaded APCs for 3 days. (A–B) Representative flow plots of IFNy (A) and IL-2 (B) expression in mock edited or PTPN22 KO cells transduced with L-TCR and summary data of %L-TCR+ cells that secrete IFNy (A) or IL-2 (B) grouped by gene edit. N=5–7 independent donors (shapes correspond to individual donors). All summary data analyzed by paired t test. Columns and error bars represent mean ± SEM. All data is from four independent experiments. *p<0.05, ***p<0.001.
-
Figure 5—source data 1
Peptide stim cytokine production, protein tyrosine phosphatase non-receptor 22 (PTPN22) edited Cells.
- https://cdn.elifesciences.org/articles/81577/elife-81577-fig5-data1-v2.zip
Figure 5—figure supplement 1
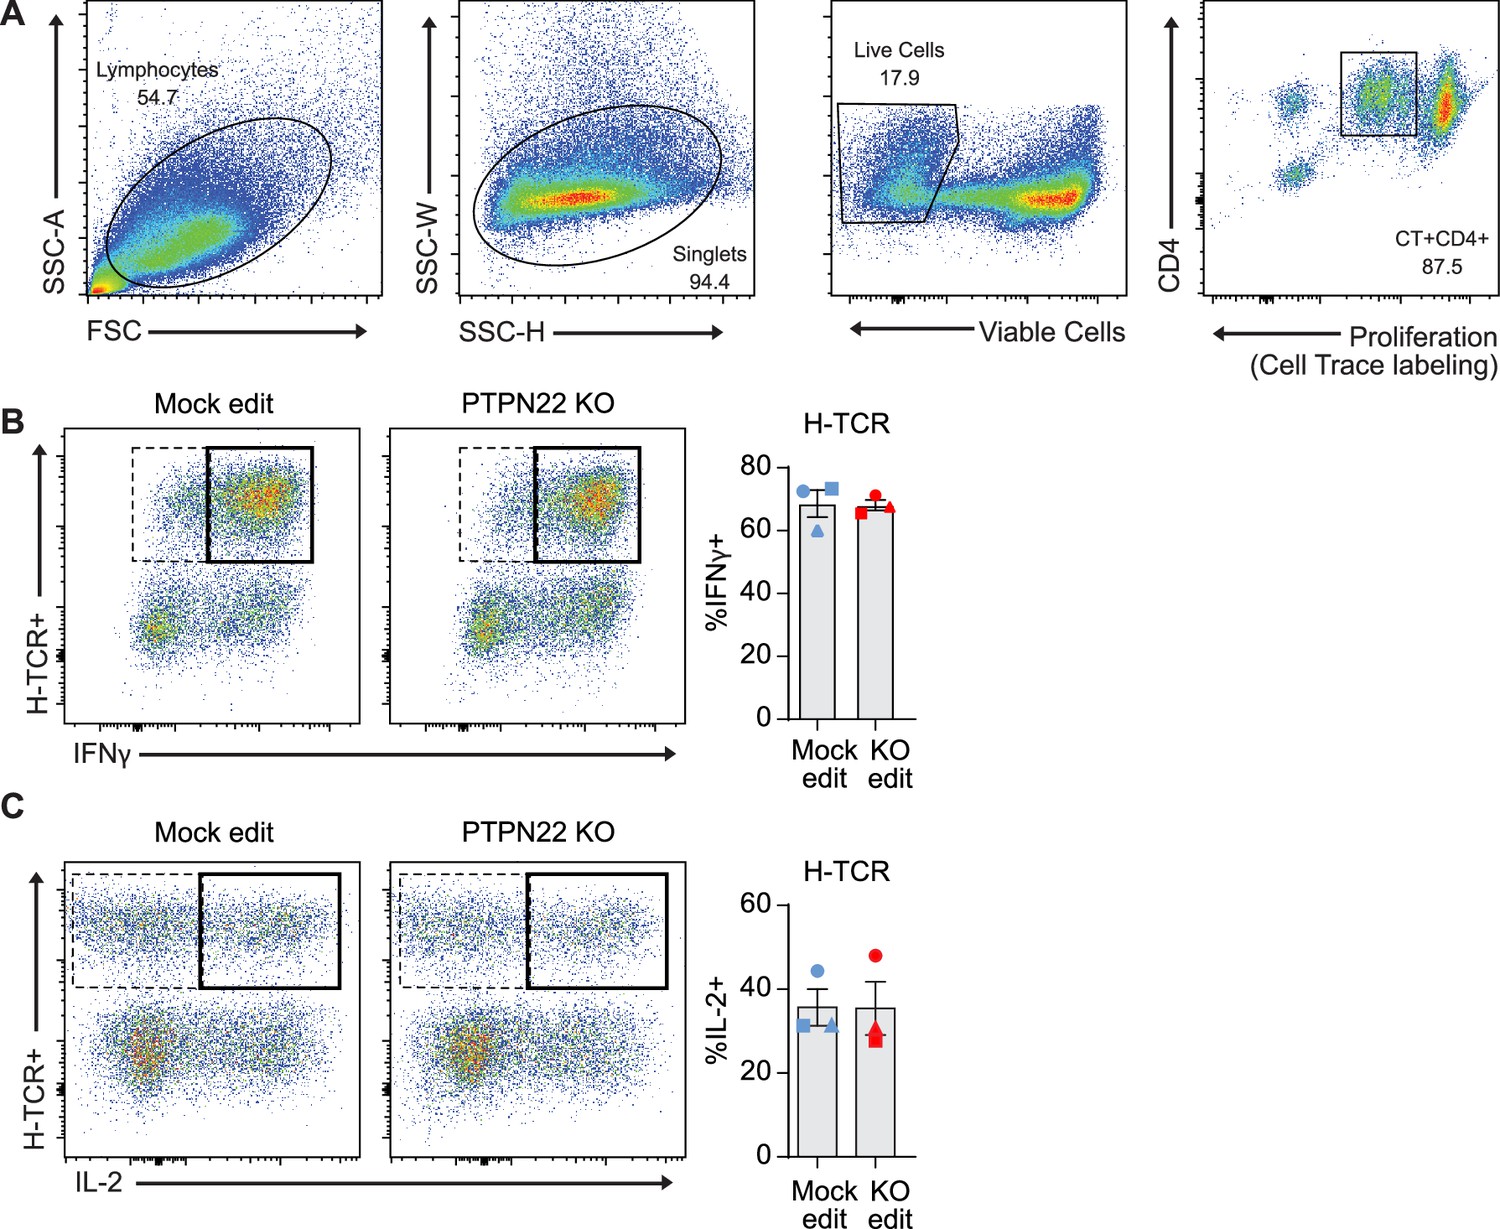
Protein tyrosine phosphatase non-receptor 22 (PTPN22) gene edited, H-TCR+ cord blood CD4 T cells show no differences in inflammatory cytokine production.
Cord blood CD4 T cells from human donors were edited as described in Figure 3, then stimulated with peptide loaded APCs for 3 days. (A) Flow cytometry gating strategy used to identify antigen specific TCR+ cells for cytokine production analysis. (B–C) Representative flow plots of IFNy (B) and IL-2 (C) expression using the flow gating strategy demonstrated in (A) with PTPN22 gene edited cells transduced with the IGRP reactive H-TCR, followed by summary data of %IFNy (B) or %IL-2 (C) secreting cells (n=3 independent human donors, from two independent experiments). Summary data analyzed by paired t test. Columns and error bars represent mean ± SEM, and shapes correspond to individual human donors.
-
Figure 5—figure supplement 1—source data 1
Protein tyrosine phosphatase non-receptor 22 (PTPN22) knockout (KO) does not impact cytokine production in strong TCR stim.
- https://cdn.elifesciences.org/articles/81577/elife-81577-fig5-figsupp1-data1-v2.zip
Figure 6 with 1 supplement
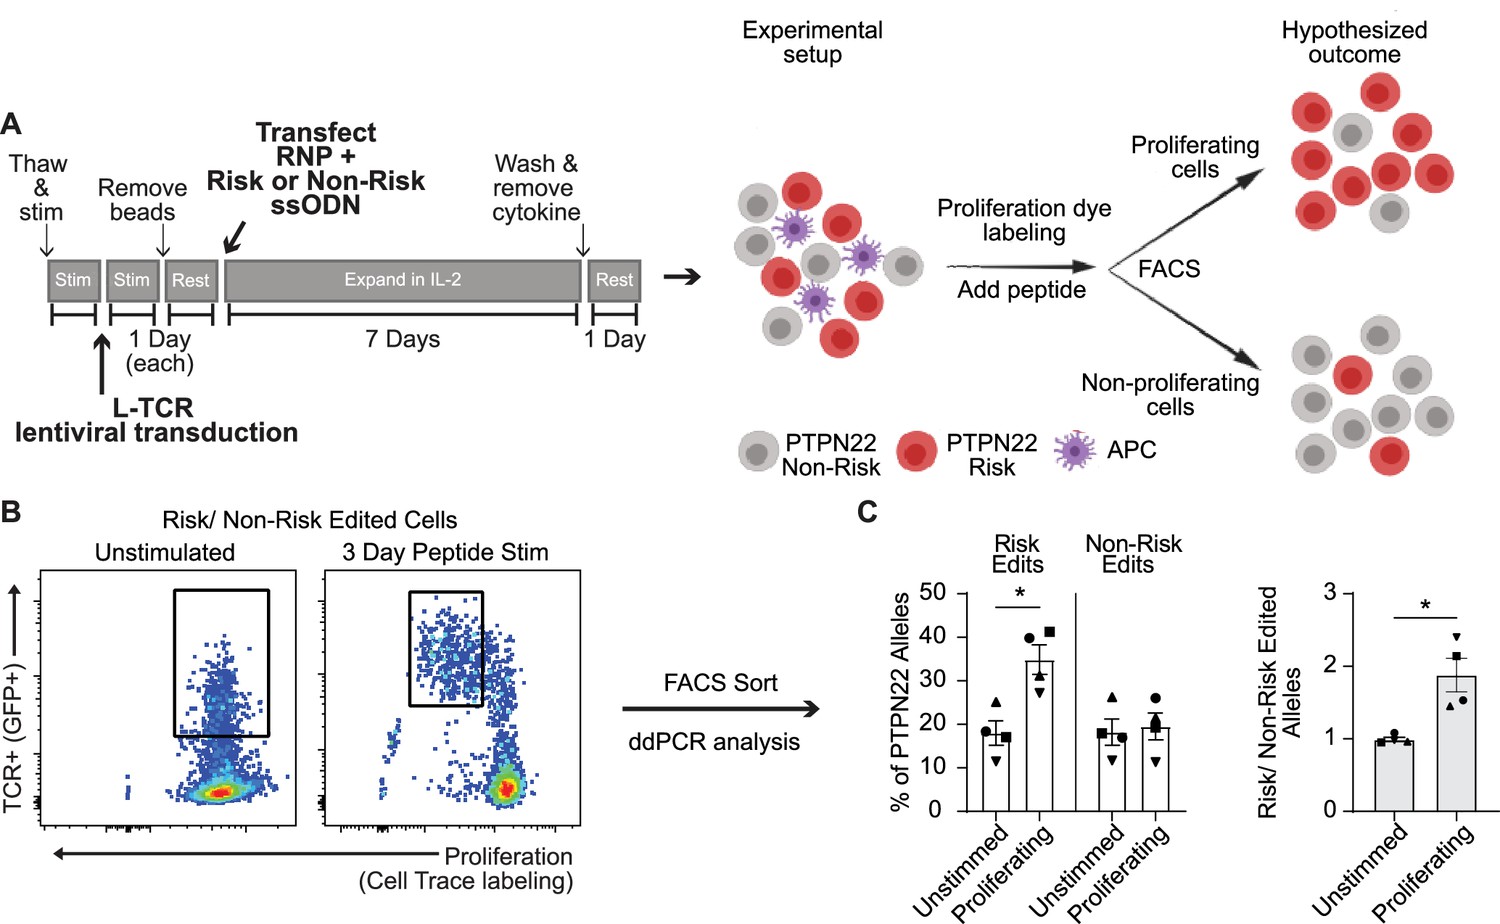
Protein tyrosine phosphatase non-receptor 22 (PTPN22) risk edited T cells show increased proliferation compared to non-risk edited cells under L-TCR stimulation.
Cord blood CD4 T cells from human donors were transduced with L-TCR lentivirus prior to gene editing into two populations (as described in Figure 1): PTPN22 risk edited, or non-risk edited, then stimulated with cognate peptide. (A) Workflow shown in Figure 3, depicting the use of PTPN22 single nucleotide polymorphism (SNP) locus editing DNA repair templates and an experimental model describing how the PTPN22 R620W coding sequence’s impact on proliferation was predicted and would be assessed. (B) A representative FACS plot showing gating of L-TCR+ populations before peptide stimulation and 3 days post peptide stim. (C) Droplet digital PCR (ddPCR) analysis of edited PTPN22 alleles in FACS sorted populations. n=4 independent human donors (shapes correspond to individual donors). All summary data analyzed by paired t test. *p<0.05.
-
Figure 6—source data 1
Competitive proliferation, protein tyrosine phosphatase non-receptor 22 (PTPN22) edited cells.
- https://cdn.elifesciences.org/articles/81577/elife-81577-fig6-data1-v2.zip
Figure 6—figure supplement 1
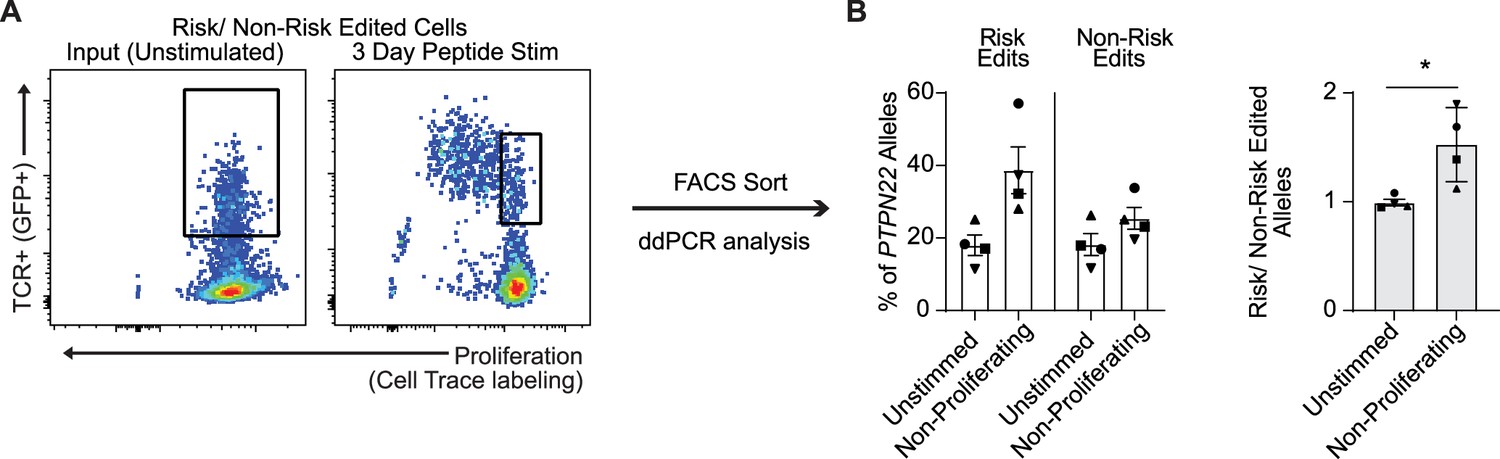
The proportion of protein tyrosine phosphatase non-receptor 22 (PTPN22) risk edited T cells is also increased within the non-proliferating cell population following L-TCR engagement.
Cord blood CD4 T cells from human donors were transduced with L-TCR lentivirus prior to gene editing as described in Figure 1 and Figure 6 and mixed in equal proportions as shown in Figure 6A, then stimulated with cognate peptide. (A) Representative FACS plot showing gating of L-TCR+ populations before peptide stimulation and 3 days post peptide stim to sort non-proliferating events. (B) Droplet digital PCR (ddPCR) analysis of edited PTPN22 alleles in FACS sorted populations. n=4 independent human donors (shapes correspond to individual donors). All summary data analyzed by paired t test. *p<0.05.
-
Figure 6—figure supplement 1—source data 1
Protein tyrosine phosphatase non-receptor 22 (PTPN22) risk variant increases numbers of non-proliferating cells.
- https://cdn.elifesciences.org/articles/81577/elife-81577-fig6-figsupp1-data1-v2.zip
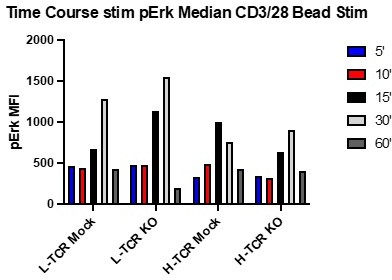
Author response image 1
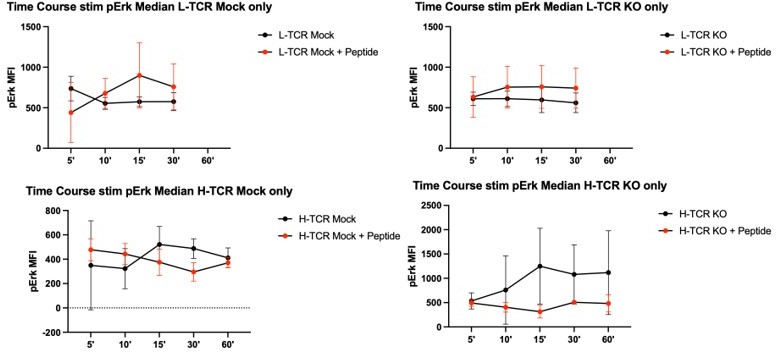
Author response image 2
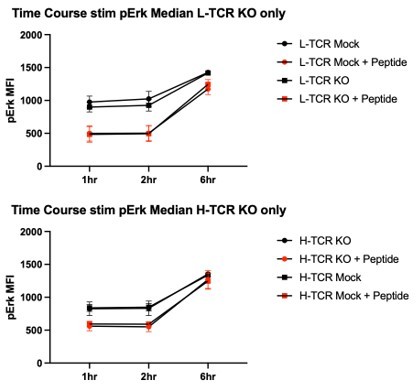
Author response image 3
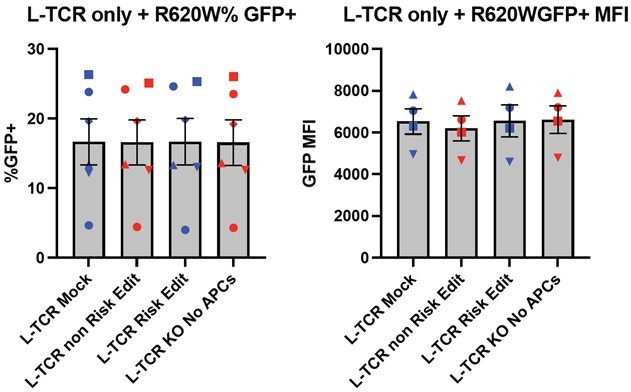
Author response image 4

Author response image 5
Additional files
-
MDAR checklist
- https://cdn.elifesciences.org/articles/81577/elife-81577-mdarchecklist1-v2.docx
-
Source data 1
Zip file of all western blot pictures, raw and annotated.
- https://cdn.elifesciences.org/articles/81577/elife-81577-data1-v2.zip
-
Source data 2
Zip file of all source data for summary data graphs.
- https://cdn.elifesciences.org/articles/81577/elife-81577-data2-v2.zip
-
Source data 3
Short DNA sequences.
- https://cdn.elifesciences.org/articles/81577/elife-81577-data3-v2.xlsx
Download links
A two-part list of links to download the article, or parts of the article, in various formats.
Downloads (link to download the article as PDF)
Open citations (links to open the citations from this article in various online reference manager services)
Cite this article (links to download the citations from this article in formats compatible with various reference manager tools)
PTPN22 R620W gene editing in T cells enhances low-avidity TCR responses
eLife 12:e81577.
https://doi.org/10.7554/eLife.81577


