Didemnin B and ternatin-4 differentially inhibit conformational changes in eEF1A required for aminoacyl-tRNA accommodation into mammalian ribosomes
- Department of Physiology and Biophysics, Weill Cornell Medicine, United States
- Chemistry and Chemical Biology Graduate Program, University of California, San Francisco, United States
- Department of Structural Biology, St. Jude Children's Research Hospital, United States
- Tri-Institutional PhD Program in Chemical Biology, Weill Cornell Medicine, United States
- MRC-LMB, Francis Crick Avenue, United Kingdom
Figures
Figure 1 with 3 supplements
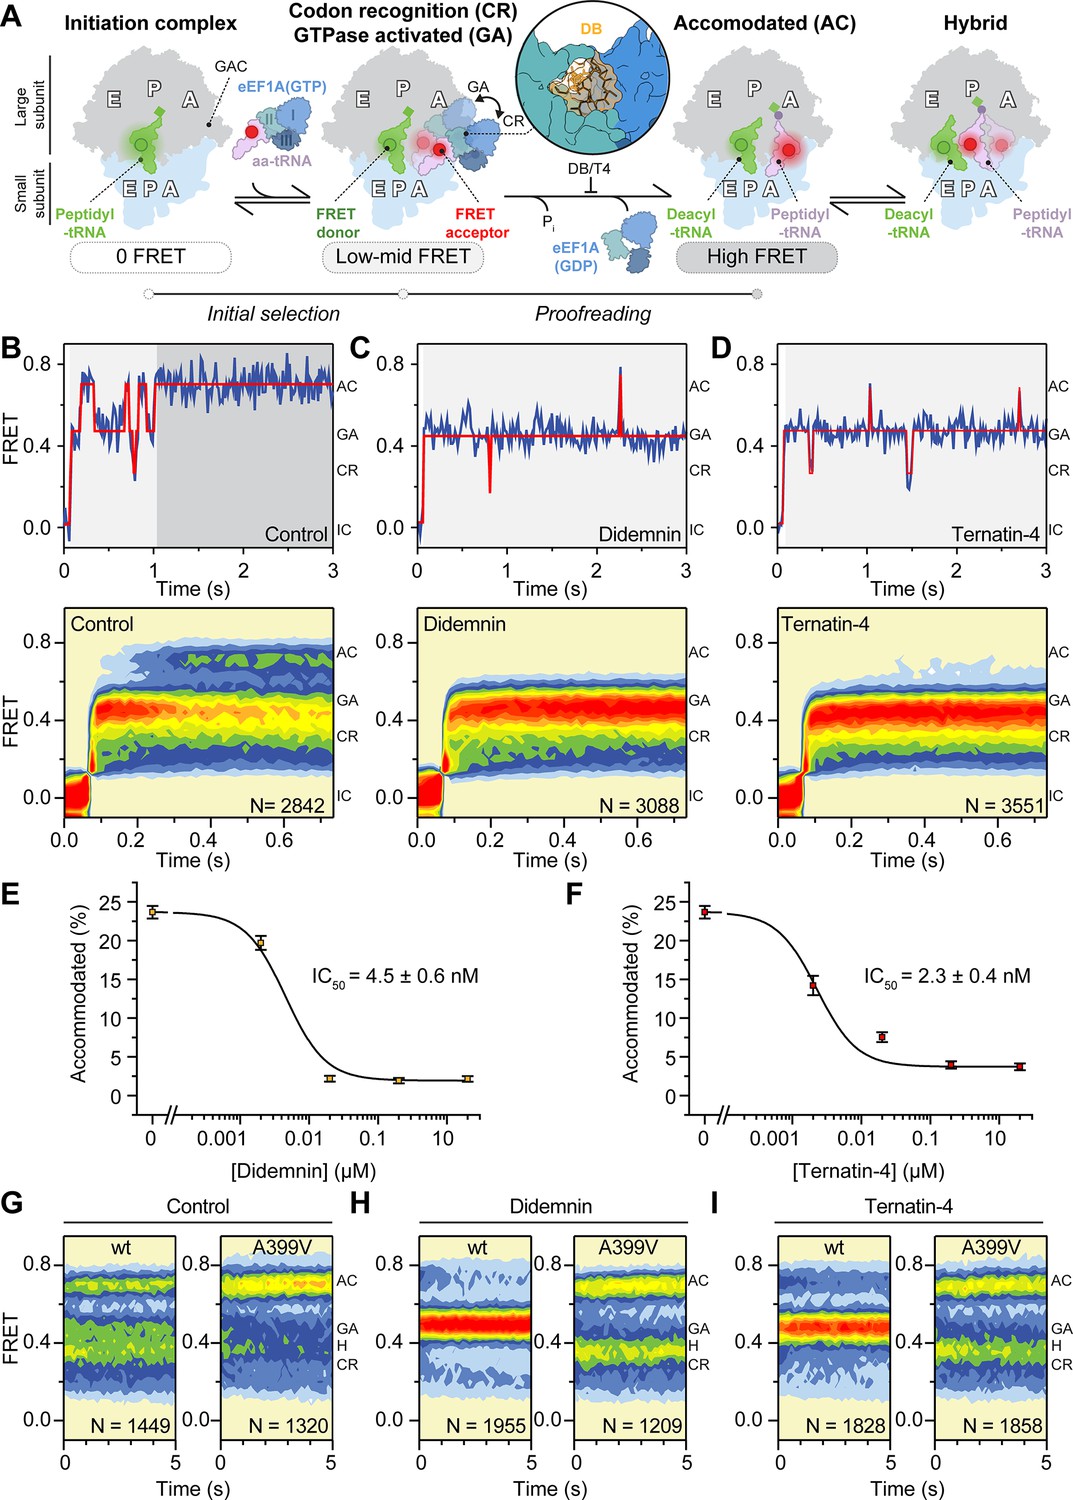
Mechanism of didemnin and ternatin-4 inhibition revealed by smFRET.
(A) Schematic of the experimental setup. Acceptor Cy5 (red circle)-labeled eEF1A(GTP)-aa-tRNA ternary complex is delivered to 80 S initiation complexes with donor Cy3 (green circle)-labeled P-site tRNA. eEF1A is colored by domain (I-III). Codon recognition (CR, low FRET,~0.2, solid) leads to a pre-accommodated GTPase-activated (GA, mid FRET,~0.45, transparent) state, where eEF1A docks on the large subunit GTPase activating center (GAC). Accommodation (AC) and peptide bond formation produce a pre-translocation complex, which samples classical (high-FRET,~0.7) and hybrid (H, mid-FRET,~0.25–0.4) conformations in equilibrium. Inset shows the didemnin (DB, orange) and ternatin-4 (T4) binding site on eEF1A (PDB-ID: 5LZS) (Shao et al., 2016). (B–D) Representative smFRET traces, (top) and post-synchronized population histograms of N traces (bottom) of accommodation dynamics of pre-steady state reactions in the presence of (B) DMSO (control) or 20 µM (C) didemnin or (D) ternatin-4. Dotted circles and shading behind traces indicate the state assignment as described in (A; white, unbound; light gray, CR/GA; dark gray, accommodated). (E, F) Dose-response curves of the accommodated fraction in the presence of (E) didemnin or (F) ternatin-4. Error bars: s.e.m. from 1000 bootstrap samples. (G–I) Population histograms of N traces for steady-state reactions, formed with ternary complex containing recombinant wild-type (wt) or A399V eEF1A. See also Figure 1—figure supplements 1–3.
Figure 1—figure supplement 1
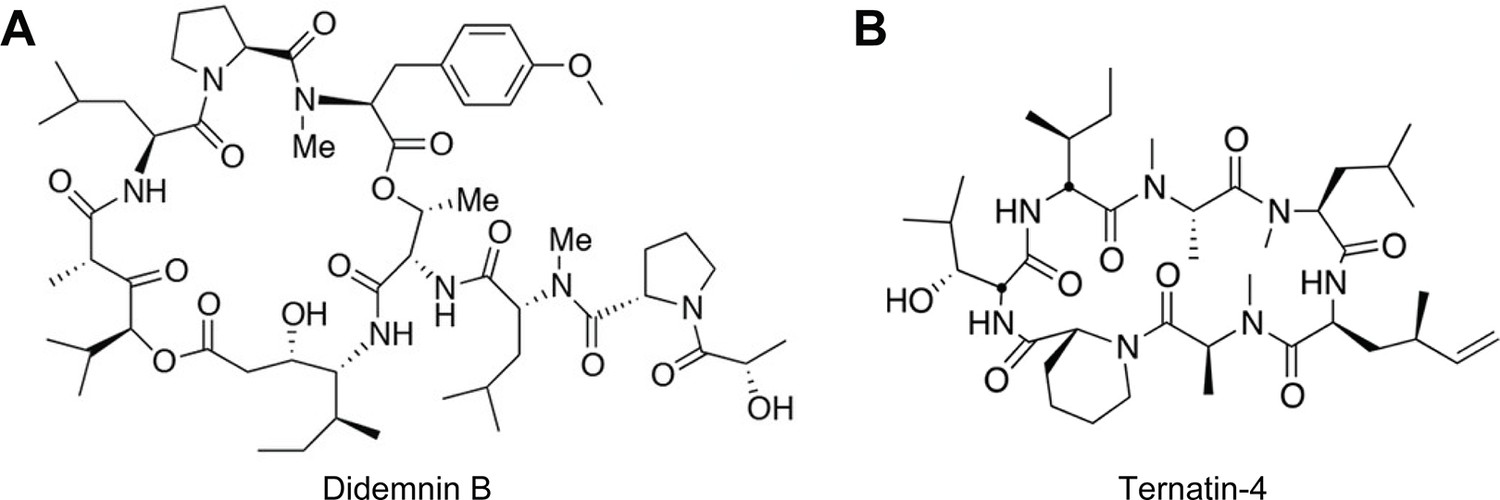
Molecular structures of (A) didemnin (didemnin B) and (B) ternatin-4.
Figure 1—figure supplement 2
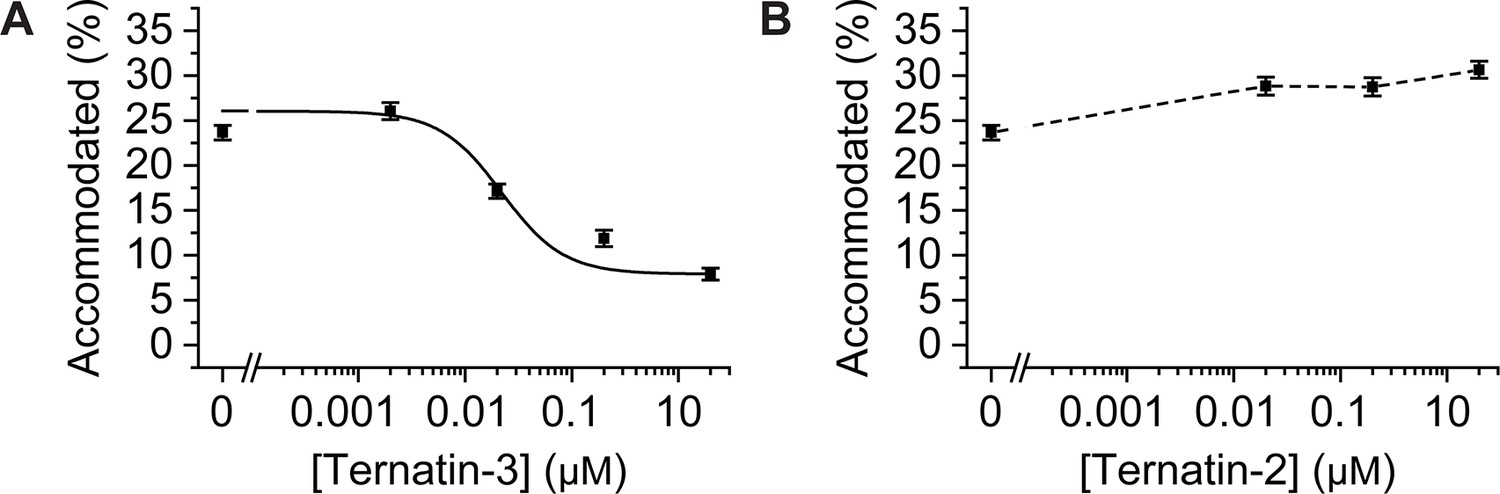
Dose response profiles of the accommodated fraction for (A) intermediately active ternatin-3, and (B) inactive ternatin-2.
Error bars: s.e.m. from 1000 bootstrap samples.
Figure 1—figure supplement 3
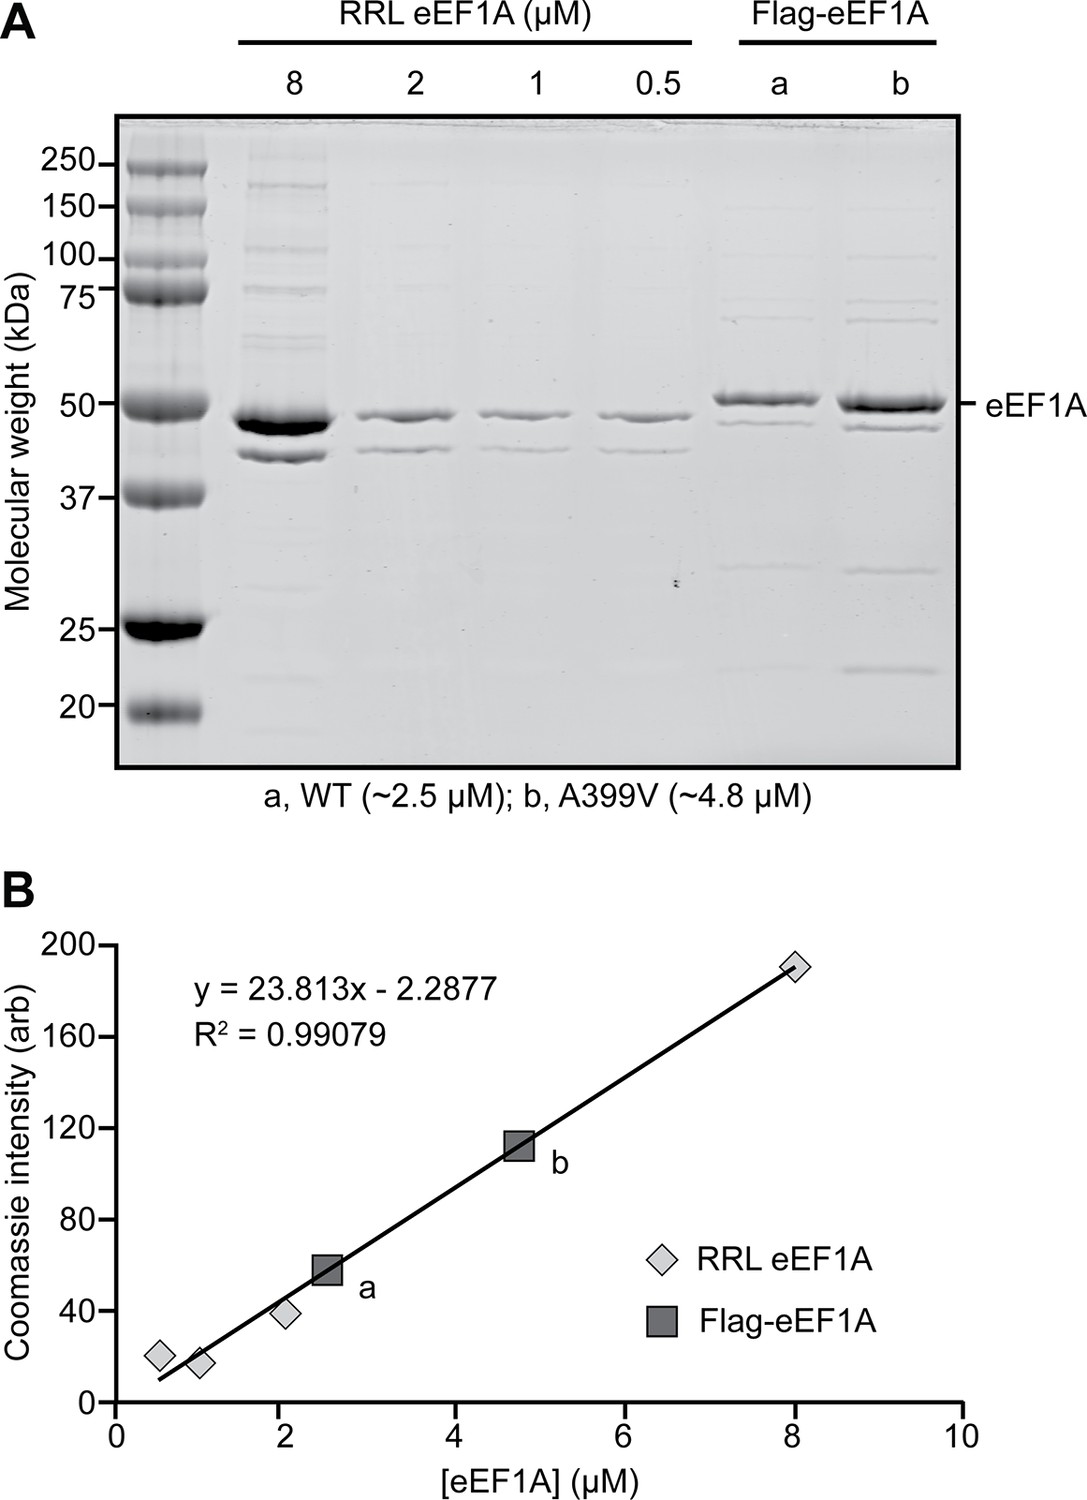
Recombinant expression of Flag-tagged eEF1A.
(A) Coomassie-stained SDS-PAGE gel loaded with rabbit reticulocyte lysate (RRL) eEF1A (left) and wild type (WT, a) or mutant (A399V, b) recombinant Flag-eEF1A (right) and (B) corresponding concentration calibration plot. See also Figure 1—figure supplement 3—source data 1 Data 1.
-
Figure 1—figure supplement 3—source data 1
Raw image file of the coomassie-stained SDS-PAGE gel for Figure 1—figure supplement 3A.
- https://cdn.elifesciences.org/articles/81608/elife-81608-fig1-figsupp3-data1-v1.zip
Figure 2 with 1 supplement
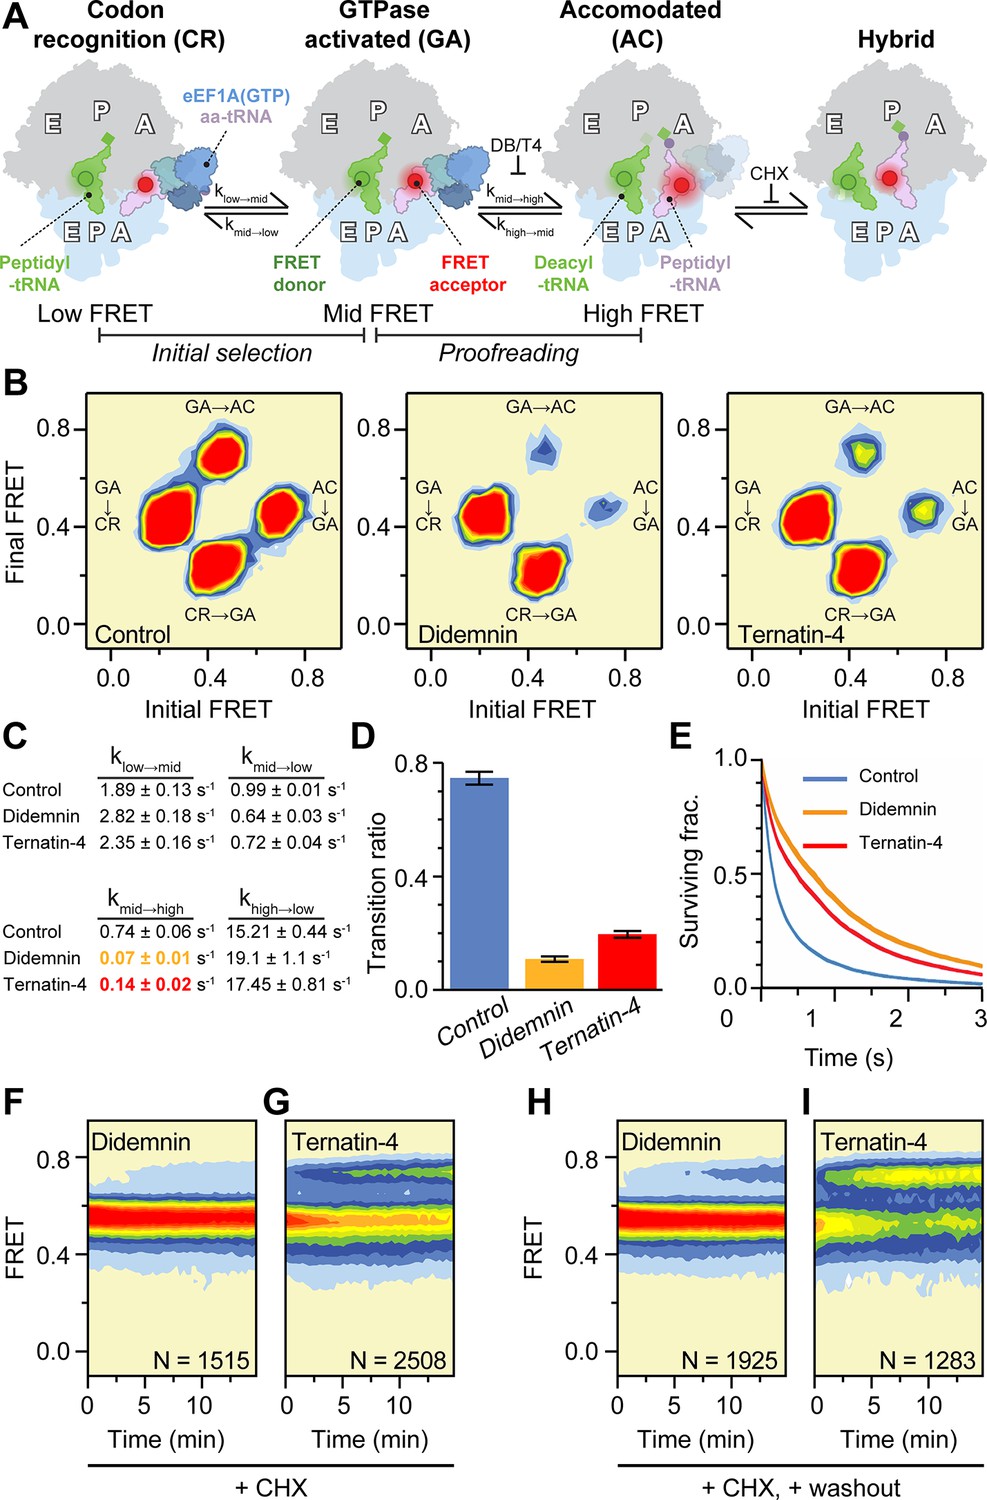
Mechanistic differences between didemnin and ternatin-4.
(A) Schematic of the experimental setup, as in Figure 1A. Acceptor Cy5 (red circle)-labeled eEF1A(GTP)-aa-tRNA ternary complex is delivered to 80 S initiation complexes with donor Cy3 (green circle)-labeled P-site tRNA. Hidden Markov modeling (McKinney et al., 2006) was used to assess the frequency of transitions from the mid-FRET GTPase-activated (GA,~0.45 FRET) state to low-FRET codon recognition (CR-like,~0.2 FRET) and high-FRET accommodated (AC-like,~0.7 FRET) states, representing “initial selection” and “proofreading”, respectively. Transitions from classical high-FRET AC-like states to mid-FRET hybrid states were inhibited by inclusion of cycloheximide (CHX) to aid analysis. (B) Transition density plots of pre-accommodated complexes reveal attenuated sampling of the high-FRET state comparing absence of drug (left), or in the presence of saturating (20 µM) didemnin (middle) or ternatin-4 (right). (C) Apparent transition rates ki→j between FRET states (low, mid, high) in aa-tRNA selection experiments prior to the first dwell in high FRET for ≥150ms with standard errors from 1000 bootstrap samples. See also Table 1. (D) Ratio of mid-to-high (GA-to-AC) over mid-to-low (GA-to-CR) transitions. Error bars: s.e.m. from 1000 bootstrap samples. (E) Survival plots reveal increased mid-FRET (GA/GA-like) lifetimes with didemnin and ternatin-4 (line width = s.e.m. from 1000 bootstrap samples). (F, G) Population histograms of N traces after extended incubation in the presence of CHX and 20 µM (F) didemnin or (G) ternatin-4 reveals ‘sneak-through’ to high-FRET pre-translocation complexes. (H) Didemnin/CHX- or (I) ternatin-4/CHX-stalled complexes were washed in the presence of CHX in the first second of each movie, revealing aa-tRNA accommodation, concomitant with drug dissociation. See also Figure 2—figure supplement 1.
Figure 2—figure supplement 1
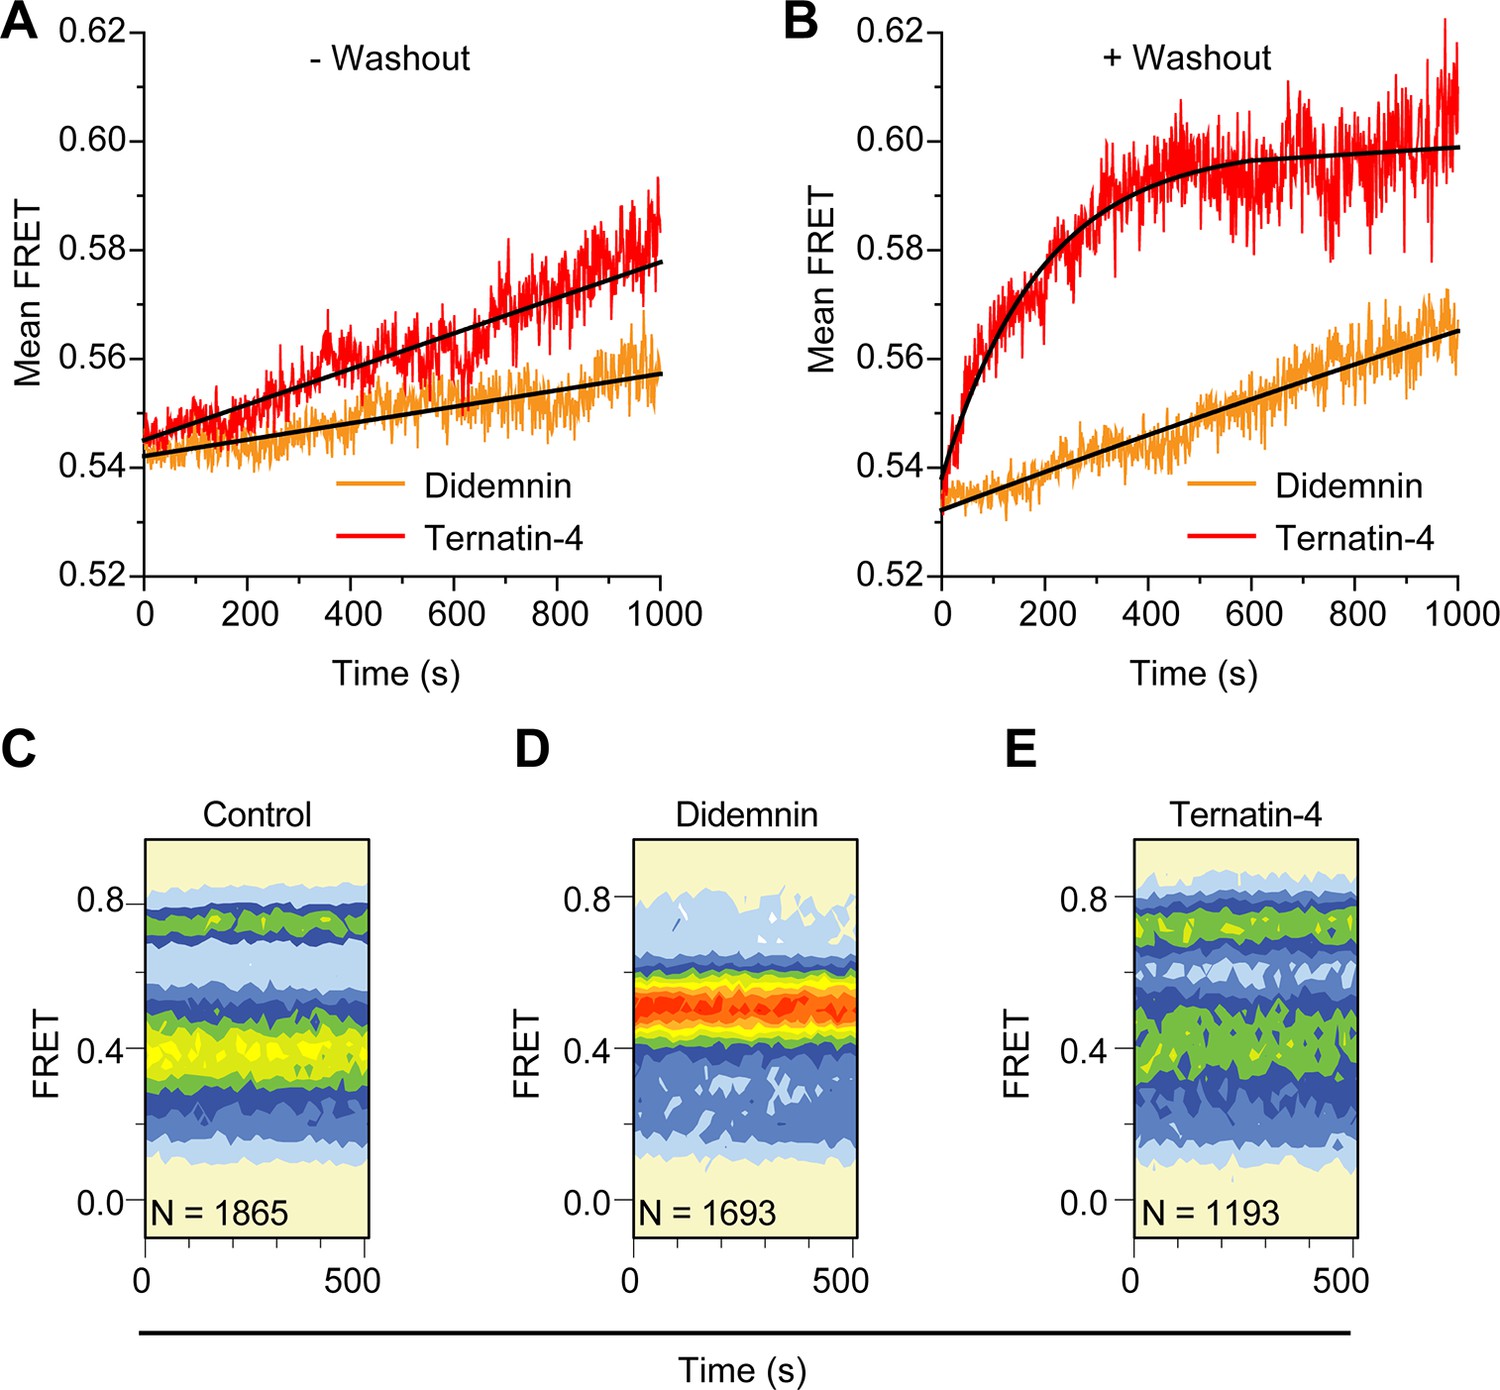
Didemnin more effective inhibits aminoacyl-tRNA accommodation into the ribosome.
(A, B) Time course of accommodation in the presence of 350 µM cycloheximide (A) with 20 µM didemnin (orange) or ternatin-4 (red) in solution (black line: linear fits) and (B) after washing out free drug from stalled complexes (black line: exponential fits). (C–E) Equilibrium population histograms of N traces of (C) drug-free pre-translocation complex, (D) didemnin- or (E) ternatin-4-stalled complexes 5 min after washout.
Figure 3 with 4 supplements
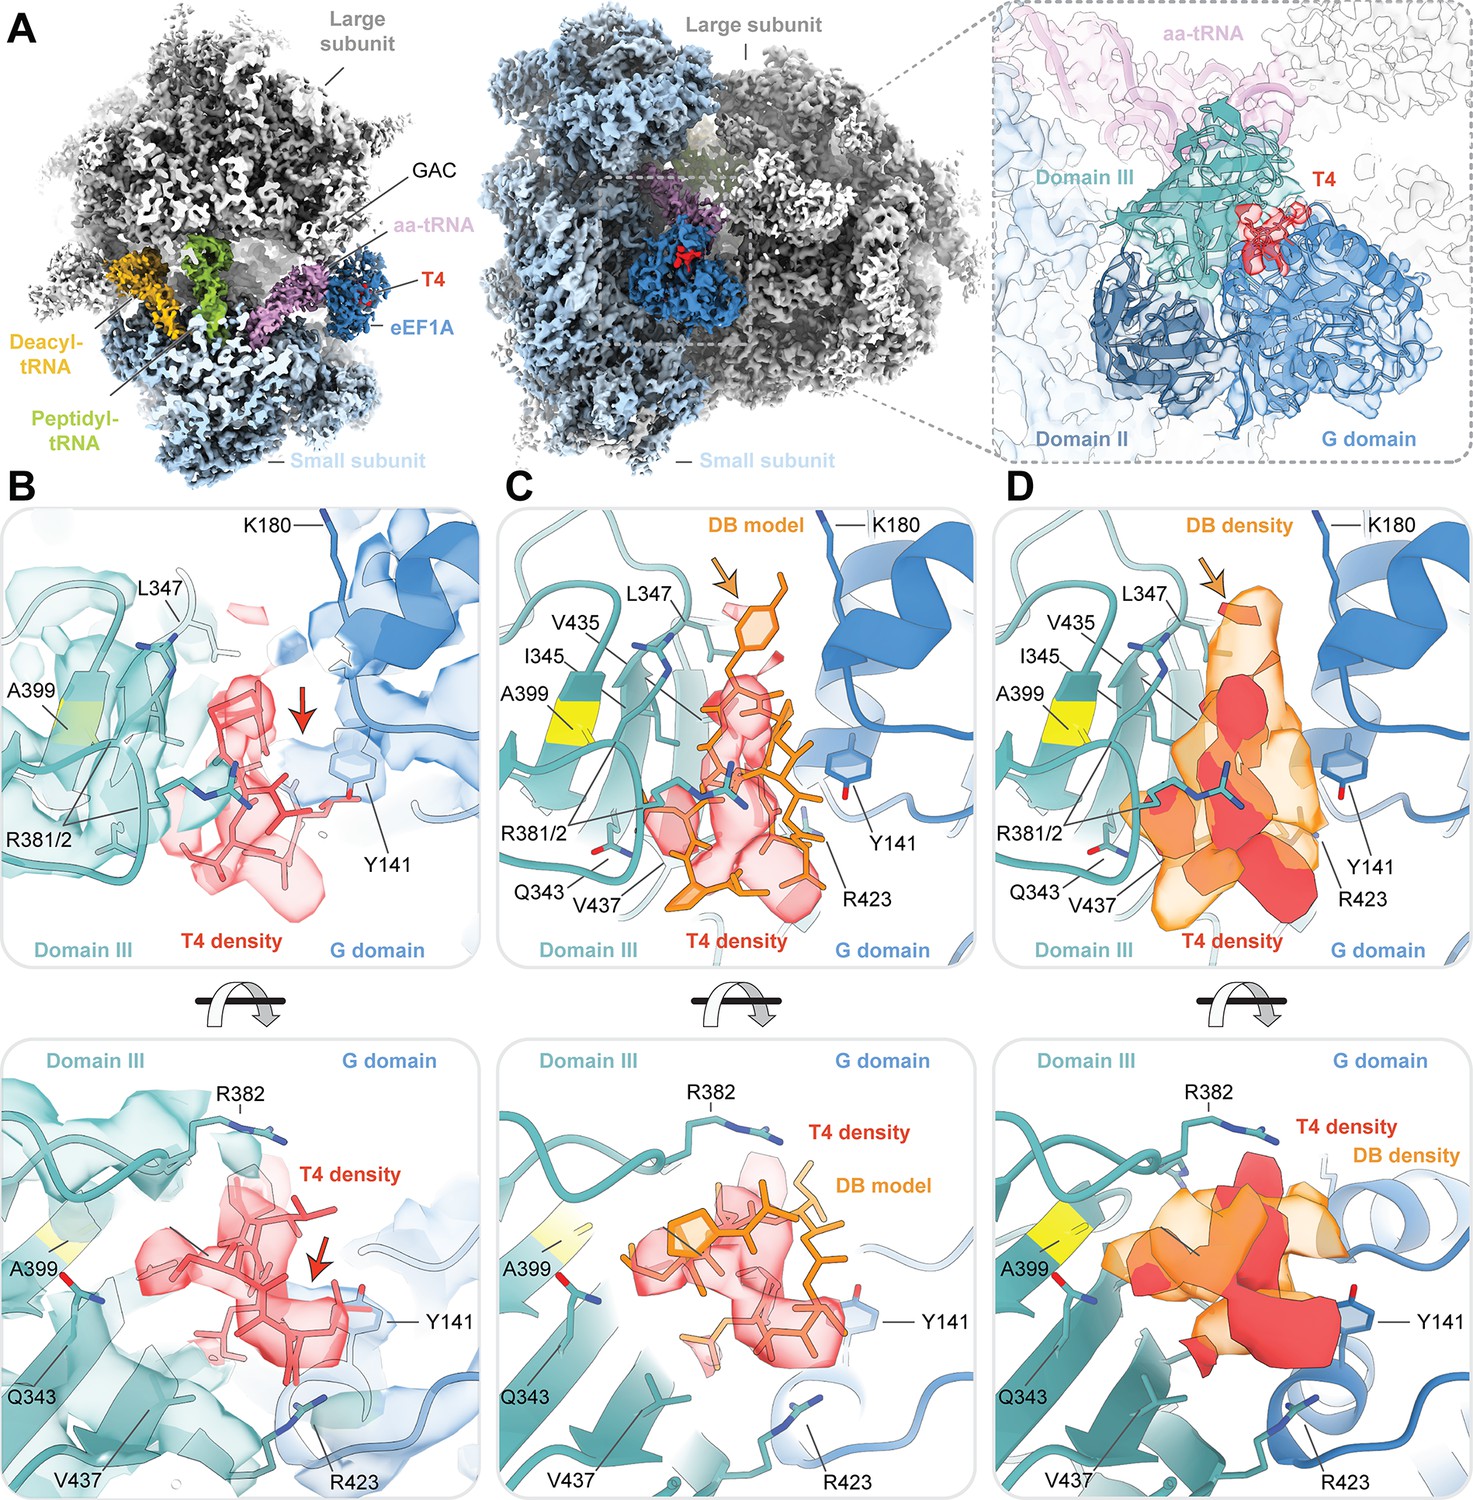
Cryo-EM structure of ternatin-4 stalled rabbit 80S-eEF1A-aa-tRNA complex.
(A) Overview of the cryo-EM density map of the ternatin-4-stalled rabbit elongation complex viewed from the small subunit head domain (left) and into the GTPase activating center (GAC) from the leading edge (middle) comprising the large (gray) and small (light blue) ribosomal subunits, peptidyl-tRNA (P site, green), deacyl-tRNA (E site, gold), aminoacyl-tRNA in the pre-accommodated ‘A/T’ state (aa-tRNA, purple), eEF1A (blue), and ternatin-4 (T4, red). Inset (right) shows cryo-EM density of eEF1A ternary complex on the ribosome highlighting density for T4 with eEF1A colored by domain. Atomic model of eEF1A and aa-tRNA from PDB-ID: 5LZS (Shao et al., 2016) was rigid-body fit into the cryo-EM map. (B) Zoom-in of cryo-EM density at the interface between the G domain and domain III of eEF1A that has been assigned to T4, colored as in (A, right). Residue A399 (yellow), which confers resistance to didemnin (DB) and T4 and when mutated to valine, is adjacent to the density for T4. Computationally derived model of T4 (Sánchez-Murcia et al., 2017) was rigid-body fit into the cryo-EM density. Red arrow denotes unassigned density that could be assigned to T4. (C, D) Overlay of (C) the atomic model and (D) the cryo-EM density of DB (orange, EMD-4130) and T4, Orange arrow denotes the dimethyltyrosine (Me2Tyr) moiety of didemnin. All cryo-EM density is contoured at 3.5 σ. See also Figure 3—figure supplements 1–4.
Figure 3—figure supplement 1
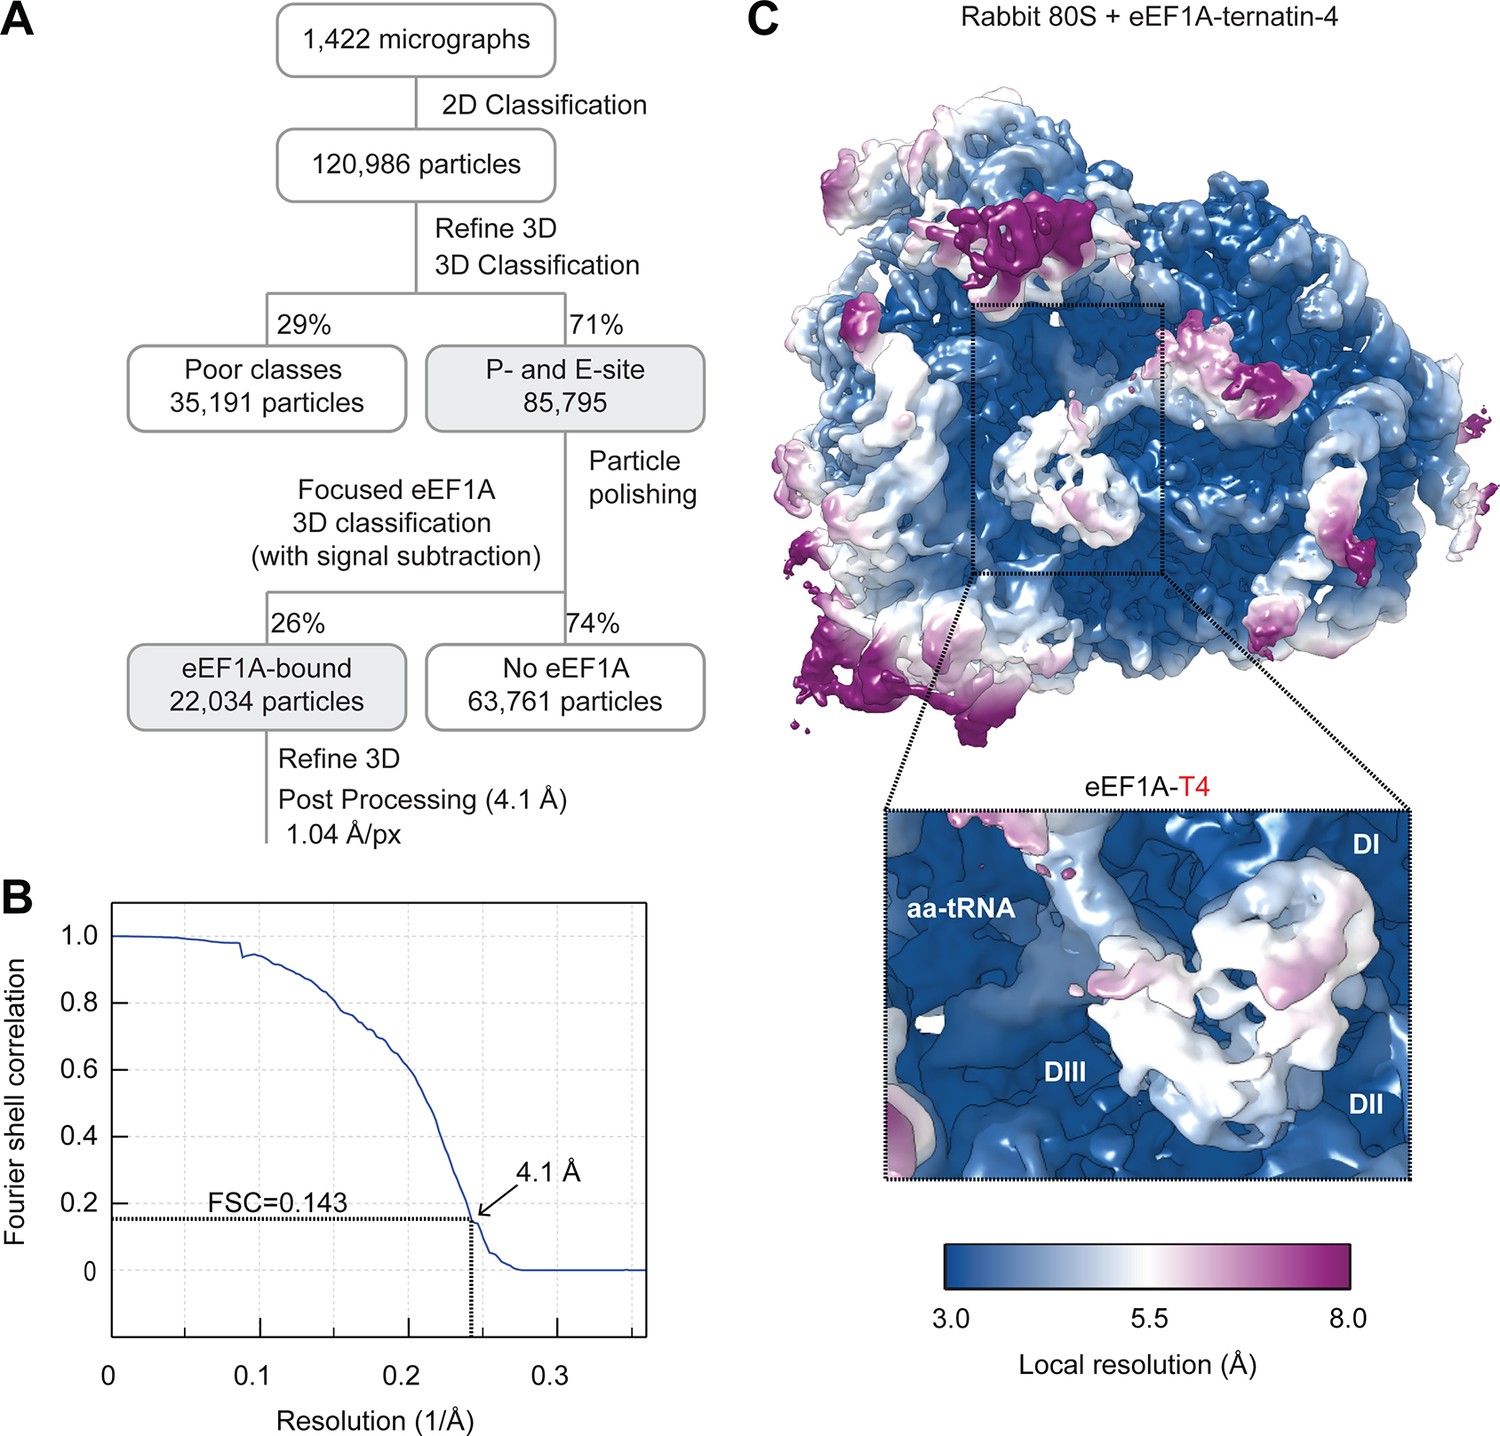
Cryo-EM processing of the ternatin-4 stalled rabbit 80S-eEF1A-aa-tRNA structure.
(A) Flowchart of cryo-EM image processing. (B) Fourier Shell Correlation (FSC) curve for the final reconstruction. Based on the FSC = 0.143 criterion the map reaches a nominal resolution of 4.1 Å. (C) Local resolution of the refined map showing an overview and eEF1A (inlay). The local resolution for the eEF1A(GDP)-aa-tRNA ternary complex is lower than the surrounding ribosome due to flexibility.
Figure 3—figure supplement 2
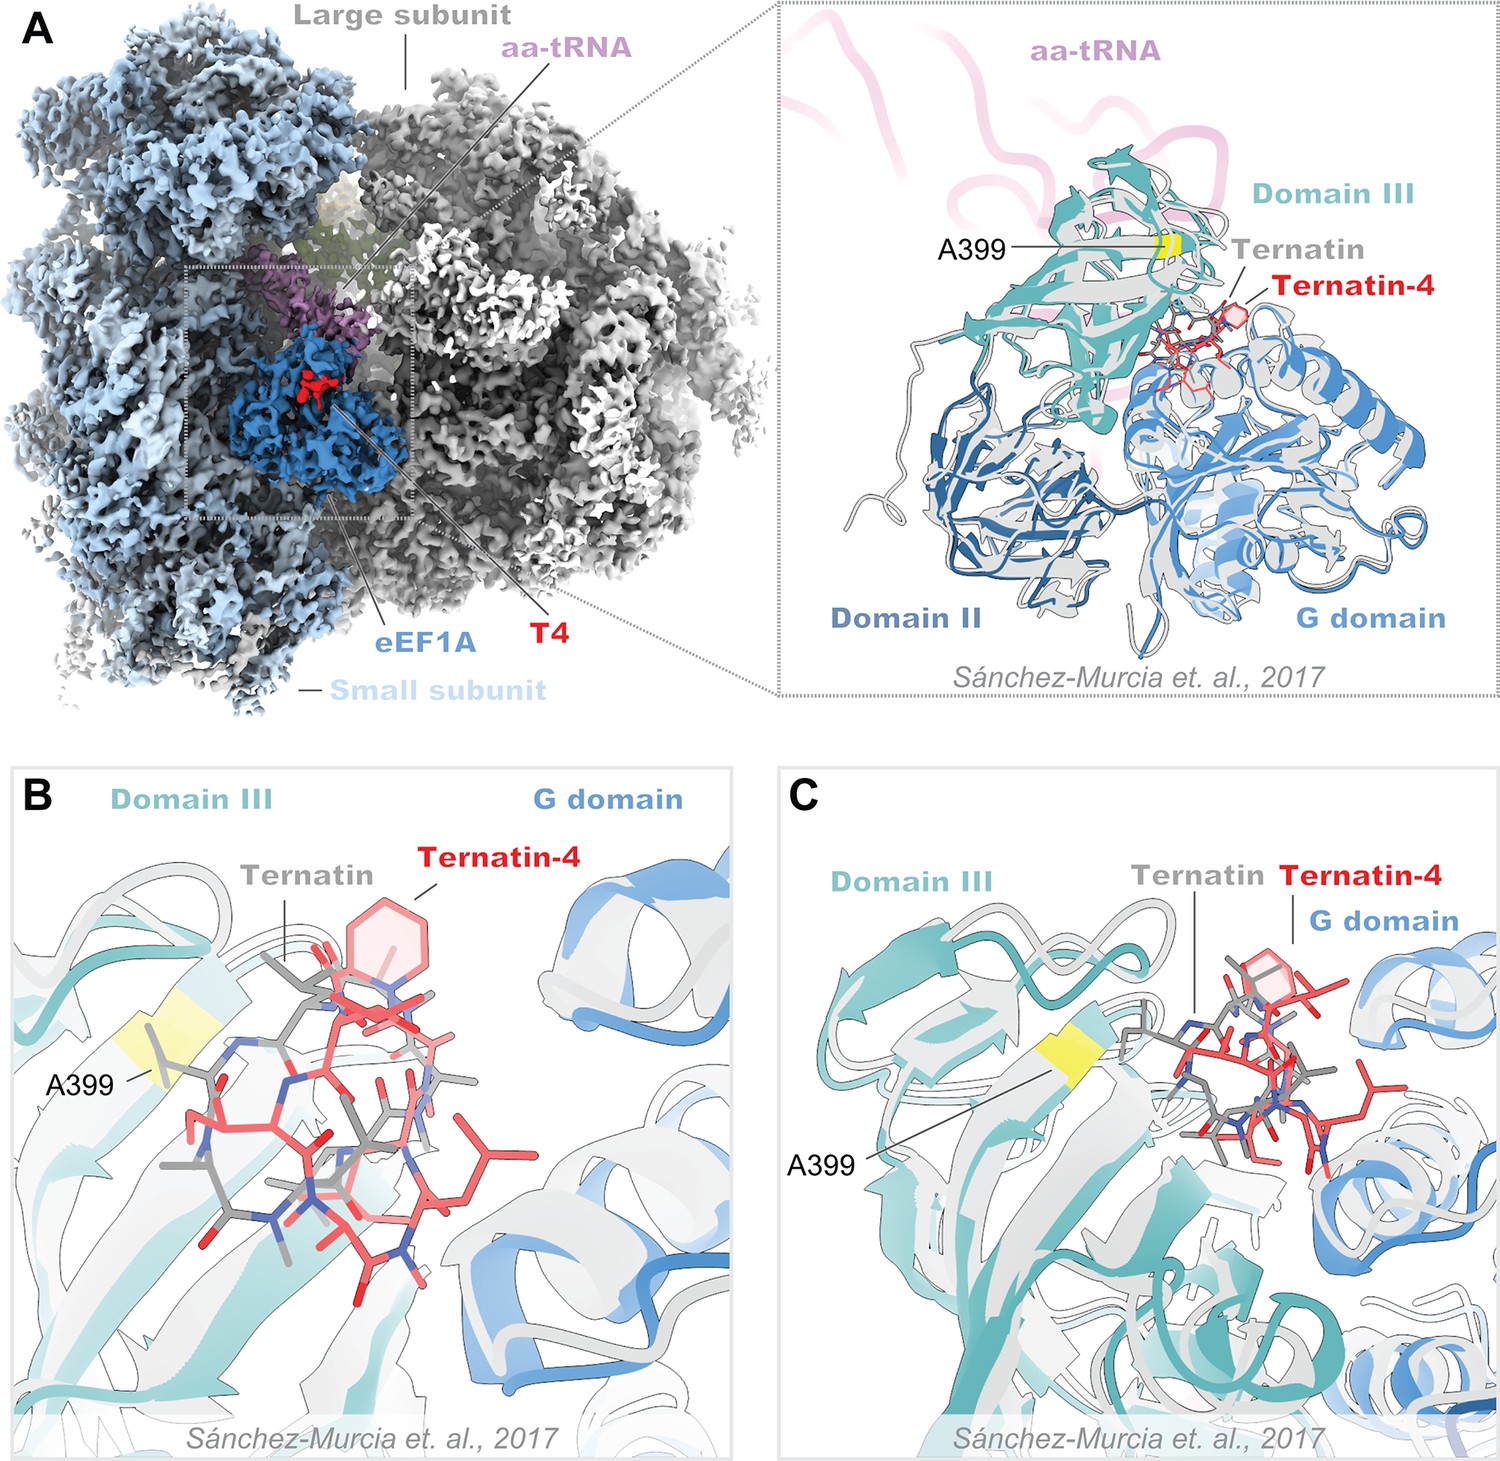
Structural comparison of the ternatin-4-stalled rabbit elongation complex with a published prediction of ternatin binding.
(A) Overview of the cryo-EM density maps of the ternatin-4-stalled rabbit elongation complex (left) comprising the large (gray) and small (light blue) ribosomal subunits, peptidyl-tRNA (P site, green), aminoacyl-tRNA in the pre-accommodated “A/T” state (aa-tRNA, purple), eEF1A (blue), and ternatin-4 (T4, red). (Inlay) Atomic model of eEF1A and aa-tRNA from PDB-ID: 5LZS, colored by domain was rigid-body fit into the cryo-EM map and aligned to a published molecular dynamics model of ternatin docked to eEF1A (gray) (Sánchez-Murcia et al., 2017). (B, C) Zoom-in of the overlay from panel (A, inlay) of the ternatin-4 binding site at the interface between the G domain and domain III of eEF1A, colored as in (A, inlay). Residue A399 (yellow), which confers resistance to ternatin and didemnin when mutated to valine, is adjacent to the density for T4.
Figure 3—figure supplement 3

Cryo-EM processing of the didemnin and ternatin-4 stalled human 80S-eEF1A-aa-tRNA structures.
(A) Flowchart of cryo-EM image processing for final map generation for ternatin-4 (T4, red, left) and didemnin (DB, orange, right). (B, C) Fourier Shell Correlation (FSC) curve for the final reconstructions for (B) T4 and (C) DB. (D, E) Local resolution of the refined maps for (D) T4 and (E) DB viewing overview and eEF1A (inlays). The local resolution for the eEF1A-aa-tRNA ternary complex is lower than the surrounding ribosome due to flexibility.
Figure 3—figure supplement 4
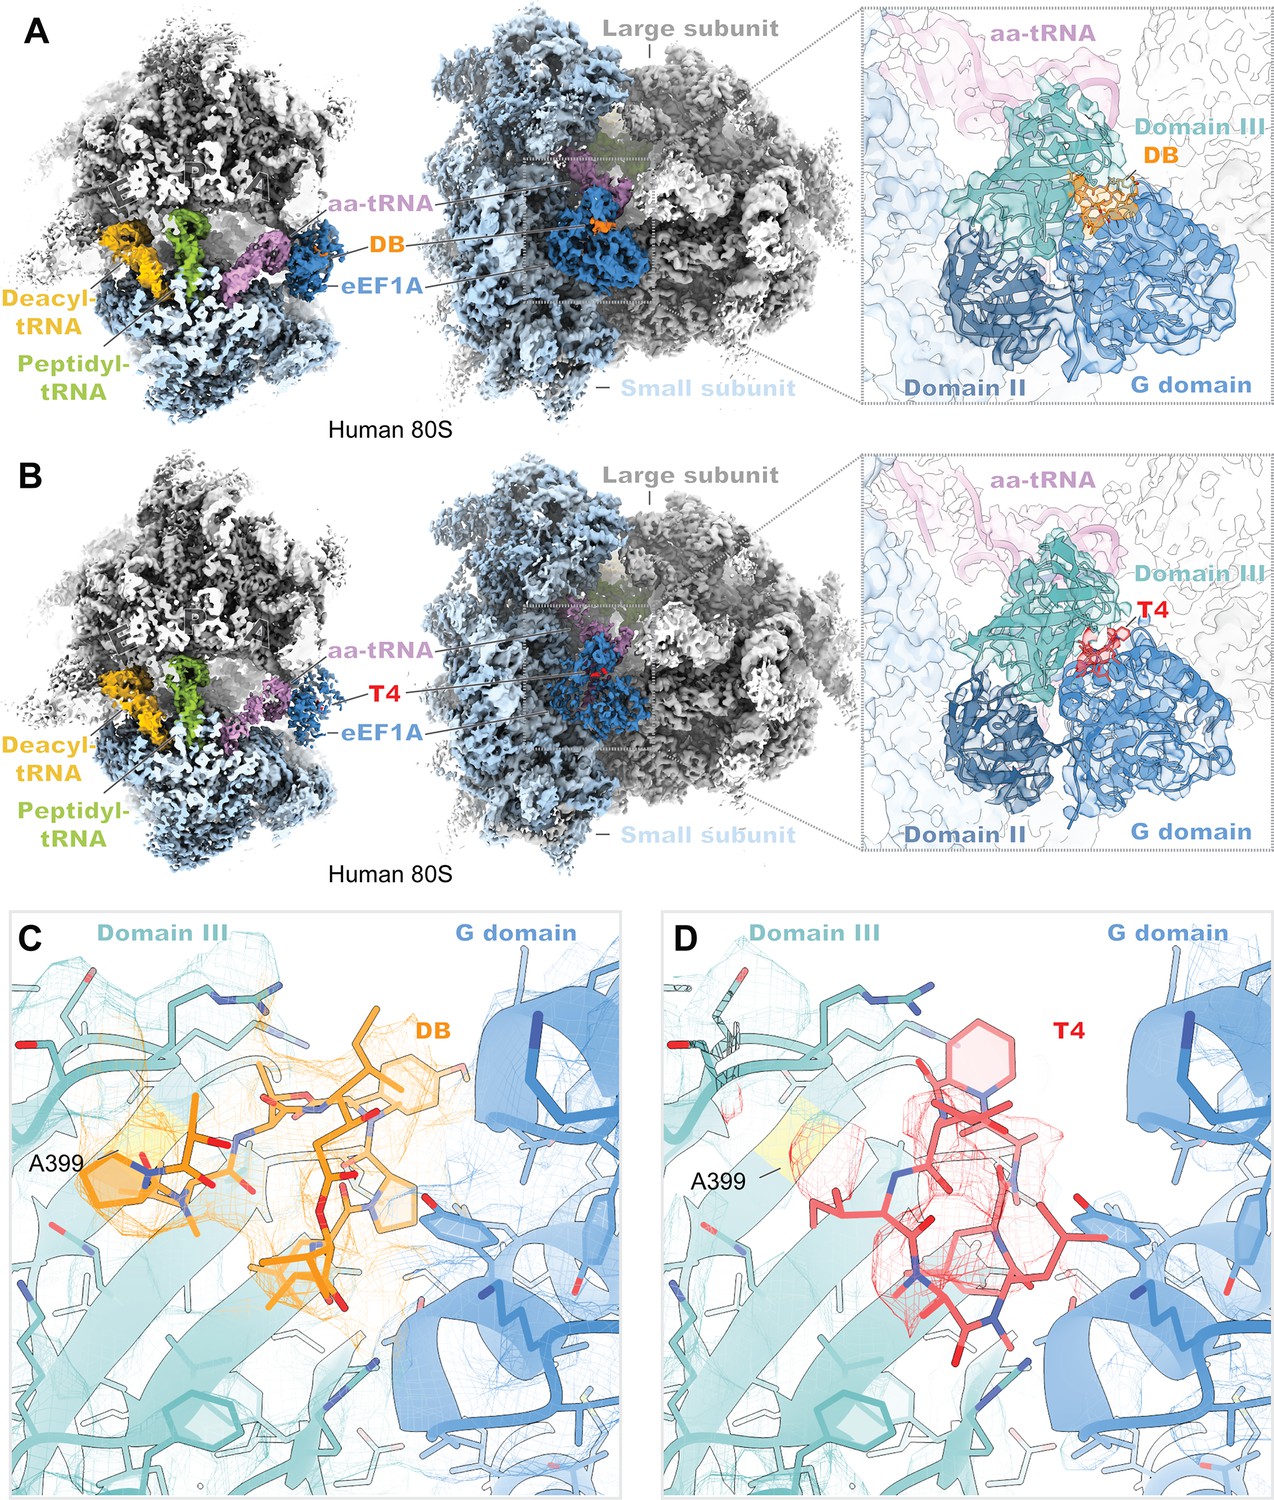
Cryo-EM structures of didemnin and ternatin-4 stalled human 80S-eEF1A(aa-tRNA) complexes.
(A, B) Overview of the cryo-EM density maps of the (A) didemnin- and (B) ternatin-4-stalled human initiation complexes viewed from the small subunit head domain (left) and into the GTPase activating center from the leading edge (middle) comprising the large (gray) and small (light blue) ribosomal subunits, peptidyl-tRNA (P site, green) and deacyl-tRNA (E site, gold), aminoacyl-tRNA in the pre-accommodated ‘A/T’ state (aa-tRNA, purple), eEF1A (blue), and didemnin (DB, orange) or ternatin-4 (T4, red). Inlays (right) show cryo-EM density of eEF1A ternary complex on the ribosome highlighting density for (A) DB or (B) T4, with eEF1A colored by domain. Atomic model of eEF1A and aa-tRNA from PDB-ID: 5LZS (Shao et al., 2016) was rigid-body fit into both cryo-EM maps. (C, D) Zoom-in of unaccounted cryo-EM density at the interface between the G domain and domain III of eEF1A has been assigned to (C) DB and (D) T4, colored as in (A, B; left). Residue A399 (yellow), which confers resistance to ternatin and DB when mutated to valine, is adjacent to the overlapping drug binding pocket. All cryo-EM density is contoured at 2.5 σ.
Figure 4 with 1 supplement

eEF1A is more dynamic when bound to ternatin-4 than to didemnin.
(A) Overview of the domain architecture of the eEF1A ternary complex from PDB-ID: 5LZS (Sánchez-Murcia et al., 2017) as viewed from the leading edge of the rabbit 80 S ribosome and the sarcin ricin loop. G-domain (blue) elements include switch I (yellow), switch II (lime), the P loop (dark green), helix α2 (dark blue), and a bound GDP (light purple) in the nucleotide binding pocket. Inset shows density for the GDP nucleotide. Model of the computationally derived model of ternatin-4 (T4, red) (Shao et al., 2016) is shown to indicate the drug binding pocket location. (Inlay) Dotted circle indicates the approximate location of the γ phosphate when GTP is bound. (B, C) Atomic models of eEF1A and aa-tRNA from PDB-ID: 5LZS were rigid-body fit into the cryo-EM density shown in surface representation of the eEF1A G domain when stalled with didemnin (DB, orange, EMD-4130, left) (Shao et al., 2016) or T4 (right) on the elongating rabbit 80 S ribosome, colored as in (A). Dotted lines indicate regions of weakened cryo-EM density in the T4-stalled eEF1A G domain in the C terminus of helix α2. Panels highlight (B) the nucleotide binding pocket of eEF1A and switch loop architecture and (C) the junction between the large subunit, eEF1A helix α2, and small subunit (light blue) rRNA helix 14. All cryo-EM density is contoured at 3 σ. See also Figure 4—figure supplement 1.
Figure 4—figure supplement 1

The G domain of eEF1A is more dynamic when bound to ternatin-4 than to didemnin on the human 80 S ribosome.
(A) Overview of the domain architecture of eEF1A ternary complex from PDB-ID: 5LZS (Shao et al., 2016) bound to didemnin (DB, orange, left) or ternatin-4 (T4, red, right) as viewed from the leading edge of the human 80 S ribosome and the sarcin ricin loop. G-domain (blue) elements include switch I (yellow), switch II (lime), the P loop (dark green), helix α2 (dark blue), a bound GDP (light purple) in the nucleotide binding pocket, a pre-accommodated ‘A/T’ state (aa-tRNA, pink), and ternatin-4 (T4, red). (B, C) Atomic models from PDB-ID: 5LZS and cryo-EM density shown in surface representation of the eEF1A G domain when stalled with DB (left) or T4 (right) on the human 80 S ribosome, colored as in (A). Panels highlight (B) the nucleotide binding pocket of eEF1A and switch loop architecture and (C) the junction between the large subunit, eEF1A helix α2, and small subunit (light blue) rRNA helix 14. All cryo-EM density is contoured at 2 σ.
Figure 5 with 1 supplement
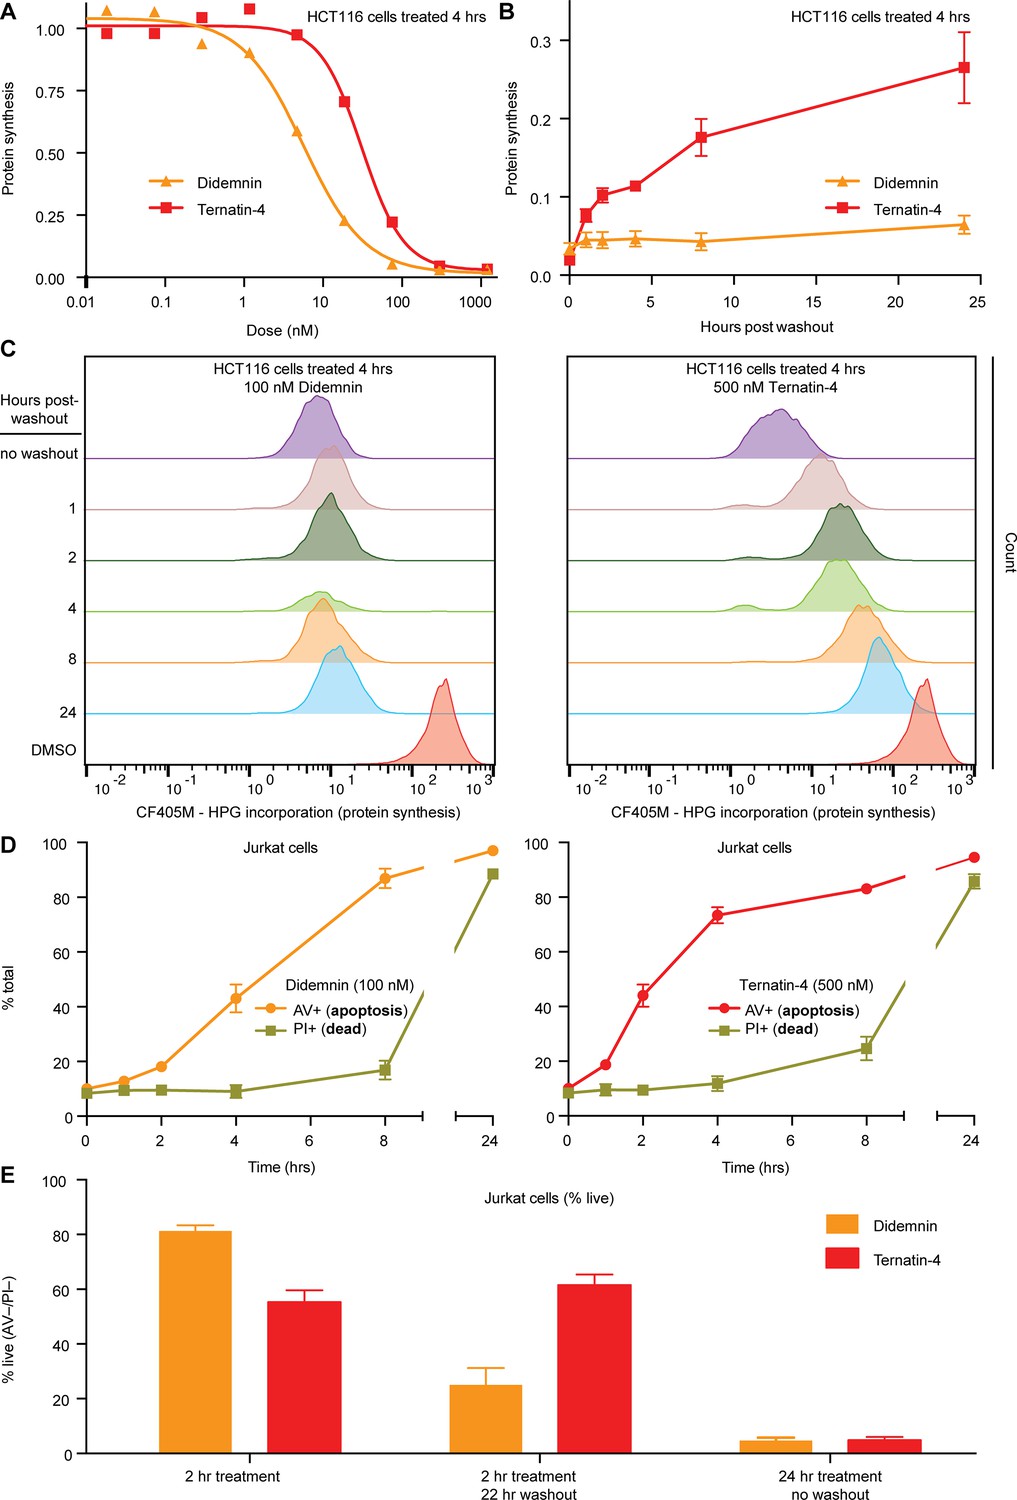
Cellular effects of ternatin-4, but not didemnin, are reversible upon washout.
(A) Dose-dependent effects of didemnin (orange) and ternatin-4 (red) on protein synthesis in HCT116 cells under continuous treatment (4 hr). Protein synthesis was quantified by homopropargylglycine pulse (1 hr) followed by fixation and copper-mediated conjugation to CF405M azide fluorophore and analyzed by FACS. (B) HCT116 cells were treated with didemnin (100 nM, orange) or ternatin-4 (500 nM, red) for 4 hr, followed by washout. Protein synthesis was quantified as in (A) at 1, 2-, 4-, 8-, or 24 hr post-washout. (C) Histograms corresponding to panel (B) for didemnin (left) and ternatin-4 (right). (D) Jurkat cells were treated with didemnin (100 nM, left) or ternatin-4 (500 nM, right) or for 1, 2, 4, 8, or 24 hr, stained with Annexin V-FITC (AV+, apoptotic) and propidium iodide (PI+, green, dead), and analyzed by FACS. (E) Jurkat cells were treated with didemnin (100 nM, orange) or ternatin-4 (500 nM, red) for 2 hr followed by washout and 22 hr incubation in drug-free media or for 24 hr and analyzed as in (D). Bar graphs show the ratio of live cells. See also Figure 5—figure supplement 1.
Figure 5—figure supplement 1
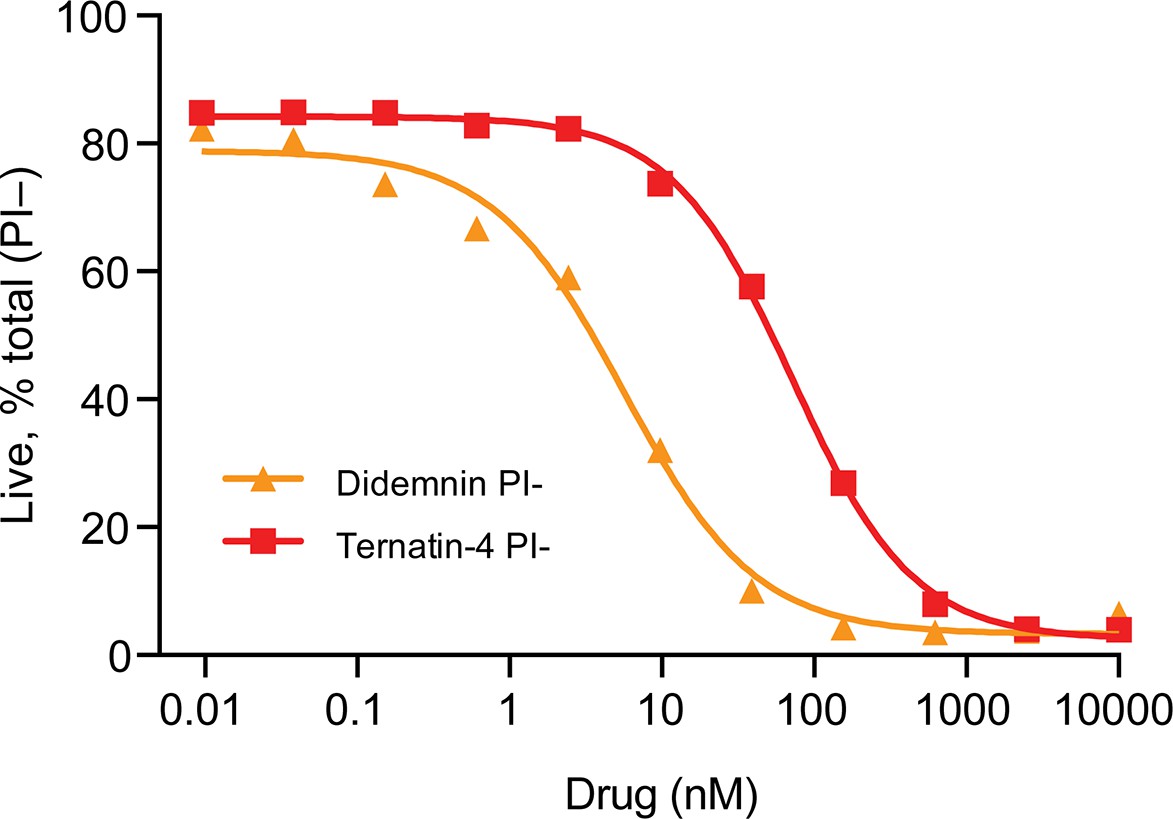
Dose response curve for Jurkat cells treated for 24 hr with the indicated compound.
Cells were stained with propidium iodide (PI-) and analyzed for cell death by flow cytometry.
Tables
Table 1
Ternary complex dynamics measured by smFRET.
Apparent transition rates ki→j between FRET states (low FRET: index 1; intermediate FRET: index 2; high FRET: index 3) and overall decay rates ki for each state observed in aa-tRNA selection experiments prior to the first dwell in high FRET (AC) for ≥150ms with standard errors from 1000 bootstrap samples.
| Control | ||
|---|---|---|
| k1 = (1.90±0.13) s–1 | k1→2 = (1.89±0.13) s–1 | k1→3 = (0.01±0.005) s–1 |
| k2→1 = (0.99±0.01) s–1 | k2 = (1.73±0.09) s–1 | k2→3 = (0.74±0.06) s–1 |
| k3→1 = (0.24±0.09) s–1 | k3→2 = (15.21±0.44) s–1 | k3 = (15.45±0.43) s–1 |
| Didemnin | ||
| k1 = (2.827±0.18) s–1 | k1→2 = (2.824±0.18) s–1 | k1→3 = (0.003±0.003) s–1 |
| k2→1 = (0.64±0.03) s–1 | k2 = (0.71±0.03) s–1 | k2→3 = (0.07±0.01) s–1 |
| k3→1 = (0.22±0.17) s–1 | k3→2 = (19.1±1.1) s–1 | k3 = (19.3±1.1) s–1 |
| Ternatin-4 | ||
| k1 = (2.36±0.15) s–1 | k1→2 = (2.35±0.16) s–1 | k1→3 = (0.01±0.01) s–1 |
| k2→1 = (0.71±0.04) s–1 | k2 = (0.85±0.04) s–1 | k2→3 = (0.14±0.02) s–1 |
| k3→1 = (0.52±0.42) s–1 | k3→2 = (17.45±0.81) s–1 | k3 = (17.97±0.83) s–1 |
Table 2
Cryo-EM data collection and processing statistics.
| RRL 80 S•aa-tRNA• | Human 80 S•Phe-tRNAPhe• | Human 80 S•Phe-tRNAPhe• | ||
|---|---|---|---|---|
| eEF1A•ternatin-4 | eEF1A•didemnin | eEF1A•ternatin-4 | ||
| EMDB-27732 | EMDB-27691 | EMDB-27694 | ||
| Grid Preparation | ||||
| Grids | Quantifoil R2/2 +5 nm carbon | UltrAuFoil Gold R1.2/1.3 | UltrAuFoil Gold R1.2/1.3 | |
| [Drug] (μM) | 1 | 0.2 | 20 | |
| [80 S] (nM) | ~120 | ~200 | ~200 | |
| Plunge freezer | Vitrobot MKIII (FEI) | Vitrobot MKII (FEI) | Vitrobot MKII (FEI) | |
| Temperature (°C) | 4 | 4 | 4 | |
| Humidity (%) | 100 | 100 | 100 | |
| Wait time (s) | 30 | 45 | 45 | |
| Blot time (s) | 3 | 2–3 | 2–3 | |
| Data Collection | ||||
| Microscope | Titan Krios (FEI) | Titan Krios (FEI) | Titan Krios (FEI) | |
| Voltage (kV) | 300 | 300 | 300 | |
| Camera | Falcon II (FEI) | K2 Summit (Gatan) | K2 Summit (Gatan) | |
| Acquisition software | EPU (FEI) | Leginon MSI | Leginon MSI | |
| Acquisition mode | Counting | Counting | Super Resolution | |
| Magnification (×) | 135,000 | 105,000 | 105,000 | |
| Pixel size (Å) | 1.040 | 1.073 | 0.548 (1.096) | |
| Calibrated pixel (Å) | 1.045 | 1.067 | 1.085 | |
| Defocus range (µm) | 0.8–9.2 | 0.8–3.2 | 0.8–2.5 | |
| Frames/movie | 40 | 50 | 50 | |
| Exposure time (s) | 1 | 10 | 10 | |
| Dose rate (e-/Å–2/s) | 40 | 6.72 | 6.53–7.00 | |
| Frame rate (s/frame) | 0.06 | 0.2 | 0.2 | |
| Electron dose (e- /Å–2) | 40.00 | 67.19 | 65.31–70.00 | |
| Data Processing | ||||
| Useable micrographs | 1,422 | 3,574 | 9,401 | |
| Particles picked/sorted | 159,068 | 301,208 | 934,291 | |
| Particles after 2D | 120,986 | 289345 | 816,898 | |
| Particles after 3D | 85,795 | 180,555 | 393,664 | |
| Final particles | 22,034 | 35,193 | 34,369 | |
| Sharpening B-factor (Å2) | –110.3 | –20 | –20 | |
| Resolution (Å) | 4.1 | 3.6 | 3.2 | |
Key resources table
| Reagent type (species) or resource | Designation | Source or reference | Identifiers | Additional information |
|---|---|---|---|---|
| Cell line (Homo sapiens) | HCT116 | ATCC | Cat#CCL-247 | |
| Cell line (Homo sapiens) | HEK293T | ATCC | Cat#CRL-3216 | Adherent cells |
| Cell line (Homo sapiens) | Jurkat cells | ATCC | Cat#TIB-152 | |
| Genetic reagent (Homo sapiens) | HCT116 cells expressing Flag-eEF1A1(WT)-P2A-mCherry | Carelli et al., 2015; DOI:10.7554/eLife.10222 | Generated using a pHR lentiviral vector | |
| Genetic reagent (Homo sapiens) | HCT116 cells expressing Flag-eEF1A1(A399V)-P2A-mCherry | Carelli et al., 2015; DOI:10.7554/eLife.10222 | Generated using a pHR lentiviral vector | |
| Biological sample (Oryctolagus cuniculus) | Rabbit reticulocyte lysate (RRL) | Green Hectares | N/A | https://greenhectares.com |
| Recombinant DNA reagent (Homo sapiens) | 3×Flag-tagged KRas transcript | Shao et al., 2016; DOI:10.1016/j.cell.2016.10.046 | SP64-based plasmid purified PCR product 5–20 ng/ml | |
| Sequence-based reagent | MFF synthetic mRNA | Dharmacon/ Thermo Fisher Scientific Ferguson et al., 2015 | CAA CCU AAA ACU UAC ACA CCC UUA GAG GGA CAA UCG AUG UUC AAA GUC UUC AAA GUC AUC | |
| Sequence-based reagent | DNA oligo A | Dharmacon/ Thermo Fisher Scientific Ferguson et al., 2015 | AAA AAA AAA AAA AAA AAA AAA AAA AAA AAA | |
| Sequence-based reagent | DNA oligo B | Dharmacon/ Thermo Fisher Scientific Ferguson et al., 2015 | GTA AGT TTT AGG TTG CCC CCC TTT TTT TTT TTT TTT TTT TTT TTT TTT TTT 3’-Biotin-TEG | |
| Peptide, recombinant protein | 3×Flag peptide | Sigma-Aldrich | Cat#SAE0194 | |
| Peptide, recombinant protein | Creatine kinase | Roche/ Sigma-Aldrich | Cat#10127566001 | 40 mg/ml |
| Peptide, recombinant protein | Myokinase | Sigma-Aldrich | Cat#M5520 | |
| Peptide, recombinant protein | Pyruvate Kinase | Sigma-Aldrich | Cat#P9136 | |
| Antibody | Anti-EF1α, CBP-KK1 | MilliporeSigma | Cat#05–235 | Purified mouse monoclonal IgG1κ |
| Chemical compound, drug | 3,4-Dihydroxybenzoic acid (PCA) | Sigma-Aldrich | Cat#37580 | |
| Chemical compound, drug | 4-nitrobenzyl alcohol (NBA) | Sigma-Aldrich | Cat#N12821 | |
| Chemical compound, drug | CF405M-azide | Biotium | Cat#92092 | |
| Chemical compound, drug | Creatine phosphate | Roche/ Sigma-Aldrich | Cat#10621714001 | 12 mM |
| Chemical compound, drug | Cycloheximide (CHX) | MP Biomedicals/ Thermo Fisher Scientific | Cat#MP219452701 | |
| Chemical compound, drug | Cyclooctatetraene (COT) | Sigma-Aldrich | Cat#138924 | |
| Chemical compound, drug | Didemnin B | NCI/DTP | CAS 77327-05-0 | |
| Chemical compound, drug | EasyTag L-[35S]-methionine | Perkin Elmer | Cat#NEG709A500UC | 0.5 mCi |
| Chemical compound, drug | L-homopropargyl glycine | Kerafast | Cat# FCC438 | |
| Chemical compound, drug | Mammalian Protease Arrest protease inhibitor | G-Biosciences | Cat#786–331 | |
| Chemical compound, drug | Phosphoenolpyruvate (PEP) | Sigma-Aldrich | Cat#P7127 | |
| Chemical compound, drug | Protocatechuate 3,4- dioxygenase (PCD) | Sigma-Aldrich | Cat#P8279-25UN | |
| Chemical compound, drug | Puromycin (dihydrochloride) | Sigma-Aldrich | Cat#58-58-2 | |
| Chemical compound, drug | RNasin Plus | Promega | Cat#N2611 | |
| Chemical compound, drug | Ternatin-4 | Carelli et al., 2015; DOI:10.7554/eLife.10222 | ||
| Chemical compound, drug | Trolox | Sigma-Aldrich | Cat#238813 | |
| Commercial assay or kit | Annexin V-FITC | BD Pharmingen | Cat#556420 | |
| Commercial assay or kit | Anti-FLAG M2 magnetic beads | Sigma-Aldrich | Cat#A2220 | |
| Commercial assay or kit | MycoAlert Mycoplasma Detection Kit | Lonza | Cat# LT07-701 | |
| Commercial assay or kit | Propidium iodide | BD Pharmingen | Cat#556463 | |
| Commercial assay or kit | Zombie Red | BioLegend | Cat#423109 | |
| Software, algorithm | FlowJo | Tree Star | N/A | https://www.flowjo.com/solutions/flowjo |
| Software, algorithm | CTFFIND4 | Rohou and Grigorieff, 2015; DOI:10.1016/j.jsb.2015.08.008 | http://grigoriefflab.janelia.org/ctffind4 | |
| Software, algorithm | Leginon | Suloway et al., 2005; DOI:10.1016/j.jsb.2005.03.010 | http://leginon.org | |
| Software, algorithm | MotionCorr | Li et al., 2013; DOI:10.1038/nmeth.2472 | ||
| Software, algorithm | RELION | Kimanius et al., 2016; DOI:10.7554/eLife.18722 DOI:10.1042/BCJ20210708 | version 2.0 version 4.0 | |
| Software, algorithm | SPARTAN | Juette et al., 2016; DOI:10.1038/nmeth.3769 | version 3.3.0 http://scottcblanchardlab.com/software | |
| Software, algorithm | UCSF Chimera | Pettersen et al., 2004; DOI:10.1002/jcc.20084 | ||
| Software, algorithm | UCSF ChimeraX | Pettersen et al., 2021; DOI:10.1002/pro.3943 |
Additional files
Download links
A two-part list of links to download the article, or parts of the article, in various formats.
Downloads (link to download the article as PDF)
Open citations (links to open the citations from this article in various online reference manager services)
Cite this article (links to download the citations from this article in formats compatible with various reference manager tools)
Didemnin B and ternatin-4 differentially inhibit conformational changes in eEF1A required for aminoacyl-tRNA accommodation into mammalian ribosomes
eLife 11:e81608.
https://doi.org/10.7554/eLife.81608


