Inhibition of noradrenergic signalling in rodent orbitofrontal cortex impairs the updating of goal-directed actions
- CNRS, University of Bordeaux, France
- Institut de Génétique Moléculaire de Montpellier, CNRS, University of Montpellier, France
Figures
Figure 1 with 3 supplements
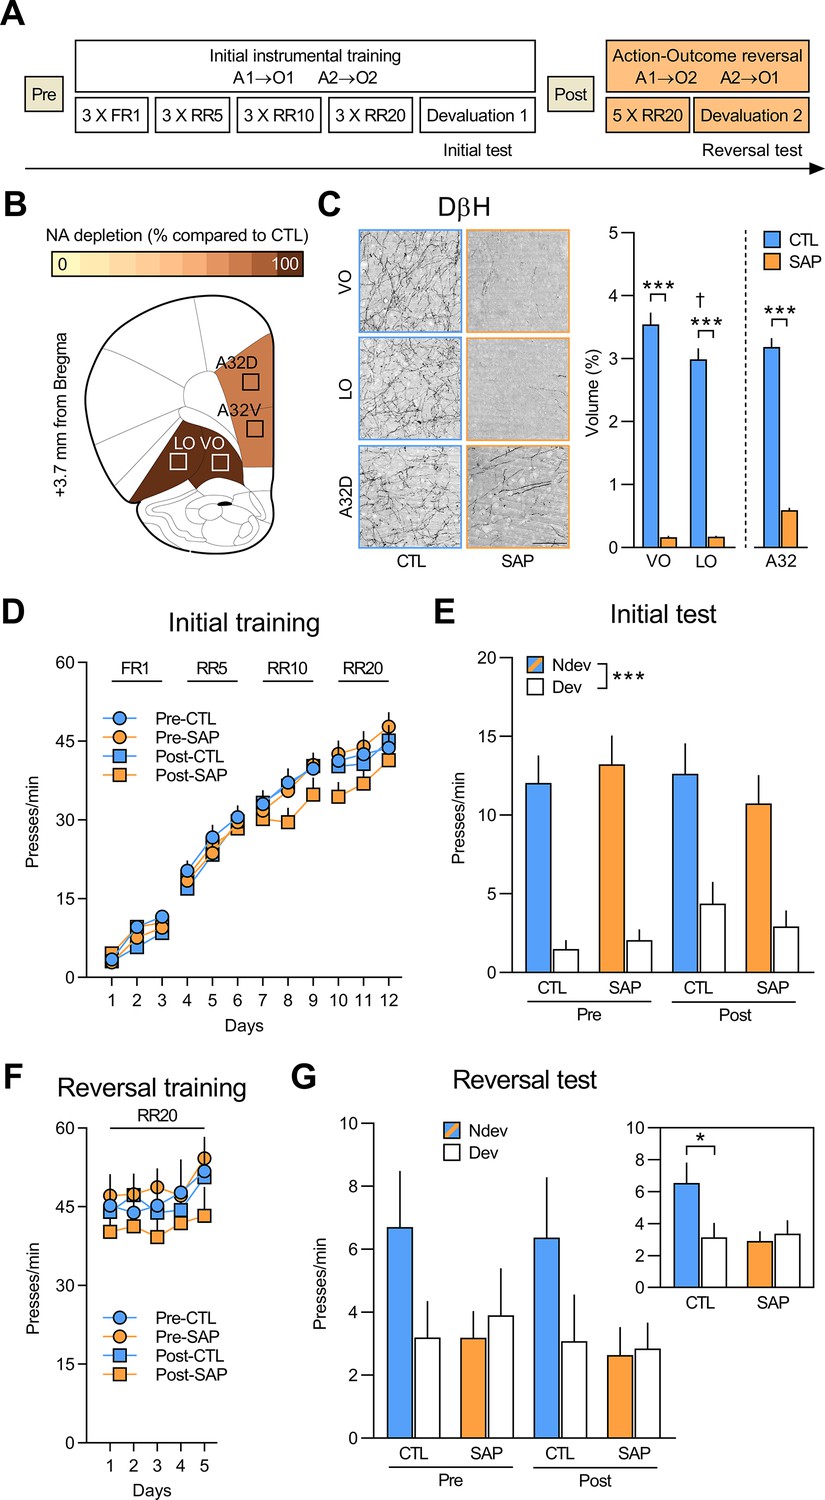
Initial goal-directed learning does not require NA signalling in the OFC.
(A) Experimental timeline for rats injected with anti-DβH saporin (SAP) or the inactive control (CTL) toxin before (Pre) and after (Post) initial instrumental training and outcome devaluation (Pre-CTL n=14, Pre-SAP n=15, Post-CTL n=13, Post-SAP n=15). (B) Regions where dopamine beta hydroxylase (DβH)-positive fibres were quantified (Area 32 dorsal: A32d; Area 32 ventral: A32v; ventral orbitofrontal cortex: VO; lateral orbitofrontal cortex: LO); schematics adapted from Figure 9 of The Rat Brain in Stereotaxic Coordinates (Paxinos and Watson, 2014). (C) Representative photomicrographs of noradrenergic (NA) depletion and DβH fibres volume (%) in VO (+3.7 mm from Bregma), LO (+3.0 mm from Bregma), and A32d (+4.4 mm from Bregma) following toxin injection. (D) Rate of lever pressing across initial training (A1–O1; A2–O2), collapsed across the two actions. (E) Initial instrumental test in extinction following satiety-induced devaluation (Ndev: non-devalued; Dev: devalued). (F) Rate of lever pressing across reversal training (A1–O2; A2–O1), collapsed across the two actions. (G) Reversal instrumental test in extinction following satiety-induced devaluation. The inlet shows data grouped for CTL (Pre and Post) and SAP groups (Pre and Post). Data are presented as mean + SEM. *p<0.05, ***p<0.001, ✝p<0.05 LO vs. VO CTL group. Scale bars: 100 μm. A1: action 1; A2: action 2; O1: outcome 1; O2: outcome 2; FR1: fixed ratio 1; RR: random ratio. Data provided in Figure 1—source data 1.
-
Figure 1—source data 1
Source files for the quantification of dopamine beta hydroxylase (DβH)-positive fibres (ventral orbitofrontal cortex [VO], lateral orbitofrontal cortex [LO], and Area 32 [A32]) and behavioural data for rats injected with saporin and inactive saporin.
This excel file contains the raw data from the quantification of DβH-positive fibres in the VO, LO, and Area 32 dorsal (A32d) and ventral (A32v). Behavioural data from initial and reversal phases are also supplied.
- https://cdn.elifesciences.org/articles/81623/elife-81623-fig1-data1-v2.xlsx
Figure 1—figure supplement 1
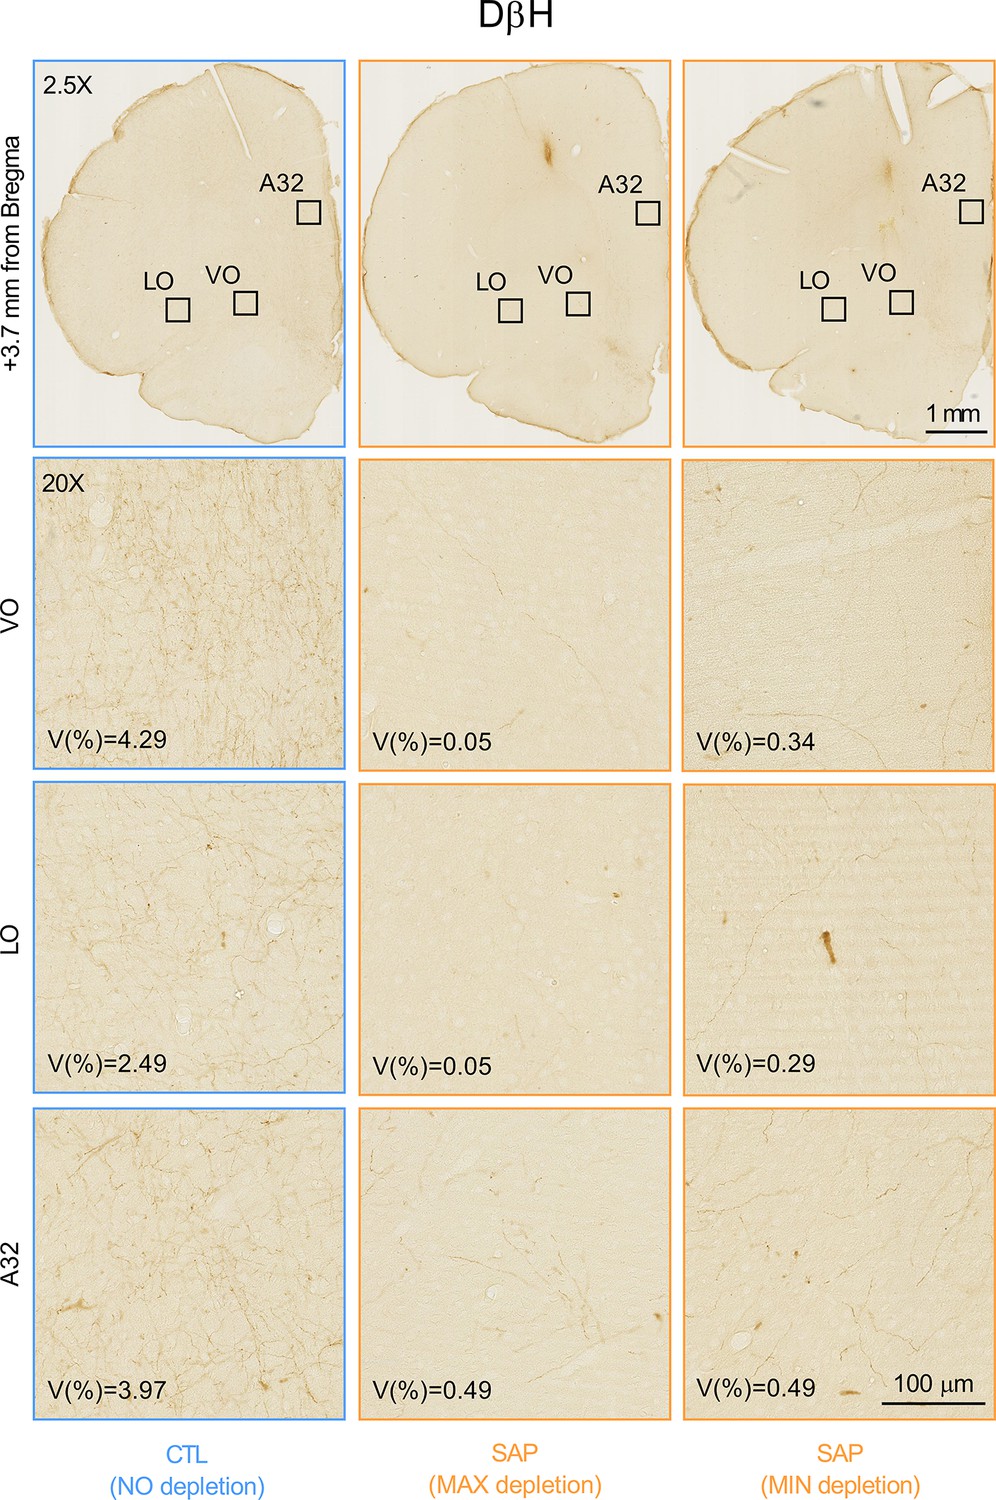
Whole-brain (2.5×) and zoomed-in (20×) photomicrographs showing the volume of dopamine beta hydroxylase (DβH)-positive fibres (%) in the ventral orbitofrontal cortex (VO), lateral orbitofrontal cortex (LO), and Area 32 (A32) of a representative control (CTL) animal and of two saporin (SAP)-treated rats, one with the maximum (MAX) depletion and one with the minimum (MIN) depletion.
Figure 1—figure supplement 2

Quantification of dopamine beta hydroxylase (DβH)-positive fibres in other prefrontal cortex regions.
(A) Regions where dopamine beta hydroxylase (DβH)-positive fibres were quantified (medial orbitofrontal [MO], secondary motor cortex [M2], insula); schematics adapted from of The Rat Brain in Stereotaxic Coordinates (Paxinos and Watson, 2014). (B) DβH fibres volume (%) for control (CTL) and saporin (SAP) groups. Data are presented as mean + SEM. ***p<0.001. Statistics are reported in the Results section of the main text. Data provided in Figure 1—figure supplement 2—source data 1. (C) Whole-brain (2.5×) and zoomed-in (20×) photomicrographs showing DβH fibres volume in the MO, M2, and insula of a representative CTL animal and of two SAP-treated rats, one with the maximum (MAX) depletion and one with the minimum (MIN) depletion. Scale bar: 100 μm.
-
Figure 1—figure supplement 2—source data 1
Source files for the quantification of dopamine beta hydroxylase (DβH)-positive fibres (medial orbitofrontal cortex [MO], secondary motor cortex [M2], and insula) for rats injected with saporin and inactive saporin.
This excel file contains the raw data from the quantification of DβH-positive fibres in MO, M2, and insular cortex.
- https://cdn.elifesciences.org/articles/81623/elife-81623-fig1-figsupp2-data1-v2.xlsx
Figure 1—figure supplement 3
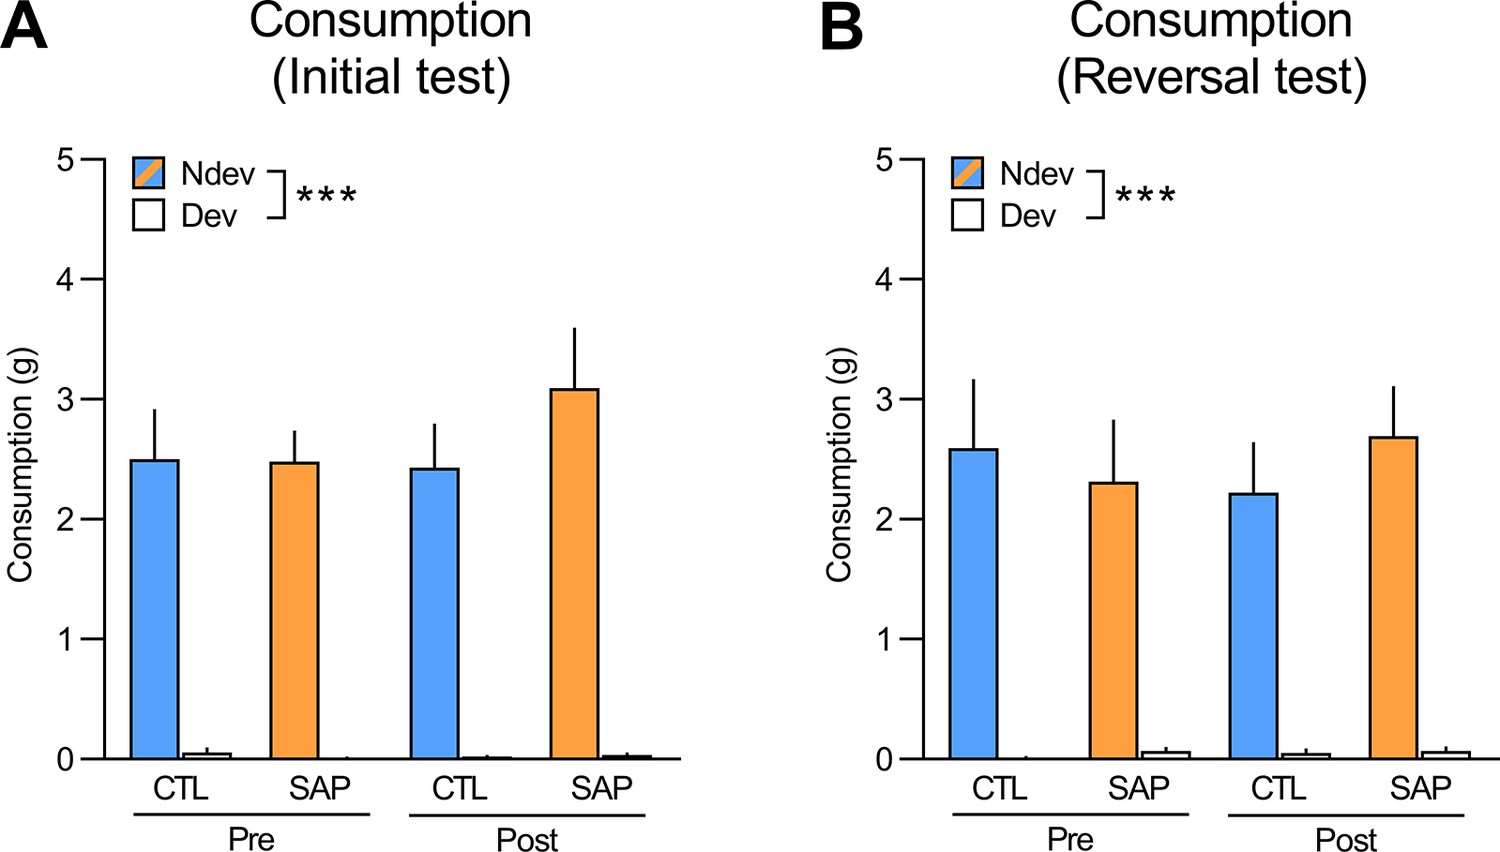
Consumption tests performed immediately after the initial (A) and reversal (B) instrumental tests (Ndev: non-devalued; Dev: devalued).
Rats were given access to both food rewards (10 g each) for 10 min. Statistics revealed a within-subjects effect of devaluation for both the initial (F(1,53) = 168.94, p<0.001) and reversal tests (F(1,53) = 97.25, p<0.001) and no main effects of group, treatment, or interactions between these factors (largest F(1,53) value = 0.84, p=0.36). Data are presented as mean + SEM. ***p<0.001. CTL: control; SAP: saporin. Data provided in Figure 1—figure supplement 3—source data 1.
-
Figure 1—figure supplement 3—source data 1
Source files for the consumption tests for rats injected with saporin and inactive saporin.
This excel file contains the raw data from the consumption tests conducted after the initial outcome devaluation test and the reversal outcome devaluation test.
- https://cdn.elifesciences.org/articles/81623/elife-81623-fig1-figsupp3-data1-v2.xlsx
Figure 2 with 2 supplements

Regions where tyrosine hydroxylase (TH, panel A) and dopamine beta hydroxylase (DβH, panel C) positive fibres were quantified (Area 32 dorsal: A32d; Area 32 ventral: A32v; ventral orbitofrontal cortex: VO; lateral orbitofrontal cortex: LO); schematic adapted from Figure 9 of The Rat Brain in Stereotaxic Coordinates (Paxinos and Watson, 2014).
Representative photomicrographs and quantification of fibres in VO, LO, and A32d for TH (B) and DβH immunostaining (D) in each of the three groups. Data are presented as mean + SEM. **p<0.01, ***p<0.001, ✝p<0.05 vs. CTL group. Scale bars: 100 μm. 6-OHDA: 6-hydroxydopamine; 6-OHDA+Desi: 6-hydroxydopamine+desipramine; CTL: control. Data provided in Figure 2—source data 1.
-
Figure 2—source data 1
Source files for the quantification of tyrosine hydroxylase (TH)-positive and dopamine beta hydroxylase (DβH)-positive fibres (ventral orbitofrontal cortex [VO], lateral orbitofrontal cortex [LO], and Area 32 [A32]) for rats injected with 6-hydroxydopamine (6-OHDA) or 6-OHDA+desipramine.
This excel file contains the raw data from the quantification of TH- and DβH-positive fibres in the VO, LO, and A32.
- https://cdn.elifesciences.org/articles/81623/elife-81623-fig2-data1-v2.xlsx
Figure 2—figure supplement 1
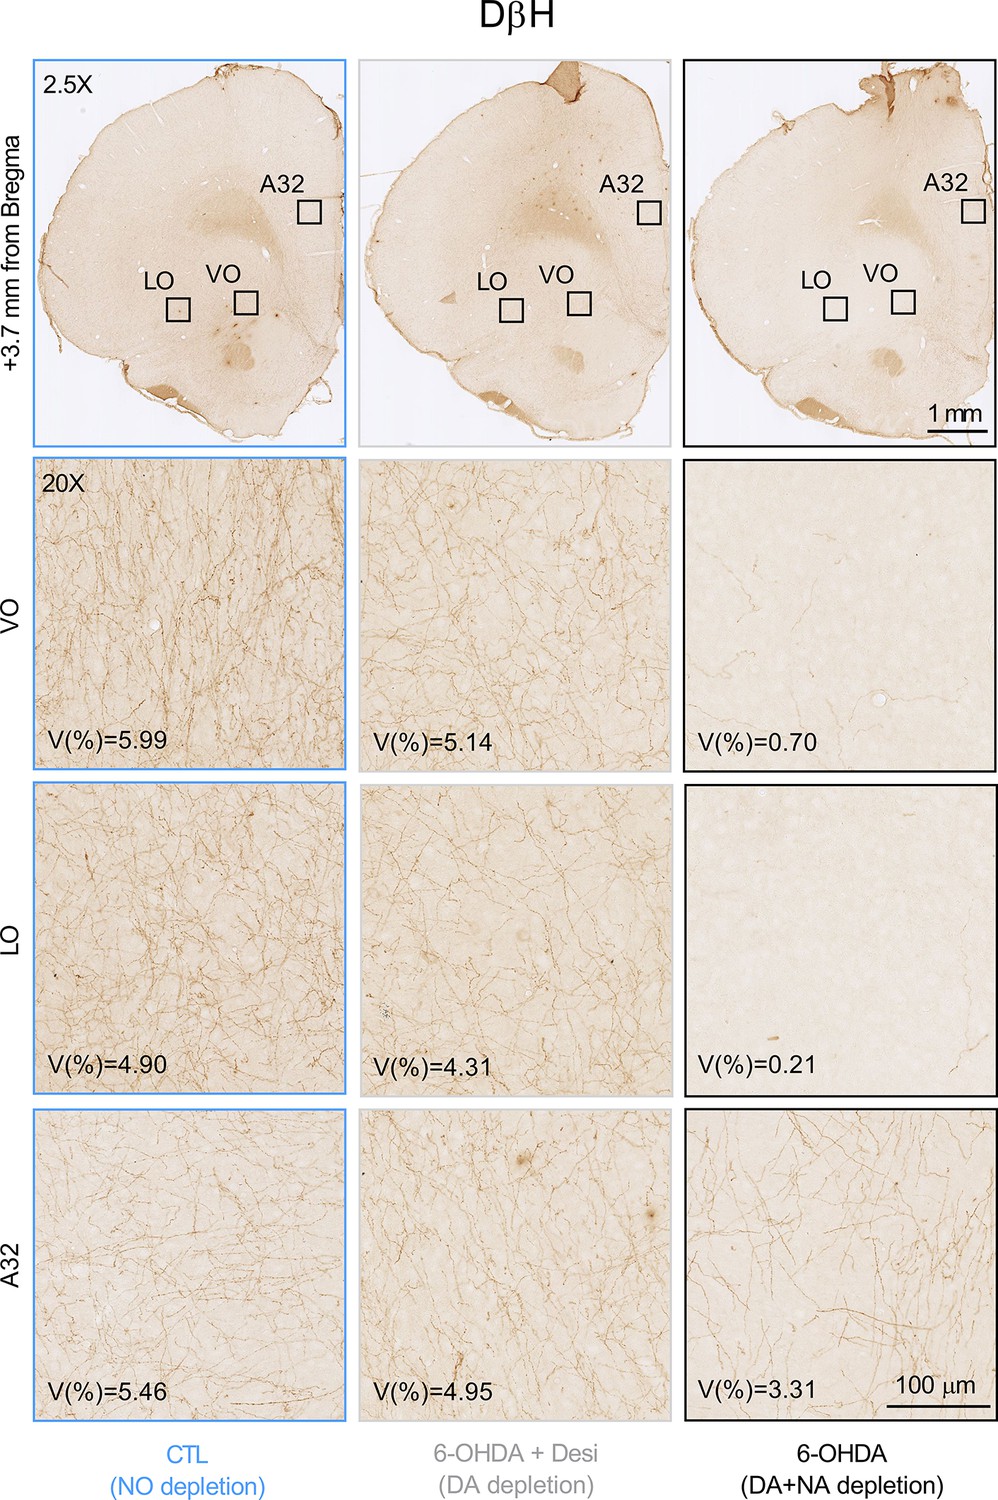
Whole-brain (2.5×) and zoomed-in (20×) photomicrographs showing the volume of dopamine beta hydroxylase (DβH)-positive fibres (%) in the ventral orbitofrontal cortex (VO), lateral orbitofrontal cortex (LO), and Area 32 (A32) of a representative control (CTL), 6-OHDA+desipramine (6-OHDA+Desi), and 6-OHDA animal.
Figure 2—figure supplement 2
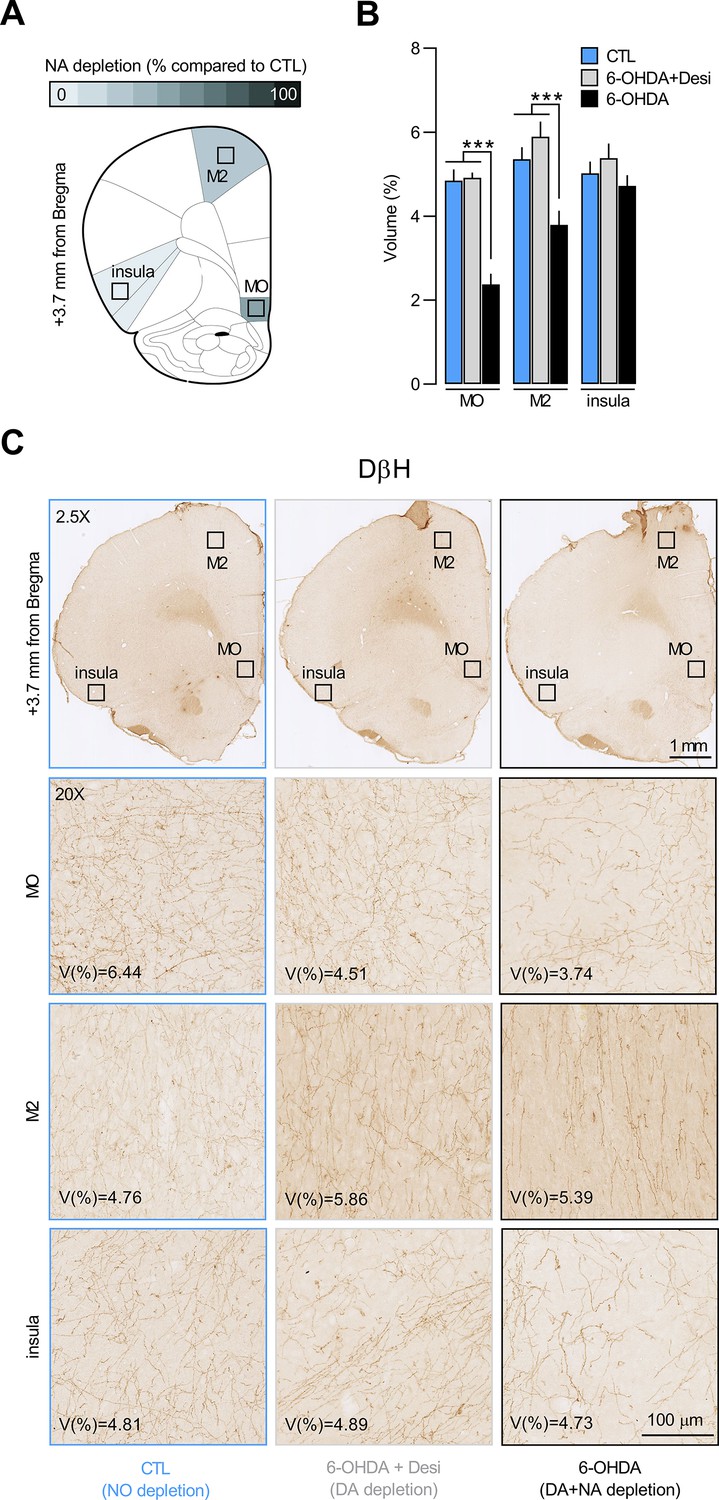
Quantification of dopamine beta hydroxylase (DβH)-positive fibres in other prefrontal cortex regions.
(A) Regions where dopamine beta hydroxylase (DβH)-positive fibres were quantified (medial orbitofrontal [MO], secondary motor cortex [M2], insula); schematics adapted from of The Rat Brain in Stereotaxic Coordinates (Paxinos and Watson, 2014). (B) DβH fibres volume (%) for control (CTL), 6-OHDA+desipramine (6-OHDA+Desi), and 6-OHDA groups. Data are presented as mean + SEM. ***p<0.001. Statistics are reported in the Results section of the main text. Data provided in Figure 2—figure supplement 2—source data 1. (C) Whole-brain (2.5×) and zoomed-in (20×) photomicrographs showing DβH fibres volume in the MO, M2, and insula of a representative CTL, 6-OHDA+Desi, and 6-OHDA animal.
-
Figure 2—figure supplement 2—source data 1
Source files for the quantification of tyrosine hydroxylase (TH)-positive and dopamine beta hydroxylase (DβH)-positive fibres (medial orbitofrontal cortex [MO], secondary motor cortex [M2], and insula) for rats injected with 6-hydroxydopamine (6-OHDA) or 6-OHDA+desipramine.
This excel file contains the raw data from the quantification of TH- and DβH-positive fibres in MO, M2, and insula cortex.
- https://cdn.elifesciences.org/articles/81623/elife-81623-fig2-figsupp2-data1-v2.xlsx
Figure 3 with 2 supplements
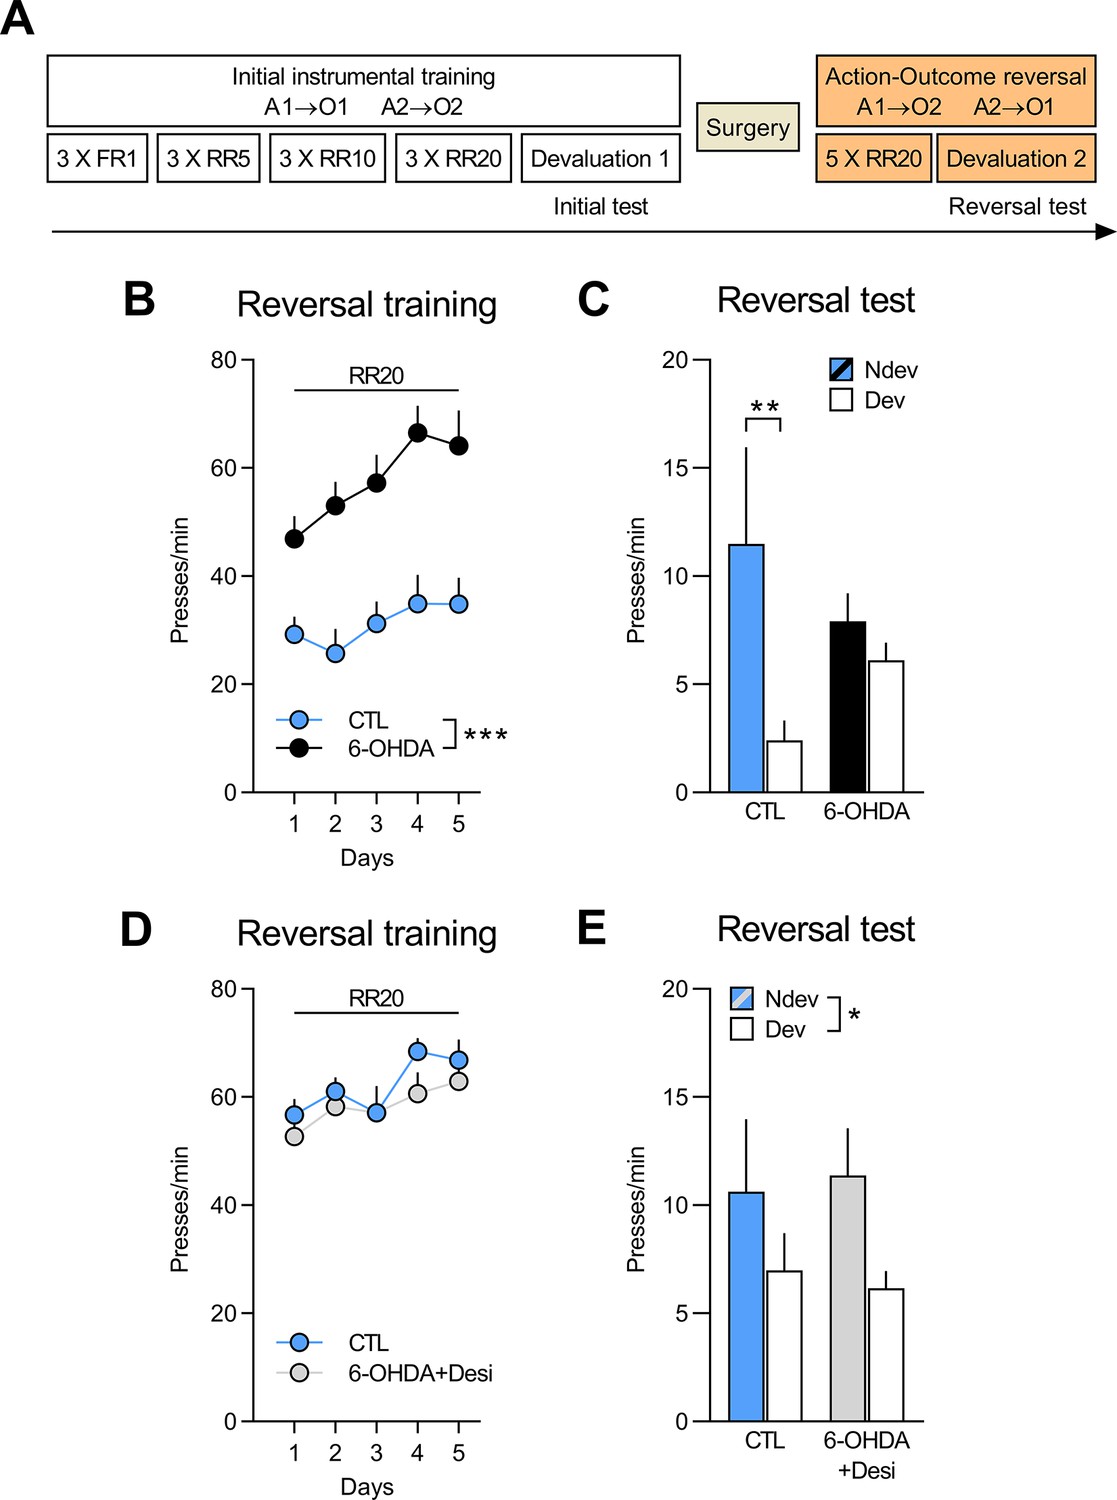
NA, but not DA, signalling in the OFC is required to adapt to changes in outcome identity.
(A) Experimental timeline. After the initial instrumental training and outcome devaluation testing, rats were injected in the orbitofrontal cortices (OFC) with either vehicle (CTL n=8; CTL n=8), 6-OHDA coupled with desipramine (to specifically target DA neurons, 6-OHDA+Desi n=9) or 6-OHDA alone (to target all catecholaminergic [CA] neurons, n=12). (B, D) Rate of lever pressing across reversal training, data is presented collapsed across the two actions. (C, E) Reversal instrumental test in extinction following satiety-induced devaluation (Ndev: non-devalued; Dev: devalued). Data are presented as mean + SEM. *p<0.05, **p<0.01, ***p<0.001. 6-OHDA: 6-hydroxydopamine; 6-OHDA+Desi: 6-hydroxydopamine+desipramine; CTL: control; A1: action 1; A2: action 2; O1: outcome 1; O2: outcome 2; FR1: fixed ratio 1; RR: random ratio. Data provided in Figure 3—source data 1.
-
Figure 3—source data 1
Source files for the behavioural data from the reversal phase for rats injected with 6-hydroxydopamine (6-OHDA) or 6-OHDA+desipramine.
This excel file contains the behavioural data from the reversal training and outcome devaluation test for rats injected with 6-OHDA or 6-OHDA+desipramine and their respective controls.
- https://cdn.elifesciences.org/articles/81623/elife-81623-fig3-data1-v2.xlsx
Figure 3—figure supplement 1
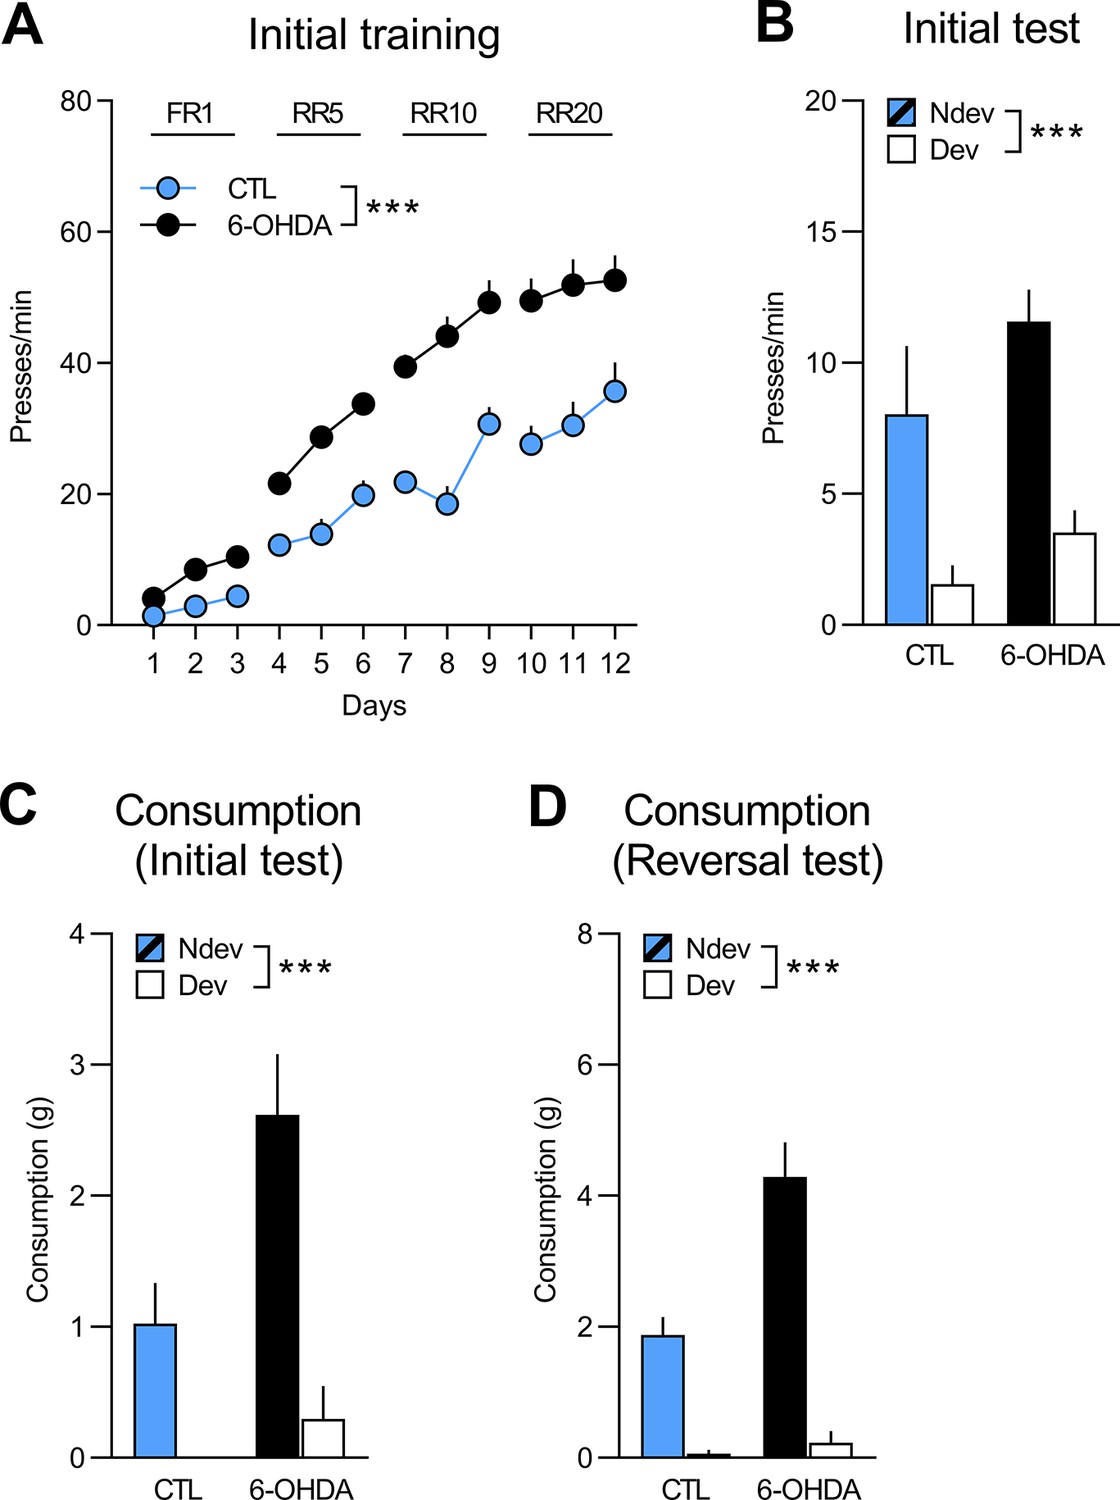
Initial training and test for rats to be injected with 6-OHDA (n=12) and control rats (CTL; n=8).
(A) Training data is presented collapsed across the two actions (A1–O1; A2–O2). There was a main effect of group (F(1,18) = 35.33, p<0.001), training day (F(1,18) = 190.66, p<0.001), and group × day interaction (F(1,18) = 8.8, p<0.01). Simple effects confirmed that responding increased in both the 6-OHDA and the control groups (F(1, 18)=175.85, p<0.001 and F(1,18) = 48.98, p<0.001, respectively). (B) Statistical analyses on the outcome devaluation test (Ndev: non-devalued; Dev: devalued) revealed an overall effect of devaluation (F(1,18) = 39.37, p<0.001), no effect of group (F(1,18) = 2.84, p=0.11), and no group × devaluation interaction (F(1,18) = 0.46, p=0.51). (C) During the initial consumption test, both groups consumed more of the non-devalued outcome, as indicated by a significant effect of devaluation (F(1,18) = 18.95, p<0.001) and group (F(1,18) = 9.3, p<0.01), but no group × devaluation interaction (F(1,18) = 2.81, p=0.11). (D) The results from the reversal consumption test revealed a significant main effect of devaluation (F(1,18) = 94.72, p<0.001), as well as a significant main effect of group (F(1,18) = 10.0, p<0.01) and a significant group × devaluation interaction (F(1,18) = 13.86, p<0.01), indicating that the difference between consumption of the non-devalued and the devalued food was actually greater for the 6-OHDA group (devalued mean = 0.23; non-devalued mean = 4.29) than for the control group (devalued mean = 0.06; non-devalued mean = 1.86). Nevertheless, simple effects analyses confirmed that both 6-OHDA and control groups consumed more of the non-devalued than the devalued food (F(1,18) = 15.05, p<0.01 and F(1,18) = 113.16, p<0.001, respectively). Data are presented as mean + SEM. ***p<0.001. A1: action 1; A2: action 2; O1: outcome 1; O2: outcome 2; FR1: fixed ratio 1; RR: random ratio. 6-OHDA: 6-hydroxydopamine. Data provided in Figure 3—figure supplement 1—source data 1.
-
Figure 3—figure supplement 1—source data 1
Source files for the behavioural data from the initial phase for rats injected with 6-hydroxydopamine (6-OHDA).
This excel file contains the behavioural data from the initial training, outcome devaluation test, and the consumption tests (initial and reversal) for rats injected with 6-OHDA and their respective controls.
- https://cdn.elifesciences.org/articles/81623/elife-81623-fig3-figsupp1-data1-v2.xlsx
Figure 3—figure supplement 2
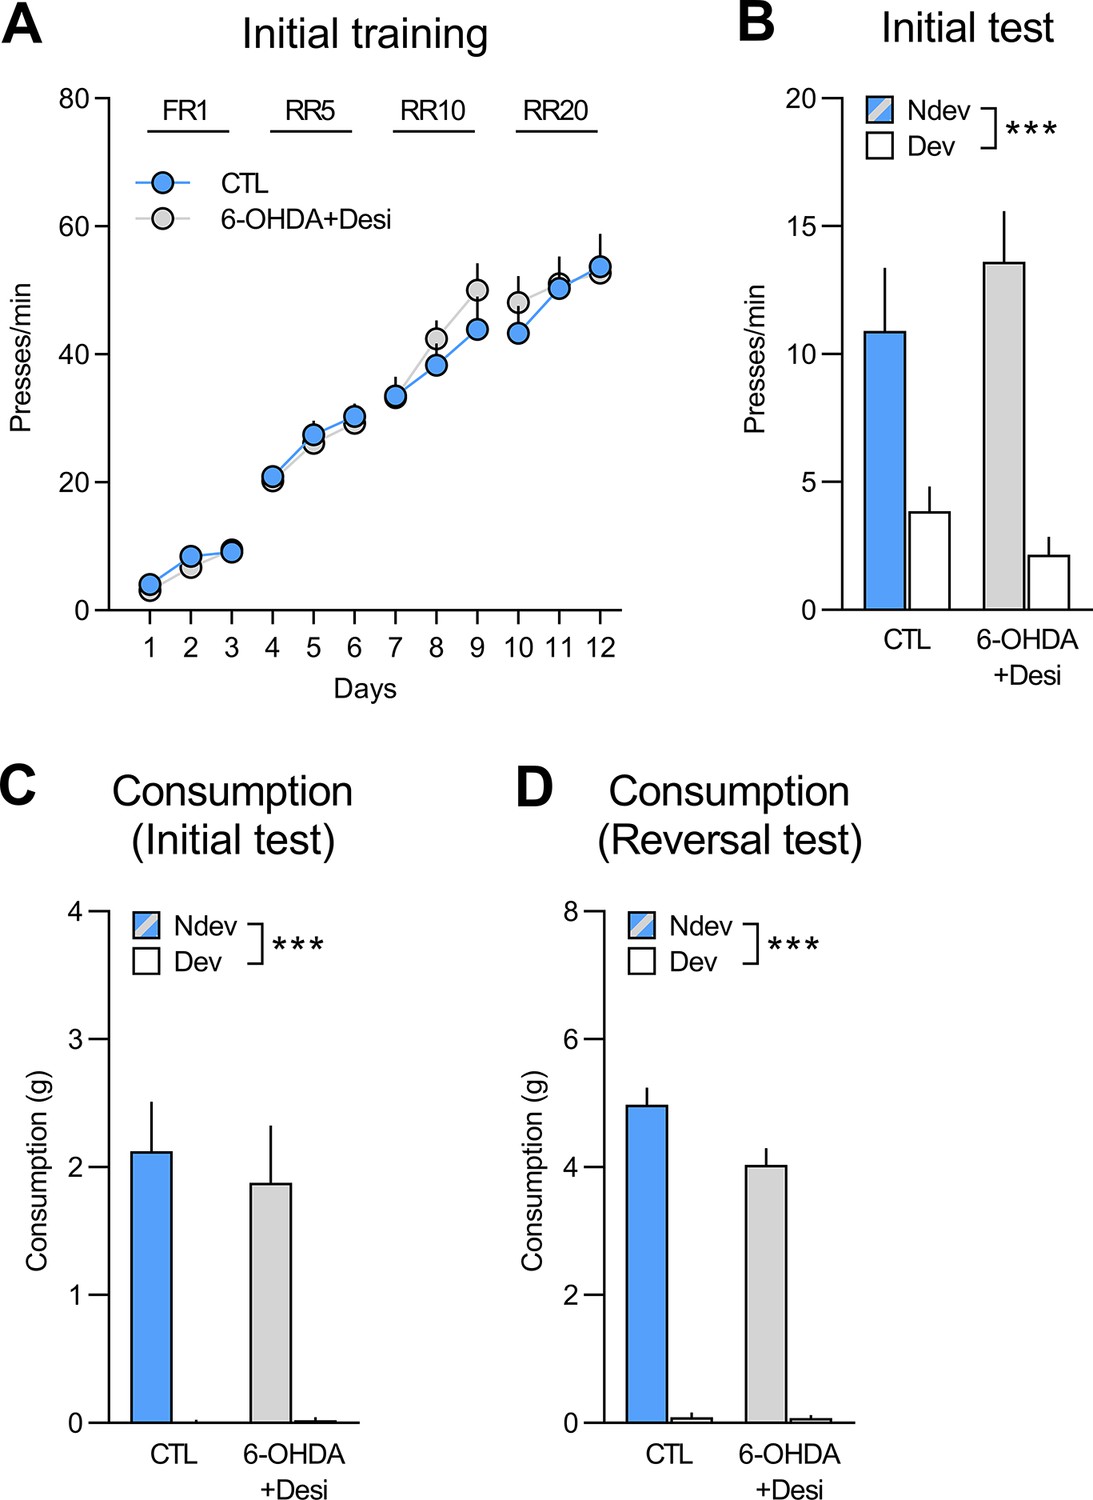
Initial training and test for rats to be injected with 6-OHDA+Desi (n=9) and control rats (CTL; n=8).
(A) Training data is presented collapsed across the two actions (A1–O1; A2–O2). There was a main effect of training day (F(1,15) = 220.45, p<0.001), but no effect of group (F(1,15) = 0.06, p=0.81) or group × day interaction (F(1,15) = 0.31, p=0.59). (B) Statistical analyses of the outcome devaluation test (Ndev: non-devalued; Dev: devalued) revealed an overall effect of devaluation (F(1,15) = 44.36, p<0.001), no effect of group (F(1,15) = 0.07, p=0.79), and no group × devaluation interaction (F(1,15) = 2.5, p=0.13). (C) During the initial consumption test, both groups consumed more of the non-devalued outcome as indicated by a significant effect of devaluation (F(1,15)=45.57, p<0.001), but no effect of group (F(1,15) = 0.15, p=0.70) or group × devaluation interaction (F(1,15) = 0.19, p=0.67). (D) During the reversal consumption test both groups also consumed more of the non-devalued food (F(1,15) = 466.43, p<0.001). Data are presented as mean + SEM. ***p<0.001. A1: action 1; A2: action 2; O1: outcome 1; O2: outcome 2; FR1: fixed ratio 1; RR: random ratio; 6-OHDA+Desi: 6-hydroxydopamine+desipramine. Data provided in Figure 3—figure supplement 2—source data 1.
-
Figure 3—figure supplement 2—source data 1
Source files for the behavioural data from the initial phase for rats injected with 6-hydroxydopamine (6-OHDA)+desipramine.
This excel file contains the behavioural data from the initial training, outcome devaluation test, and the consumption tests (initial and reversal) for rats injected with 6-OHDA+desipramine and their respective controls.
- https://cdn.elifesciences.org/articles/81623/elife-81623-fig3-figsupp2-data1-v2.xlsx
Figure 4 with 1 supplement
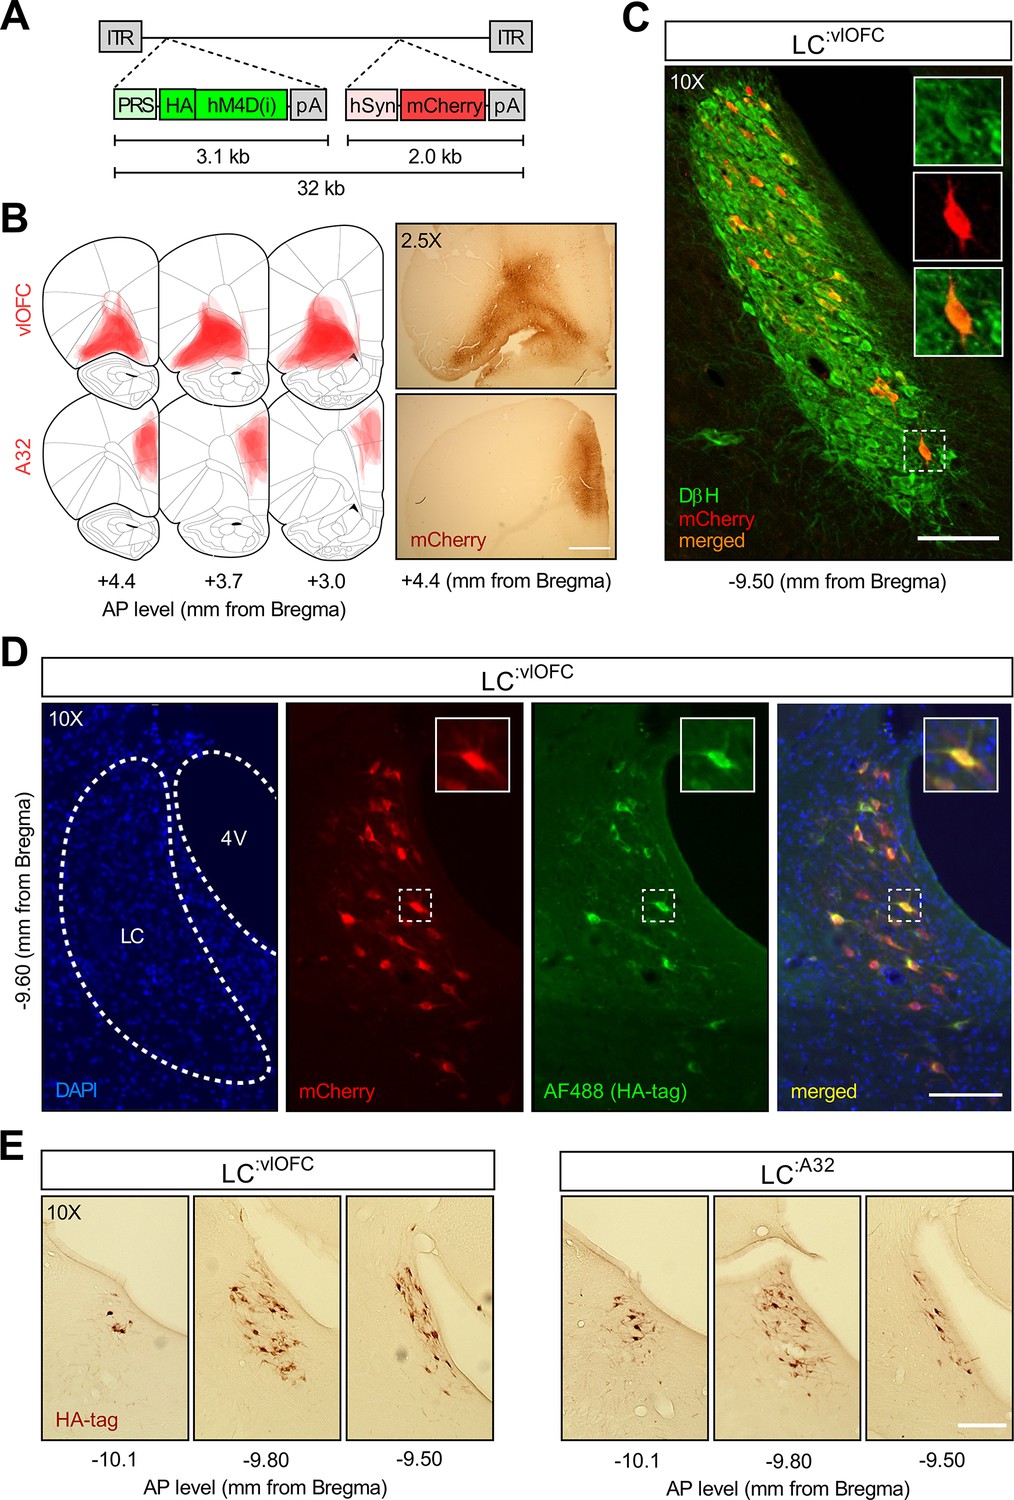
Histological examination following CAV2-PRS-hM4Di-mCherry injections.Validation of the CAV2-PRS-hM4Di-mCherry construct.
(A) CAV2-PRS-hM4Di-mCherry, a vector bearing a noradrenergic (NA)-specific promoter (PRS) that drives the expression of inhibitory DREADDs tagged with HA (hM4Di), and an mCherry expression cassette under the neuronal-specific promoter hSyn. (B) Extent of viral expression across subjects and representative whole-brain photomicrographs (2.5×) showing injection sites stained for mCherry. Schematics adapted from Figures 8, 9 and 11 of The Rat Brain in Stereotaxic Coordinates (Paxinos and Watson, 2014). (C) Immunofluorescent staining for dopamine beta hydroxylase (DβH) and mCherry in the locus coeruleus (LC) of a representative rat injected with CAV2-PRS-hM4Di-mCherry in the orbitofrontal cortices (OFC). (D) High colocalization of immunofluorescent staining for HA (tag of inhibitory DREADDs) and mCherry in the LC of the same representative rat injected in the OFC. (D) Comparison of antero-posterior DAB staining for HA in two representative rats, one injected in the OFC, the other in A32. Scale bar panel B: 1 mm. Scale bars panels C, D, E: 100 μm.
Figure 4—figure supplement 1
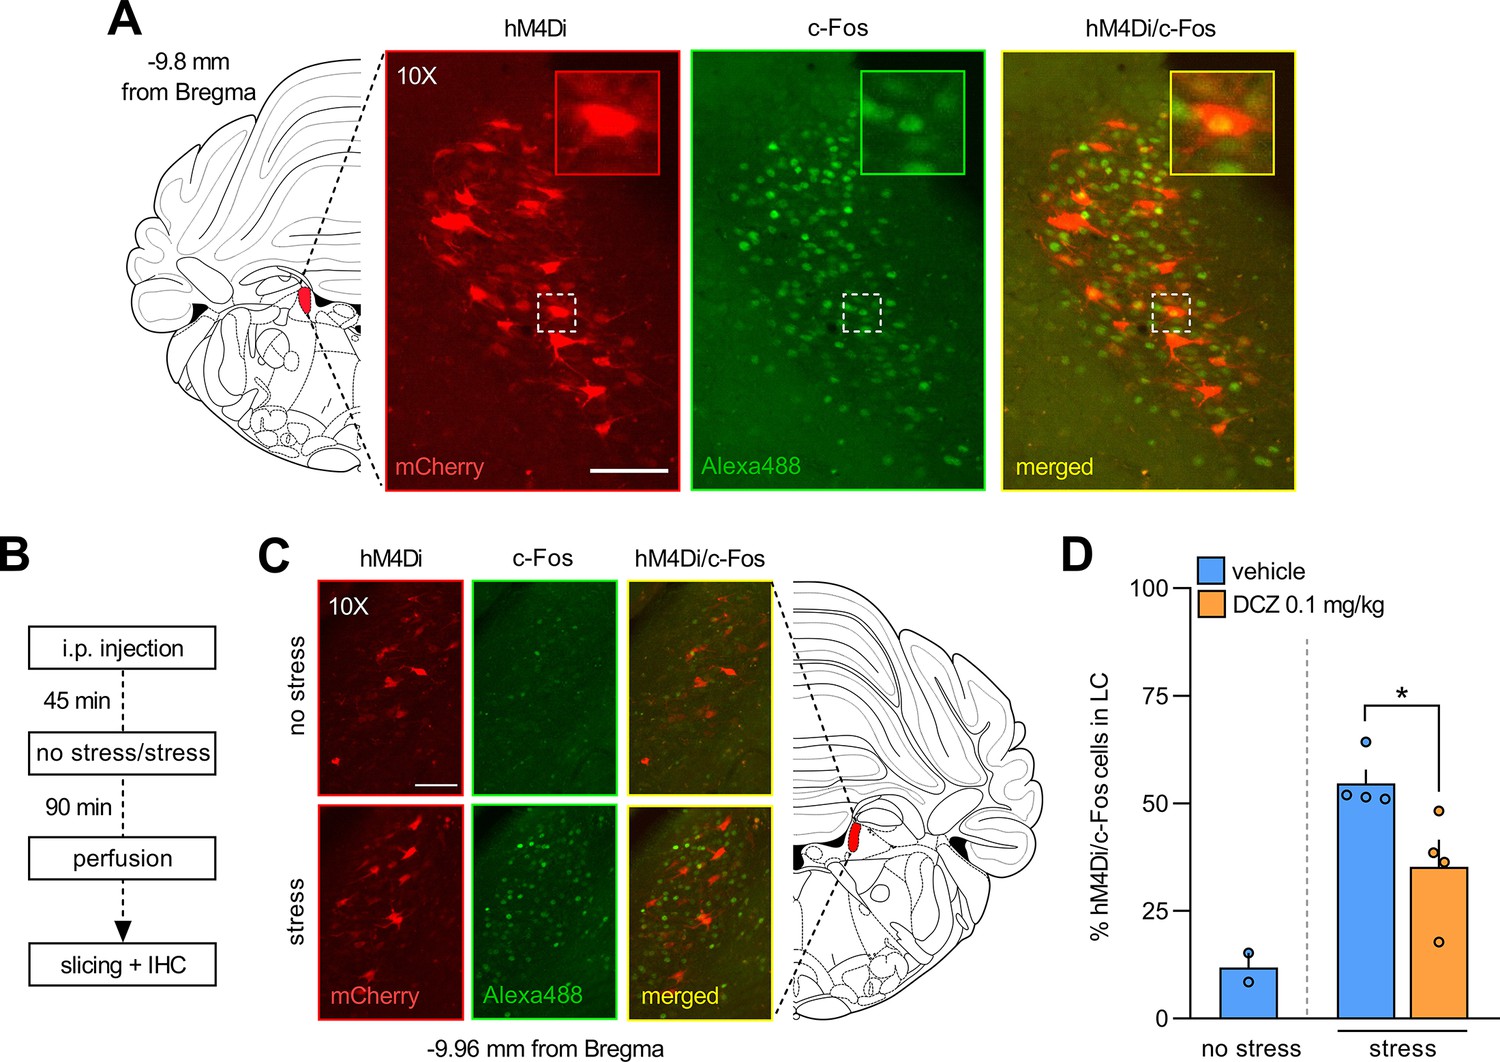
Validation of the CAV2-PRS-hM4Di-mCherry construct.
(A) Representative image showing locus coeruleus (LC) cells projecting to A32 and expressing inhibitory DREADDs (hM4Di, mCherry) and LC cells activated by stress (c-Fos, Alexa 488). The magnification shows an LC cell body that co-expresses inhibitory DREADDs and c-Fos. (B) Experimental design. (C) Representative images showing c-Fos activation in the LC following stress. (D) Quantification of the percentage of LC hM4Di-positive cells that co-express c-Fos. As expected, the stress procedure resulted in a fivefold increase in c-Fos expression in the LC. Most importantly, DCZ significantly decreased the percentage of hM4Di/c-Fos-positive cells following stress (≈35% decrease), as revealed by a significant Student’s t-test (p=0.034). Data are presented as mean + SEM. *p<0.05. Scale bars = 50 μm. Data provided in Figure 4—figure supplement 1—source data 1.
-
Figure 4—figure supplement 1—source data 1
Source file for the quantification of locus coeruleus (LC) hM4Di/C-Fos-positive cells.
This excel file contains the data from the quantification of hM4Di/c-Fos-positive cells, as well as the percentages of colocalization, for rats injected with CAV2-PRS-hM4Di-mCherry in Area 32 (A32) that underwent the stress procedure.
- https://cdn.elifesciences.org/articles/81623/elife-81623-fig4-figsupp1-data1-v2.xlsx
Figure 5 with 2 supplements
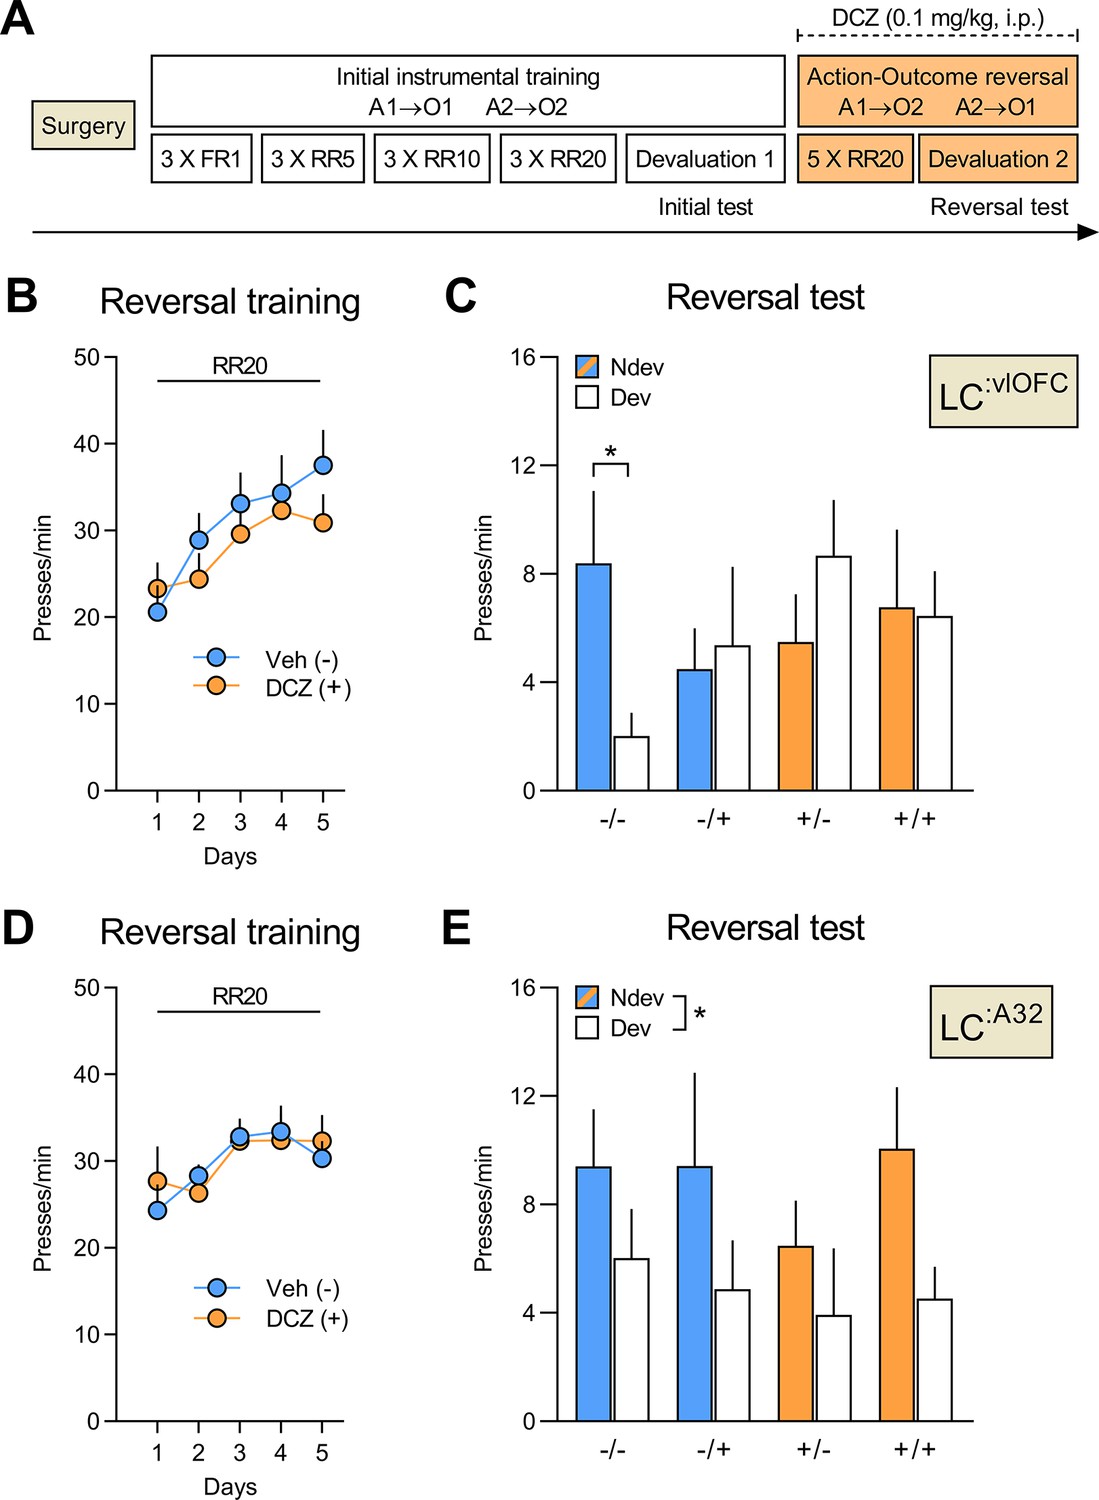
Silencing of LC:vlOFC, but not LC:A32, projections impairs adaptation to changes in the A-O association.
(A) Timeline for rats injected with CAV2-PRS-hM4Di-mCherry in either the orbitofrontal cortices (OFC) or Area 32 (A32). Each rat was injected with either vehicle (-) or DCZ (+) during the reversal training and then tested twice, once under DCZ and once under vehicle, with the test order counterbalanced. (B) Reversal training in rats injected in the OFC (Veh n=12; DCZ n=13), data is presented collapsed across the two actions. (C) Reversal instrumental test following satiety-induced devaluation in rats injected in the OFC (Ndev: Non-devalued; Dev: devalued). (D) Reversal training in rats injected in A32 (Veh n=8; DCZ n=9), data is presented collapsed across the two actions. (E) Reversal instrumental test following satiety-induced devaluation in rats injected in A32. Data are presented as mean + SEM. *p<0.05. A1: action 1; A2: action 2; O1: outcome 1; O2: outcome 2; FR1: fixed ratio 1; RR: random ratio; DCZ: deschloroclozapine; LC: locus coeruleus. Data provided in Figure 5—source data 1.
-
Figure 5—source data 1
Source file for the behavioural data from the reversal phase for LC:vlOFC and LC:A32 rats.
This excel file contains the behavioural data from the reversal training and outcome devaluation tests for rats injected with CAV2-PRS-hM4Di-mCherry in the OFC (vlOFC) or Area 32 (A32).
- https://cdn.elifesciences.org/articles/81623/elife-81623-fig5-data1-v2.xlsx
Figure 5—figure supplement 1

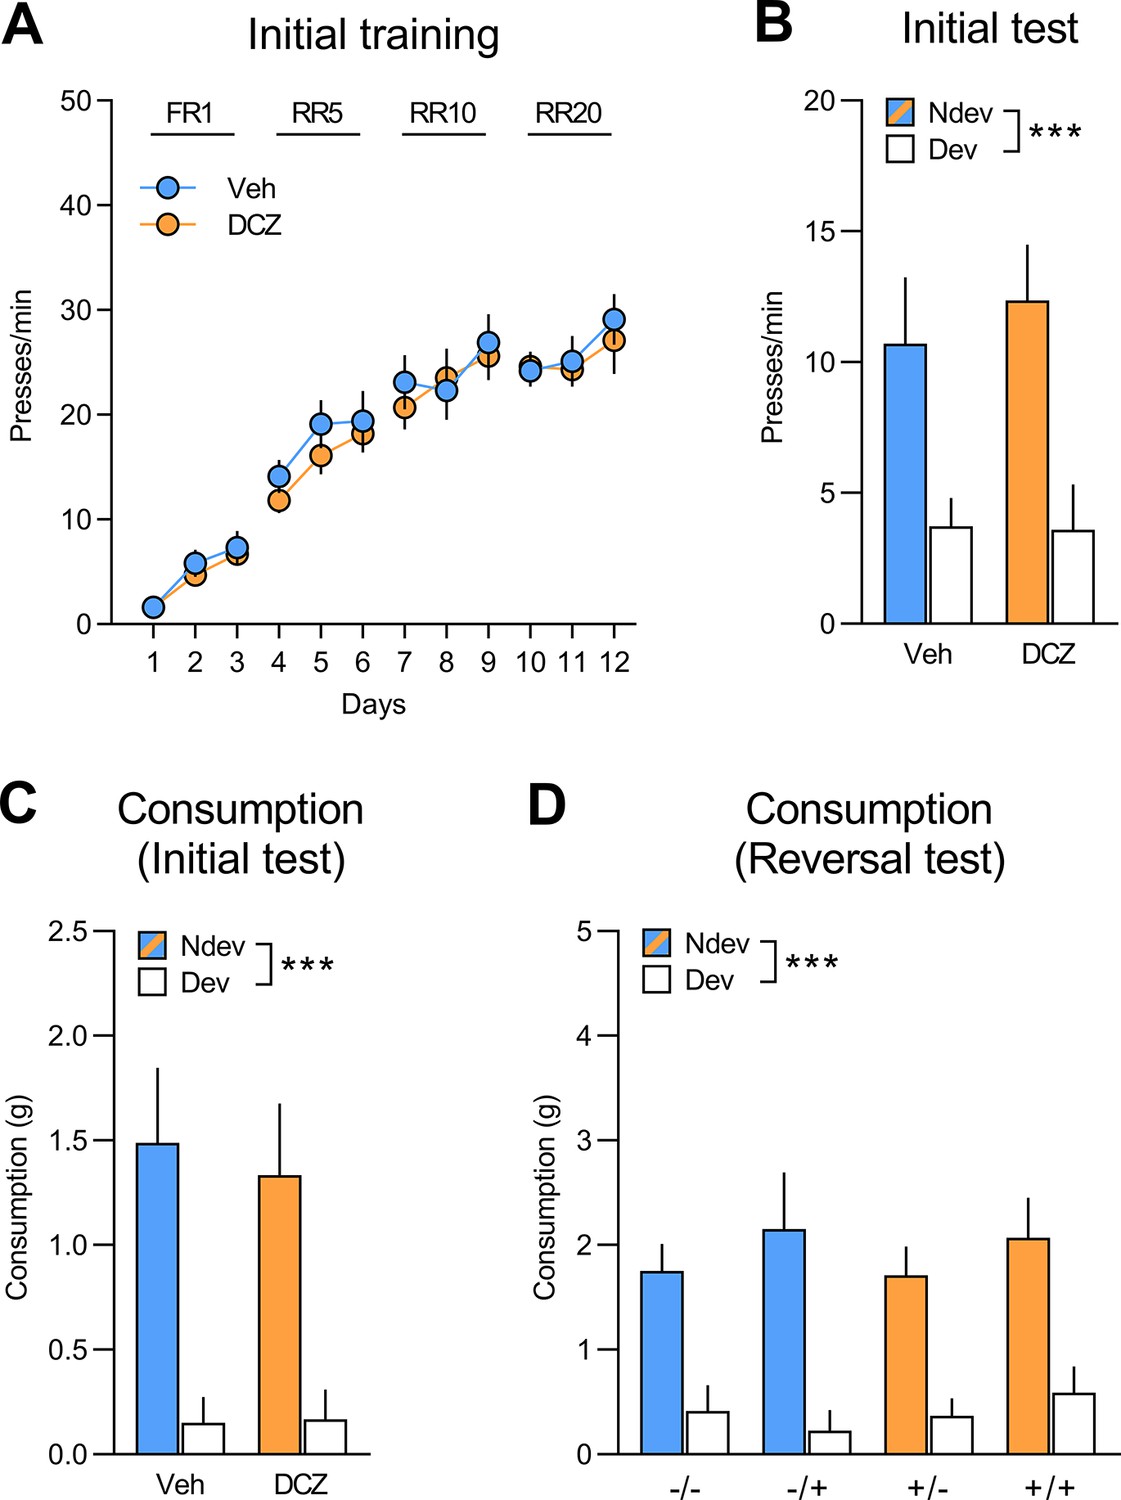
Initial training and test for rats injected with CAV2-PRS-hM4Di-mCherry in the orbitofrontal cortex (OFC).
(A) Initial training for rats injected with CAV2-PRS-hM4Di-mCherry in the orbitofrontal cortex (OFC) that would be allocated to group vehicle (Veh; n=12) and group deschloroclozapine (DCZ; n=13) for the subsequent reversal training, data is presented collapsed across the two actions. Both groups increased instrumental responding across training days (F(1,23) = 236.06, p<0.001) and there was no difference between groups (F(1,23) = 0.53, p=0.47) or interaction between group and day (F(1,23) = 0.45, p=0.51). (B) Initial instrumental test following satiety-induced devaluation (Ndev: non-devalued; Dev: devalued). Statistics revealed a main effect of devaluation (F(1,23) = 32.61, p<0.01), but no effect of group (F(1,23) = 0.16, p=0.69) or significant interaction between these factors (F(1,23) = 0.30, p=0.59). (C, D). All groups consumed more of the non-devalued than the devalued food during the consumption tests performed immediately after the initial (C) (F(1,23) = 42.93, p<0.001) and reversal instrumental tests (D) (F(1,23) = 74.19, p<0.001), with no main effects of group or treatment or interactions between these factors (largest F value = 2.76, p=0.11). Data are presented as mean + SEM. ***p<0.001. A1: action 1; A2: action 2; O1: outcome 1; O2: outcome 2; FR1: fixed ratio 1; RR: random ratio. Data provided in Figure 5—figure supplement 1—source data 1.
-
Figure 5—figure supplement 1—source data 1
Source file for the behavioural data from the initial phase for LC:vlOFC rats.
This excel file contains the behavioural data from the initial training and outcome devaluation test, as well as the consumption tests (initial and reversal) for rats injected with CAV2-PRS-hM4Di-mCherry in the orbitofrontal cortex (OFC).
- https://cdn.elifesciences.org/articles/81623/elife-81623-fig5-figsupp1-data1-v2.xlsx
Figure 5—figure supplement 2
Initial training and test for rats injected with CAV2-PRS-hM4Di-mCherry in area 32 (A32).
(A) Initial training for rats injected with CAV2-PRS-hM4Di-mCherry in Area 32 (A32) that would be allocated to group vehicle (Veh; n=8) and group deschloroclozapine (DCZ; n=9) for the subsequent reversal training, data is presented collapsed across the two actions. Both groups acquired the instrumental response (F(1,15) = 278.73, p<0.001) and there was no difference between groups (F(1,15) = 1.37, p=0.26) or interaction (F(1,15) = 0.16, p=0.70). (B) Initial instrumental test following satiety-induced devaluation (Ndev: non-devalued; Dev: devalued). Statistics revealed a main effect of devaluation (F(1,15) = 12.57, p=0.01), but no effect of group (F(1,15) = 0.22, p=0.65) or a significant interaction between these factors (F(1,15) = 0.16, p=0.70). (C, D) All groups consumed more of the non-devalued than the devalued food during the consumption tests performed immediately after the initial (C) (F(1,15) = 19.92, p<0.001) and reversal (D) instrumental tests (F(1,15) = 51.18, p<0.001), with no main effects of group or treatment or interactions between these factors (largest F value = 1.1, p=0.31). Data are presented as mean + SEM. ***p<0.001. A1: action 1; A2: action 2; O1: outcome 1; O2: outcome 2; FR1: fixed ratio 1; RR: random ratio. Data provided in Figure 5—figure supplement 2—source data 1.
-
Figure 5—figure supplement 2—source data 1
Source file for the behavioural data from the initial phase for LC:A32 rats.
This excel file contains the behavioural data from the initial training and outcome devaluation test, as well as the consumption tests (initial and reversal) for rats injected with CAV2-PRS-hM4Di-mCherry in A32.
- https://cdn.elifesciences.org/articles/81623/elife-81623-fig5-figsupp2-data1-v2.xlsx
Tables
Key resources table
| Reagent type (species) or resource | Designation | Source or reference | Identifiers | Additional information |
|---|---|---|---|---|
| Antibody | Anti-DβH (mouse monoclonal) | Merck Millipore | Cat# MAB308 | 1:1000 |
| Antibody | Anti-TH (mouse monoclonal) | Merck Millipore | Cat# MAB318 | 1:2000 |
| Antibody | Anti-RFP (rabbit polyclonal) | MBL International Corporation | Cat# PM005 | 1:2000 |
| Antibody | Anti-HA (rabbit monoclonal) | Cell Signaling Technology | Cat# C29F4 (#3724) | 1:1000 |
| Antibody | Anti-c-Fos (rabbit monoclonal) | Cell Signaling Technology | Cat# 9F6 (#2250) | 1:1000 |
| Antibody | Anti-mouse biotin-conjugated (goat polyclonal) | Jackson ImmunoResearch | Cat# 115-065-062 | 1:1000 |
| Antibody | Anti-rabbit biotin-conjugated (goat polyclonal) | Jackson ImmunoResearch | Cat# 111-065-003 | 1:1000 |
| Antibody | Anti-mouse FITC-conjugated (goat polyclonal) | Jackson ImmunoResearch | Cat# 115-095-003 | 1:400 |
| Antibody | Anti-rabbit TRITC-conjugated (goat polyclonal) | Jackson ImmunoResearch | Cat# 111-025-003 | 1:200 |
| Antibody | Anti-rabbit AF488-conjugated (goat polyclonal) | Jackson ImmunoResearch | Cat# 111-545-003 | 1:1000 |
| Chemical compound, drug | Streptavidin-Alexa 488 | Thermo Fisher Scientific | Cat# S11223 | 1:500 |
| Chemical compound, drug | Anti-DβH saporin | Advanced Targeting Solutions | Cat# KIT-03 | |
| Chemical compound, drug | Mouse IgG saporin (inactive) | Advanced Targeting Solutions | Cat# IT-18 sold as KIT-03 | |
| Chemical compound, drug | Diaminobenzidine (DAB) | Sigma-Aldrich | Cat# D5905 | |
| Chemical compound, drug | Deschloroclozapine (DCZ) | MedChemExpress | Cat# HY-42110 | Injectable volume 0.1 mg/kg |
| Chemical compound, drug | 6-OHDA hydrochloride | Sigma-Aldrich | Cat# H4381 | |
| Chemical compound, drug | Desipramine | Sigma-Aldrich | Cat# D3900 | |
| Commercial assay or kit | Avidin-biotin-peroxydase (ABC kit) | Thermo Fisher Scientific | Cat# 32020 | |
| Transfected construct (human) | CAV2 PRS HA-hM4Di E1 hSyn mCherry E3 | https://plateau-igmm.pvm.cnrs.fr/?vector=cav-prs-ha-hm4di | Titre 3.5×10¹² pp/mL |
Additional files
Download links
A two-part list of links to download the article, or parts of the article, in various formats.
Downloads (link to download the article as PDF)
Open citations (links to open the citations from this article in various online reference manager services)
Cite this article (links to download the citations from this article in formats compatible with various reference manager tools)
Inhibition of noradrenergic signalling in rodent orbitofrontal cortex impairs the updating of goal-directed actions
eLife 12:e81623.
https://doi.org/10.7554/eLife.81623


