Characterisation of the immune repertoire of a humanised transgenic mouse through immunophenotyping and high-throughput sequencing
- Kymab, a Sanofi Company, Babraham Research Campus, United Kingdom
- Department of Statistics, University of Oxford, United Kingdom
- Division of Immunology, University Children's Hospital, University of Zurich, Switzerland
- Children's Research Center, University of Zurich, Switzerland
- Alchemab Therapeutics Ltd, Kings Cross, United Kingdom
- Department of Paediatrics, University of Oxford, United Kingdom
- Department of Infectious Disease, Faculty of Medicine, Imperial College London, United Kingdom
Figures
Figure 1
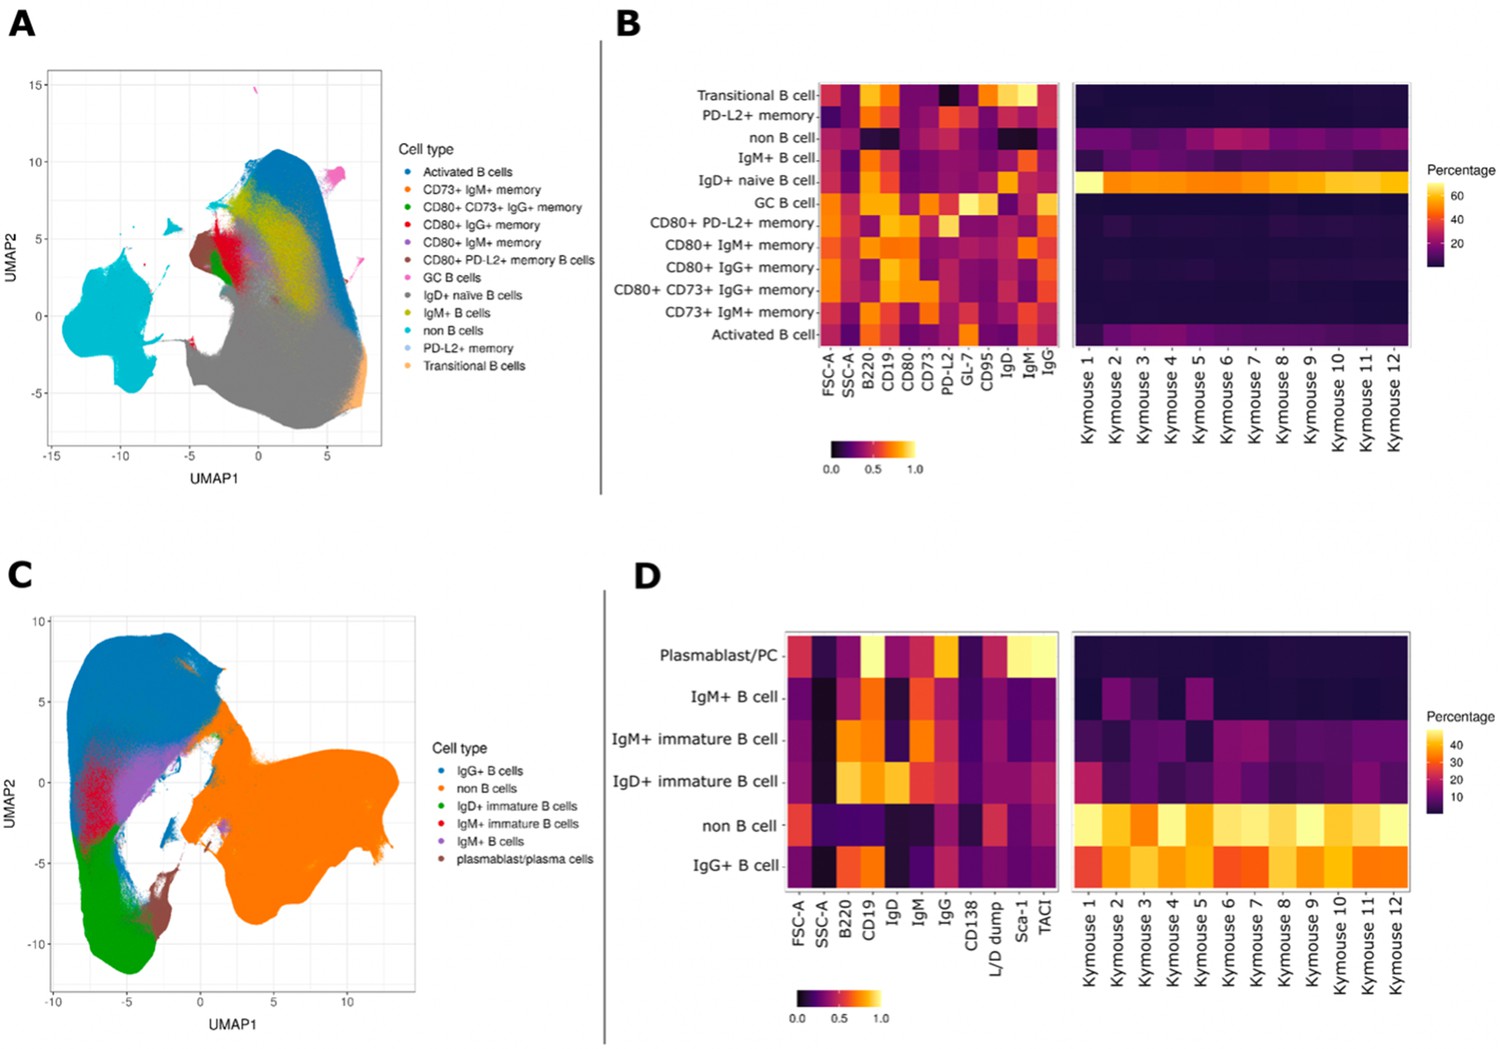
UMAP projections of sorted cell populations from the spleen, lymph nodes and bone marrow of Kymice.
UMAP projections of sorted cell populations identified using unsupervised clustering from spleen and lymph nodes (A) or from bone marrow samples (C) can be used to visualise marker expression on the combined cells that were used for sorting and to characterise their phenotypes. UMAP projections show a clear separation between B cells and non-B cells for both sample types. The projections are coloured by the 12 resolved cell types in the spleen and lymph nodes (A) and the six resolved in the bone marrow samples (C). Normalised and scaled marker expression and frequencies were used to visualise mouse-to-mouse variation for each of the resolved cell types in the spleen and lymph nodes (B) or the bone marrow samples (D). The expression profiles are homogeneous across mice. In spleens and lymph nodes non-class-switched IgD+ naive B cells were the predominant cell population, followed by non-B cells and IgM+ naive B cells, reflective of a tissue that has not been exposed to antigen. In bone marrow samples on the other hand the most numerous populations were non-B cells, followed closely by class-switched IgG+ B cells, a result that reflects a tissue niche that supports survival of long-lived antibody producing cells.
Figure 2 with 2 supplements
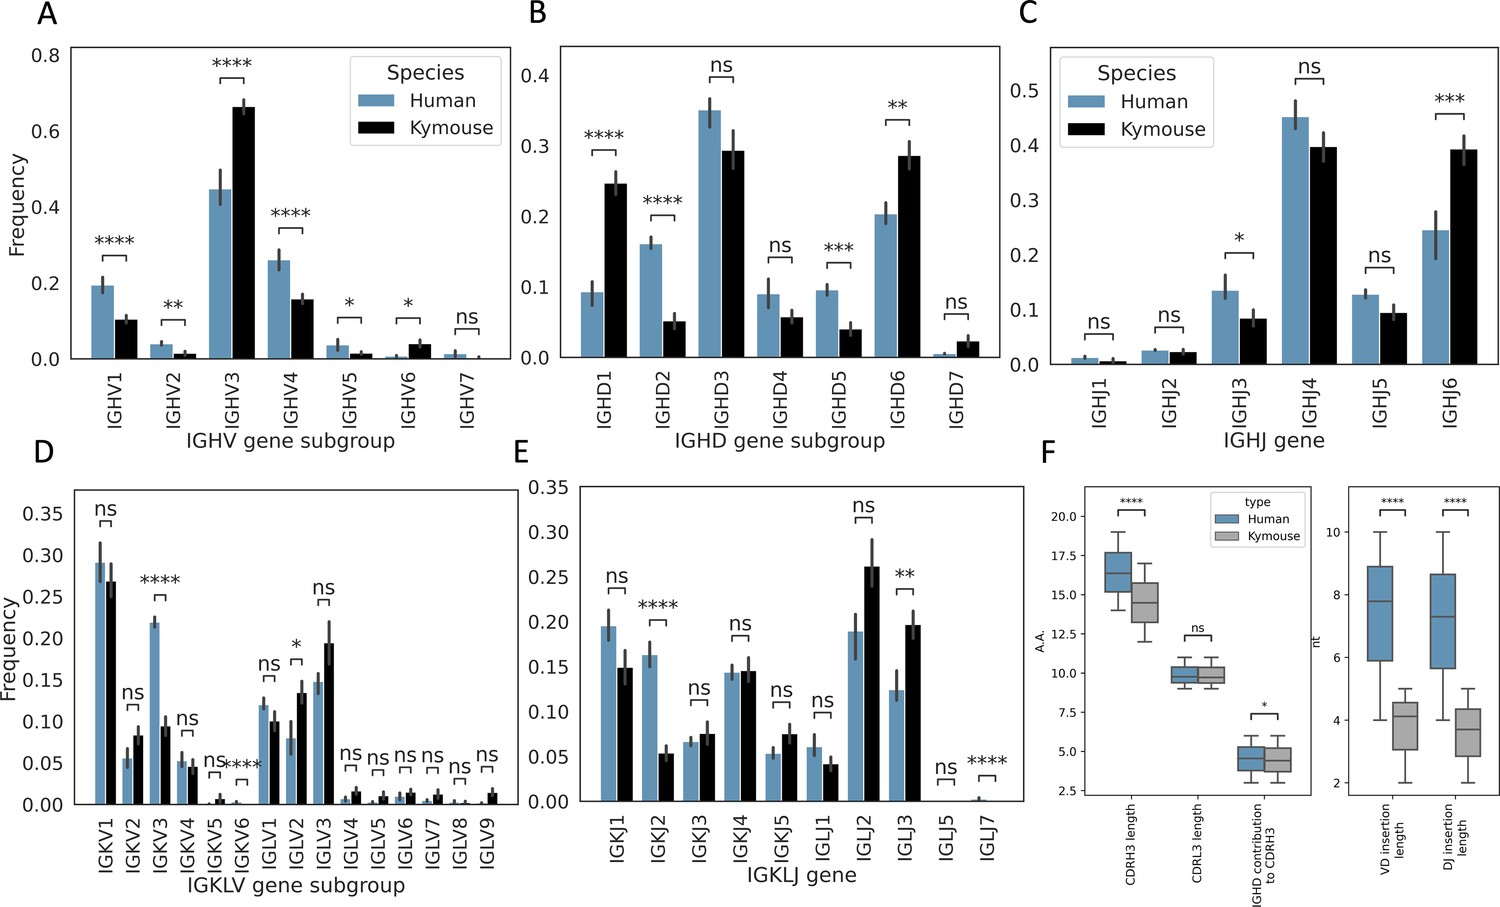
Single-cell sequencing of Kymouse BCR repertoires reveals significant differences in encoding gene frequencies in comparison to human repertoires.
The non-mutated, naïve IgM subset of the paired VH and VL human and Kymouse sequences differ significantly in the frequencies of their encoding genes, as well as in their CDRH3 length, IGHD gene alignment length, and the length of their VD and DJ insertions. (A) shows the significant differences in the Kymouse’s usage of IGHV gene subgroups with most notably significantly greater IGHV3 usage. IGHV3 comprised on average 66.4% of Kymouse repertoires vs 44.8% of human repertoires, and significantly lower IGHV1 usage (19.4% of human repertoires vs 10.5% of Kymouse repertoires). (B) likewise shows a number of differentially expressed gene subgroups: the largest differences are in IGHD1 (24.7% of Kymouse repertoires vs 9.3% of human repertoires on average), IGHD2 (16.1% of human repertoires vs 5.2% of Kymouse repertoires), and IGHD5 (9.6% vs 4.0% of Kymouse repertoires) and IGHD7 (28.6% of Kymouse repertoires vs. 20.4% of human). There are other notable differences in IGHJ gene usage (C) where there is significantly greater IGHJ6 usage in Kymice (39.3% vs 24.6% in humans) and significantly less IGHJ3 usage (8.5% vs 13.5% in humans). There are also differences in the genes encoding the light chain, the IGKLV (D) and IGKLJ (E) genes, such as significantly greater use of IGKV3 by human repertoires (21.9% of human repertoires vs 9.5% of Kymouse repertoires) and significantly greater use of IGLV2 by Kymouse repertoires (13.5% vs 8.0% of human repertoires on average). (E) shows significantly greater IGKJ2 usage by human repertoires (16.3% vs 5.4% in Kymouse) and significantly greater IGLJ3 usage by Kymouse repertoires (19.7% vs 12.4% in humans). (F) displays the distribution of CDRH3 length (which differs significantly with humans having CDRH3s on average 1.9aa shorter), CDRL3 length (no significant difference), and IGHD germline alignment length, which differs by 0.2aa on average, as well as the distribution of VD and DJ insertion lengths, which differ significantly and by nearly a factor of 2 (1.9× as many insertions on average in the VD junction, and 1.97 as many at the DJ junction).
Figure 2—figure supplement 1
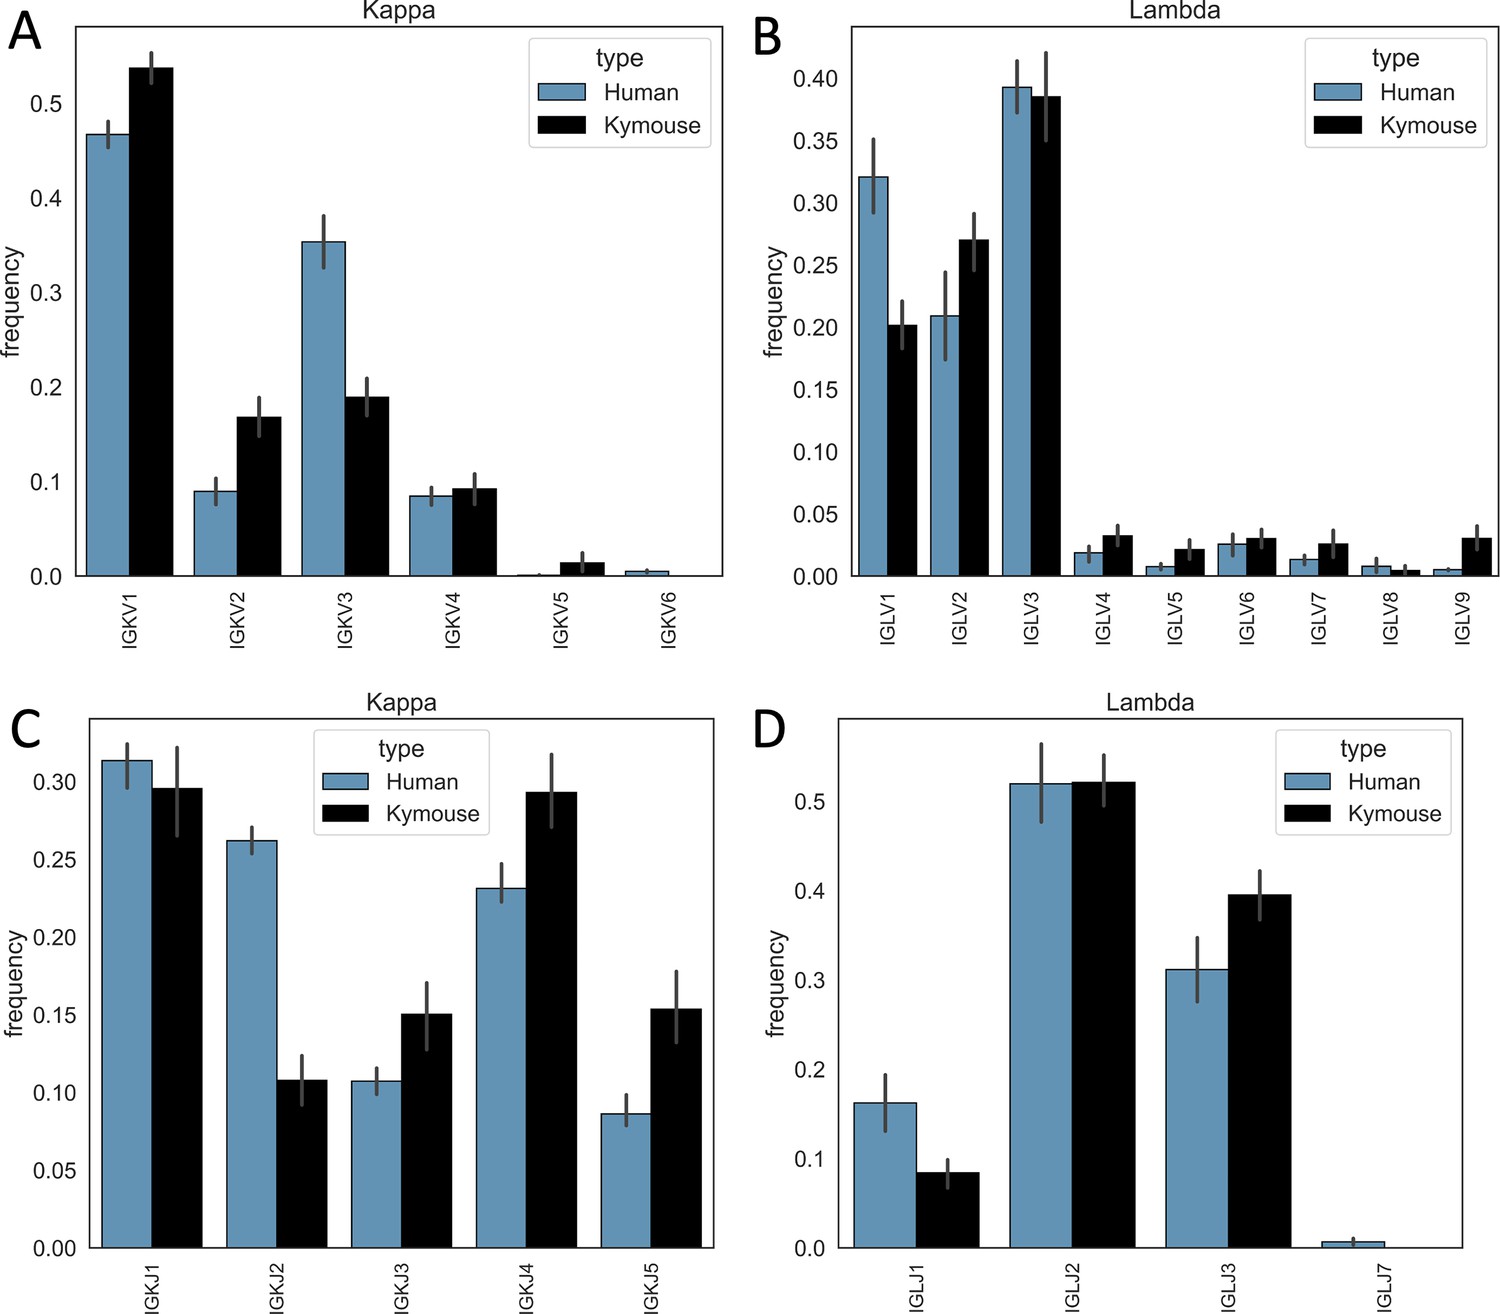
Single-cell sequencing of Kymouse BCR repertoires reveals significant differences in encoding gene frequencies in comparison to human repertoires.
The differing IGKLV and IGKLJ gene frequencies observed in the single-cell Kymouse and human BCR sequencing data remain when comparing within light chain locus, i.e. Kymice and human naïve kappa repertoires use IGKV genes at consistently different frequencies, and the same is true as of lambda repertoires. In particular, human repertoires appear to use a significantly greater proportion of IGKV3 genes in their kappa repertoires (35.3% on average vs 18.9% in Kymice), while Kymice use significantly more IGKV1, IGKV2, and IGKV5 (53.7% vs 46.7%, 16.8% vs 8.9%, and 2.4% vs 0.1% in Kymice and humans on average, respectively) (A); there are likewise differences in their IGKJ gene usage with significantly greater human IGKJ2 usage (26.2% vs 10.8%) and significantly greater IGKJ3, IGKJ4, and IGKJ5 usage by Kymouse repertoires (15.0% vs 10.7%, 29.3% vs 23.1%, and 15.4% vs 8.6%) (C). In the lambda chain repertoires, humans use on average a greater proportion of IGLV1 genes (32.0% vs 20.1%) and Kymice a greater proportion of IGLV2, IGLV4, IGLV5, IGLV7, and IGLV9 (27.0% vs 20.9%, 1.9% vs 3.2%, 2.7% vs 0.8%, 3.6% vs 1.3%, and 3.0% vs 0.5%) (B). Human lambda repertoires appear to use a greater proportion of IGLJ1 genes (16.2% vs 8.4%), while the Kymouse uses a greater proportion of IGLJ3 (39.5% vs 31.1%).
Figure 2—figure supplement 2
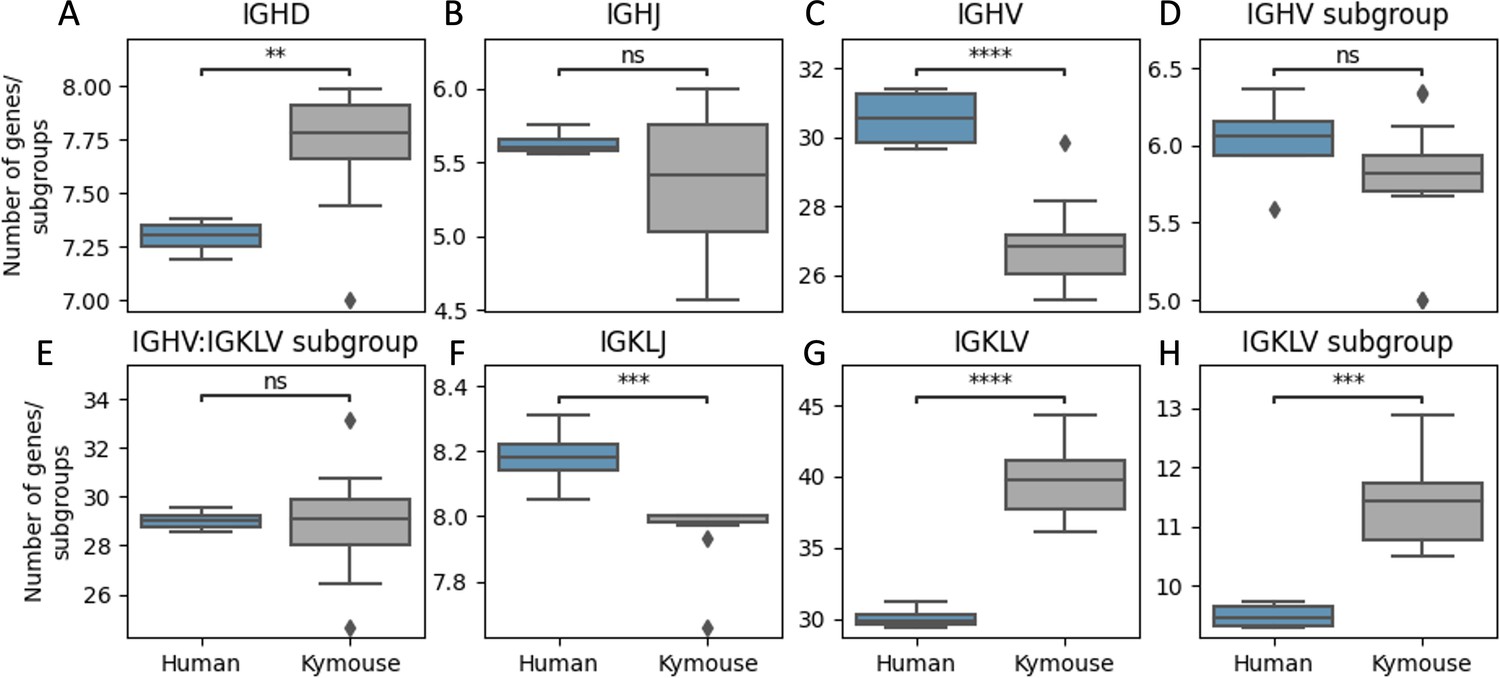
Kymice repertoires appear to use a significantly more diverse set of IGHD genes (A), a comparable number of IGHJ genes (B), and significantly fewer IGHV genes (C) than human repertoires.
A more diverse set of IGHV gene subgroups are used by human repertoires on average though this is not statistically significant (D) while a more diverse set of IGLKV genes (G) and gene subgroups (H) are used by Kymouse repertoires on average resulting in comparable combinatorial diversity (E). A greater number of IGKL genes were sampled by the human repertoires (F). The plot shows the distribution of average number of genes or gene subgroups per subject over 100 random subsamples to the minimum sample size, 105 sequences. We used a Student’s t-test with Bonferroni correction; **: 1% level, ***: 0.1% level, ****: 0.01% level.
Figure 3 with 3 supplements
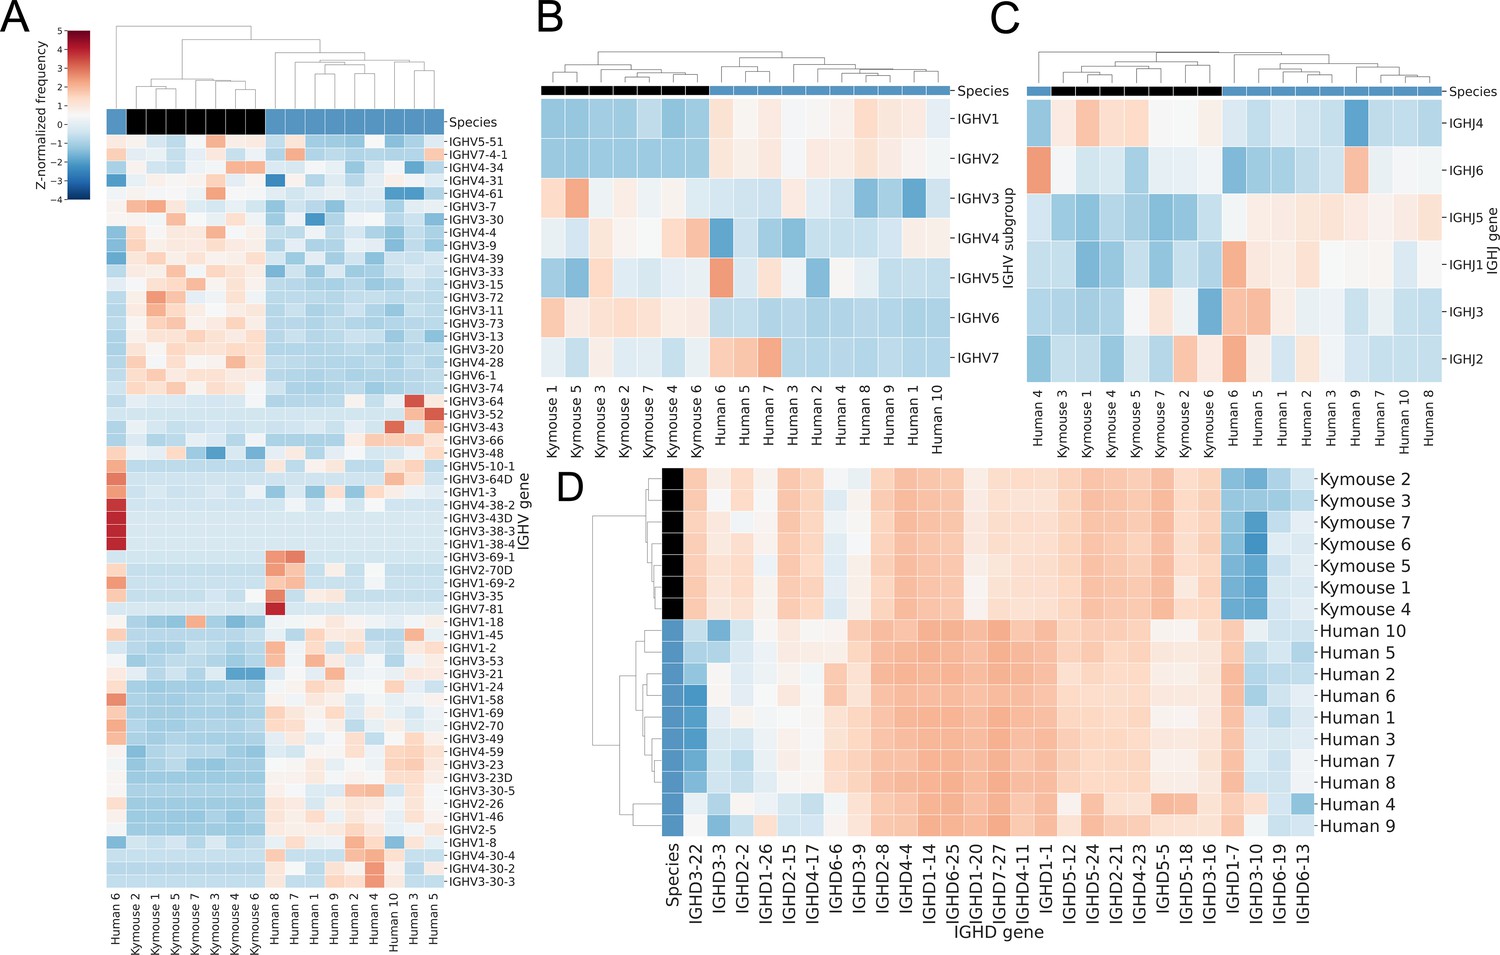
Bulk VH repertoires of Kymice exhibit differences in encoding gene frequencies versus human repertoires.
Gene usage clustermaps for (A) IGHV genes, (B) IGHV subgroups, (C) IGHJ genes, and (D) IGHD genes from bulk VH sequencing reveal differences in gene frequencies that are sufficient to cluster most Kymouse and human repertoires. The IGHV clustermaps show a separation between human (blue) and Kymouse (black) repertoires, with lower usage of IGHV1 and IGHV2 in the Kymouse (5.3% vs 22.6% and 0.2% vs 2.1% in Kymice and humans, respectively) and increased usage of IGHV3 (51.6% vs 39.7%), IGHV4 (35.3% vs 31.6%), and IGHV6 (4.7% vs 1.0%). There are also differences in usage of IGHJ genes with a preference in the Kymouse repertoires for IGHJ4 (46.7% vs 42.6%). The IGHD gene usage shows the clearest distinction between Kymice and human repertoires with greater usage of IGHD1, IGHD6, and IGHD7 (24.2% vs 10.3%, 27.4% vs 20.4%, and 2.4% vs 0.6% on average in Kymice and humans, respectively) and lower usage of IGHD, IGHD4, and IGHD5 genes (17.2% vs 5.8%, 9.1% vs 5.5%, and 9.5% vs 4.8%) (Figure 3—figure supplement 2).
Figure 3—figure supplement 1
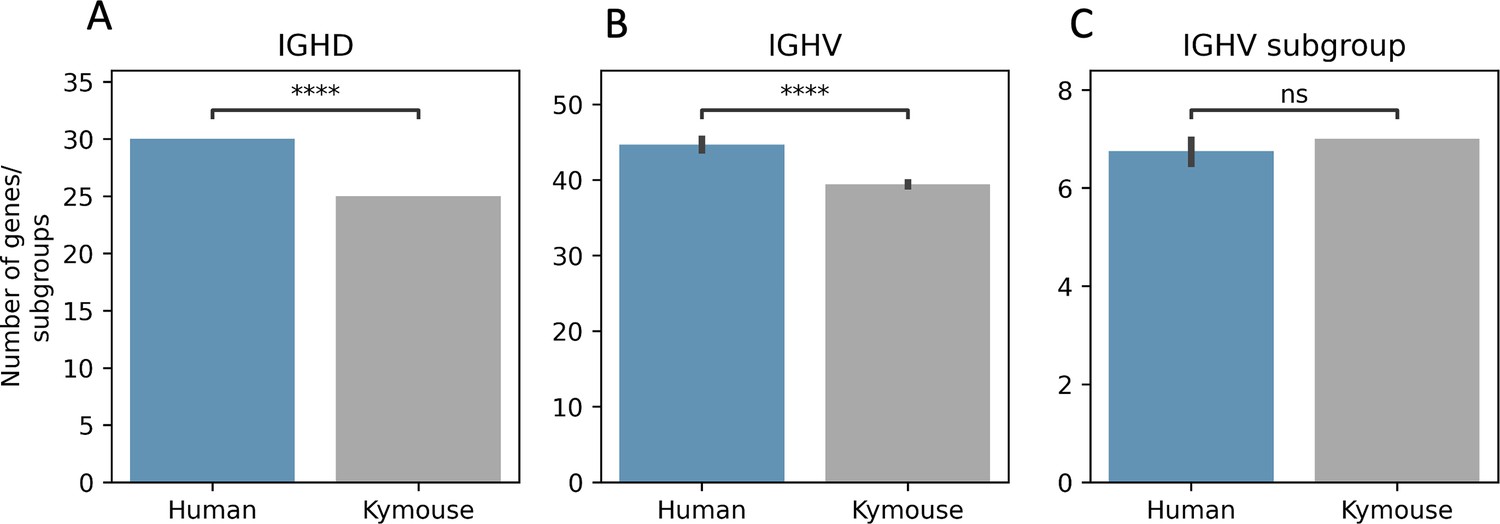
The Kymouse repertoires use significantly fewer IGHD (A) and IGHV (B) genes than do the human repertoires: this is because the ‘missing’ IGHV and IGHD genes are absent from the inserted haplotype in the Kymouse locus.
The absent IGHV genes found in certain naïve human repertoires are: IGHV1-38-4, IGHV1-69-2, IGHV3-30-3, IGHV3-38-3, IGHV3-43D, IGHV3-52, IGHV3-64D, IGHV3-69-1, IGHV4-30-2, IGHV4-30-4, IGHV4-38-2, IGHV5-10-1, and IGHV7-81. The missing IGHD genes correspond to orphon IGHD1 genes (IGHD1/OR15-1a-c). As in Figure 2—figure supplement 2, we calculated an average number of genes per subject over 100 random subsamples to the minimum sample size (20,653 sequences). We used a Student’s t-test with Bonferroni correction; **** indicates significance at the 0.01% level.
Figure 3—figure supplement 2
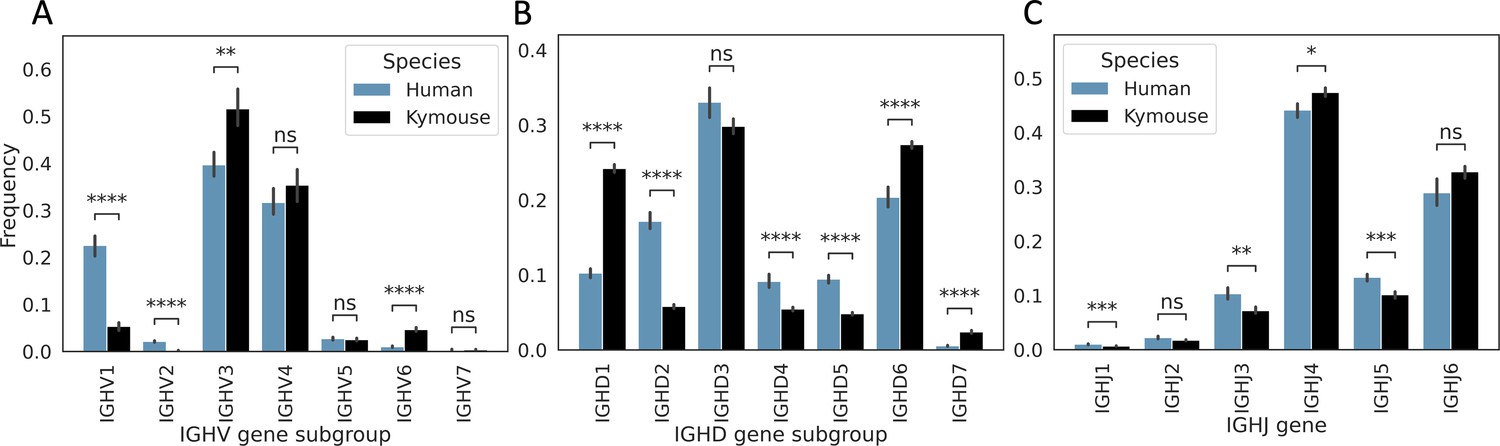
Kymice have on average significantly different IGHV, IGHD, and IGHJ gene usages to humans in their primary repertoires.
There is significantly lower IGHV1 usage – on average, 22.6% of the primary repertoire is IGHV1 in our naïve human repertoires vs 5.3% of Kymouse repertoires. There is also a significantly greater contribution from IGHV2 with 2.1% vs 0.2%. On average, 51.6% of the Kymouse repertoire is IGHV3 vs 39.7% of the human repertoires. IGHV6 is also used by a greater proportion of Kymouse naïve B cells, occupying 4.7% of the repertoire on average vs 1.0% in human repertoires. IGHD gene subgroup usage shows further significant differences (B): IGHD2, IGHD4, and IGHD5 are preferred by human repertoires (average 17.2% vs 5.8%, 9.1% vs 5.5%, and 9.5% vs 4.8% respectively in human vs Kymouse repertoires), while Kymouse repertoires preferentially use IGHD1, IGHD6, and IGHD7 (24.2% vs 10.3%, 27.4% vs 20.4%, and 2.4% vs 0.6% on average in Kymice and humans, respectively). IGHJ shows significant differences (C) but in less extreme relief than IGHV or IGHD gene subgroup (hence having a sub-1.0 Rand index when clustering repertoires by their usage profiles). Human repertoires show significantly greater IGHJ1, IGHJ3, and IGHJ5 usage, and Kymouse repertoires show significantly greater IGHJ4 usage. IGHJ6 usage is also elevated in Kymice on average but non-significantly (32.8% of repertoires on average in Kymice vs 28.9% in humans). The differences in IGHJ gene usage are shown further in Figure 3—figure supplement 3.
Figure 3—figure supplement 3
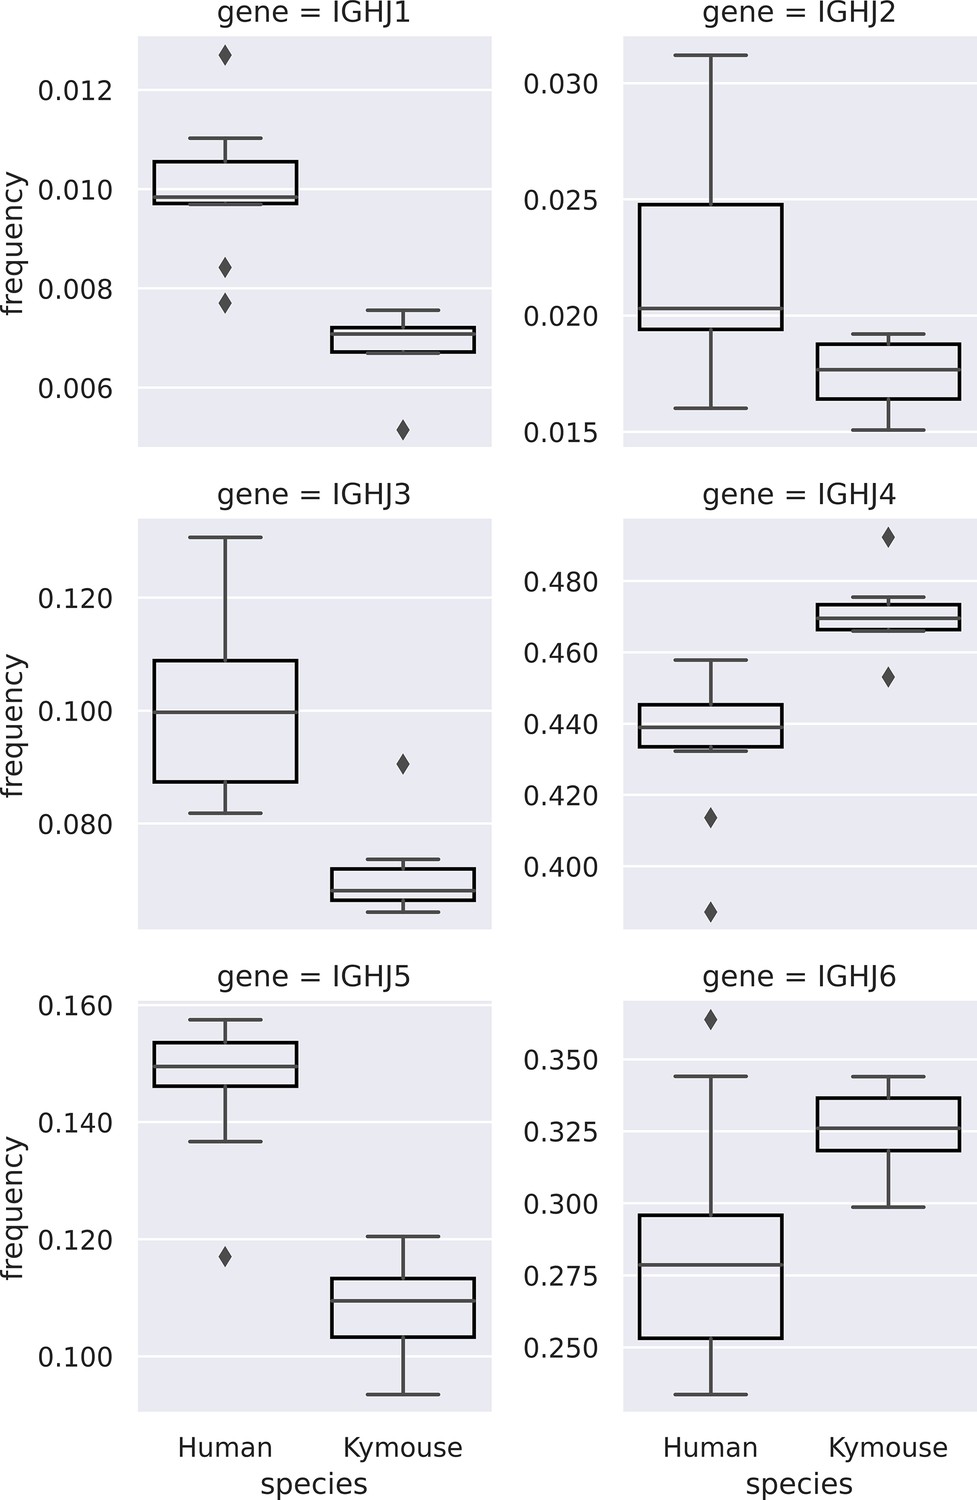
Comparison of IGHJ usage between naïve human and Kymouse IgM B-cell receptor (BCR) repertoires (corresponding to subplot C of Figure 3—figure supplement 2).
Kymouse repertoires disproportionately use IGHJ4 and IGHJ6 versus human repertoires, and use less IGHJ1, IGHJ2, IGHJ3, and IGHJ5.
Figure 4 with 2 supplements
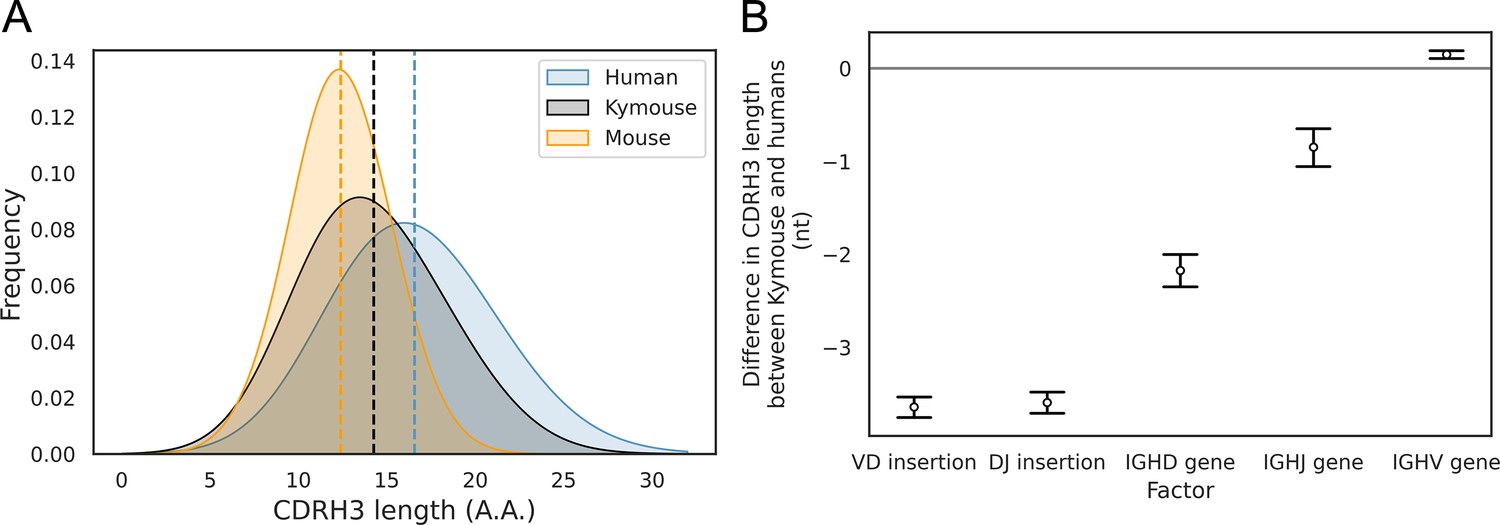
The CDRH3 length distribution of the Kymouse is intermediate between humans and C56BL/6 mice primarily due to reduced VD and DJ insertion rates.
The CDRH3 length distribution of the Kymouse (average 14.3aa) is intermediate between equivalent C57BL/6 repertoires (12.4aa) and human repertoires (16.6aa) (A). For each of five possible contributing factors, we used bootstrapping to estimate the contribution of the factor to difference in CDRH3 length, measured in nucleotides. Where this factor is positively contribution (i.e. is above zero), the factor is leading to differentially longer CDRH3s in the Kymouse; where negative, it leads to differentially shorter CDRH3s in the Kymouse. These statistics reveal that the major factor leading to a reduction in CDRH3 length in the Kymouse, despite access to the same germline repertoire, is the relative lack of VD and DJ insertions (B) (Figure 4—figure supplement 2).
Figure 4—figure supplement 1
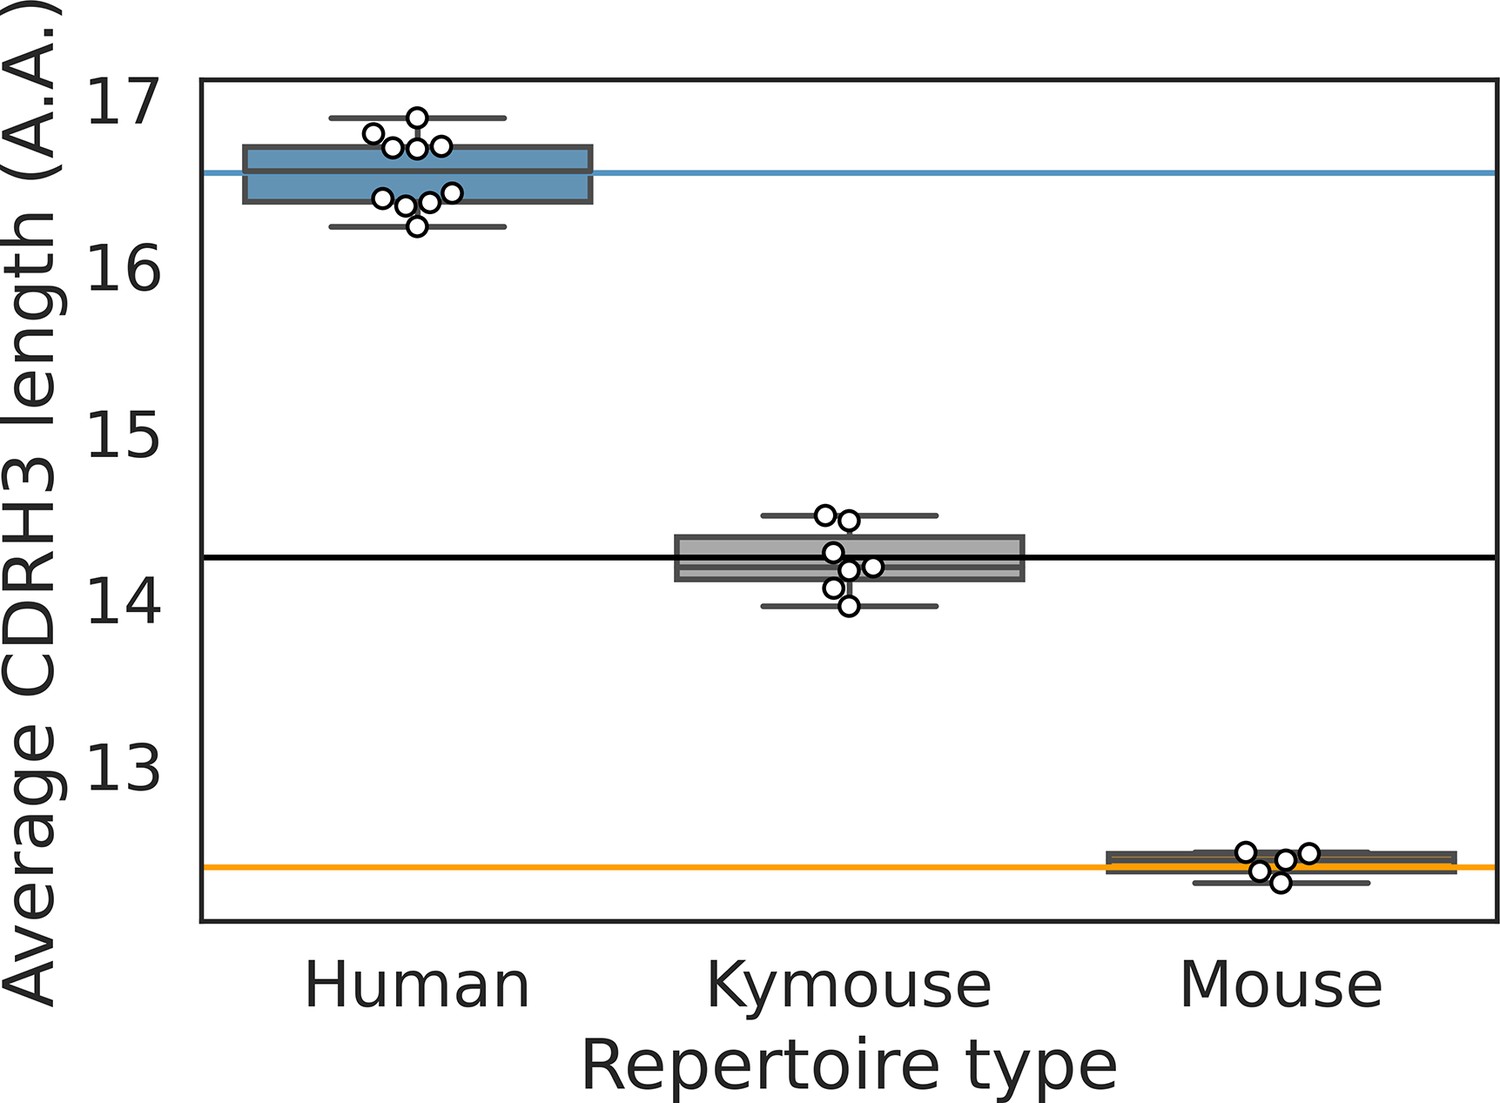
The distribution of average CDRH3 length per repertoire is shown for each of the bulk VH repertoires.
The solid lines indicated the population-wide average as calculated and shown in Figure 4 in the main text.
Figure 4—figure supplement 2
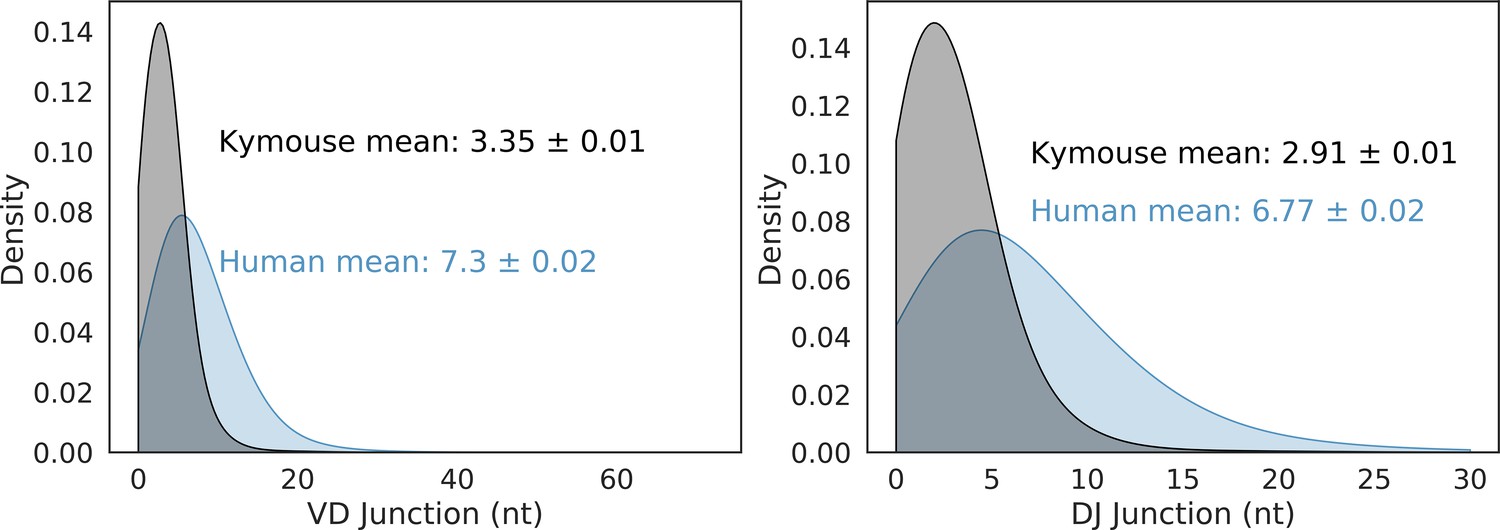
VD and DJ insertion length distributions in the Kymouse (grey) versus human (blue) repertoires.
We considered only sequences where a satisfactory IGHD germline alignment was achieved.
Figure 5
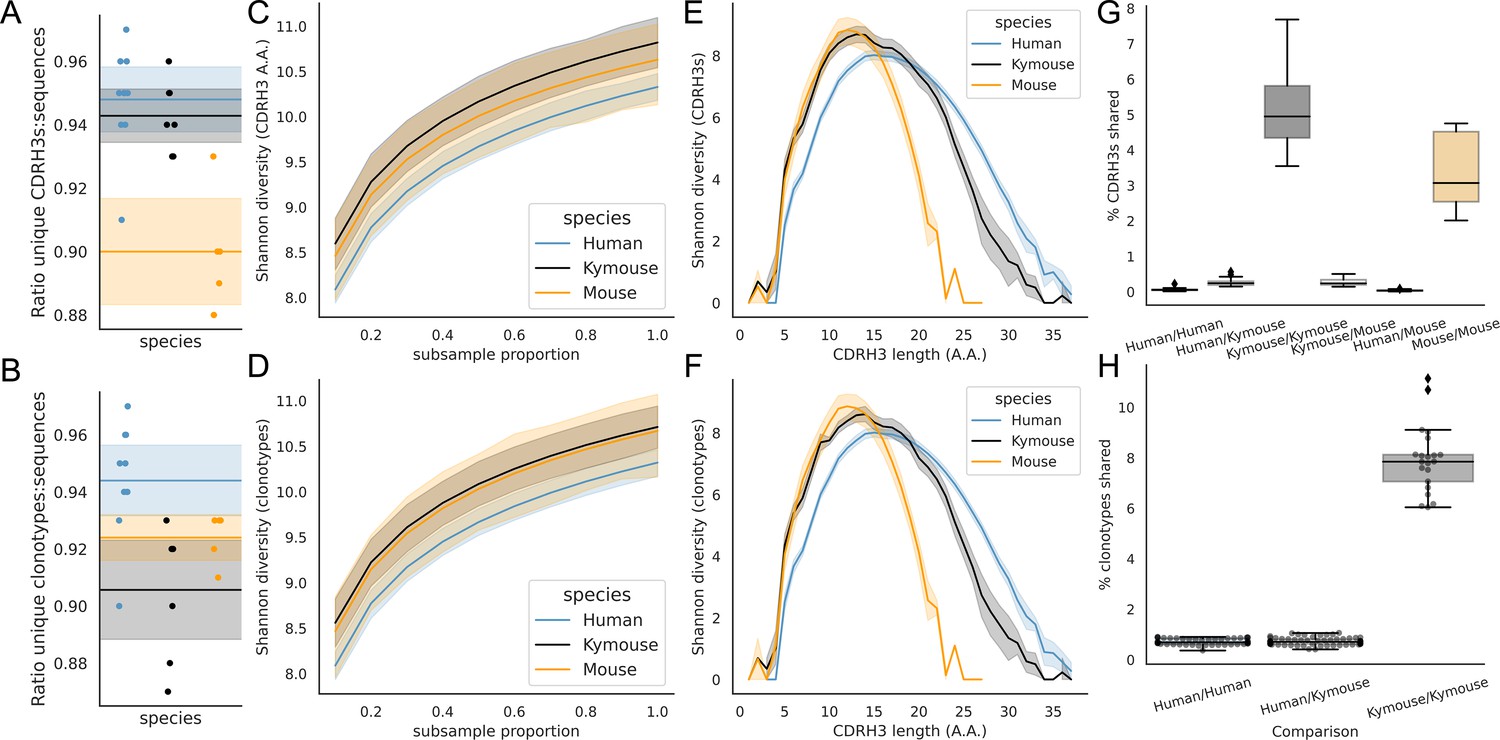
Examination of the CDRH3 and clonal diversity in the primary B-cell receptor (BCR) repertoires of humans, Kymice, and mice reveal comparable diversity on a repertoire level, despite the described differences in CDRH3 lengths.
Overlap analysis reveals considerably greater diversity among human repertoires. The top rows pertain to exact CDRH3 (amino acids) and the bottom rows to clonotypes (same IGHV, IGHJ, and greater than 90% amino acid identity across length-matched CDRH3s). At the level of CDRH3s, the Kymouse repertoires have more unique CDRH3s per sequence sampled (A), are more diverse in their usages (C), despite their limited VD and DJ insertion rates. Diversity is reduced relative to human sequences at longer CDRH3 lengths which in unmutated repertoires require VD/DJ insertions to reach (E). Kymouse repertoires show an opposite pattern in unique sampling rate and diversity when looking at clonotypes (B and D, respectively) but still show reduced diversity versus humans at longer lengths. Overlap among CDRH3s (G) and clonotypes (H) between individuals is considerably higher in Kymice than humans, and more comparable to mice (G).
Figure 6 with 5 supplements
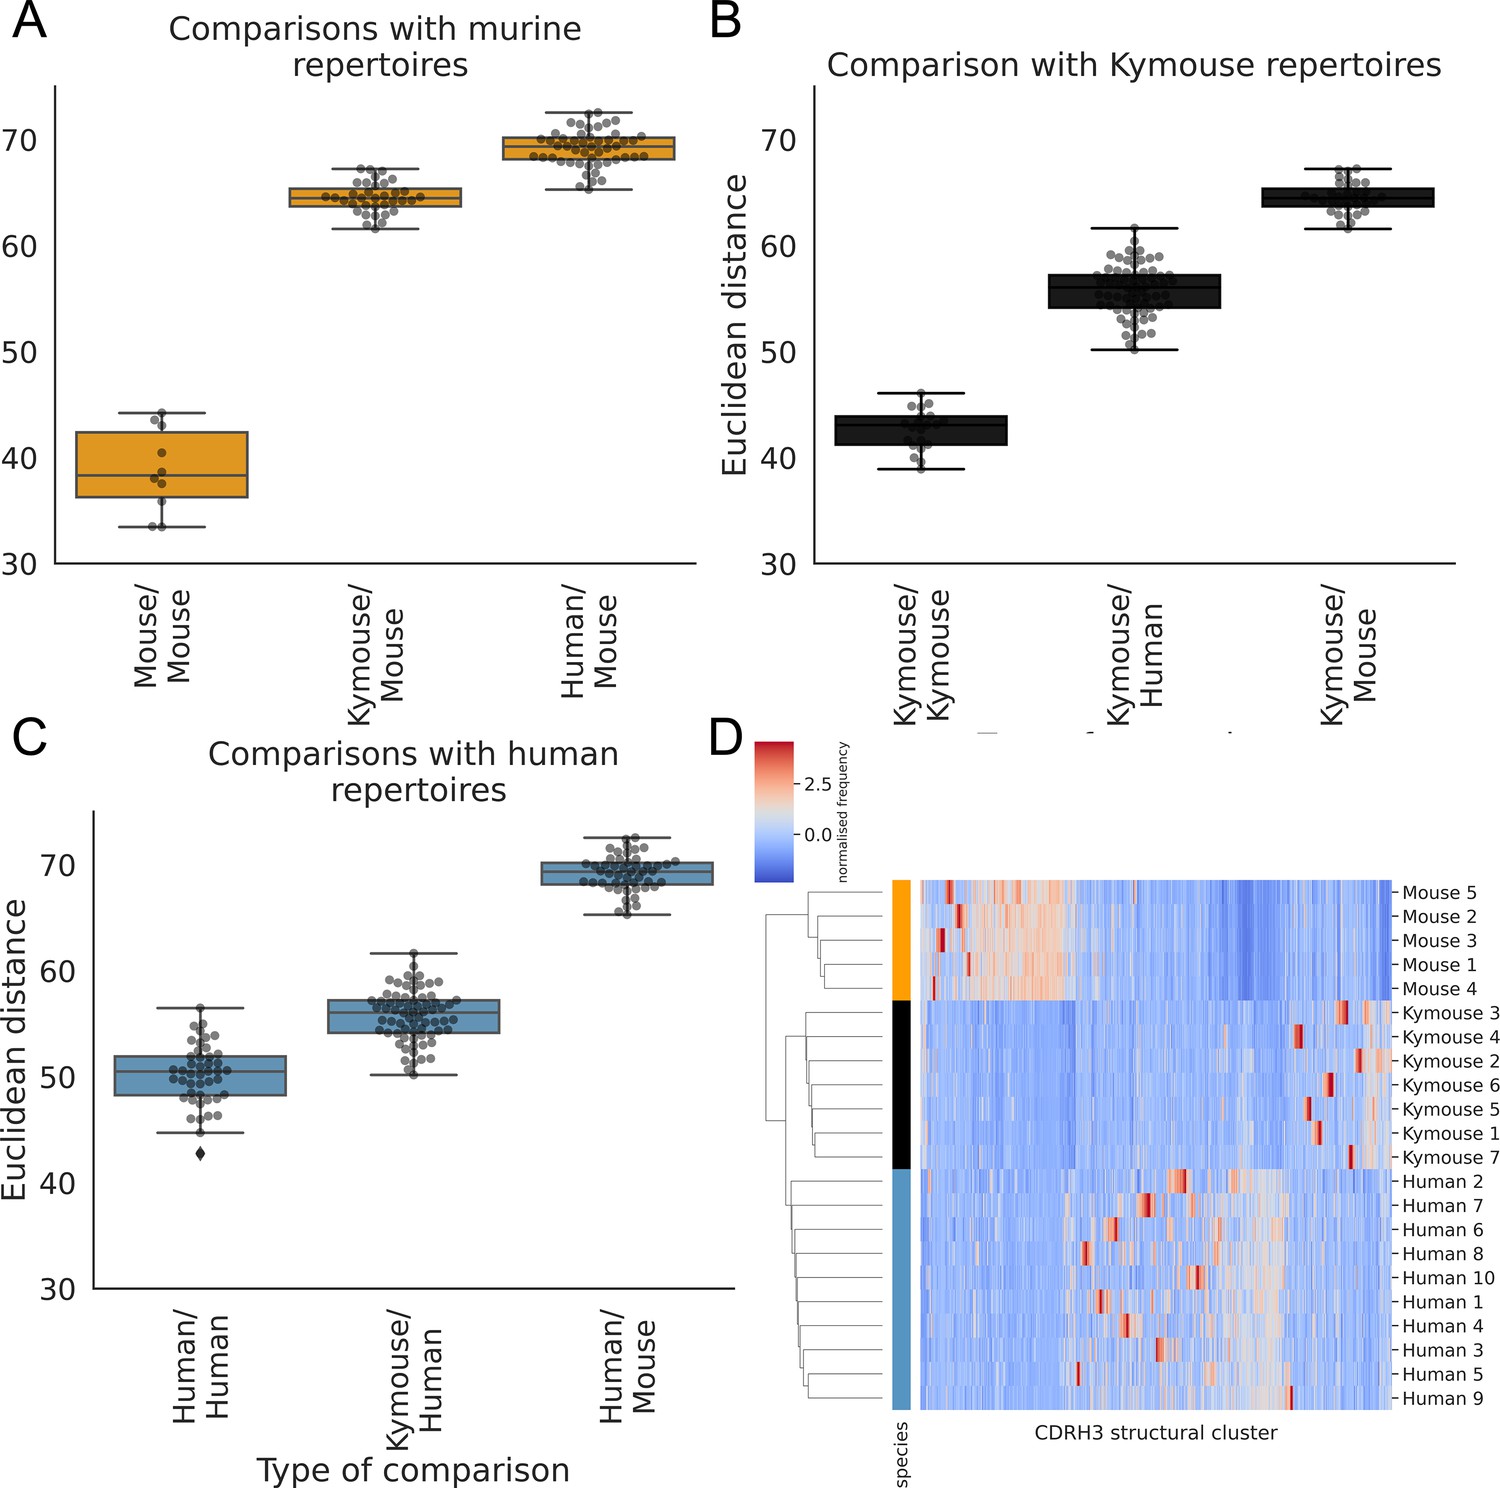
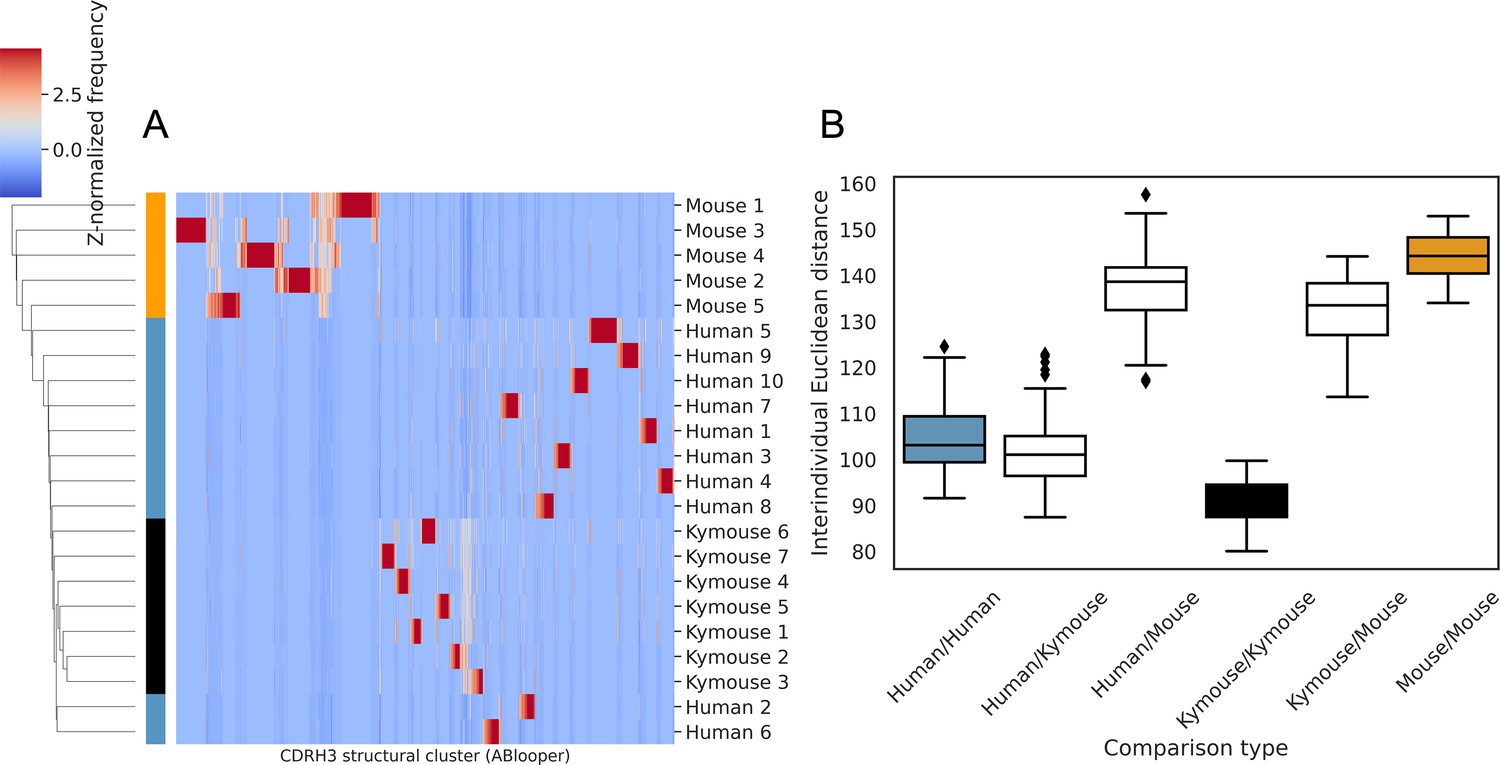
The CDRH3 structural repertoire of Kymice is human-like: distance between CDRH3 structural cluster usage profiles is measured with Euclidean distance in Z-normalised proportions.
This is calculated pairwise between subjects and these distances are clustered hierarchically. A through C show these pairwise distances stratified by the type of comparison. The leftmost box shows the range in distance between individuals of the same species. For the mouse and Kymouse repertoires, this range is smaller than the range in distances for any other species, meaning that they cluster monophyletically (D). Human repertoires have less self-similar CDRH3 structural cluster usages with ranges overlapping with Kymouse repertoires. In the hierarchical clustering solution with these pairwise distances that is shown in (D), the human and Kymouse repertoires form a monophyletic clade separately from the murine repertoires.
Figure 6—figure supplement 1
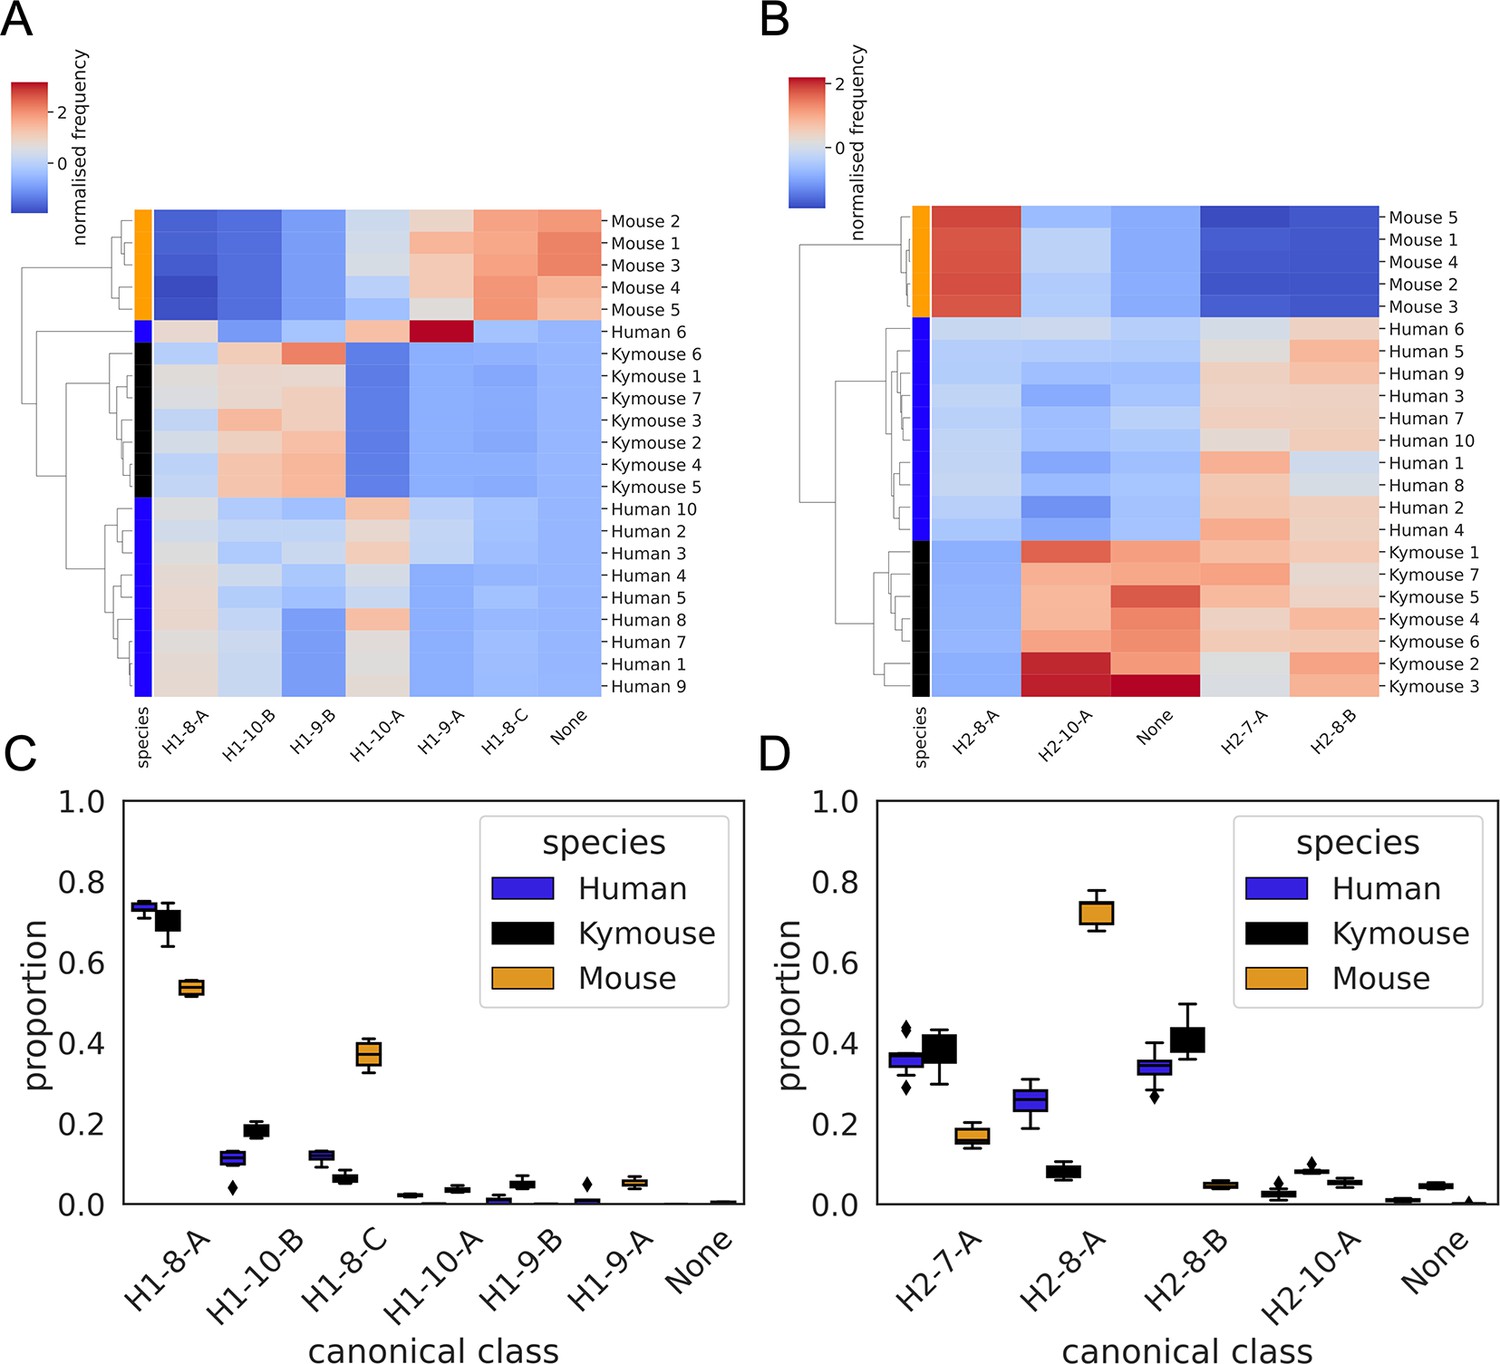
CDRH1 (A and C) and CDRH2 (B and D) canonical class usage clusters Kymice and humans separately from mice.
The key differences between humans and Kymice and mice in CDRH1 canonical forms are the greater usage of H1-9-A and H1-8-C in mice versus H1-10-B and H1-9-B in humans and Kymice. Between humans and Kymice, the Kymouse repertoires have lower usage of H1-10-A and greater usage of H1-10-B than humans. Focussing on the CDRH2 canonical forms, the largest difference between mice and humans/Kymice is in the greater usage of H2-8-A and lower usage of H2-8-B and H2-7-A. The Kymouse repertoires use significantly less H2-8-A than the human repertoires.
Figure 6—figure supplement 2
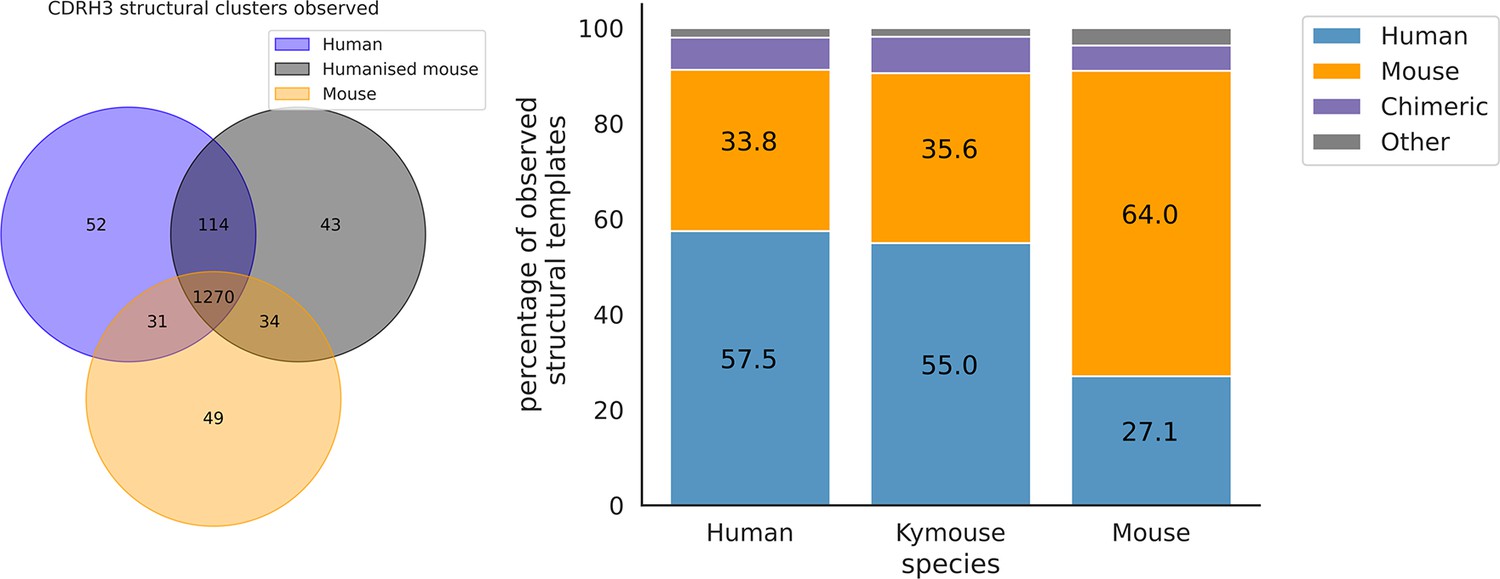
The majority of CDRH3 structural clusters are observed across all three repertoire types.
Focussing on the origin of the antibody representing the structural cluster, 57.5% of templates used in the human repertoires and 55% in the Kymouse repertoires are of human origin. The majority of templates observed in the mouse repertoires are of murine-origin.
Figure 6—figure supplement 3
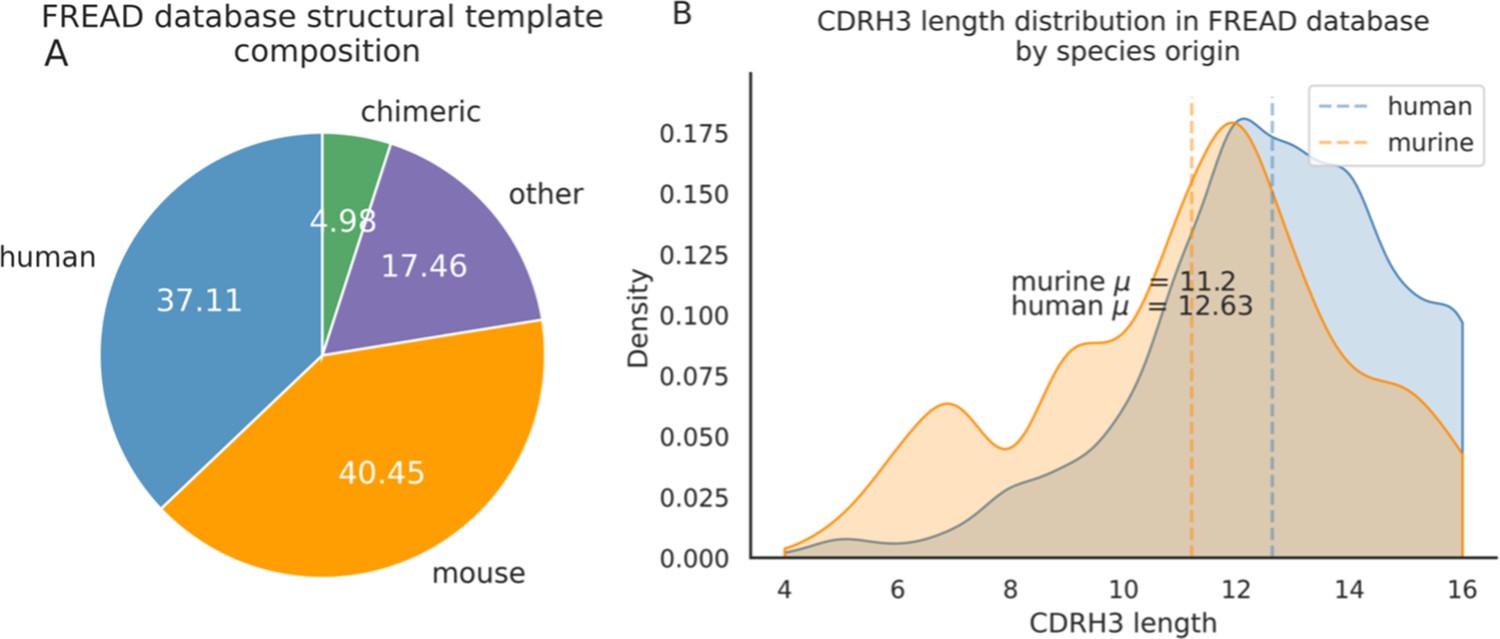
Around 40.5% of templates in the FREAD database are labelled as of murine-origin vs. 37.1% of human templates.
There are proportionally more human templates at CDRH3 lengths of longer than 12 amino acids.
Figure 6—figure supplement 4
Structural clustering of CDRH3s from antibody models produced by ABlooper indicate greater structural similarity between the repertoires of humans and Kymice than to C57BL/6 mice, as per the homology-based annotation pipeline.
(A) shows the clustermap of Z-normalised usages of CDRH3 structural clusters which were derived from greedy clustering with a 0.6 Å cut-off of CDRH3 Cα RMSDs calculated between models built by ABlooper. The humans and Kymice form a monophyletic cluster, which the C57BL/6 mouse repertoires do not. The distribution of distances shown in (B) reveals that the Kymouse repertoires are the least variable. Similarly to the SAAB+ CDRH3 structural cluster usage comparison, the ranges of human/human and human/Kymouse intersubject distances are overlapping; however the extent of overlap is greater than observed with SAAB+. There is also overlap between the distances observed between humans and Kymice with mice, and between individual mice.
Figure 6—figure supplement 5
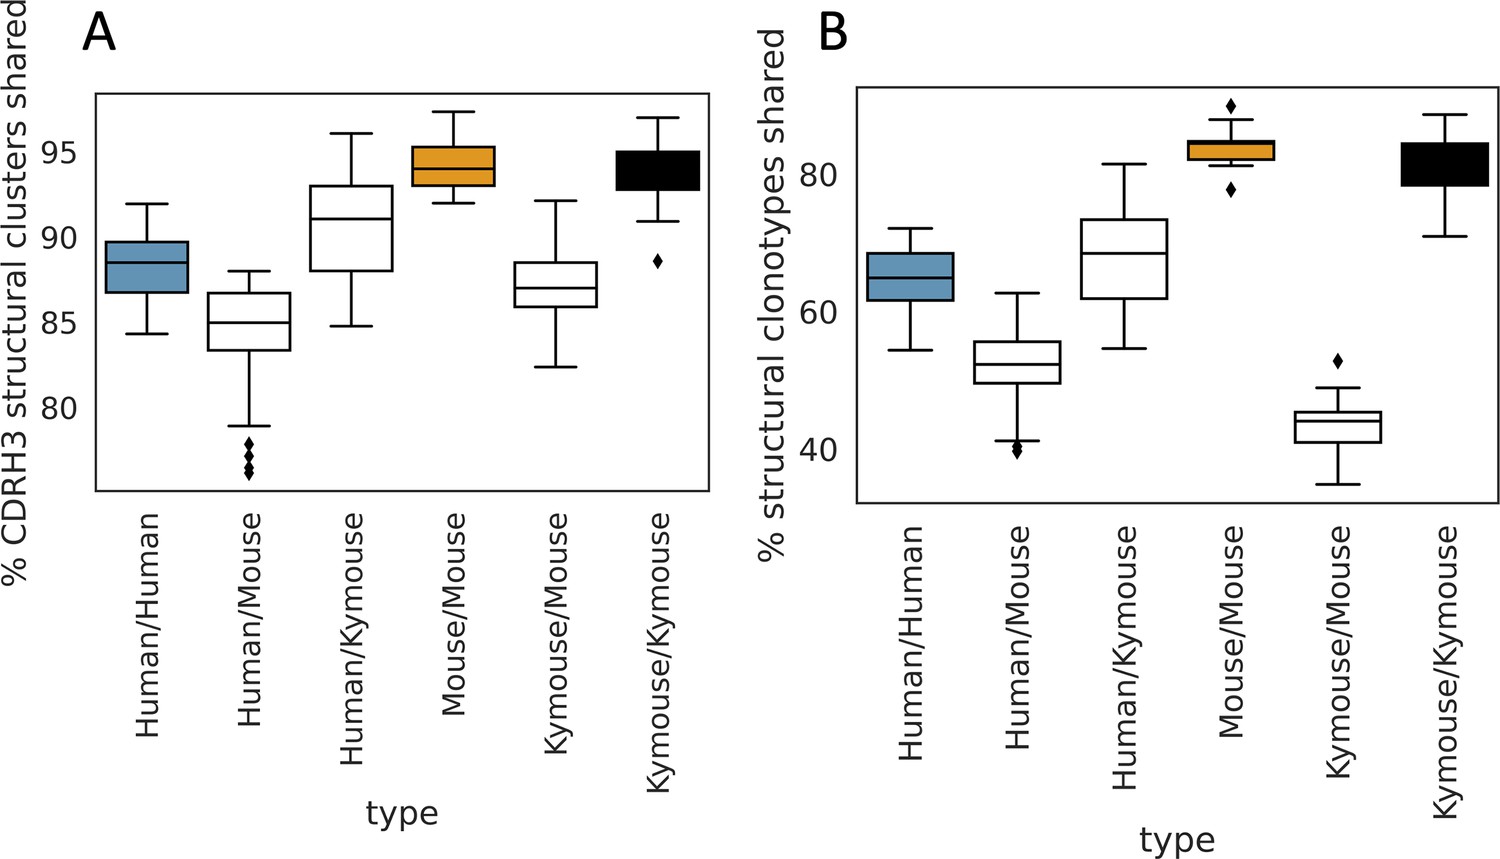
The majority of CDRH3 structural clusters are shared among repertoires.
We calculated pairwise overlap in CDRH3 structural clusters (A) and ‘structural clonotypes’ which is the combination of CDRH1 and CDRH2 canonical forms and the CDRH3 structural cluster (B), akin to the plots in Figure 5G and H. The majority of CDRH3 structural clusters are shared across all subjects. The percentage of structural clusters that are shared between a pair of humans overlaps with the range observed shared between mice and humans, and between Kymice and mice. The percentage of structural clonotypes shared is lower (B); including CDRH1 and CDRH2 canonical clusters significantly reduces the structural sharing between Kymice and mice.
Figure 7
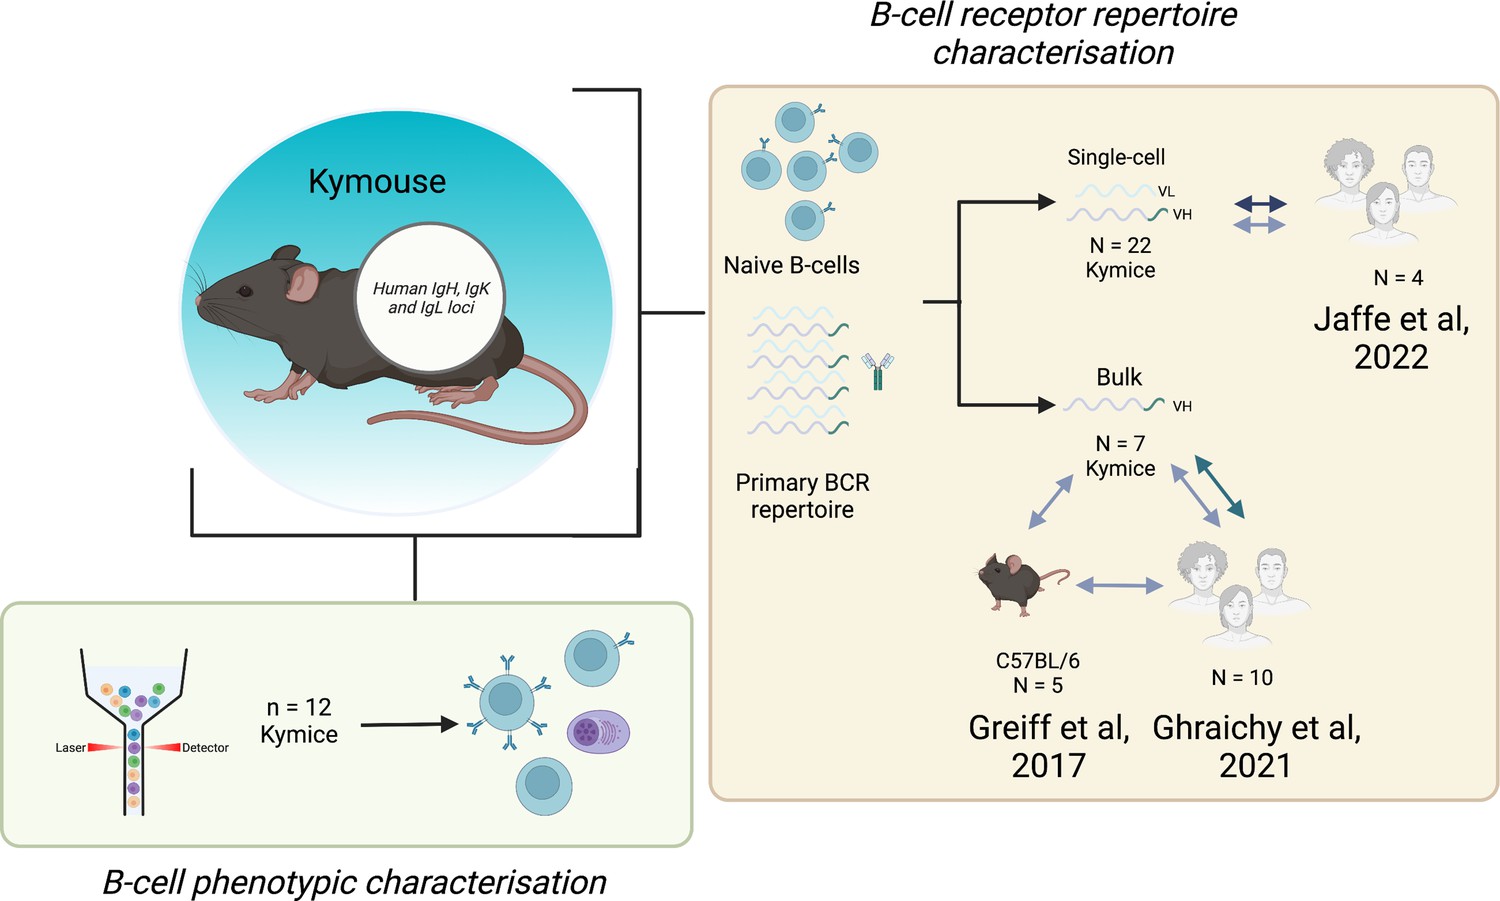
Experimental overview.
The bone marrow, spleen, and inguinal lymph nodes of 22 Kymice were used variously for B-cell phenotypic characterisation (bone marrow) and B-cell receptor (BCR) repertoire characterisation at both the single-cell paired VH/VL (spleen and lymph nodes) and bulk VH level (bone marrow).Single-cell VH/VL data and bulk VH data were analysed in comparison to previously published naïve datasets from C57BL/6 mice and humans.
Additional files
-
Transparent reporting form
- https://cdn.elifesciences.org/articles/81629/elife-81629-transrepform1-v2.pdf
-
Supplementary file 1
Supplementary Tables.
Supplementary File 1a: Dominant canonical forms per IGHV subgroup. Predicting the canonical form based solely on the dominant form observed for the IGHV subgroup would result in accuracy between 46.2% and 100%. Differences can be seen between the Kymouse and human in IGHV1, in which the majority of human sequences are H1-8-A vs. H1-8-C in the Kymouse. Supplementary File 1b: Information about the number of CDRH3 structural clusters produced with different thresholds under the select greedy clustering algorithm. 0.6 Å was the threshold selected by Kovaltsuk et al., 2020, in the original SAAB+ application.
- https://cdn.elifesciences.org/articles/81629/elife-81629-supp1-v2.xlsx
Download links
A two-part list of links to download the article, or parts of the article, in various formats.
Downloads (link to download the article as PDF)
Open citations (links to open the citations from this article in various online reference manager services)
Cite this article (links to download the citations from this article in formats compatible with various reference manager tools)
Characterisation of the immune repertoire of a humanised transgenic mouse through immunophenotyping and high-throughput sequencing
eLife 12:e81629.
https://doi.org/10.7554/eLife.81629


