Early language exposure affects neural mechanisms of semantic representations
- State Key Laboratory of Cognitive Neuroscience and Learning & IDG/McGovern Institute for Brain Research, Beijing Normal University, China
- Beijing Key Laboratory of Brain Imaging and Connectomics, Beijing Normal University, China
- Chinese Institute for Brain Research, China
Figures
Figure 1 with 2 supplements
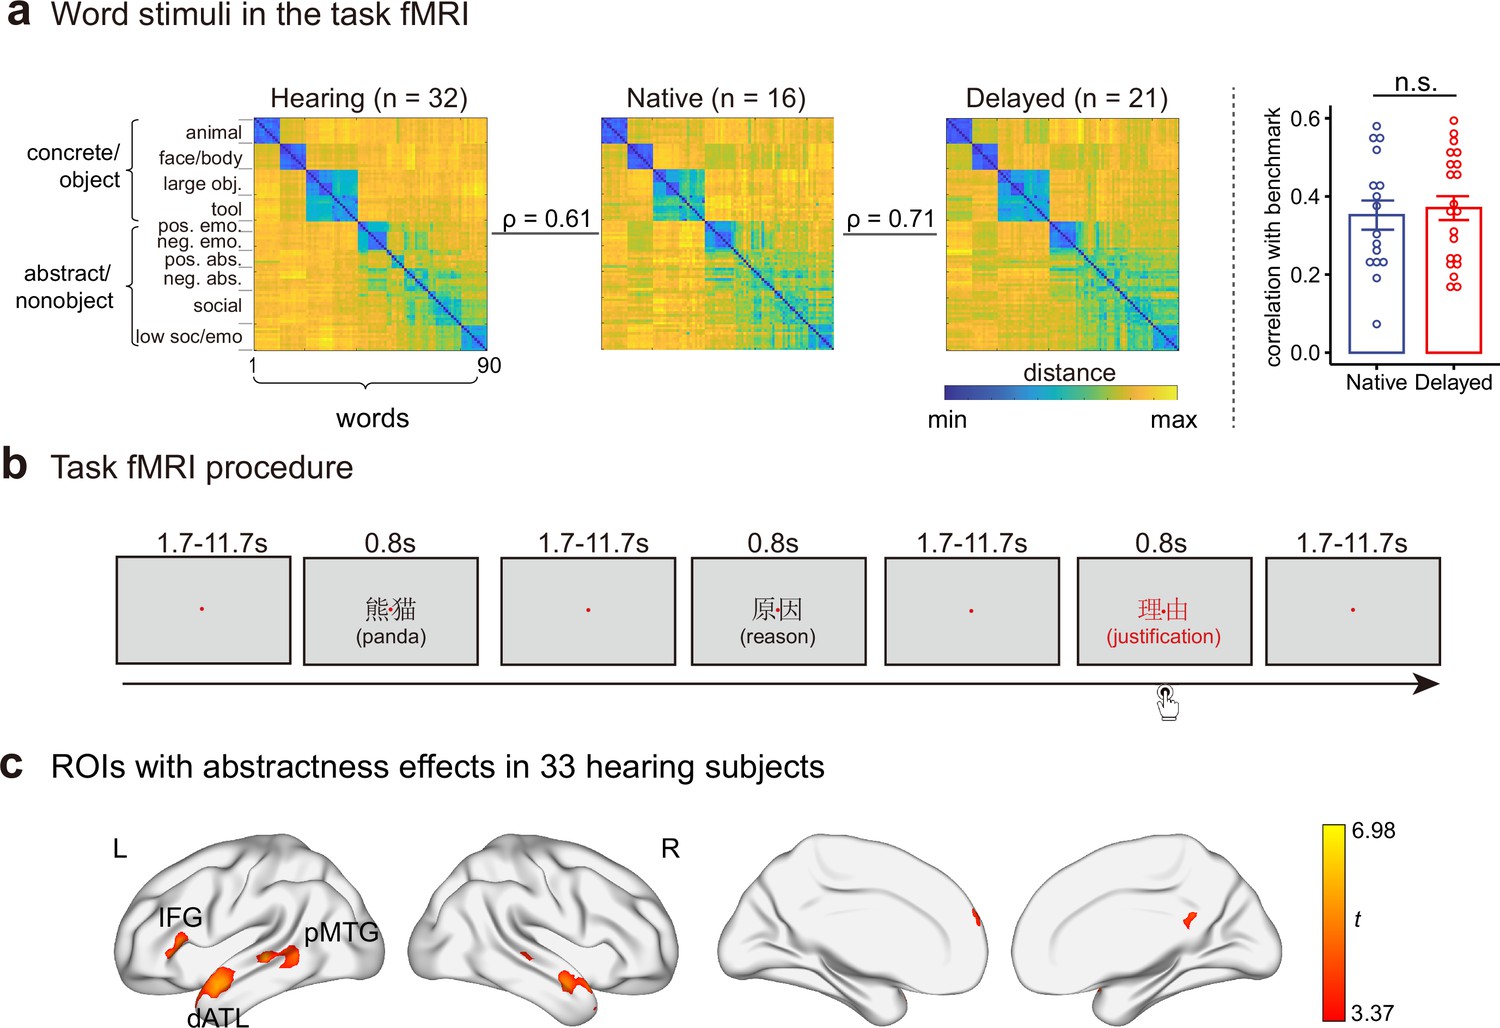
The word stimuli, task fMRI procedure, and regions of interest (ROIs) in this study.
(a) Word stimuli in the task fMRI. Ninety words were used, including 40 concrete/object words and 50 abstract/nonobject words, which were grouped into fine-grained categories based on k-means clustering of the group-averaged semantic space of 32 hearing participants. The left panel shows the group-averaged semantic representational matrices (RDM) in hearing participants, native signers, and delayed signers. The right panel shows the Spearman’s rho between each deaf participant’s semantic RDM and the group-averaged semantic RDM in hearing participants. n = 16 in the native group; n = 21 in the delayed group. Error bars indicate 1 s.e.m. n.s., not significant, p > 0.05, Welch’s t-test. (b) Task fMRI procedure. During scanning, participants were asked to think about each of 90 target word meanings (displayed in black, e.g. ‘panda’, ‘reason’) and to determine whether occasional words displayed in red (catch trials, e.g. ‘justification’) were semantically related to the previous word. There were 90 target word trials (each word appeared once) and 14 catch trials in each run. (c) Semantic ROIs were functionally identified by contrasting abstract/nonobject words with concrete/object words in 33 hearing participants at the threshold of voxel-level p < 0.001, cluster-level FWE-corrected p < 0.05. dATL, dorsal anterior temporal lobe; IFG, inferior frontal gyrus; pMTG, posterior middle temporal gyrus. L, left hemisphere; R, right hemisphere.
-
Figure 1—source data 1
Ninety words in the fMRI task, grouped into 10 semantic clusters based on k-means clustering of the group-mean hearing semantic space.
- https://cdn.elifesciences.org/articles/81681/elife-81681-fig1-data1-v2.docx
-
Figure 1—source data 2
Spearman’s rho between each deaf participant’s semantic representational distance matrix (RDM) and the group-averaged semantic RDM in hearing participants.
- https://cdn.elifesciences.org/articles/81681/elife-81681-fig1-data2-v2.xlsx
-
Figure 1—source data 3
Details of semantic regions of interest (ROIs), including cluster location, extent, peak t values, and Montreal Neurological Institute (MNI) coordinates.
- https://cdn.elifesciences.org/articles/81681/elife-81681-fig1-data3-v2.docx
Figure 1—figure supplement 1
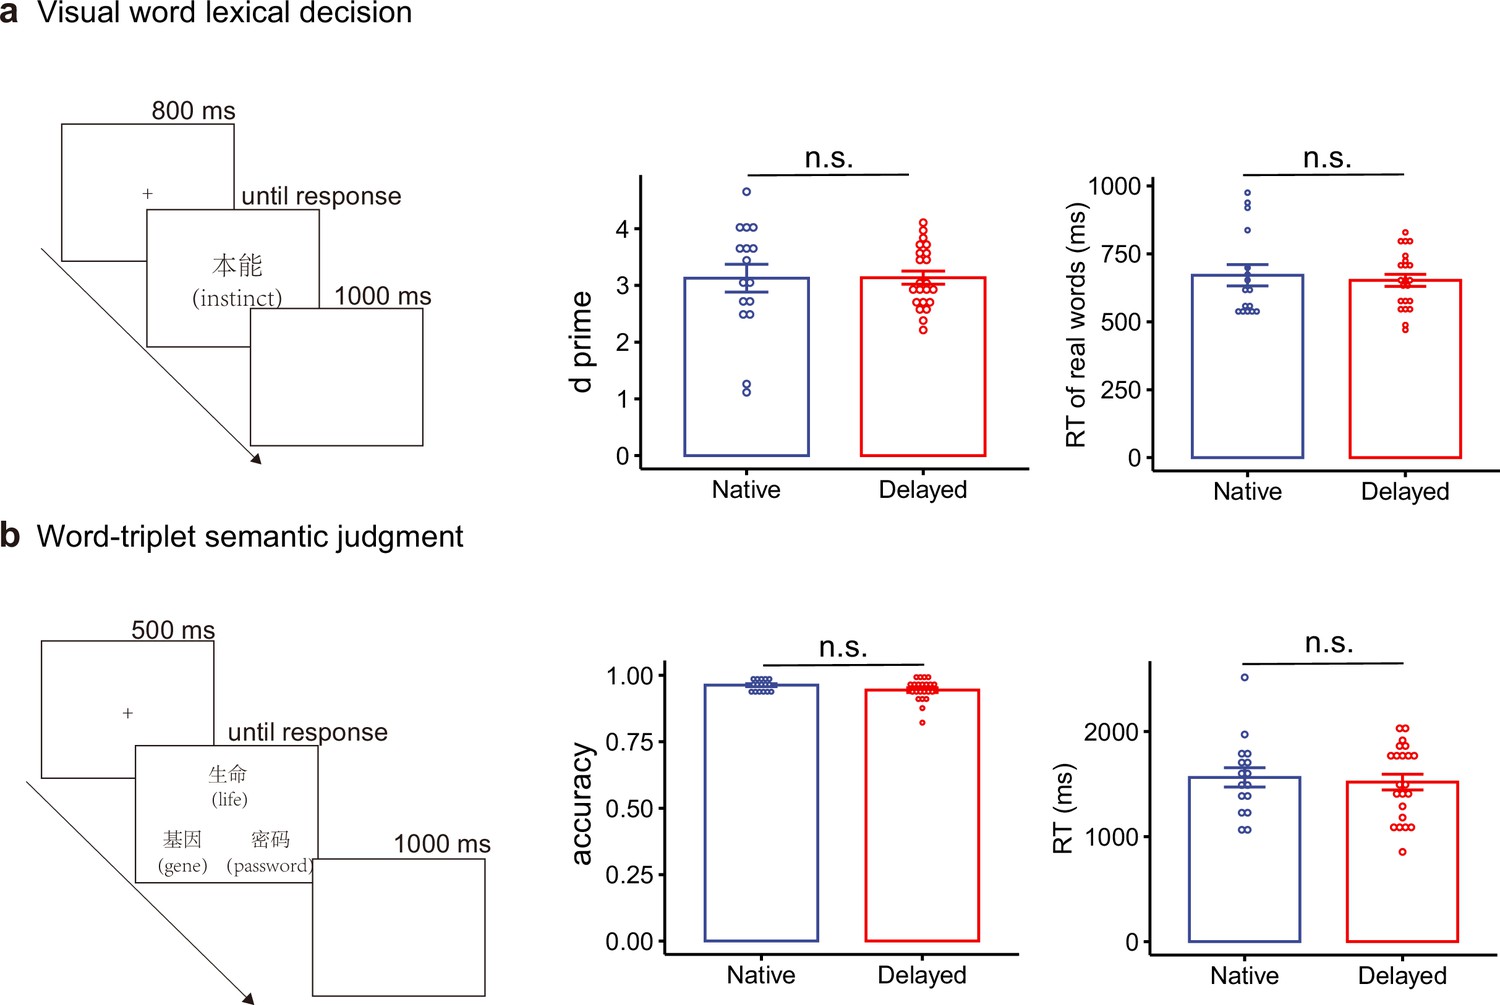
Written word processing performances of the two deaf groups in two reaction-time tasks.
(a) Lexical decision task, in which participants were asked to decide whether a two-Chinese-character written stimulus denoted a real word or a pseudoword via button press. In each trial, a fixation point was presented for 800 ms, followed by a Chinese stimulus (font SONG, size 40). The stimulus disappeared upon the response and the next trial started 1 s later. The stimuli were 100 two-character Chinese nouns (word frequency, range: 0–1491 per million; Sun et al., 1997; number of strokes: range: 8–25) and 100 two-character pseudowords created by pseudo-randomly combining two characters of 100 real words. Bar plots show the d-prime and reaction time of real-word trials. d-Prime was calculated using the Signal Detection Theory Calculator (version 1.2) provided by Gaetano, 2017. (b) Word-triplet semantic judgment task, in which participants were presented with three 2-character Chinese words and asked to decide which of the two choice words (bottom) was more semantically related to the probe word (top) via button press. In each trial, a fixation point was presented for 500 ms, followed by three Chinese words (font SONG, size 40), with the probe word presented at the top and two choice words arranged horizontally at the bottom. The stimuli disappeared upon the response and the next trial started 1 s later. The stimuli were 80 triplets of two-character Chinese words (word frequency, range: 0–2340 per million; total number of strokes, range: 6–31), with all but four primarily used as nouns. Bar plots show overall accuracy and reaction time of correct trials. n = 16 in the native group; n = 22 in the delayed group. Error bars indicate 1 s.e.m. n.s., not significant, p > 0.05, Welch’s t-test.
Figure 1—figure supplement 2
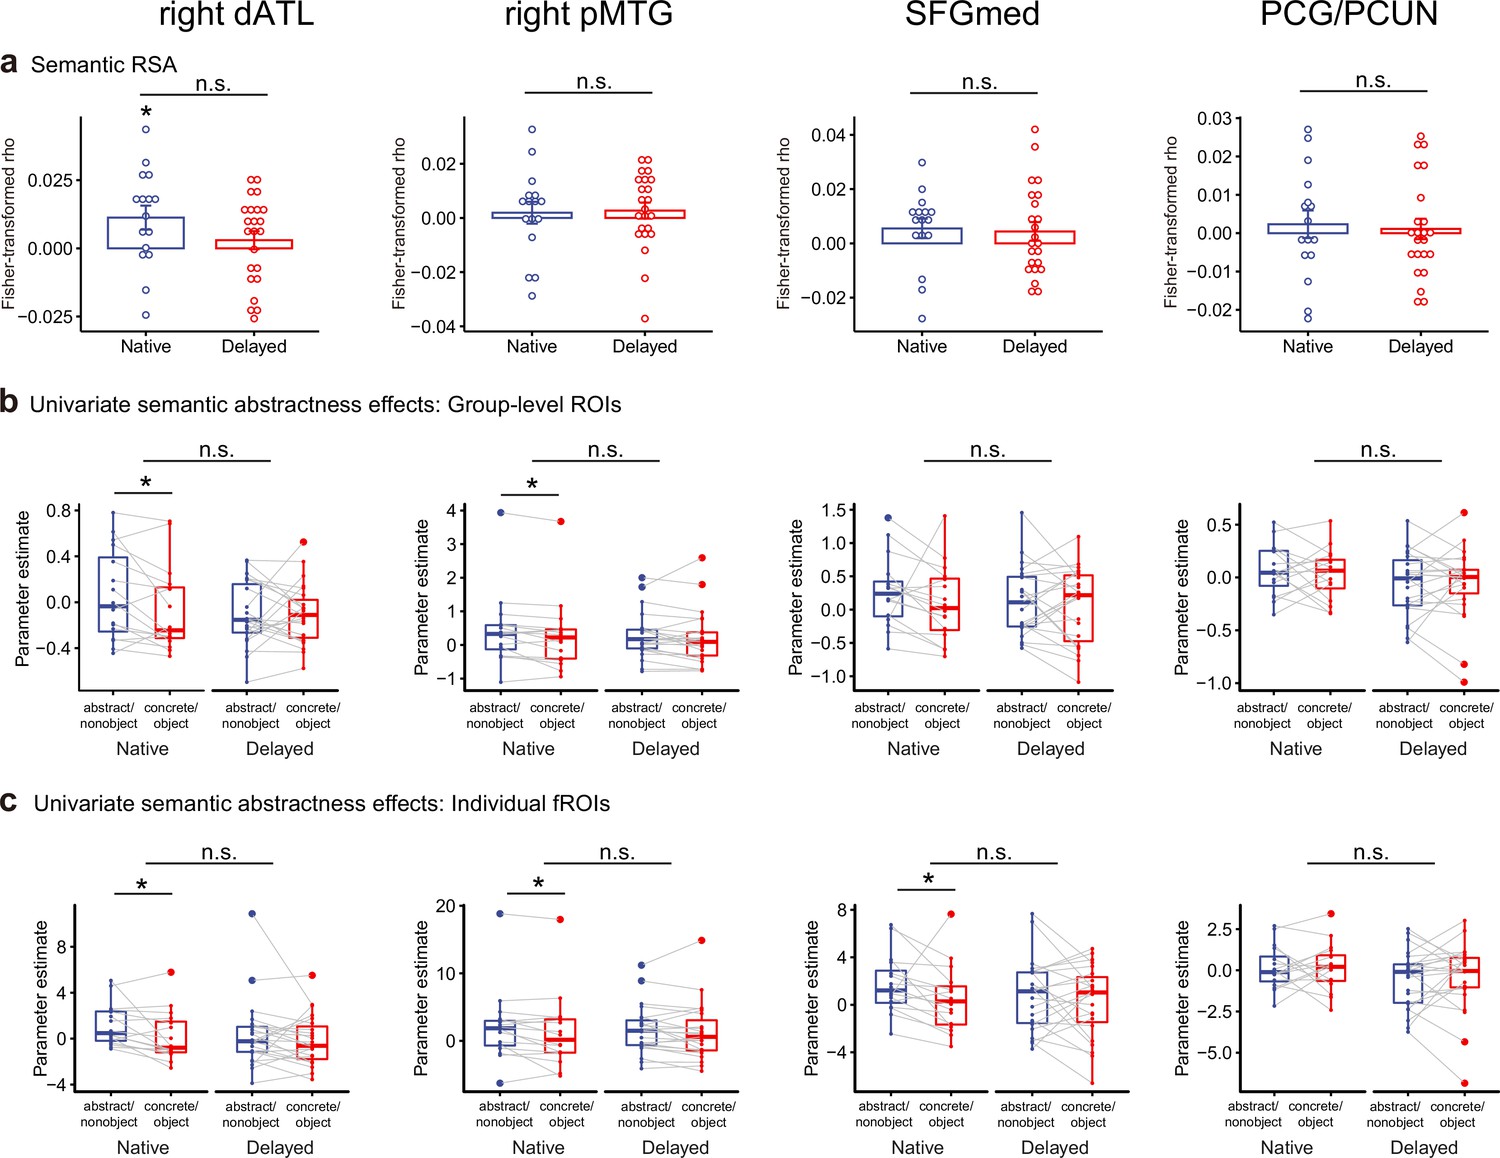
Representational similarity analysis (RSA) and univariate results in other regions of interest (ROIs) (except for the left dATL, inferior frontal gyrus [IFG], and pMTG) in the two deaf groups.
dATL, dorsal anterior temporal lobe; pMTG, posterior middle temporal gyrus; SFGmed, superior frontal gyrus, medial; PCG, posterior cingulate gyrus; PCUN, precuneus. n.s., not significant, p > 0.05; *, p < 0.05. n = 16 in the native group; n = 23 in the delayed group. In (a), RSA results were assessed using one-sample t-tests (one-tailed) for each group; group differences were examined using two-tailed Welch’s t-tests. In (b), beta values of the two word types were compared using one-tailed paired t-tests for each group; group effects were assessed using two-way analysis of variance.
Figure 2 with 1 supplement
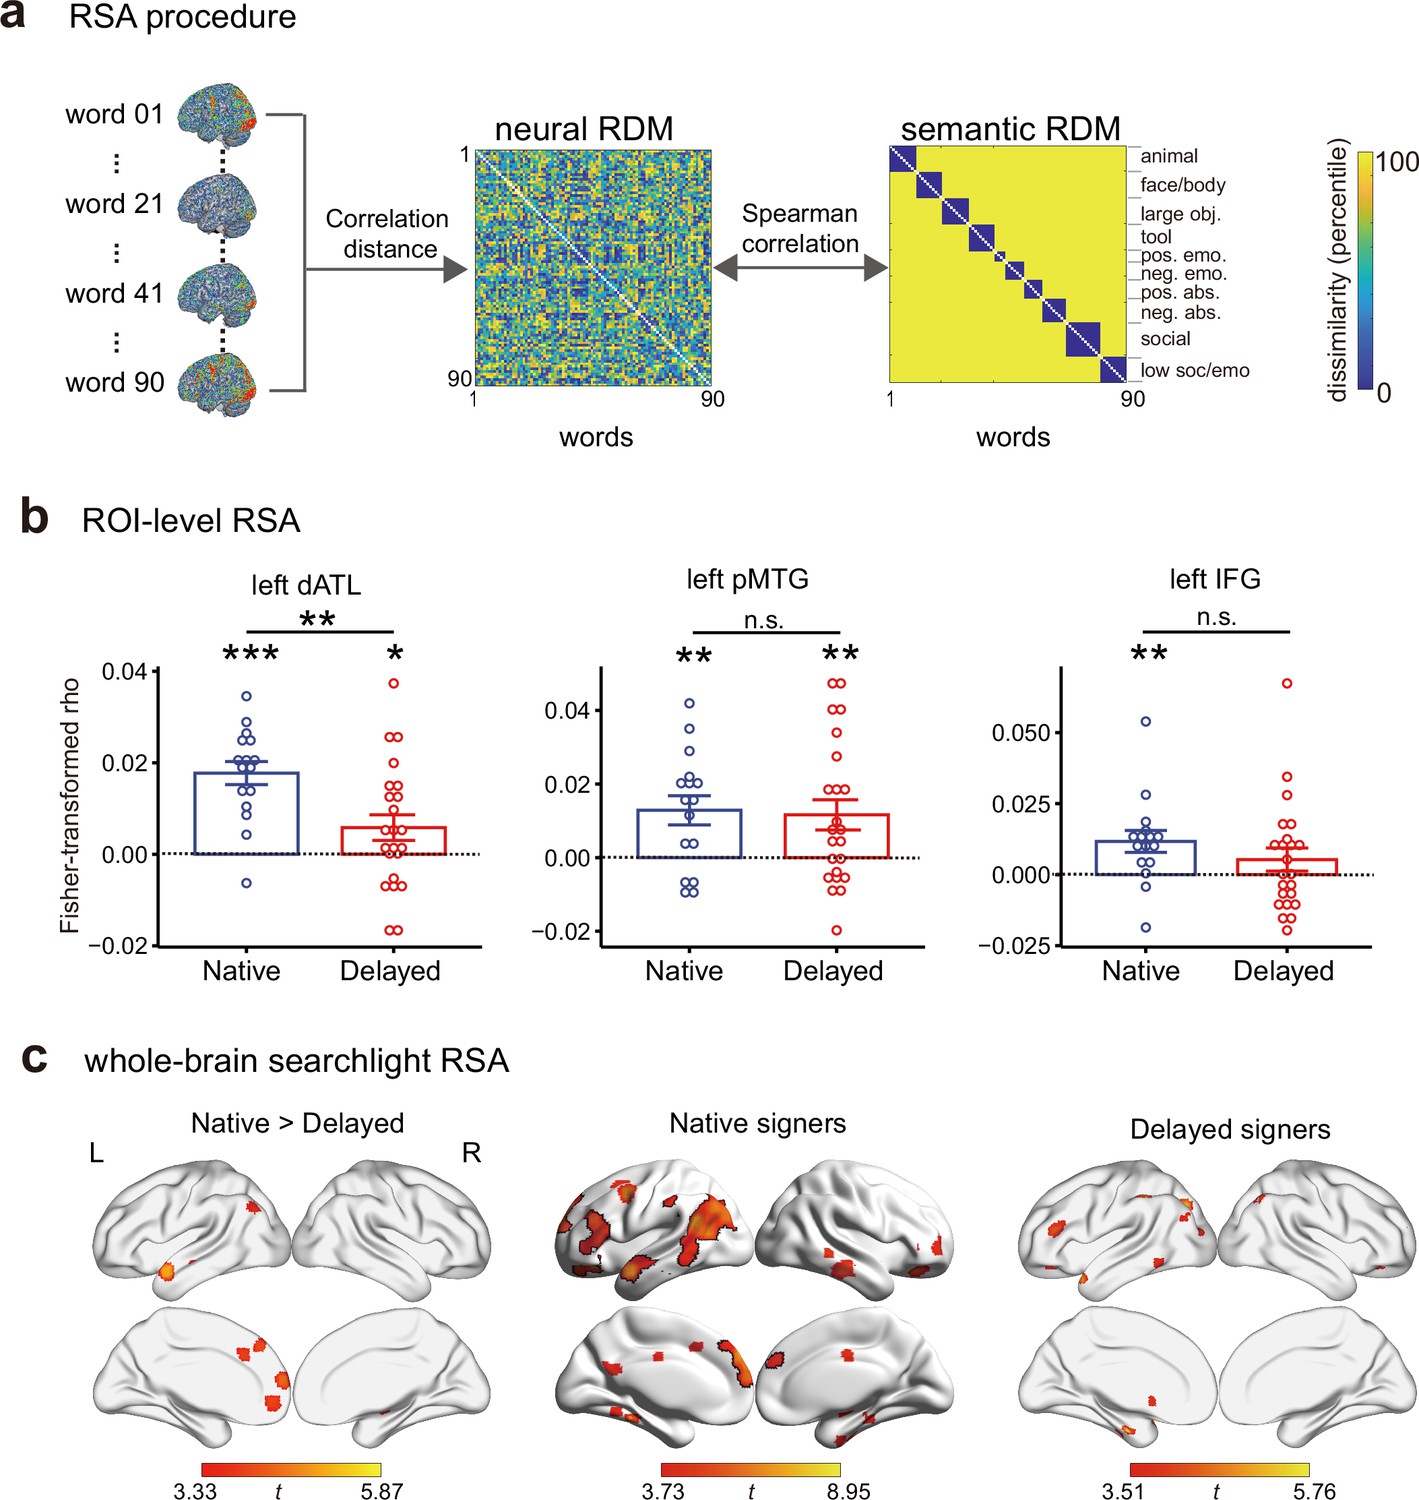
Effects of early language exposure on neural representations of semantic knowledge.
(a) Representational similarity analysis (RSA) procedure. For each participant, a neural representational distance matrix (RDM) was computed as the correlation distance of multivoxel activity patterns (in a given regions of interest [ROI]) for each pair of words and then correlated with the hearing-group-level semantic category RDM to quantify semantic information encoded in the neural RDM. (b) ROI-level RSA results. Error bars indicate 1 s.e.m. n.s., not significant, p > 0.05; *, p < 0.05; **, p < 0.01; ***, p < 0.001. ROI results were assessed using one-sample t-tests (one-tailed) for each group; group differences were examined using two-tailed Welch’s t-tests. dATL, dorsal anterior temporal lobe; pMTG, posterior middle temporal gyrus; IFG, inferior frontal gyrus. (c) Whole-brain searchlight RSA results. The statistical maps were thresholded at voxel-level p < 0.001, cluster size > 10 voxels. Brain results were visualized using the ‘Maximum Voxel’ mapping algorithm in BrainNet Viewer to illustrate small clusters. Clusters in black lines survived the cluster-level FWE-corrected p < 0.05. L, left hemisphere; R, right hemisphere. n = 16 in the native group; n = 23 in the delayed group.
-
Figure 2—source data 1
Region of interest (ROI)-level representational similarity analysis (RSA) results in the two deaf groups.
- https://cdn.elifesciences.org/articles/81681/elife-81681-fig2-data1-v2.xlsx
-
Figure 2—source data 2
Cluster details of the whole-brain searchlight representational similarity analysis (RSA) results.
- https://cdn.elifesciences.org/articles/81681/elife-81681-fig2-data2-v2.docx
Figure 2—figure supplement 1
Whole-brain representational similarity analysis (RSA) results of pixelwise similarity of visual words in the two deaf groups.
The neural effects were thresholded at voxel-level p < 0.001, cluster-level FWE-corrected p < 0.05. L, left hemisphere. n = 16 in the native group; n = 23 in the delayed group.
Figure 3
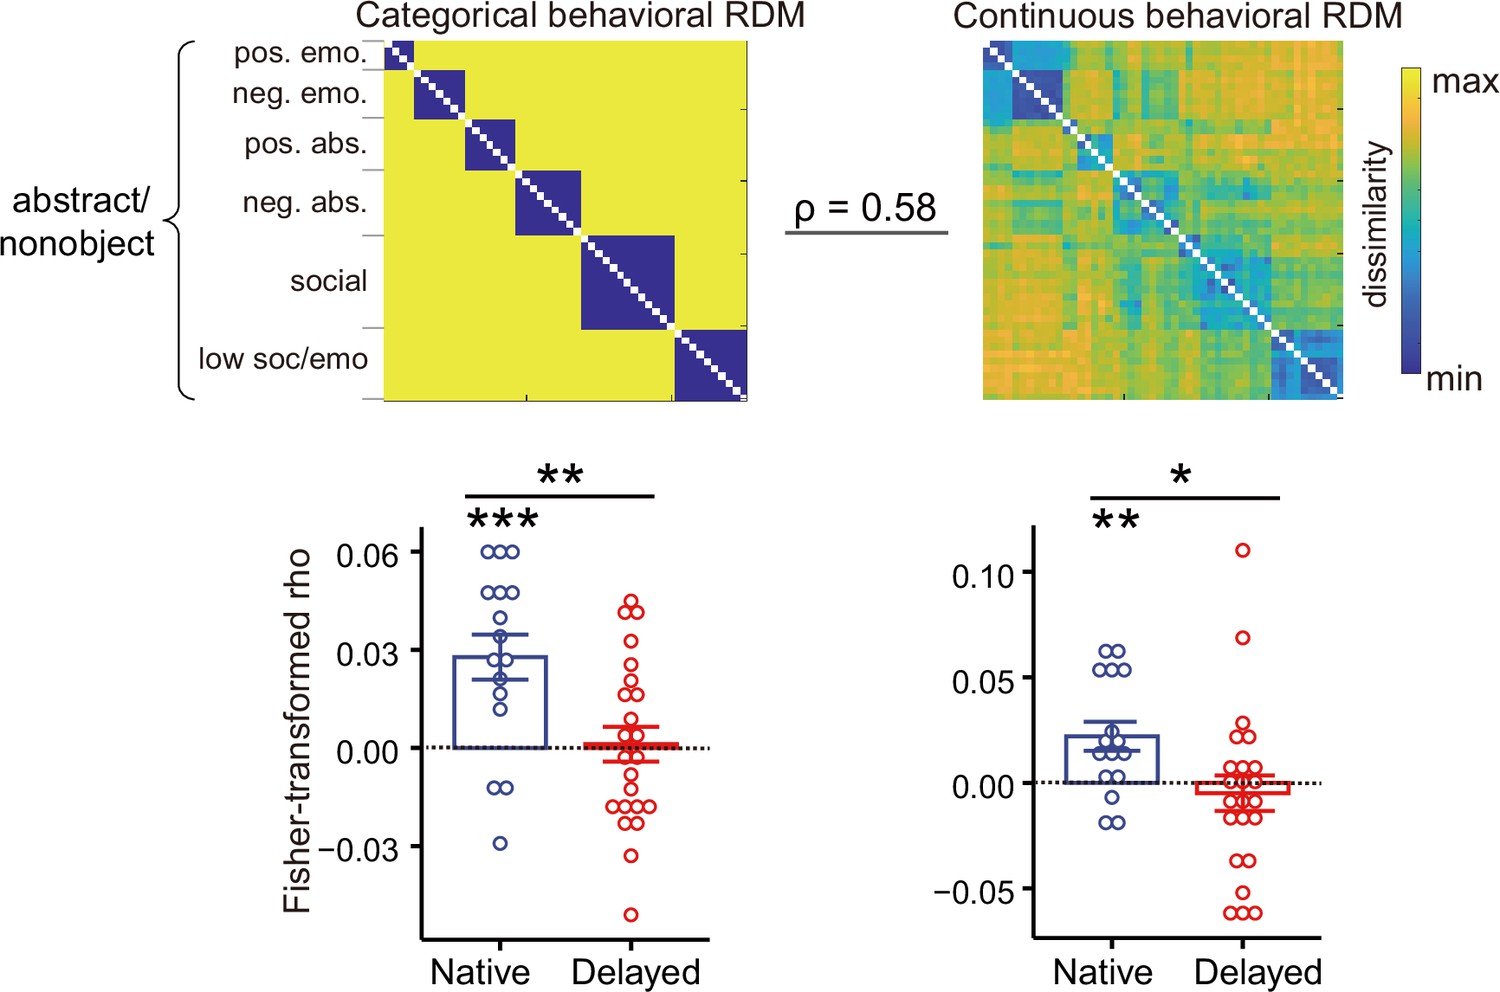
Effects of early language exposure on neural representations of abstract/nonobject words in the left dorsal anterior temporal lobe (dATL).
The two representational distance matrices (RDMs) at the top illustrate the categorical and the continuous behavioral semantic RDMs of 50 abstract/nonobject words constructed in an independent group of hearing individuals. The bar plots at the bottom show the Fisher-transformed Spearman’s correlations between the neural and semantic RDMs for each deaf subject. Error bars indicate 1 s.e.m. *, p < 0.05; **, p < 0.01; ***, p < 0.001. RSA results were assessed using one-sample t-tests (one-tailed) for each group; group differences were examined using two-tailed Welch’s t-tests. n = 16 in the native group; n = 23 in the delayed group.
-
Figure 3—source data 1
Representational similarity analysis (RSA) results for the abstract/nonobject words in the two deaf groups.
- https://cdn.elifesciences.org/articles/81681/elife-81681-fig3-data1-v2.xlsx
Figure 4
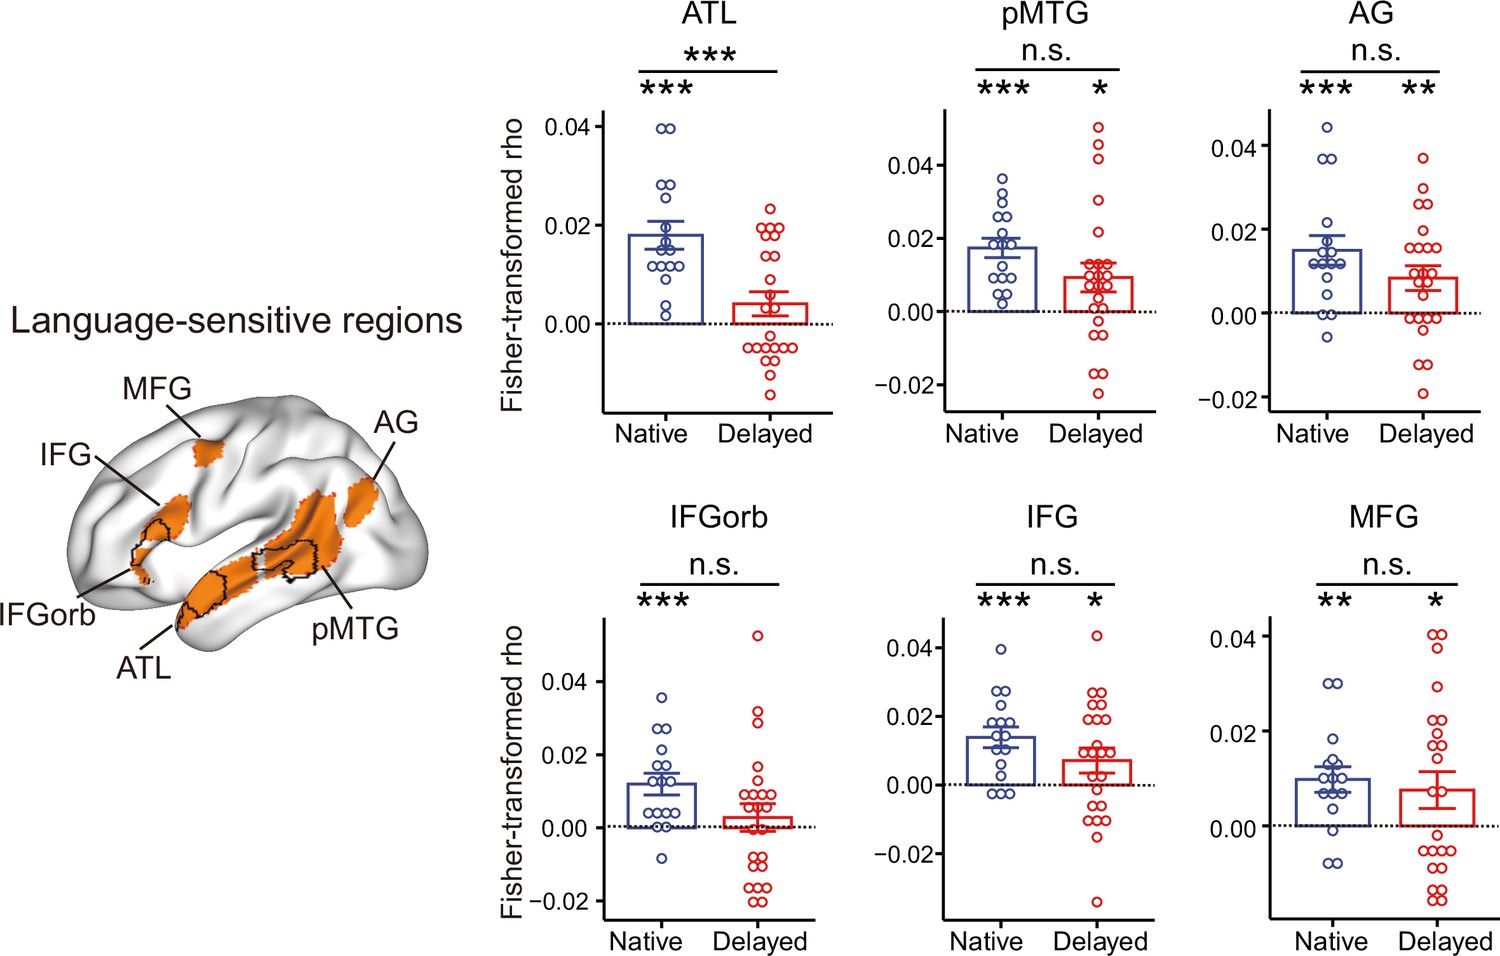
Effects of early language exposure on neural representations of semantic knowledge in language-sensitive regions.
The left panel shows the language-sensitive regions of interest (ROIs) (Fedorenko et al., 2010) and the black lines indicate the three ROIs we functionally localized. Bar plots show the Fisher-transformed Spearman’s correlations between the neural and the semantic category RDMs for each deaf subject. Error bars indicate 1 s.e.m. n.s., not significant, p > 0.05; *, p < 0.05; **, p < 0.01; ***, p < 0.001. RSA results were assessed using one-sample t-tests (one-tailed) for each group; group differences were examined using two-tailed Welch’s t-tests. ATL, anterior temporal lobe; pMTG, posterior middle temporal gyrus; AG, angular gyrus; IFGorb, the orbital part of the inferior frontal gyrus; IFG, inferior frontal gyrus; MFG, middle frontal gyrus. n = 16 in the native group; n = 23 in the delayed group.
-
Figure 4—source data 1
Representational similarity analysis (RSA) results in language-sensitive regions of interest (ROIs) in the two deaf groups.
- https://cdn.elifesciences.org/articles/81681/elife-81681-fig4-data1-v2.xlsx
Figure 5 with 1 supplement
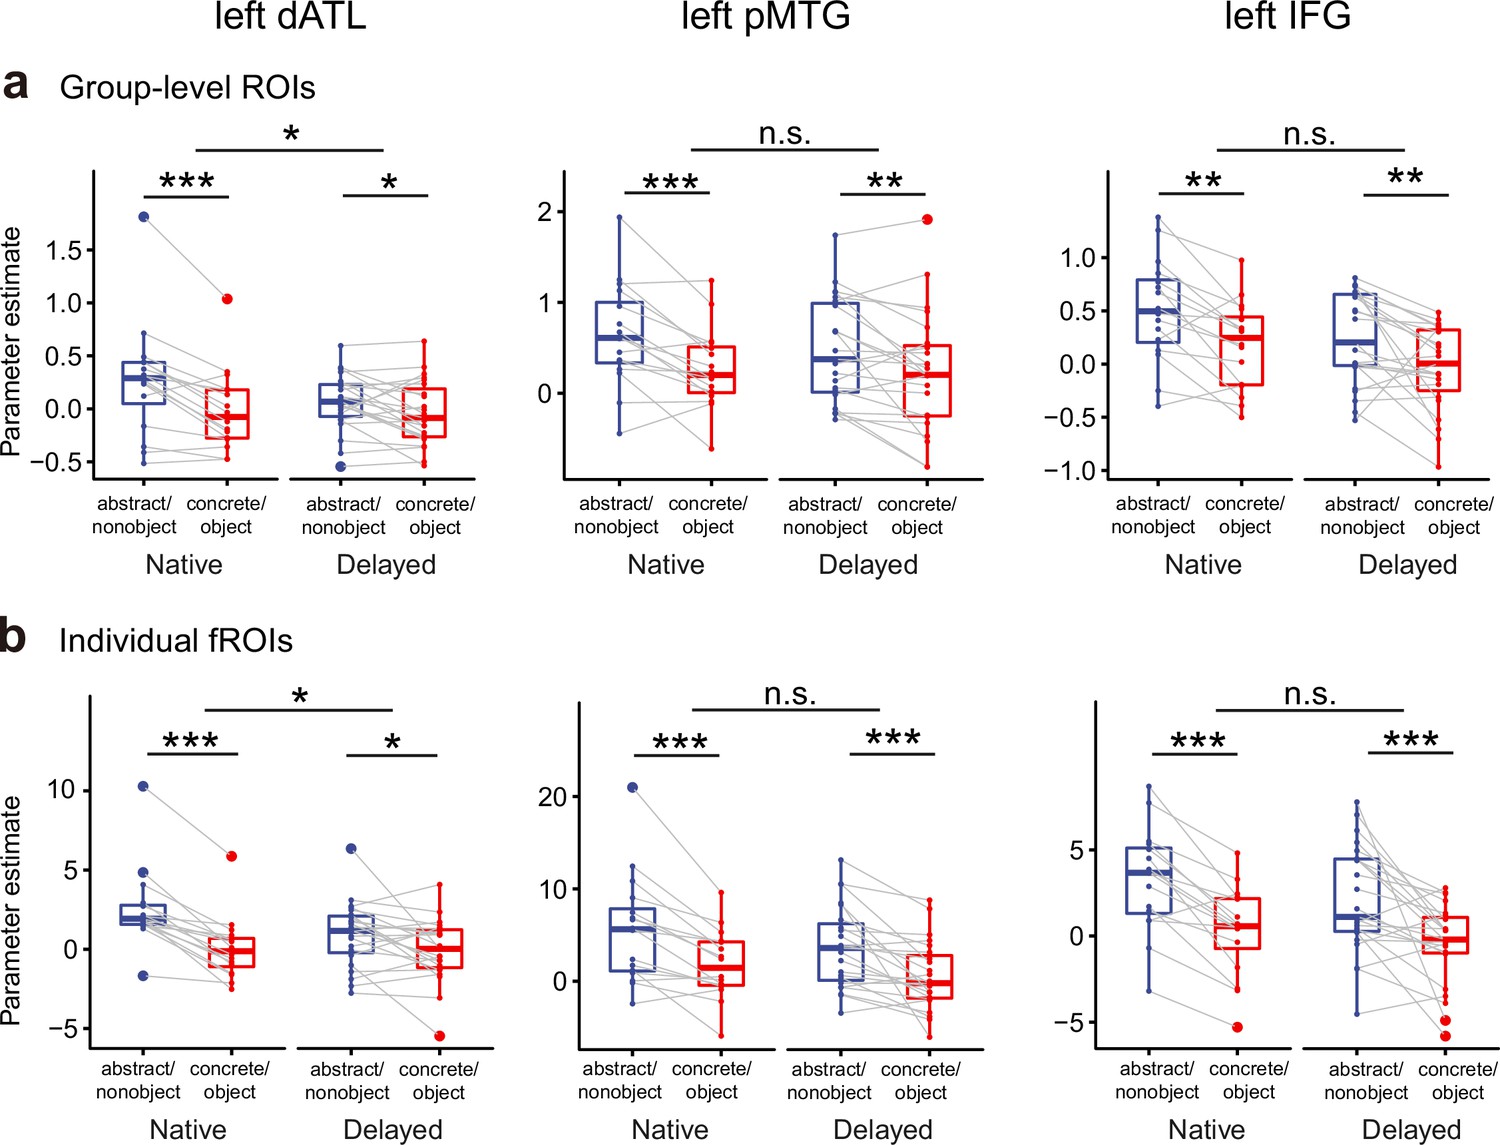
Effects of early language exposure on the univariate semantic abstractness effects in group-level-defined semantic regions of interest (ROIs) (a) and individual functional ROIs (fROIs) (b).
Boxplots show beta values to abstract/nonobject words and concrete/object words in the three ROIs (the left dorsal anterior temporal lobe [dATL], posterior middle temporal region [pMTG], and inferior frontal gyrus [IFG]). n.s., not significant, p > 0.05; *, p < 0.05; **, p < 0.01; ***, p < 0.001. Beta values of the two word types were compared using one-tailed paired t-tests for each group; group effects were assessed using two-way analysis of variance. n=16 in the native group; n = 23 in the delayed group.
-
Figure 5—source data 1
Raw beta values to abstract/nonobject words and concrete/object words in group-level-defined semantic regions of interest (ROIs) and individual functional ROIs (fROIs) in the two deaf groups.
- https://cdn.elifesciences.org/articles/81681/elife-81681-fig5-data1-v2.xlsx
Figure 5—figure supplement 1
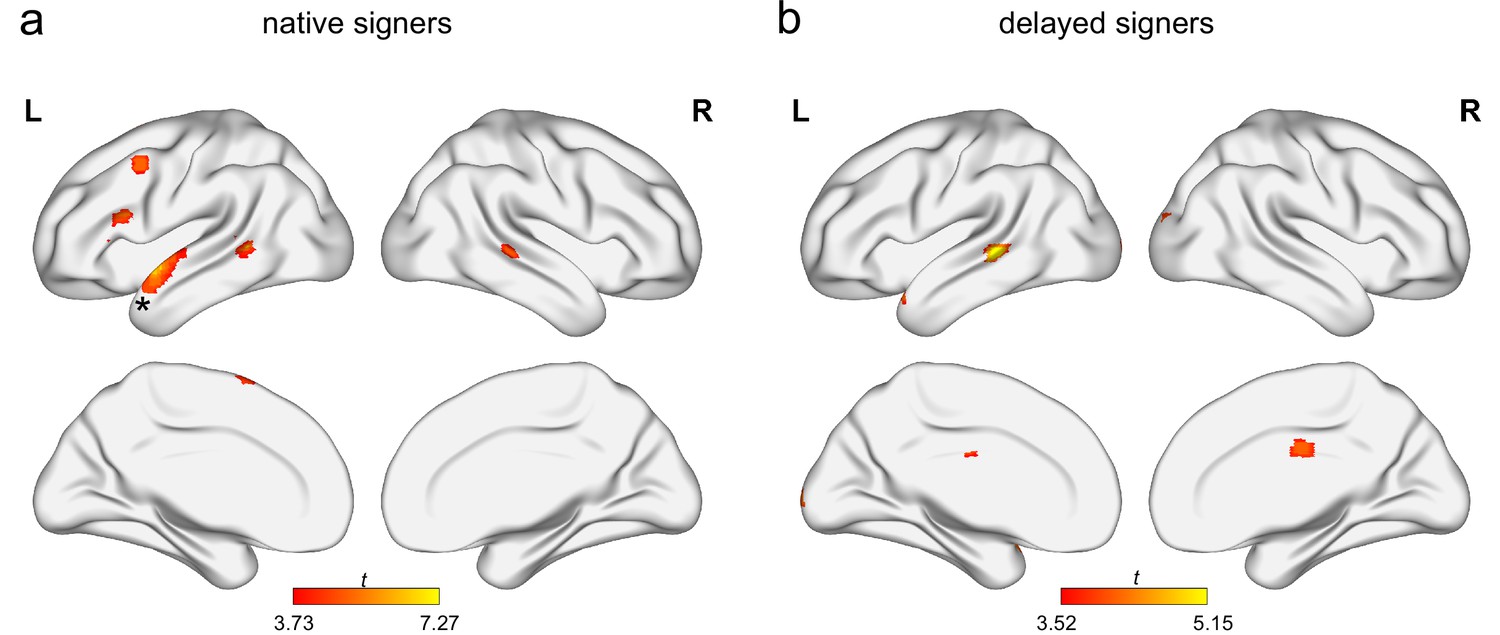
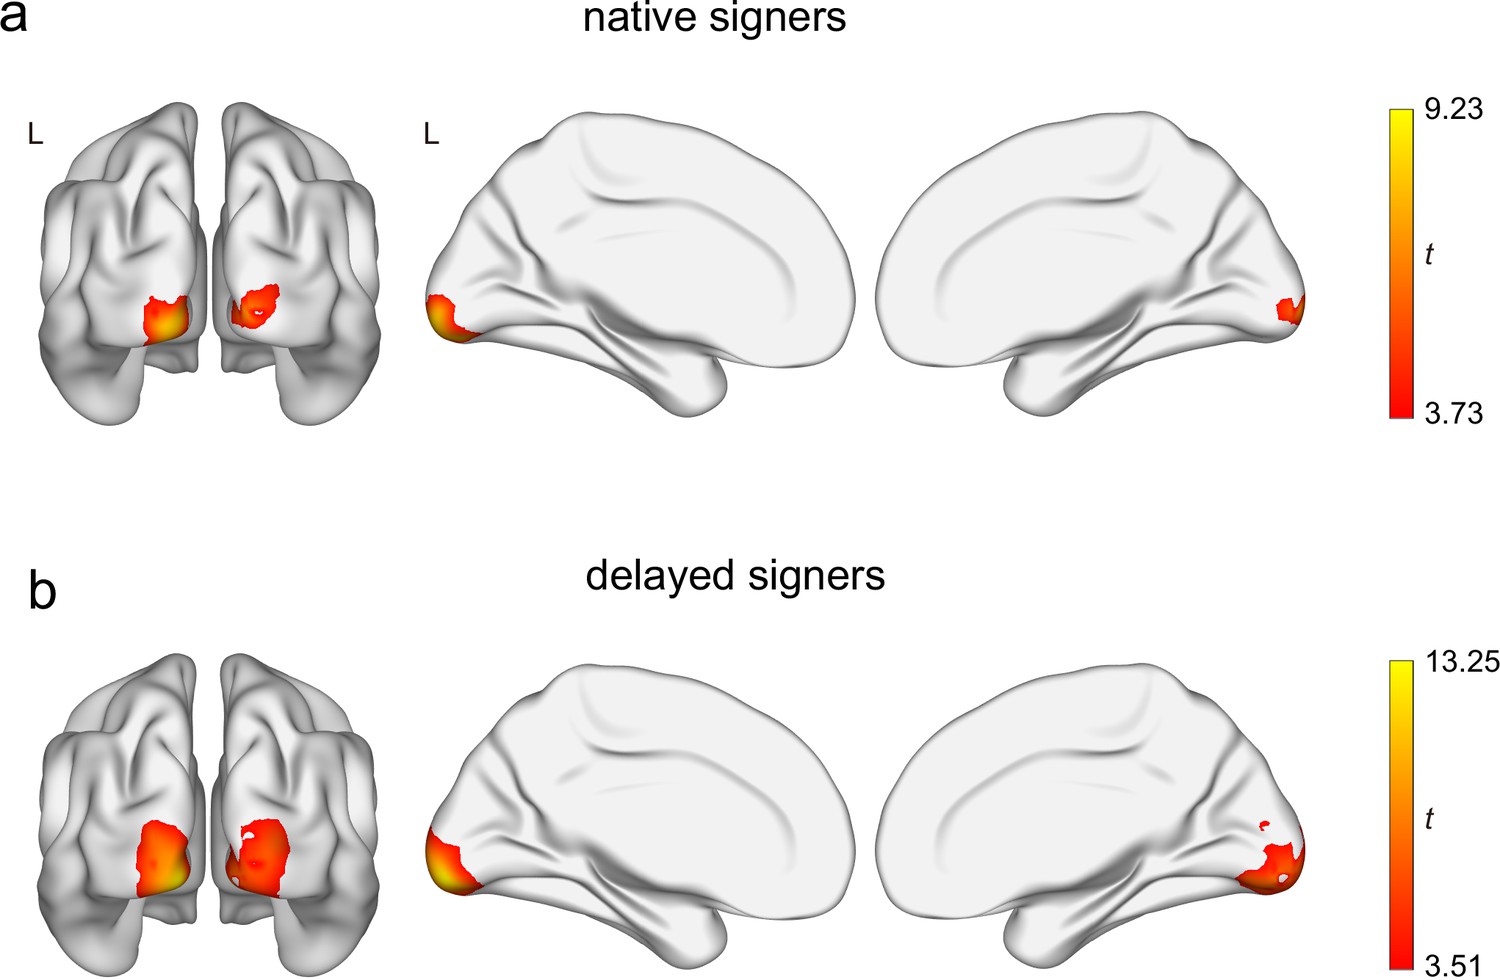
Whole-brain univariate results of semantic abstractness in native and delayed signers.
The statistical maps were thresholded at voxel-level p < 0.001, cluster sizes > 10 voxels, and visualized using the ‘Maximum Voxel’ mapping algorithm in BrainNet Viewer to illustrate small clusters. Clusters labeled with an asterisk survived the threshold of voxel-level p < 0.001, cluster-level FWE-corrected p < 0.05 (left dorsal anterior temporal lobe [dATL] in native signers, peak Montreal Neurological Institute [MNI] coordinates: –58, 4, -8, peak t = 7.27, 209 voxels). L, left hemisphere; R, right hemisphere. n = 16 in the native group; n = 23 in the delayed group.
Tables
Table 1
Background demographic and language information of native and delayed signers.
| Native(n=16) | Delayed(n=23) | Welch’s t | p-Value | Hedges' g | |
|---|---|---|---|---|---|
| AoA of CSL (years of age) | 0±0 | 6.91±1.62 | |||
| Parental CSL proficiency (1–7 scale)* § | 6.81±0.54 | 2.74±1.29 | 13.54 | <0.001 | 4.04 |
| Demographic information | |||||
| Gender | 11 M, 5 F | 12 M, 11 F | |||
| Age (years) | 28.50±7.13 | 27.09±5.87 | 0.65 | 0.52 | 0.21 |
| Education (years) | 14.13±2.31 | 15.09±1.41 | –1.49 | 0.15 | –0.49 |
| McArthur Scale of Subjective Social Status, childhood (1–10 scale)† | 3.88±2.58 | 4.35±1.97 | –0.62 | 0.54 | –0.20 |
| Father’s education (years) § | 7.19±3.04 | 10.39±2.84 | –3.33 | 0.002 | –1.07 |
| Mother’s education (years) | 6.56±3.14 | 8.52±2.73 | –2.02 | 0.053 | –0.65 |
| Language information | |||||
| CSL comprehension (1–7 scale)* | 6.06±0.93 | 6.17±0.89 | –0.38 | 0.71 | –0.12 |
| CSL production (1–7 scale)* | 5.75±1.00 | 5.87±1.10 | –0.35 | 0.73 | –0.11 |
| Lipreading of acquaintances (1–7 scale)* | 2.81±1.11 | 3.17±1.19 | –0.97 | 0.34 | –0.31 |
| Lipreading of strangers (1–7 scale)* | 1.88±0.81 | 1.87±0.97 | 0.02 | 0.99 | 0.01 |
| Adult Reading History Questionnaire (ARHQ, 1–5 scale)‡ | 2.59±0.68 | 2.84±0.52 | –1.25 | 0.22 | –0.41 |
| ARHQ, Item 26, self-rated reading speed (1–5 scale)‡ | 2.38±1.36 | 3.13±1.01 | –1.89 | 0.07 | –0.62 |
| ARHQ, Item 29, self-rated writing skills (1–5 scale)‡ § | 2.25±1.00 | 3.17±0.94 | –2.91 | 0.007 | –0.93 |
| ARHQ, Item 40, self-rated reading comprehension (1–5 scale)‡ | 2.44±0.81 | 2.70±0.97 | –0.90 | 0.38 | –0.28 |
-
*
Higher scores indicate higher proficiency.
-
†
Higher scores indicate higher social status; from Adler et al., 2000.
-
‡
Higher scores indicate a higher risk of reading disability; from Lefly and Pennington, 2000.
-
§
p < 0.01, significant differences between the two deaf groups.
-
Table 1—source data 1
Background demographic and language information of native and delayed signers.
- https://cdn.elifesciences.org/articles/81681/elife-81681-table1-data1-v2.xlsx
Additional files
Download links
A two-part list of links to download the article, or parts of the article, in various formats.
Downloads (link to download the article as PDF)
Open citations (links to open the citations from this article in various online reference manager services)
Cite this article (links to download the citations from this article in formats compatible with various reference manager tools)
Early language exposure affects neural mechanisms of semantic representations
eLife 12:e81681.
https://doi.org/10.7554/eLife.81681


