Object representation in a gravitational reference frame
- Department of Biomedical Engineering, Johns Hopkins University School of Medicine, United States
- Zanvyl Krieger Mind/Brain Institute, Johns Hopkins University, United States
- Solomon H. Snyder Department of Neuroscience, Johns Hopkins University School of Medicine, United States
Figures
Figure 1 with 10 supplements
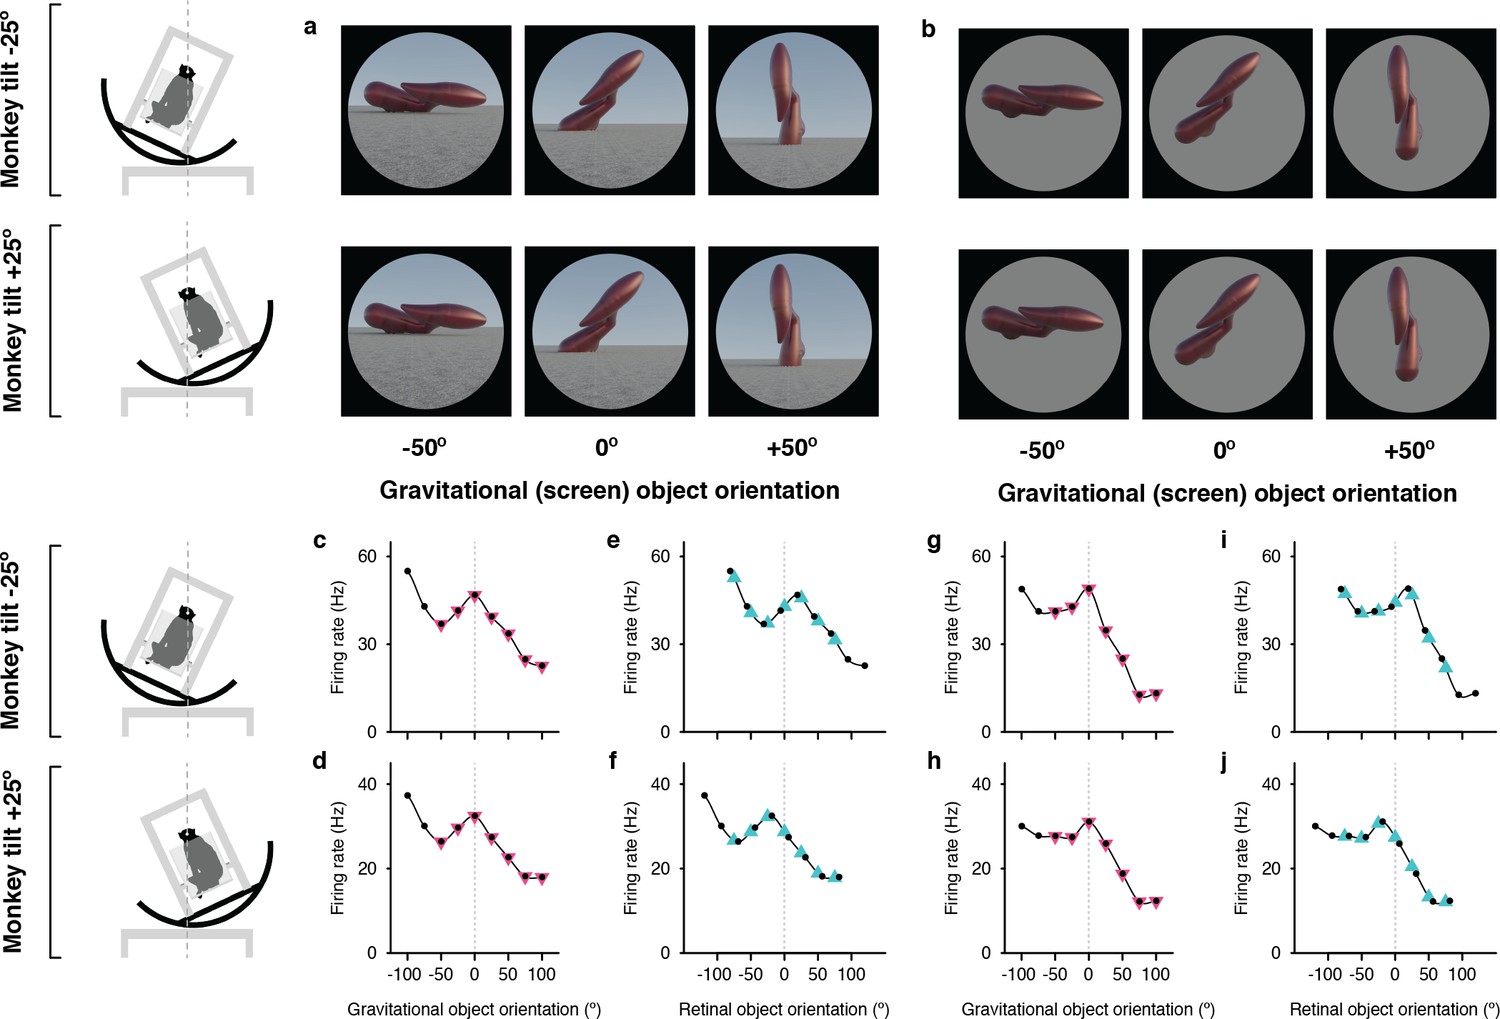
Example neuron tuned for object orientation in a gravitational reference frame.
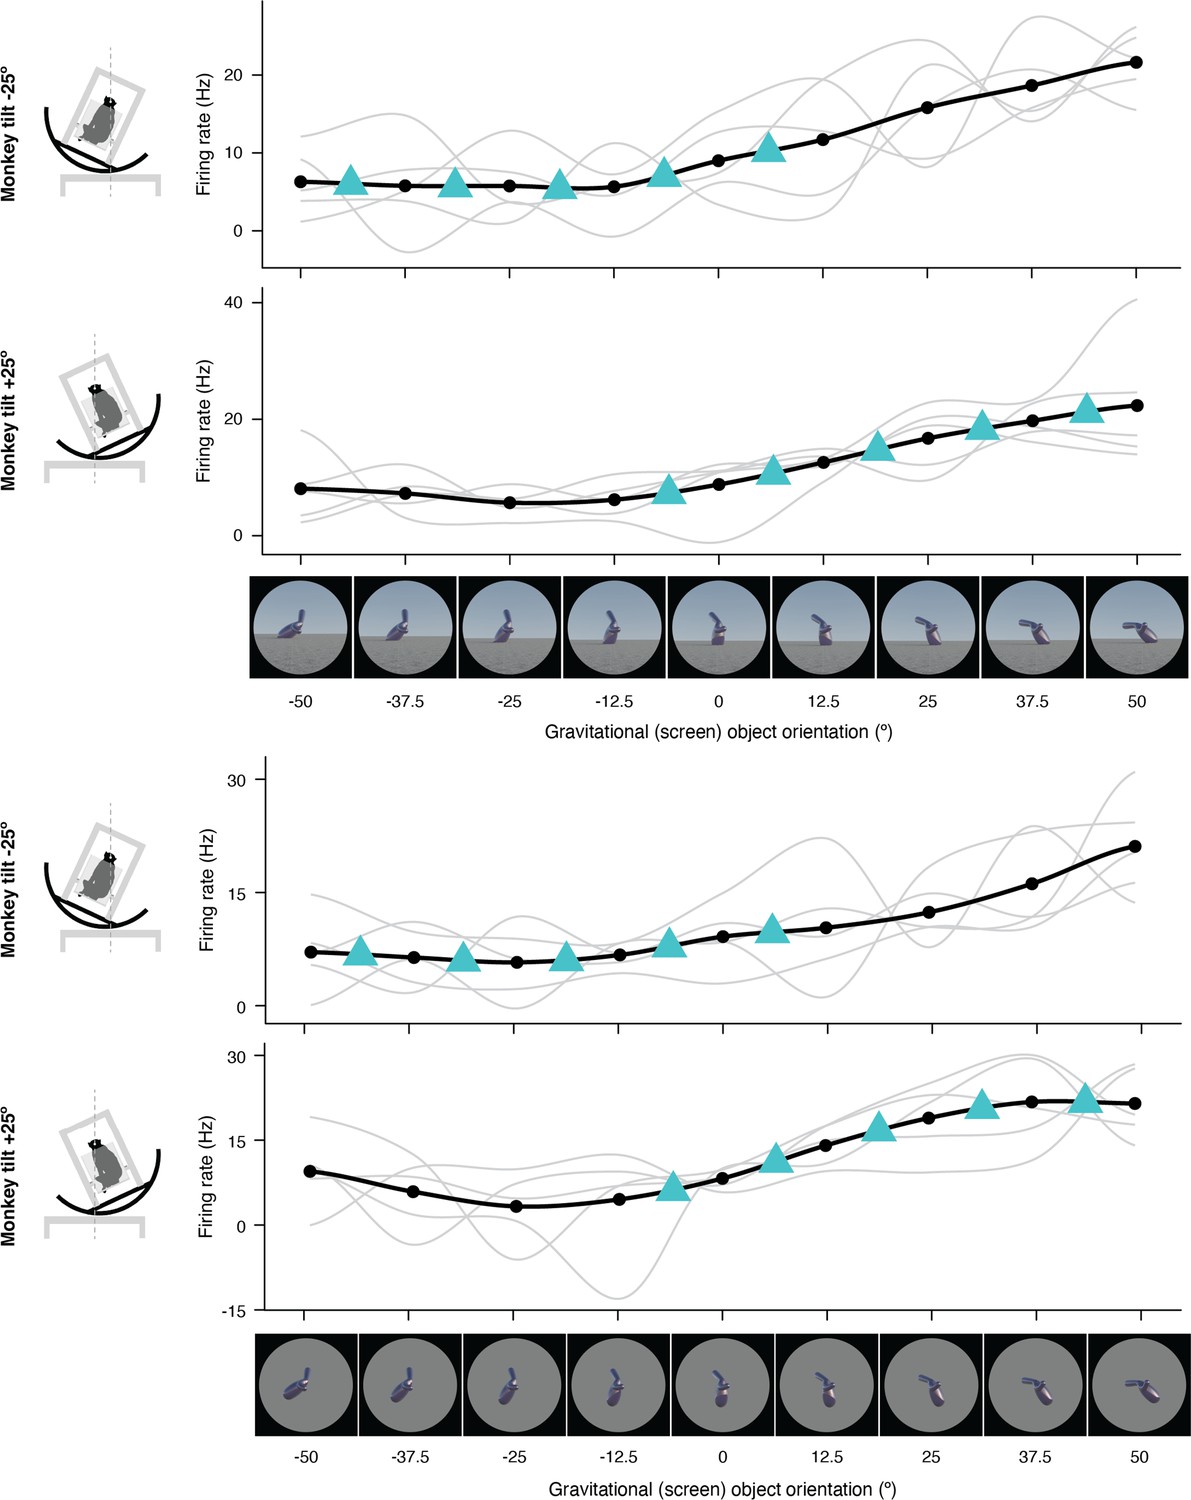
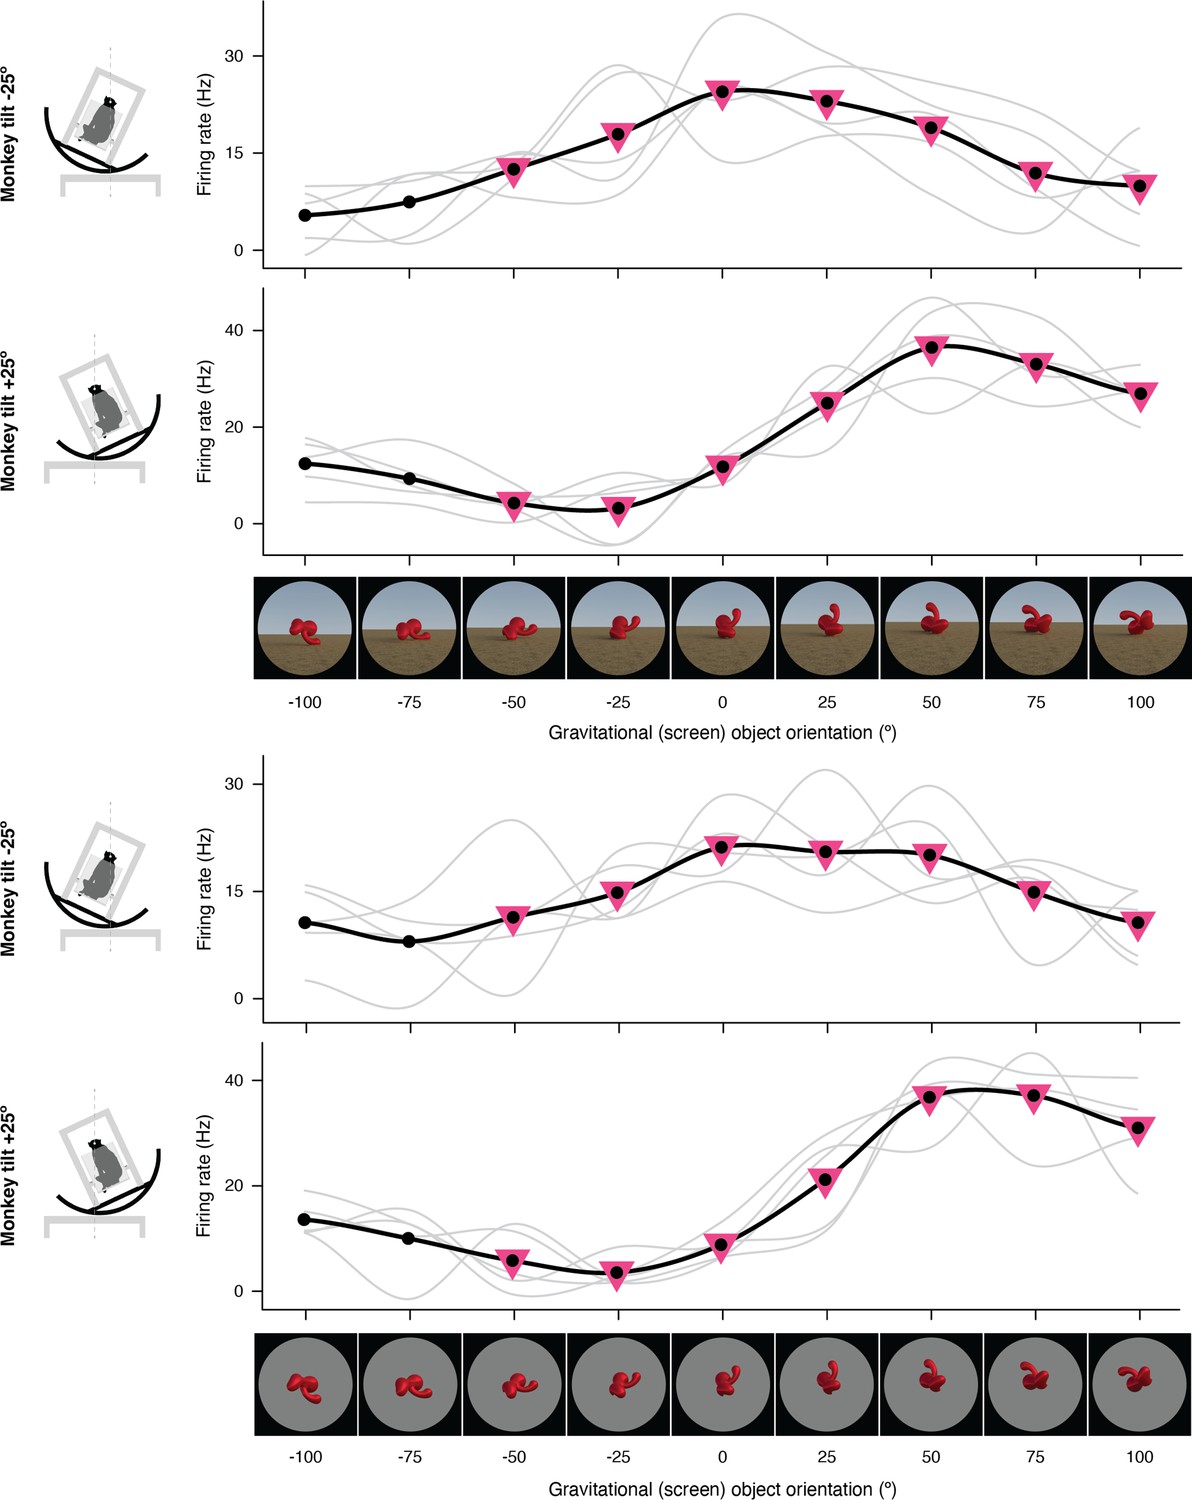
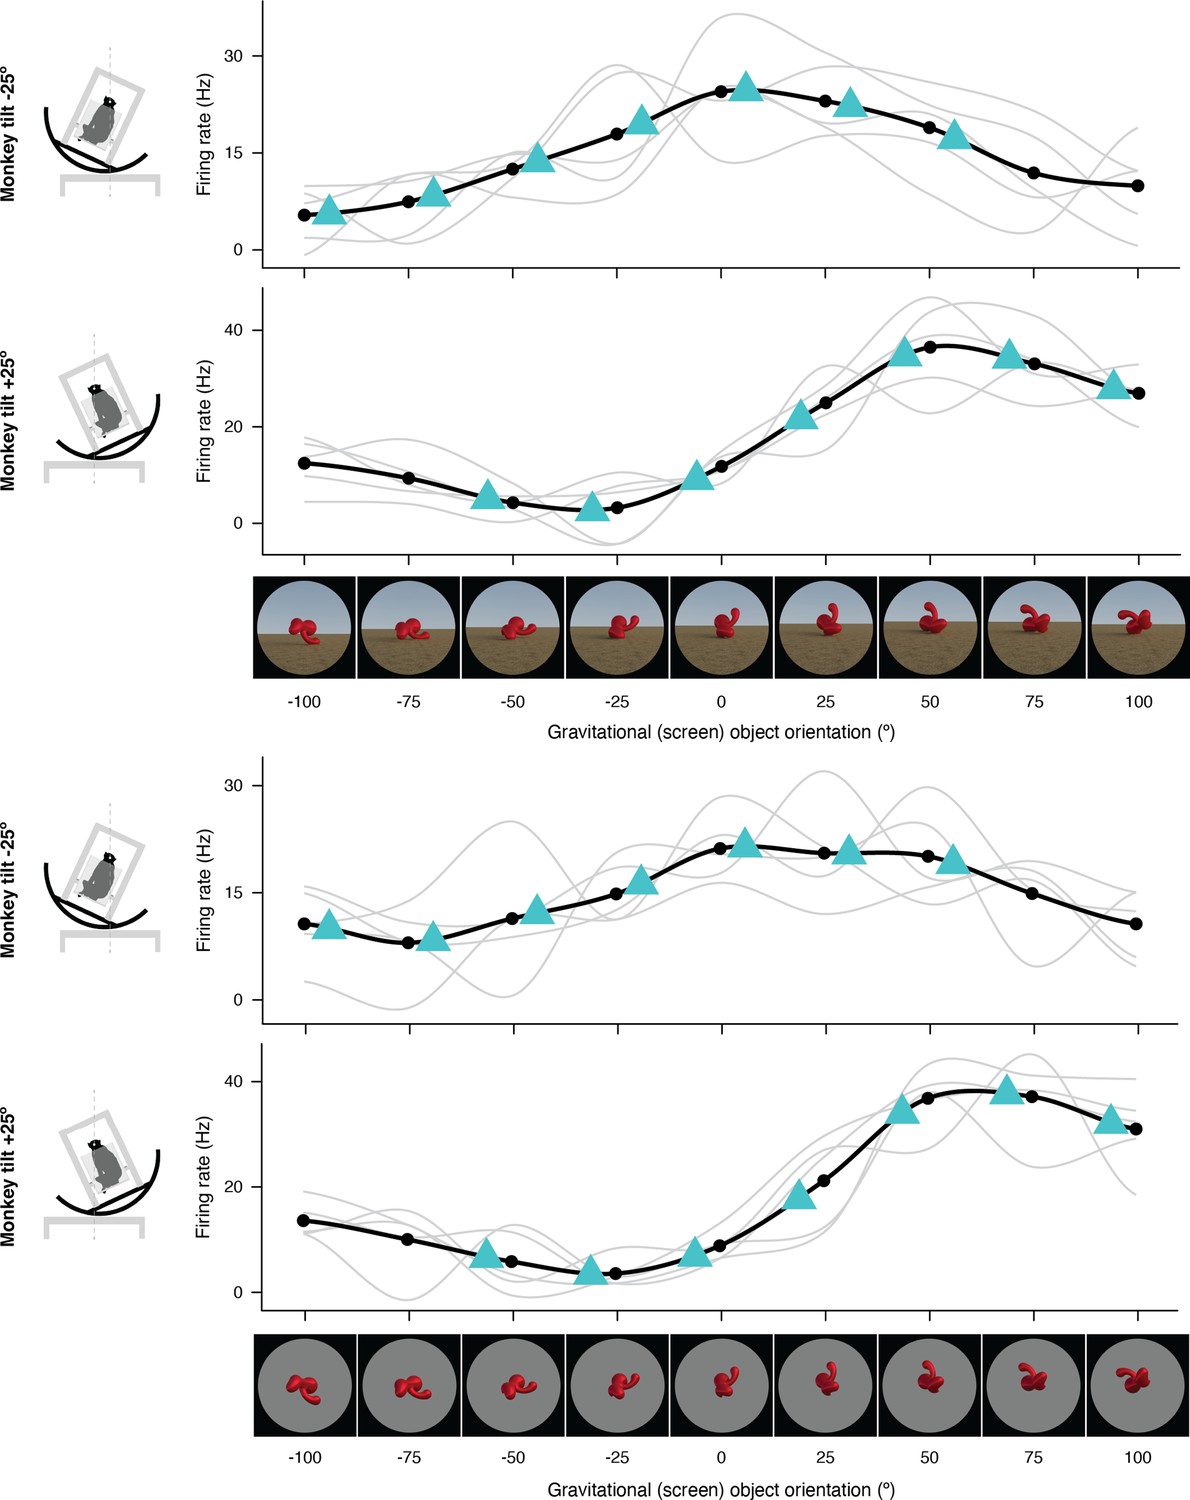
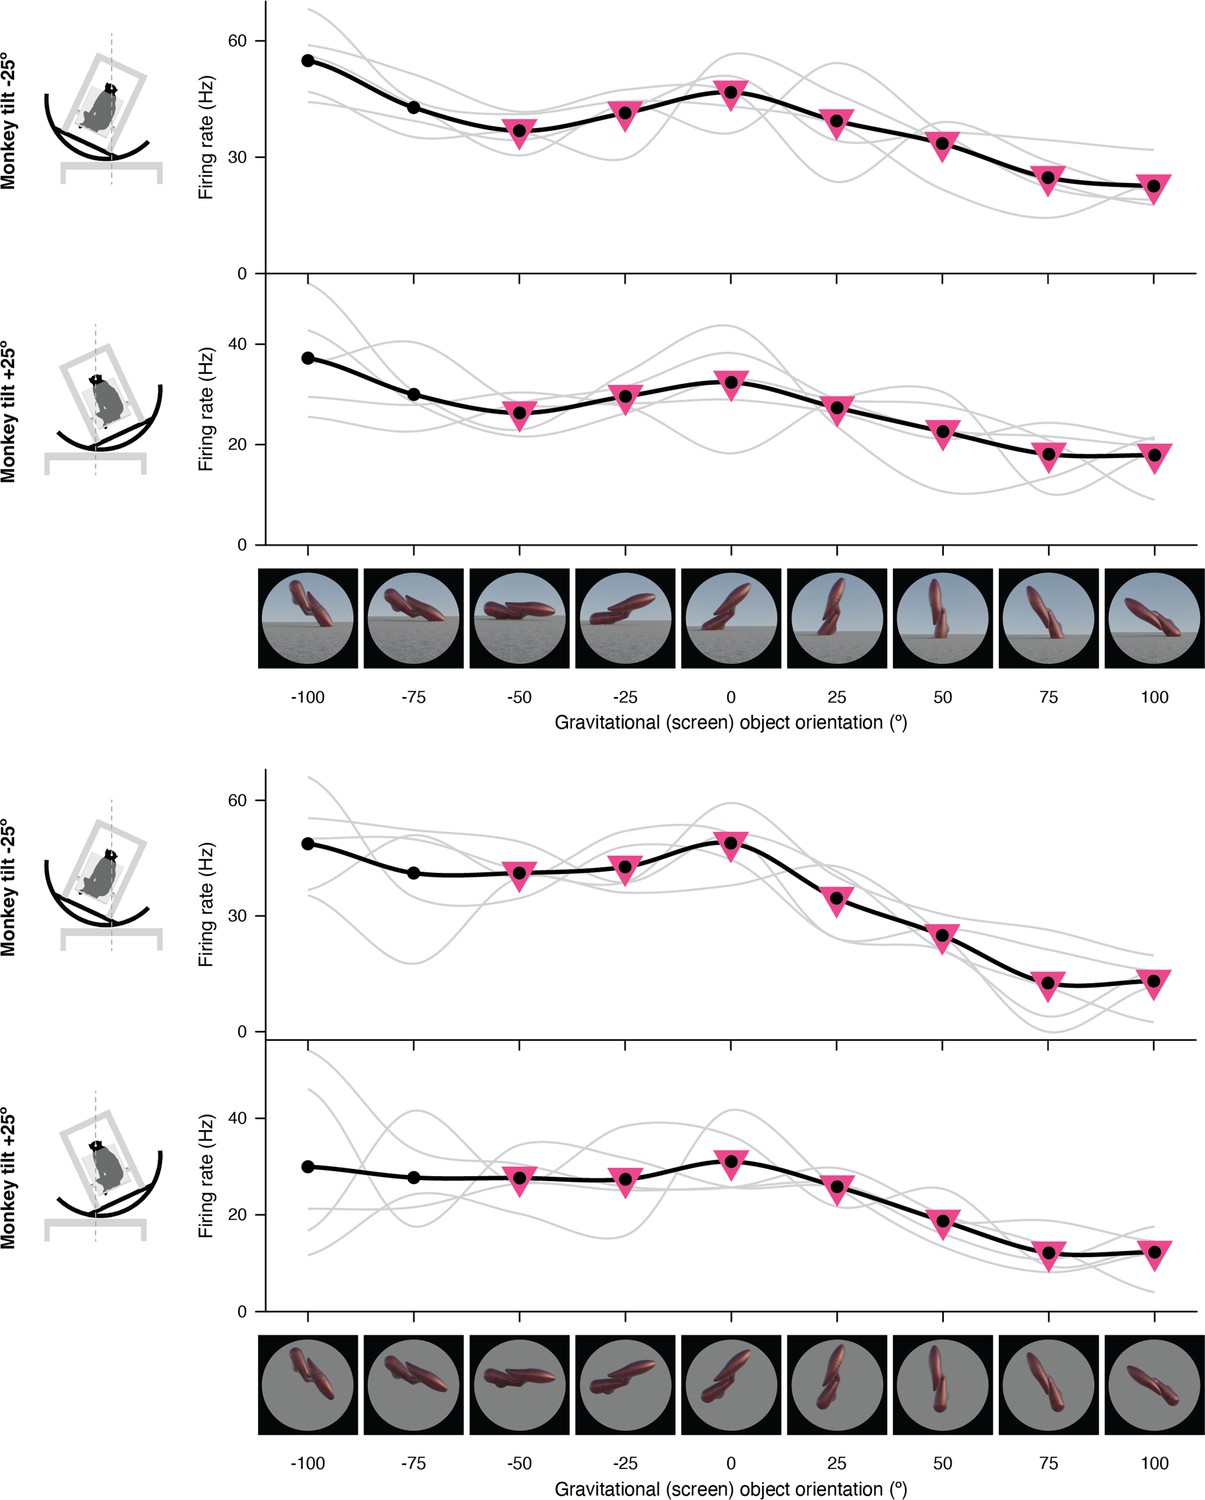
(a, b) Stimuli demonstrating example object orientations in the full scene condition. At each object orientation, the object was positioned on the ground-like surface naturalistically by virtually immersing or ‘planting’ 15% of its mass below ground, providing physical realism for orientations that would otherwise be visibly unbalanced and ensuring that most of the object was visible at each orientation. The high-response object shape and orientation discovered in the genetic algorithm experiments was always at the center of the tested orientation range and labeled 0°. The two monkey tilt conditions are diagrammed at left. The small white dots at the center of the head (connected by vertical dashed lines) represent the virtual axis of rotation produced by a circular sled supporting the chair. Stimuli were presented on a 100°-wide display screen for 750ms (separated by 250ms blank screen intervals) while the monkey fixated a central dot. Stimuli were presented in random order for a total of 5 repetitions each. (c,d) Responses of an example IT neuron to full scene stimuli, as a function of object orientation on the screen and thus with respect to gravity, across a 100° orientation range, while the monkey was tilted –25° (c) and 25° (d). Response values are averaged across the 750ms presentation time and across 5 repetitions and smoothed with a boxcar kernel of width 50° (3 orientation values). For this neuron, object orientation tuning remained consistent with respect to gravity across the two tilt conditions, with a peak response centered at 0° (dashed vertical line). The pink triangles indicate the object orientations compared across tilts in the gravitational alignment analysis. The two leftmost values are eliminated to equate the number of comparisons with the retinal alignment analysis. (e,f) The same data plotted against orientation on the retina, corrected for 6° counter-rolling of the eyes (Figure 1—figure supplement 1). The cyan triangles indicate the response values compared across tilts in the retinal analysis. Due to 6° the shift produced by ocular counter-rolling, these comparison values were interpolated between tested screen orientations using a Catmull-Rom spline. Since for this cell orientation tuning was consistent in gravitational space, the peaks are shifted right or left by 19° each, that is 25° minus the 6° compensation for ocular counter-rotation. (g–j) Similar results were obtained for this neuron with isolated object stimuli.
Figure 1—figure supplement 1
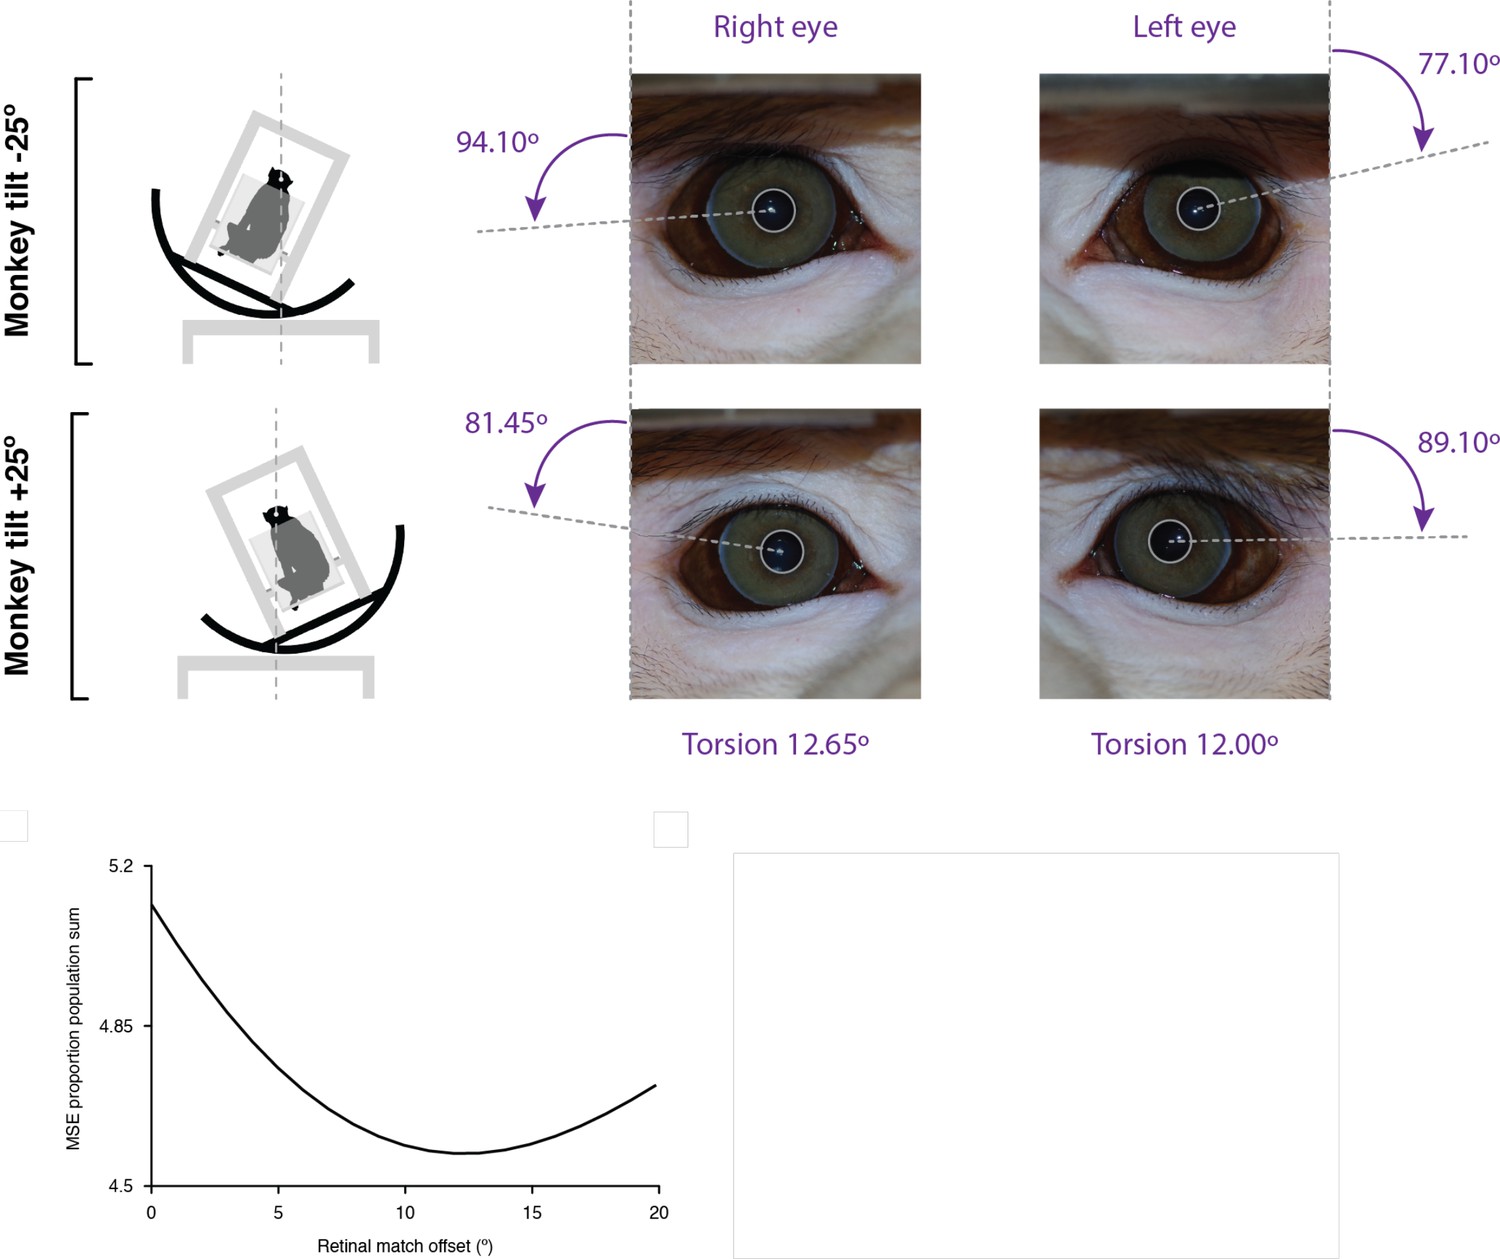
Analysis of eye counter-rotation during tilt.
Eye orientation was estimated with lines connecting the center of the pupil with visualizable features at the edge of the iris. For the right and left eyes in the same monkey, the measured difference in eye orientation relative to the head was 12.65° for the right eye and 12.00° for the left eye (upper right). For the tilt experiments on all the neurons, combined across monkeys, we searched for the counterroll compensation that would produce the strongest agreement in retinal coordinates. At each compensation level tested, we normalized and summed the mean squared error (MSE) between responses at corresponding retinal positions. The best agreement in retinal coordinates (minimum MSE) was measured at 12° offset, corresponding to 6° rotation from normal in each of the tilt conditions (lower left).
Figure 1—figure supplement 2
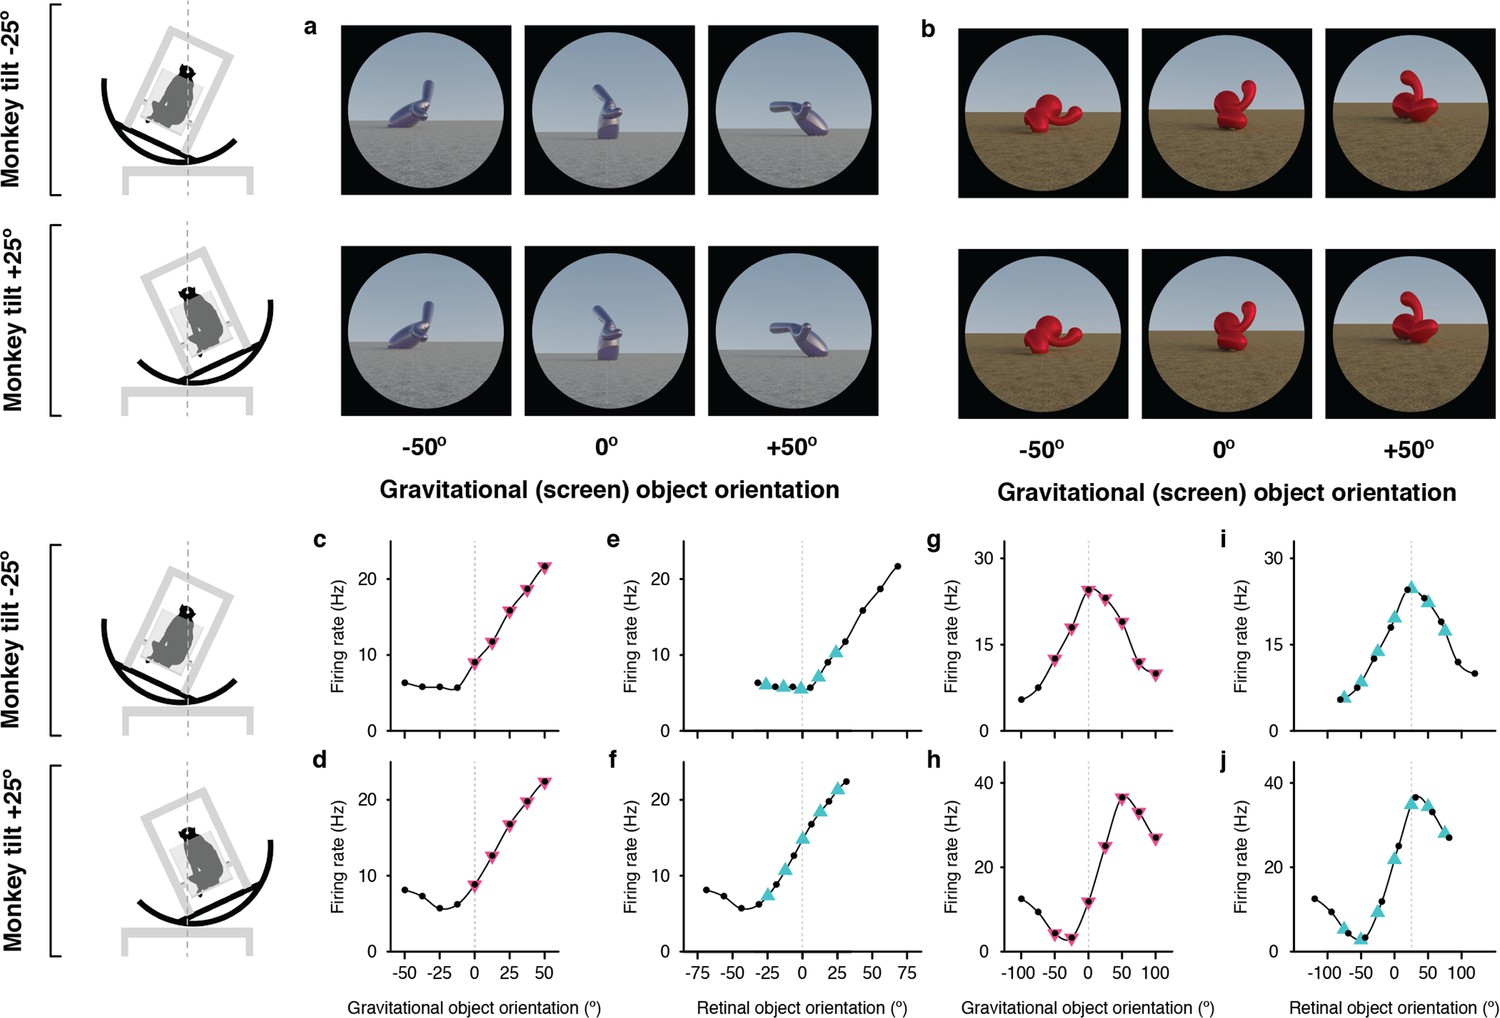
Example neurons tuned in gravitational space and retinal space.
(a, b) Stimuli demonstrating example object orientations used to study the two IT neurons. The orientation discovered in the genetic algorithm experiments is arbitrarily labeled 0°. The two monkey tilt conditions are diagrammed at left. (c, d) Responses of a gravitationally tuned IT neuron studied with the stimuli shown in (a), as a function of object orientation on the screen and thus with respect to gravity, across a 100° orientation range, while the monkey was tilted –25° (c) and 25° (d). Response values are averaged across the 750ms presentation time and across 5 repetitions and smoothed with a boxcar kernel of width 50° (3 orientation values). For this neuron, object orientation tuning remained consistent in screen/gravity space across the two tilt conditions. Other details as in Figure 1. (e, f) The same data plotted against orientation on the retina, corrected for 6° counter-rolling of the eyes in each tilt condition. Due to the shift produced by ocular counter-rolling, these comparison values were interpolated between tested screen orientations using a Catmull-Rom spline. Since orientation tuning was consistent in gravitational space, the tuning functions are shifted right or left by about 20° each. (g, h) Responses of a retinally-tuned IT neuron studied with the stimuli shown in (b), as a function of object orientation on the screen and thus with respect to gravity, across a 100° orientation range, while the monkey was tilted –25° (c) and 25° (d). In this case, the tuning peak was shifted about 40°, in the direction expected for orientation tuning in retinal space. (i,j) The same data plotted against orientation on the retina, corrected for 6° counter-rolling of the eyes in each tilt condition. The correspondence between curves in (i) and (j), with peaks at near 0°, is consistent with orientation tuning in retinal space.
Figure 1—figure supplement 3
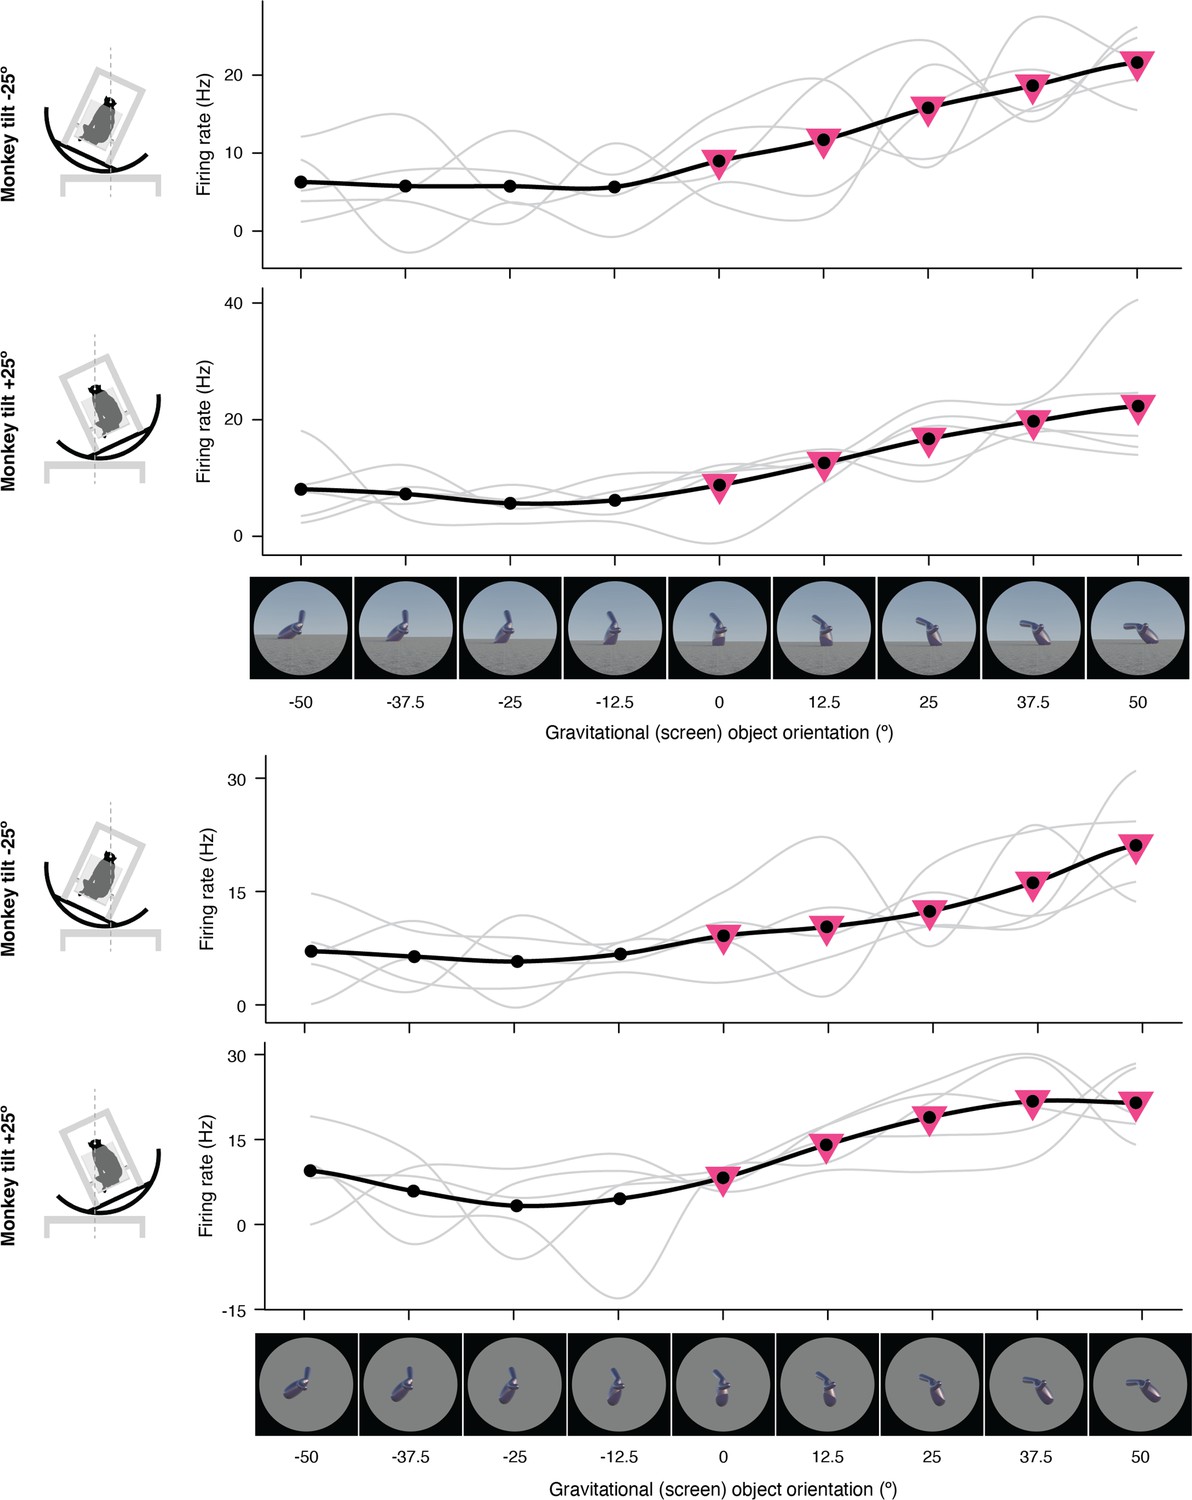
Expanded representation of results in panels (c) and (d) of Figure 2.
The complete set of stimuli and boxcar-smoothed (across neighboring orientations) response functions for each of 5 repetitions for full scene stimuli (top) and isolated object stimuli (bottom).
Figure 1—figure supplement 4
Expanded representation of results in panels (e) and (f) of Figure 2.
The complete set of stimuli and boxcar-smoothed (across neighboring orientations) response functions for each of 5 repetitions for full scene stimuli (top) and isolated object stimuli (bottom).
Figure 1—figure supplement 5
Expanded representation of results in panels (g) and (h) of Figure 2.
The complete set of stimuli and boxcar-smoothed (across neighboring orientations) response functions for each of 5 repetitions for full scene stimuli (top) and isolated object stimuli (bottom).
Figure 1—figure supplement 6
Expanded representation of results in panels (i) and (j) of Figure 2.
The complete set of stimuli and boxcar-smoothed (across neighboring orientations) response functions for each of five repetitions for full scene stimuli (top) and isolated object stimuli (bottom).
Figure 1—figure supplement 7
Expanded representation of results in Figure 1.
The complete set of stimuli and boxcar-smoothed (across neighboring orientations) response functions for each of five repetitions for full scene stimuli (top) and isolated object stimuli (bottom).
Figure 1—figure supplement 8
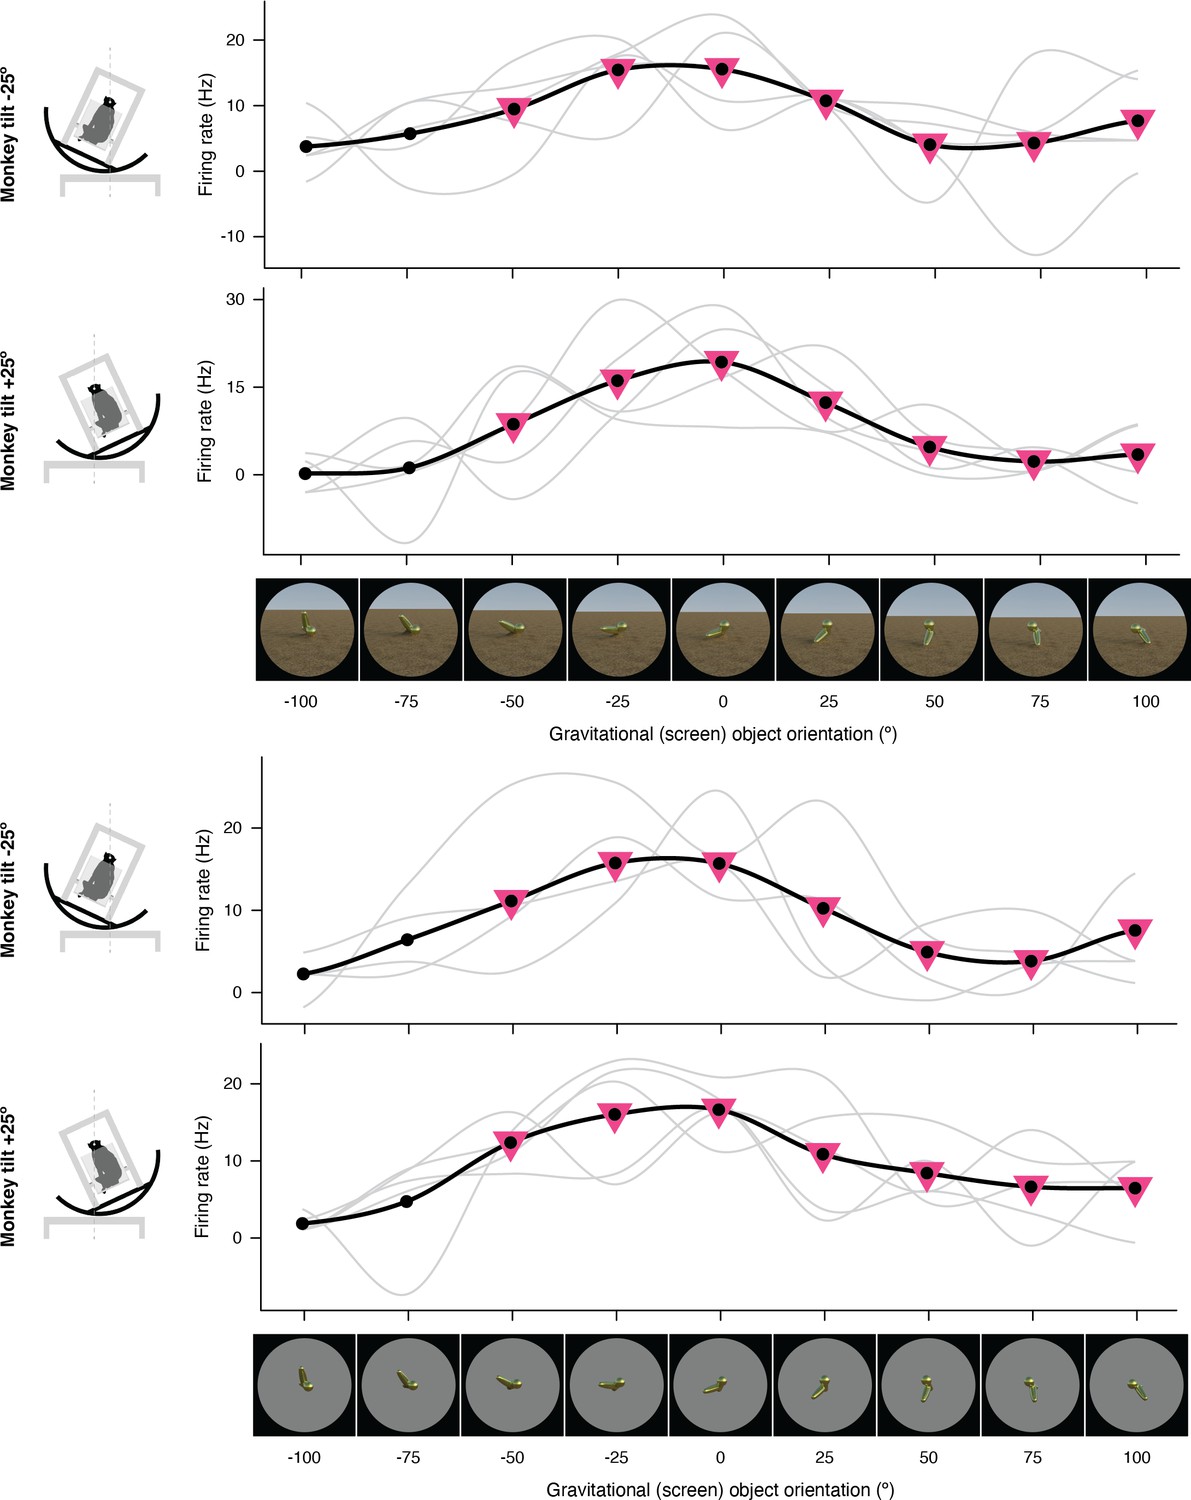
Additional example of gravitational tuning in an expanded format.
The complete set of stimuli and boxcar-smoothed (across neighboring orientations) response functions for each of five repetitions for full scene stimuli (top) and isolated object stimuli (bottom).
Figure 1—figure supplement 9
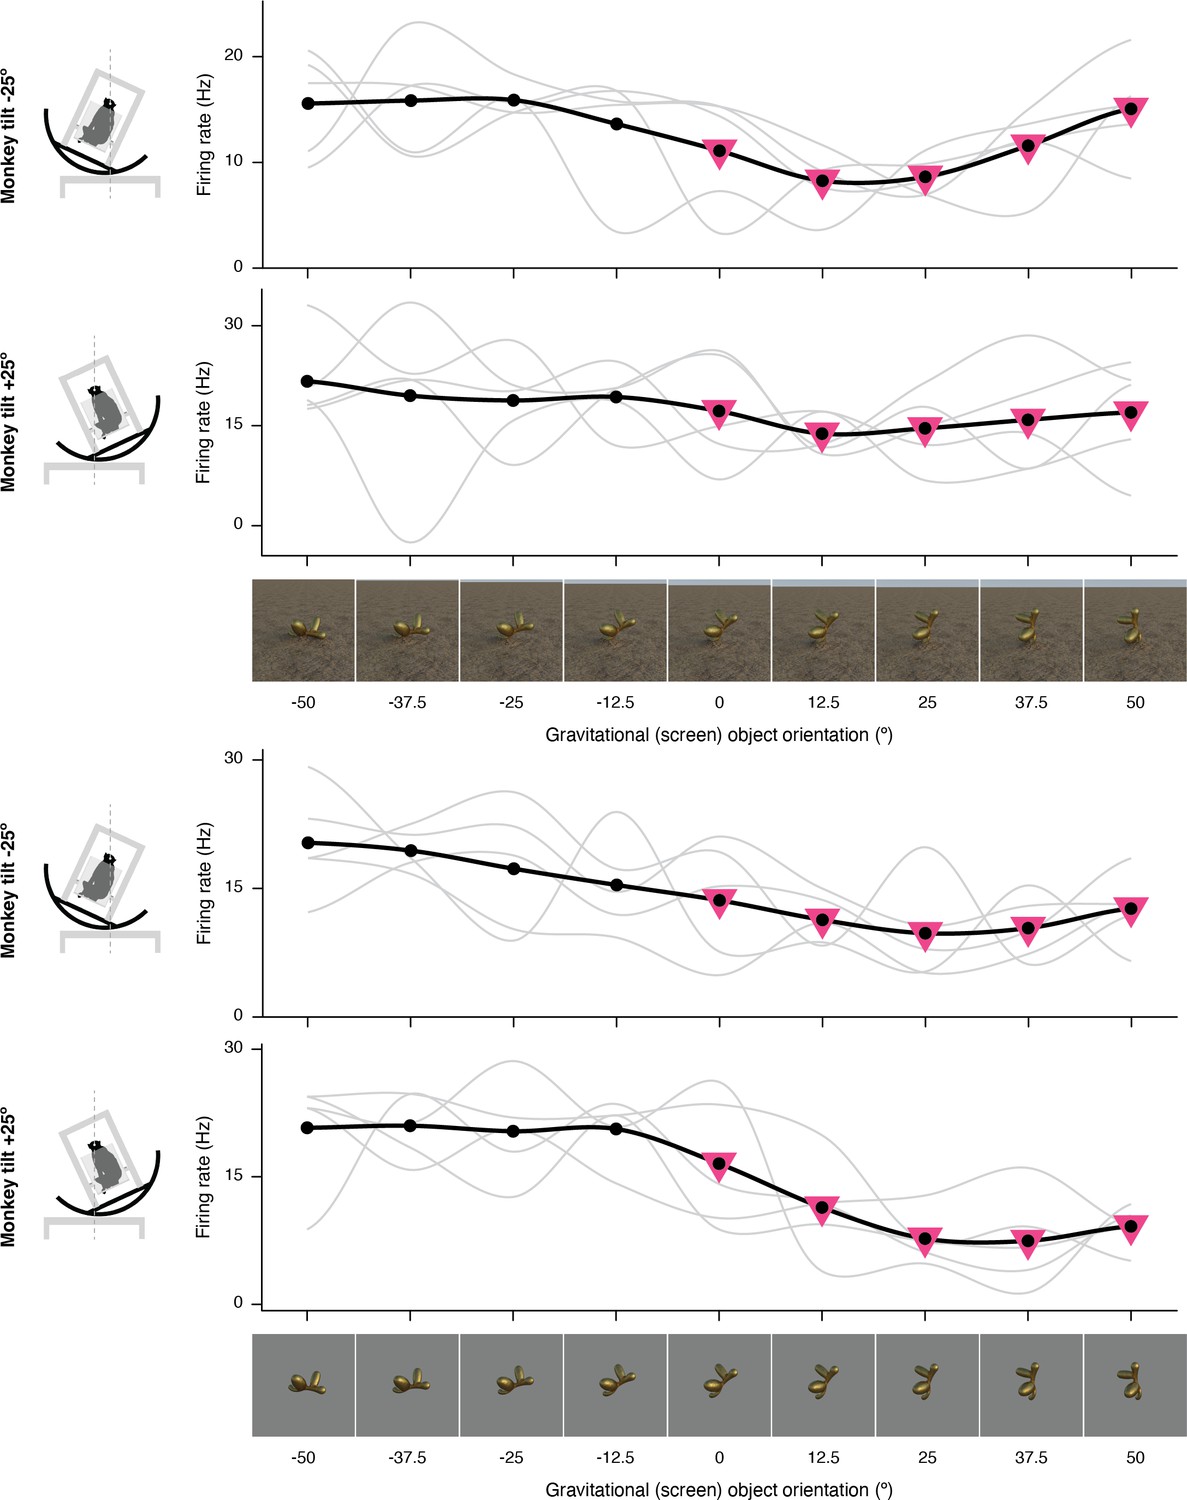
Additional example of gravitational tuning in explanded format.
The complete set of stimuli and boxcar-smoothed (across neighboring orientations) response functions for each of five repetitions for full scene stimuli (top) and isolated object stimuli (bottom).
Figure 1—figure supplement 10
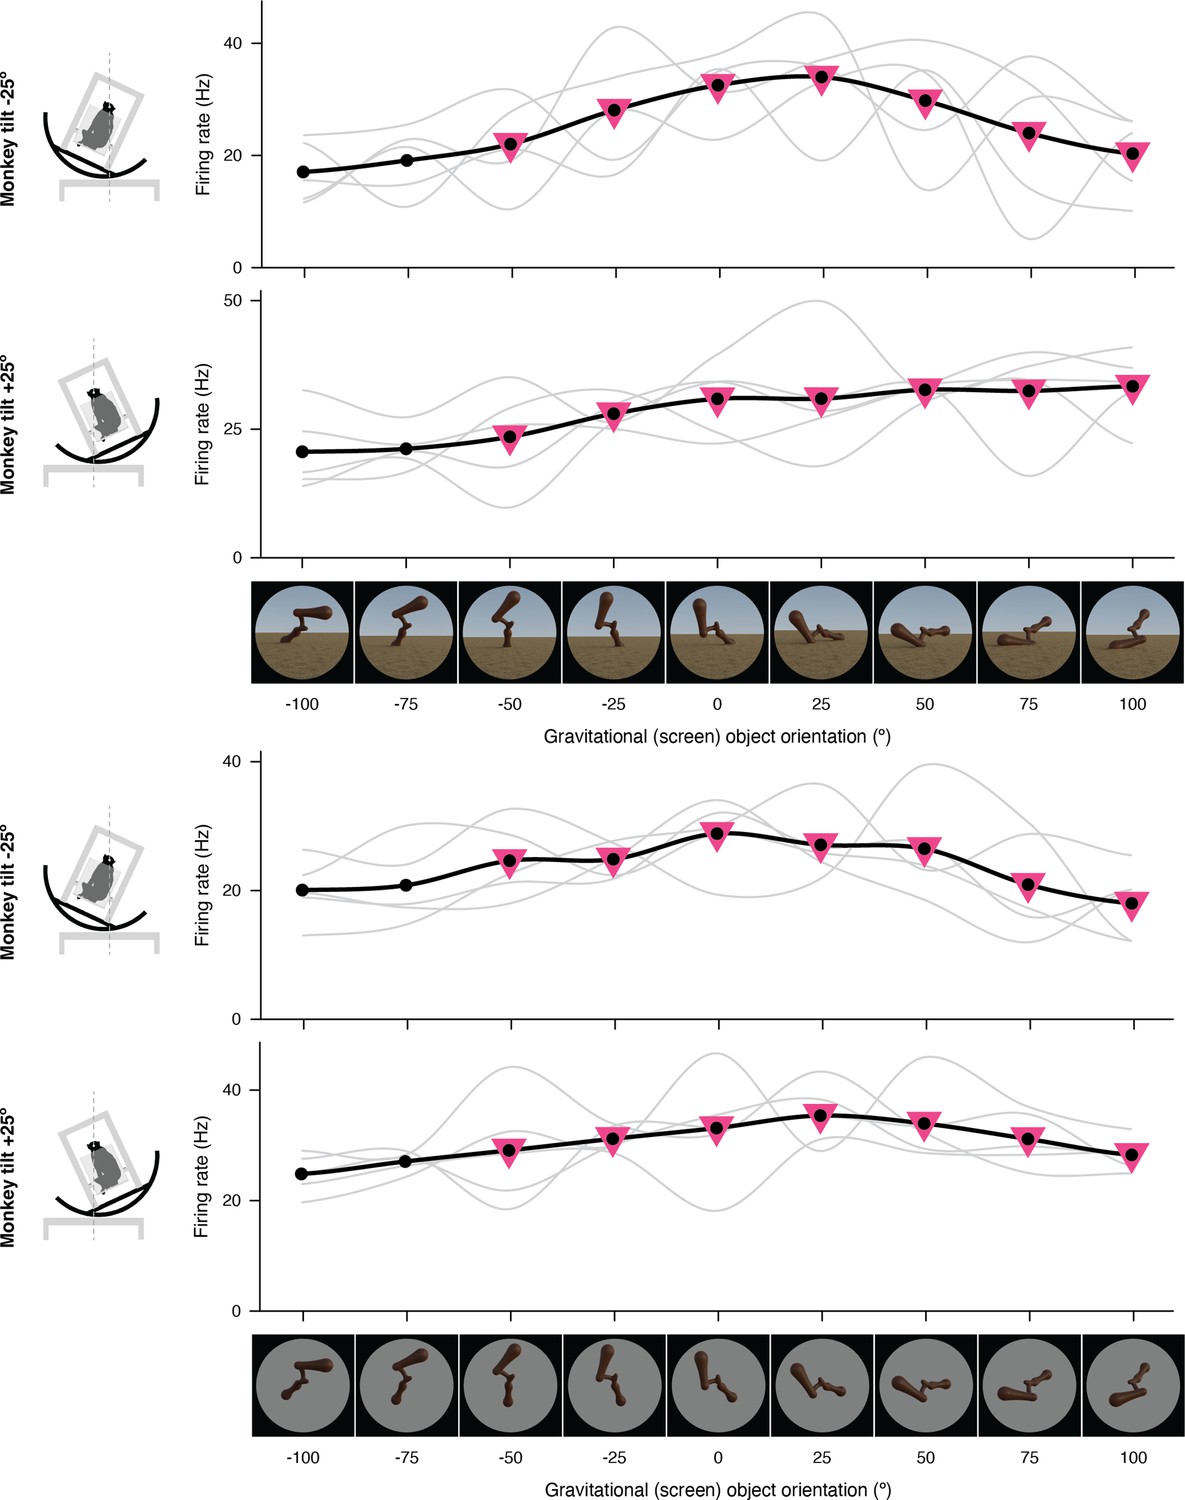
Additional example of gravitational tuning in expanded format.
The complete set of stimuli and boxcar-smoothed (across neighboring orientations) response functions for each of five repetitions for full scene stimuli (top) and isolated object stimuli (bottom).
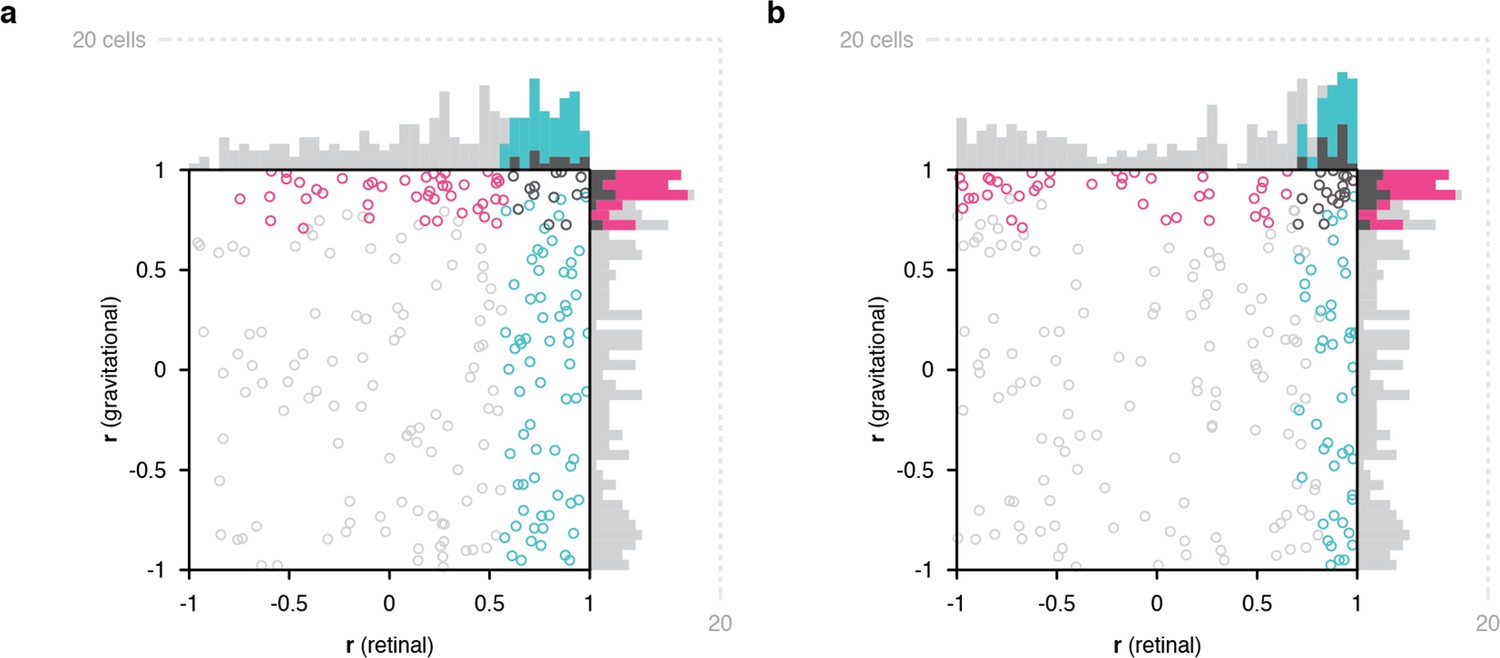
Figure 2 with 6 supplements
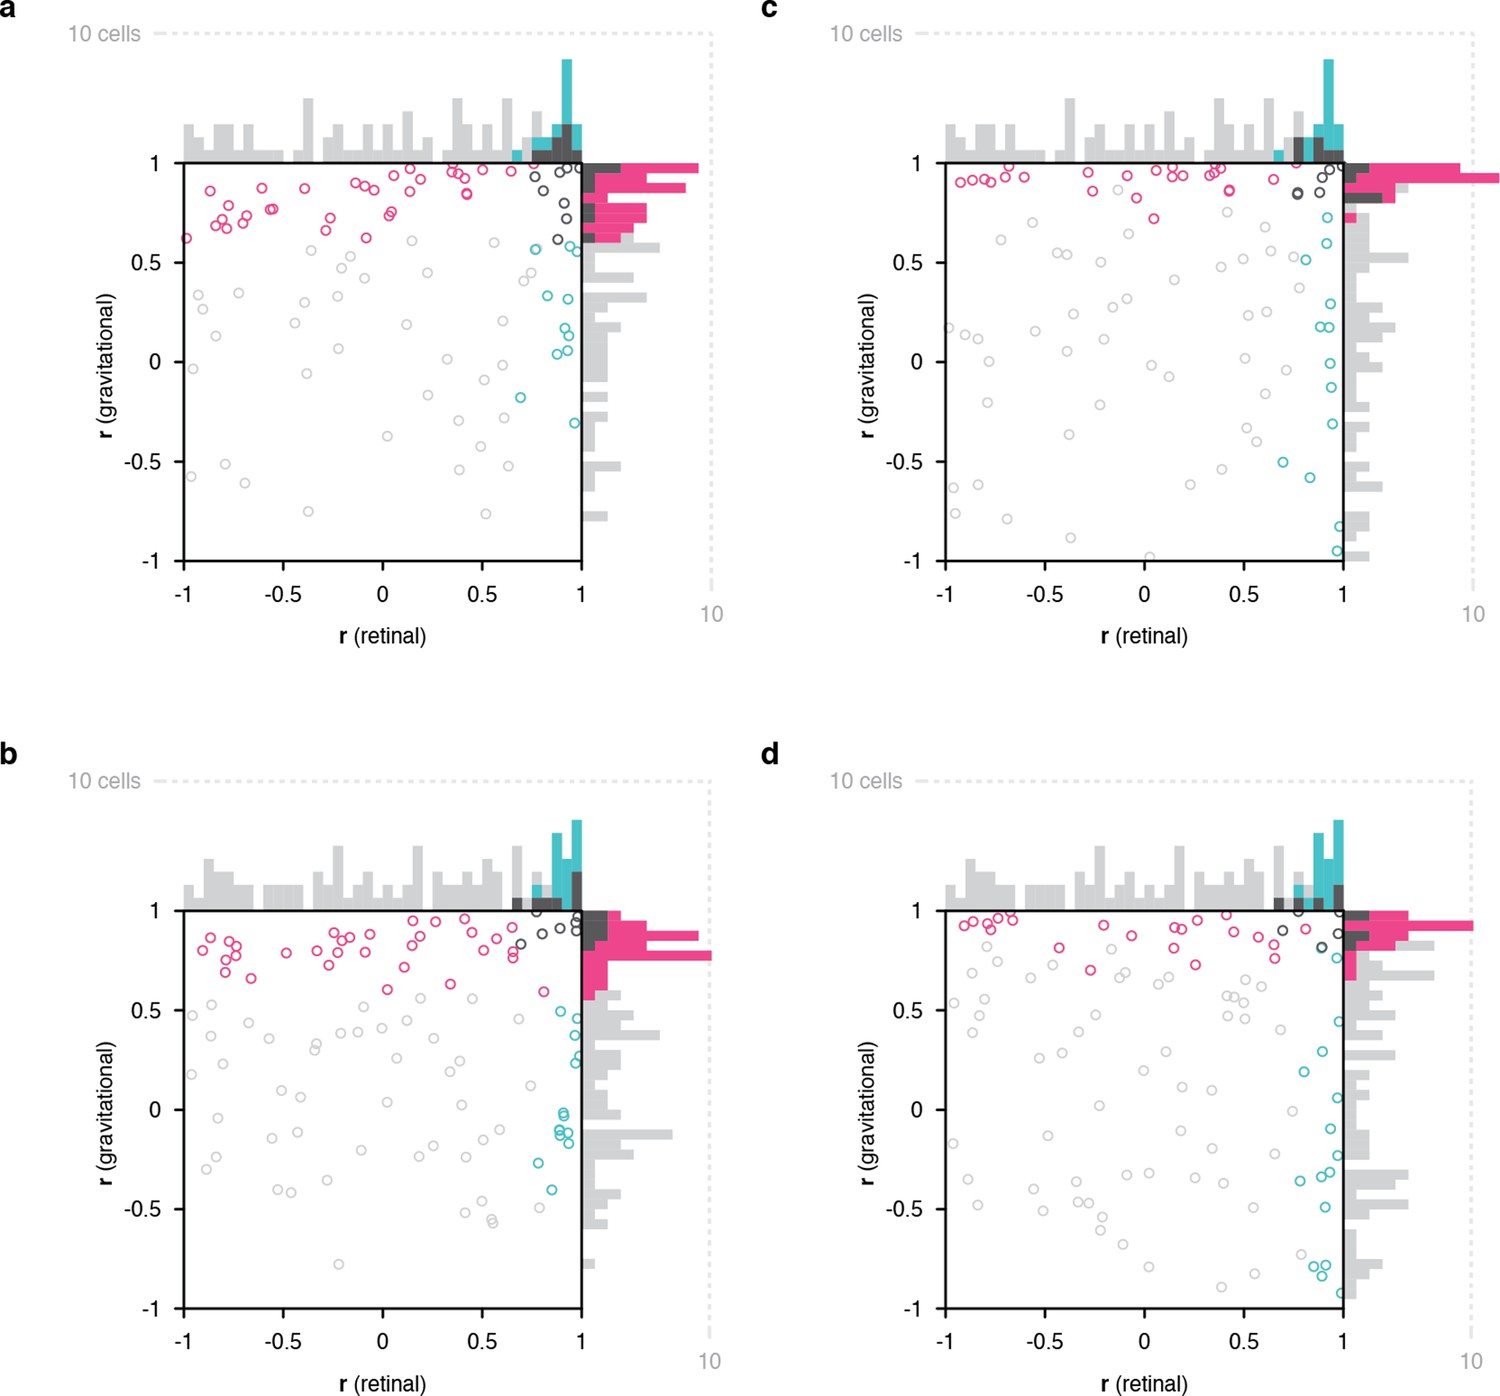
Scatterplots of object orientation tuning function correlations across tilts.
(a) Scatterplot of correlations for full scene stimuli. Correlations of tuning in the gravitational reference frame (y axis) are plotted against correlations in the retinal reference frame (x axis). Marginal distributions are shown as histograms. Neurons with significant correlations with respect to gravity are colored pink and neurons with significant correlations with respect to the retinae are colored cyan. Neurons with significant correlations in both dimensions are colored dark gray, and neurons with no significant correlation are colored light gray. (b) Scatterplot for isolated object stimuli. Conventions the same as in (a). (c) Same scatterplot as in (a), but balanced for number of comparison orientations between gravitational and retinal analysis. (d) Same as (b), but balanced for number of comparison orientations between gravitational and retinal analysis. Comparable plots based on individual monkeys are shown in . Anatomical locations of neurons in individual monkeys are shown in Figure 2—figure supplements 4 and 5 .
Figure 2—figure supplement 1

Scatterplot of object orientation tuning function correlations for isolated objects surrounded by a circular aperture.
The circular aperture, with gray inside and black screen outside, provided a nearby, high-contrast frame for the object, intended to overwhelm the framing effects of the screen edges and thus diminish visual cues for the orientation of gravity. The circular surround conveys no visual information about the direction of gravity and would maintain a constant relationship to the object regardless of object-tilt. Details as in Figure 2. The results in this condition were comparable to the main results, with significant tendencies toward object orientation functions correlated with gravity (pink, p = 1.5259 X 10⁻¹⁰, two-tailed randomization t-test for center-of-mass relative to 0) and with the retinae (cyan, p = 8.8879 X 10⁻⁶). This supports the proposition that vestibular/somatosensory cues alone suffice for gravitationally aligned tuning in AIT.
Figure 2—figure supplement 2
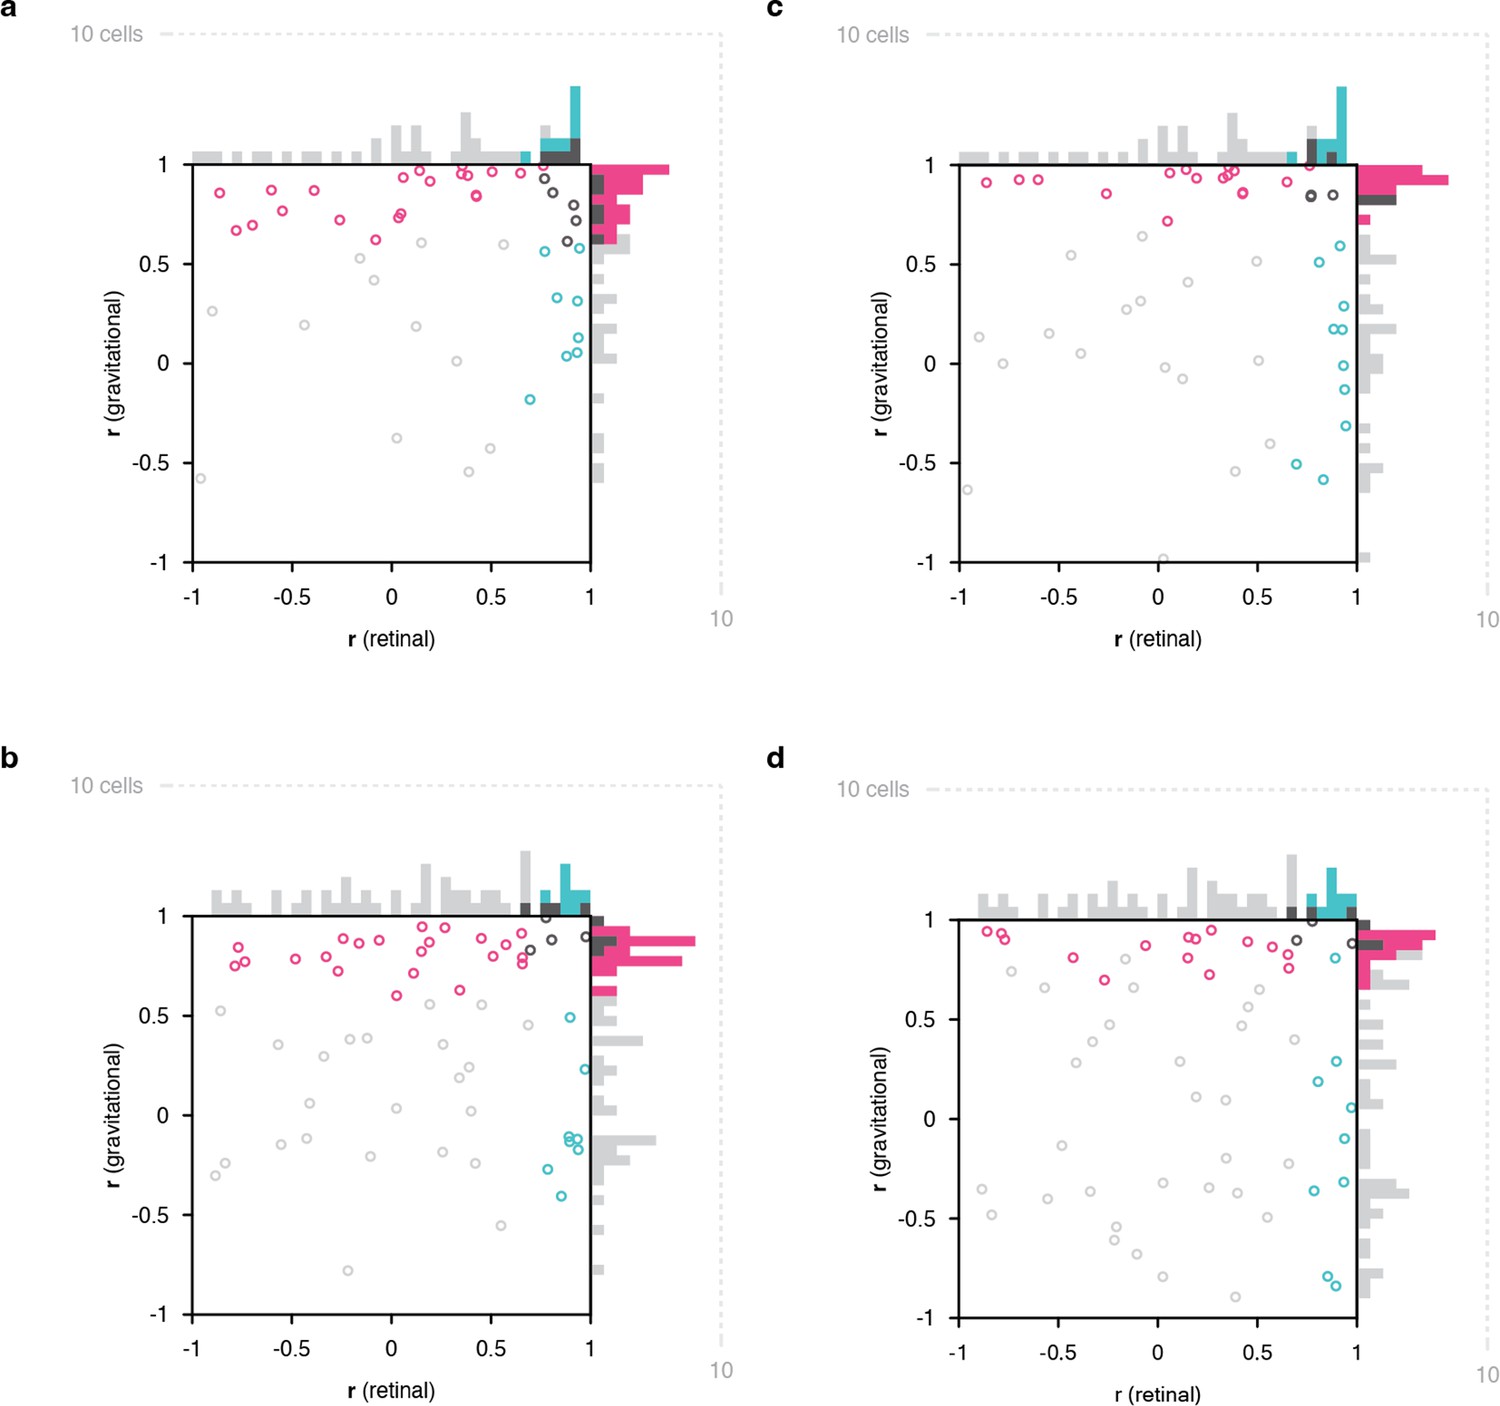
Results in Figure 2 plotted only for monkey 2.
Figure 2—figure supplement 3

Results in Figure 2 plotted only for monkey 1.
Figure 2—figure supplement 4
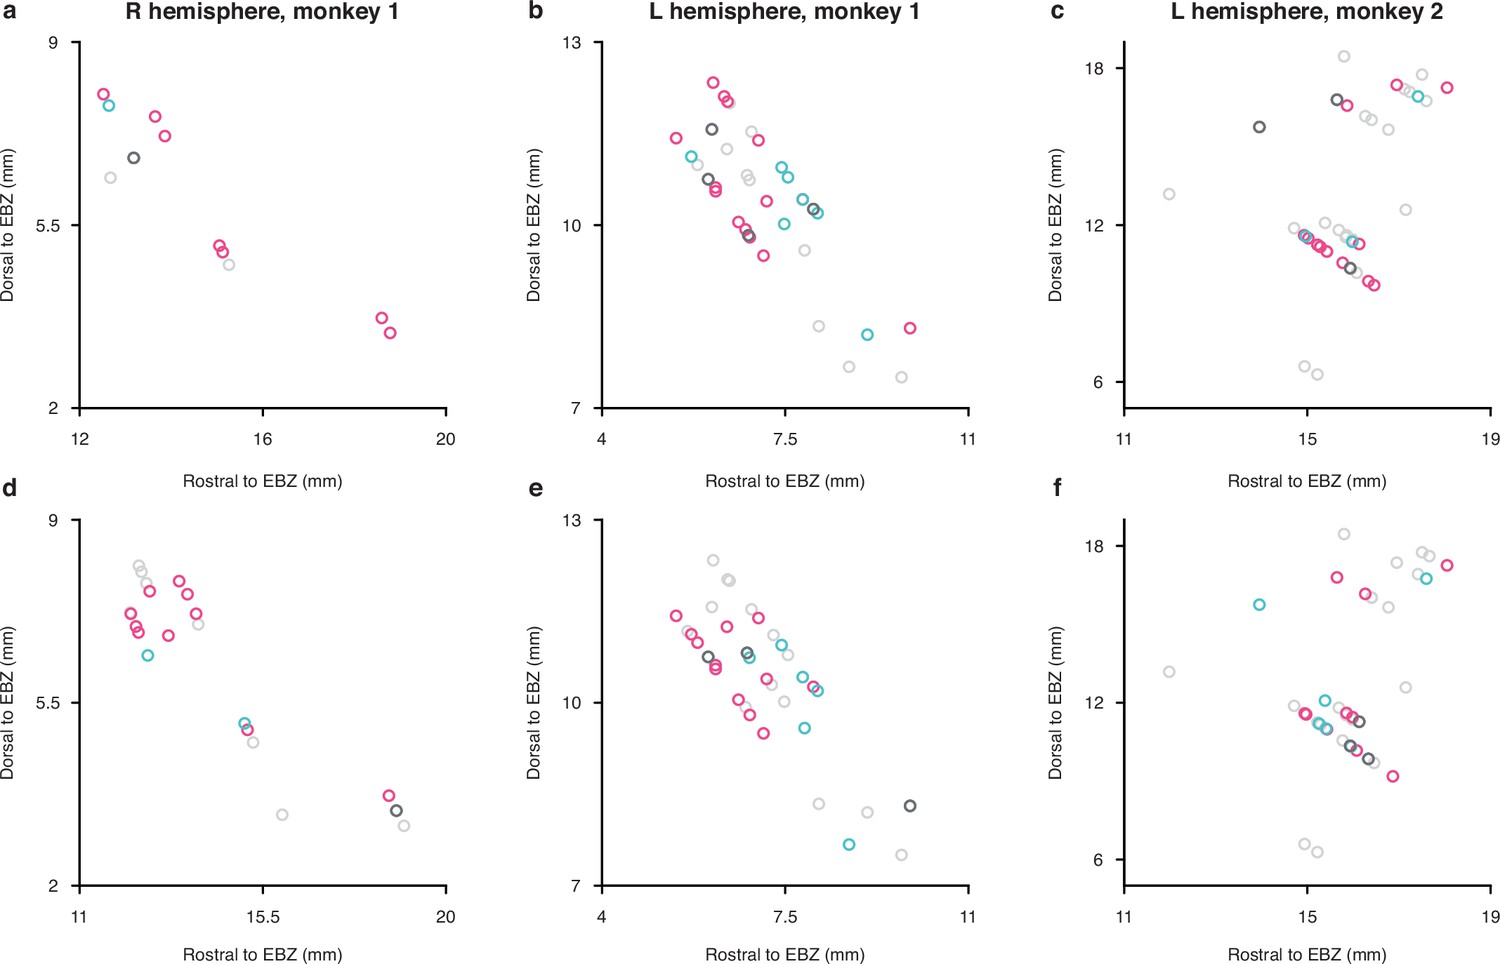
Anatomical locations of neurons in individual monkeys plotted in saggital projections.
Anatomical locations of neurons in the three recording hemispheres (columns) (horizontal axis represents mm rostral to ear bars, vertical axis represents mm dorsal to ear bars). Color conventions as in Figure 2. Top row (a, b, c) shows results for the full scene experiments, bottom row (d, e, f) shows results for the isolated object experiments.
Figure 2—figure supplement 5
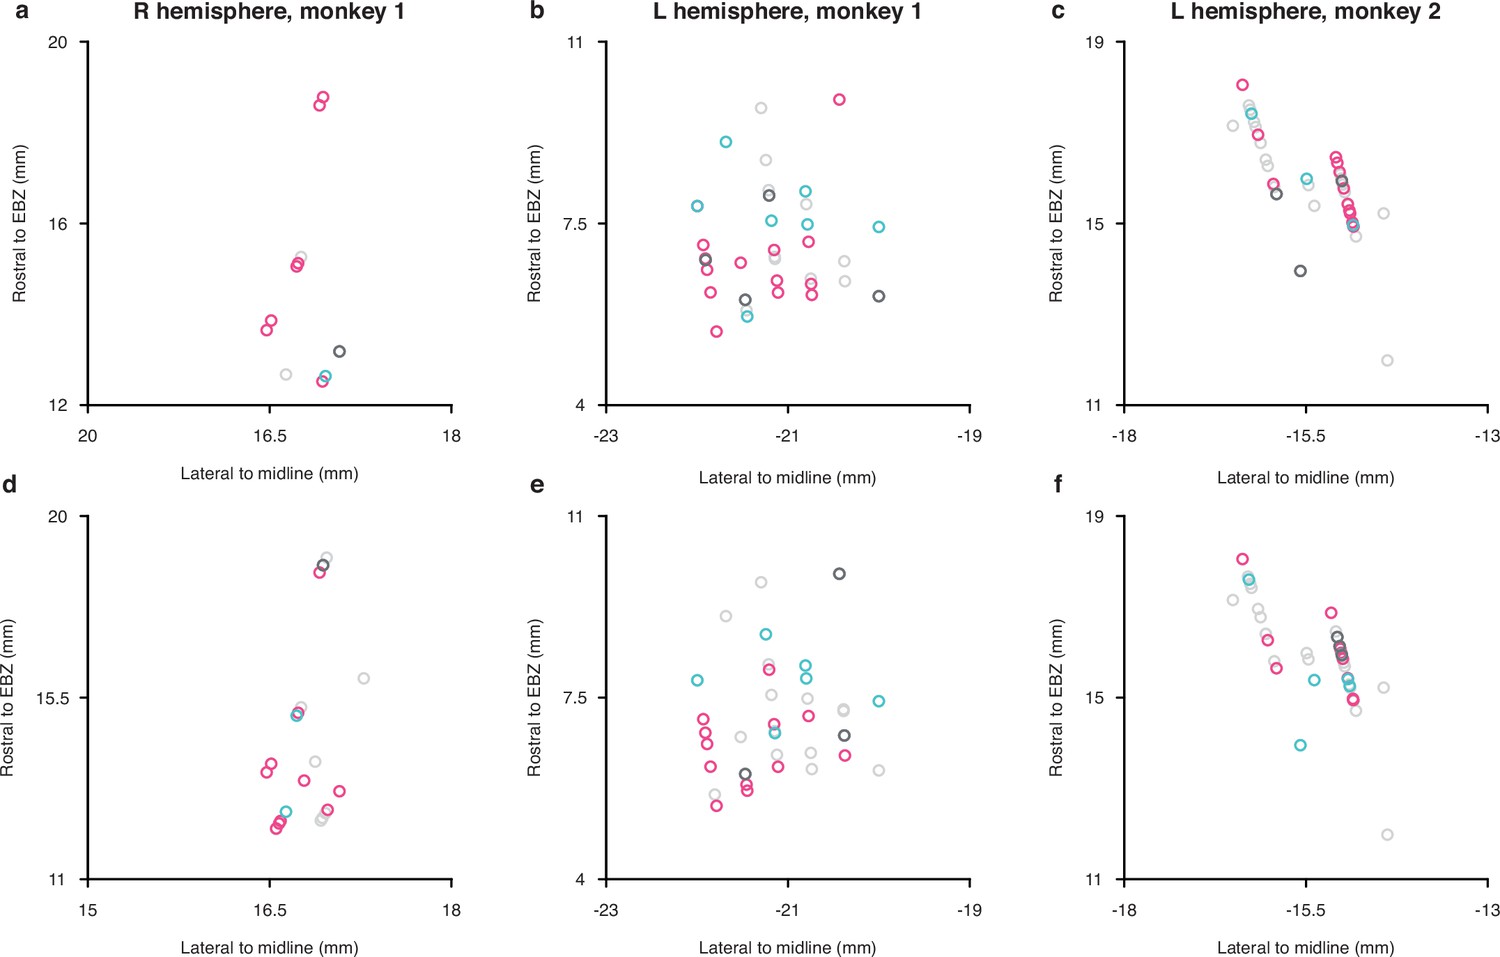
Anatomical locations of neurons in individual monkeys plotted in horizontal projections.
Anatomical locations of neurons in the three recording hemispheres (columns) (horizontal axis represents mm lateral to midline, vertical axis represents mm rostral to ear bars). Color conventions as in Figure 2. Top row (a, b, c) shows results for the full scene experiments, bottom row (d, e, f) shows results for the isolated object experiments. Based on locations in Figure 2—figure supplements 4 and 5, slightly over 80% of neurons were recorded from STS (lower bank of superior temporal sulcus, where neurons have been found to be primarily object-sensitive Vaziri et al., 2014), 10% from Ted (lateral convexity of inferior temporal lobe, where a majority of neurons have been found to be scene-sensitive), and a small number from TEv (the basal surface of the inferior temporal lobe) and the bottom lip of the superior temporal sulcus.
Figure 2—figure supplement 6

Scatterplot of object orientation tuning function correlations in gravitational space as measured in the scene conditions (0° horizon experiment) and the isolated object condition (floating).
Significant correlations (pink) included 8 exclusive to the isolated object condition (triangles), 11 exclusive to the scene condition (squares), and 23 apparent in both conditions (circles). Thus, gravitational alignment was observable in both conditions for a majority of cases. The 11 cells exclusive to the scene condition might suggest a necessary contribution of visual cues in some cases. However, the converse result with eight cells suggests a more complex dependency on cues and/or conflicting interactions produced by scene backgrounds. Across all 79 cells tested this way, there was no significant difference in the correlations under the two conditions (two-tailed paired t-test of correlation differences; p = 0. 1045, mean difference = 0.1077). This suggests that visual cues had little influence in our main experiments beyond the effects of clear, static vestibular and somatosensory cues.
Figure 3

Example neurons tested with tilted horizon stimuli while the monkey remained in an upright orientation.
(a, b) Stimuli used to study two different neurons, demonstrating example object orientations in two conditions, with the ground surface, horizon, and sky gradient tilted –25° (clockwise, top row) or with ground surface, etc. tilted +25° (counterclockwise, second row). The monkey was in a normal upright orientation during these experiments, producing conflicting vestibular/somatosensory cues. The retinal orientation discovered in the genetic algorithm experiments is arbitrarily labeled 0°. (c, d) For one of the example IT neurons, tested with the stimuli in (a), object orientation tuning with respect to the visually cued direction of gravity was consistent across the two ground tilts. (e, f) Correspondingly, the neuron gave very different responses to retinal object orientation values between the two ground tilts. (g, h) This different example IT neuron, tested with the stimuli in (b), did not exhibit consistent object orientation tuning in visually-cued gravitational space. (i, j) Instead, this neuron maintained consistent tuning for retinal-screen orientation despite changes in ground tilt.
Figure 4
Scatterplots of object orientation tuning function correlations across visual horizon tilts on the screen, with the monkey in an upright orientation.
(a) Scatterplot of correlations for full scene stimuli. Correlations of tuning in gravitational space as cued by horizon tilt (y axis) are plotted against correlations in retinal space (x axis). Marginal distributions are shown as histograms. Neurons with significant correlations in visually-cued gravitational space are colored pink and neurons with significant correlations in retinal space are colored cyan. Neurons with significant correlations in both dimensions are colored dark gray, and neurons with no significant correlation are colored light gray. (b) Same scatterplot as in (a), but with correlation values balanced for number of comparison orientations between gravitational and retinal analysis.
Additional files
Download links
A two-part list of links to download the article, or parts of the article, in various formats.
Downloads (link to download the article as PDF)
Open citations (links to open the citations from this article in various online reference manager services)
Cite this article (links to download the citations from this article in formats compatible with various reference manager tools)
Object representation in a gravitational reference frame
eLife 12:e81701.
https://doi.org/10.7554/eLife.81701


