Sugar sensation and mechanosensation in the egg-laying preference shift of Drosophila suzukii
- Department of Molecular, Cellular and Developmental Biology, Yale University, United States
Figures
Figure 1 with 1 supplement
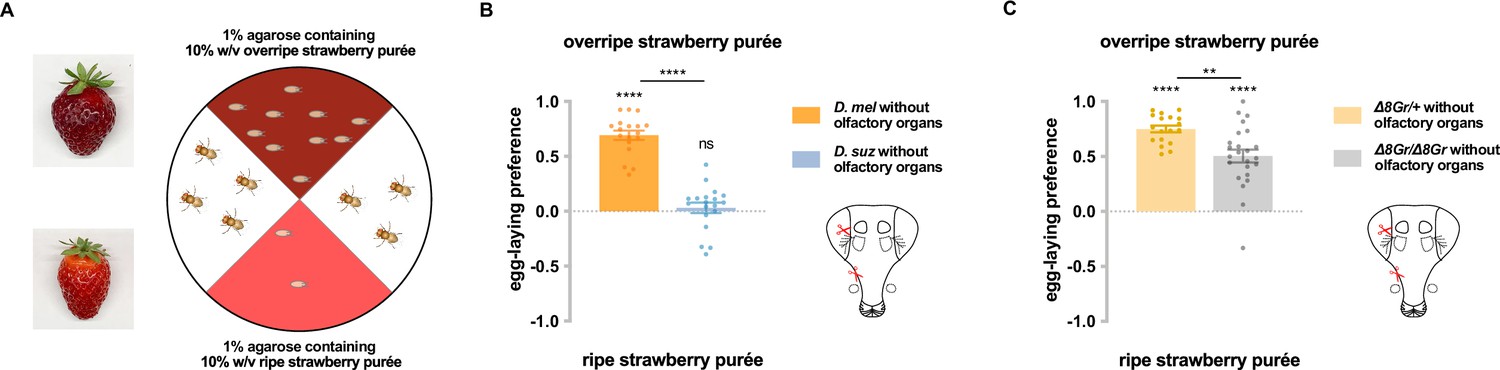
Taste contributes to the difference in egg-laying preference between D. suzukii and D. melanogaster.
(A) Two-choice egg-laying paradigm. Female flies (n=4–10 flies per plate) whose olfactory organs had been removed were allowed to lay eggs in the dark. The preference index was calculated as (#eggs in overripe purée - #eggs in ripe purée)/total #eggs. (B) Egg-laying preferences of the two species, without olfactory organs. Each egg-laying preference index was compared to 0 using the Wilcoxon signed-rank test. The Mann-Whitney test was used to compare the preference indices between species. n=18–20. ns, not significant; *p<0.05; ****p<0.0001. (C) Egg-laying preference of females homozygous mutant for eight sugar receptor genes and of control females heterozygous for the eight mutations. n=18–20. Error bars are SEM.
Figure 1—figure supplement 1
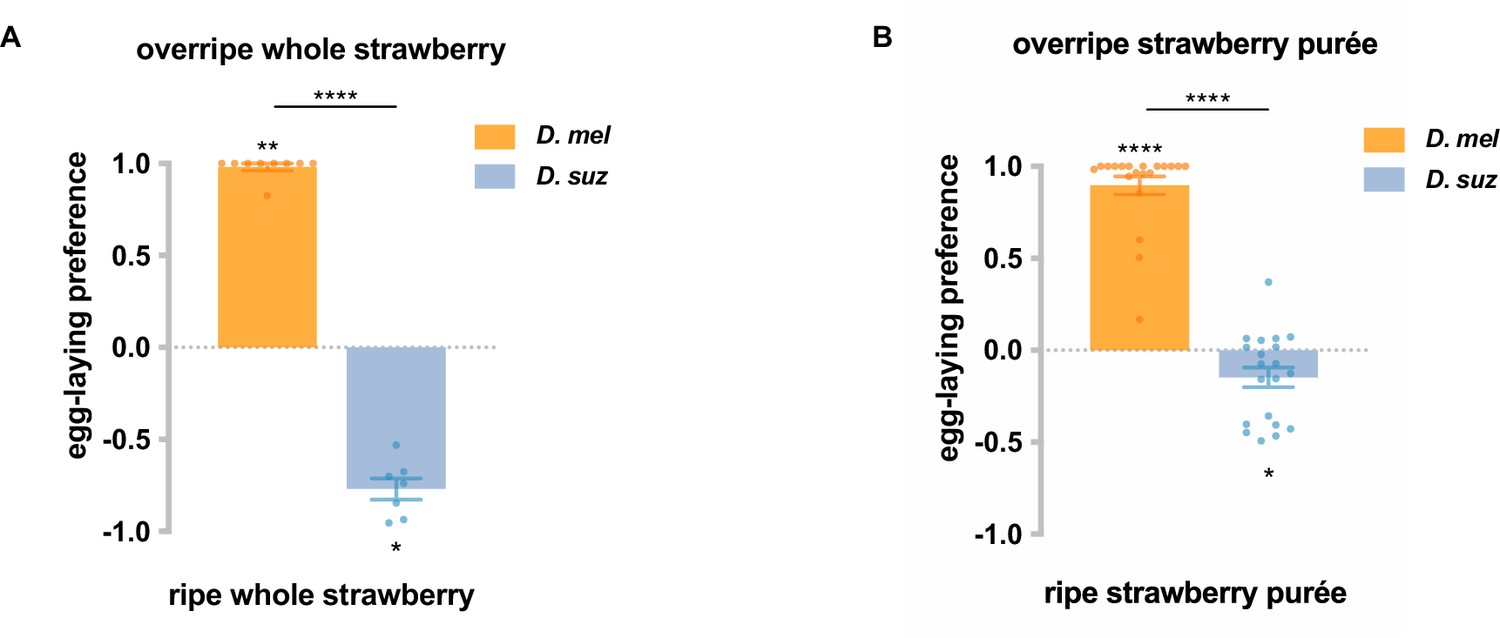
D. suzukii has an egg-laying preference for ripe strawberries and for ripe strawberry purée, while D. melanogaster prefers overripe strawberries and overripe strawberry purée.
(A) Given a choice between whole, intact ripe or overripe organic strawberries obtained commercially, D. suzukii and D. melanogaster in cages showed opposite preferences. n=7–9. (B) Given a choice between ripe and overripe strawberry purées made from strawberries grown in a greenhouse, D. suzukii and D. melanogaster in cages showed opposite preferences. n=20. Each egg-laying preference index was compared to 0 using the Wilcoxon signed-rank test. The Mann-Whitney test was used to compare the preference indices between species. *p<0.05; **p<0.01; ****p<0.0001. Error bars are SEM.
Figure 2 with 1 supplement
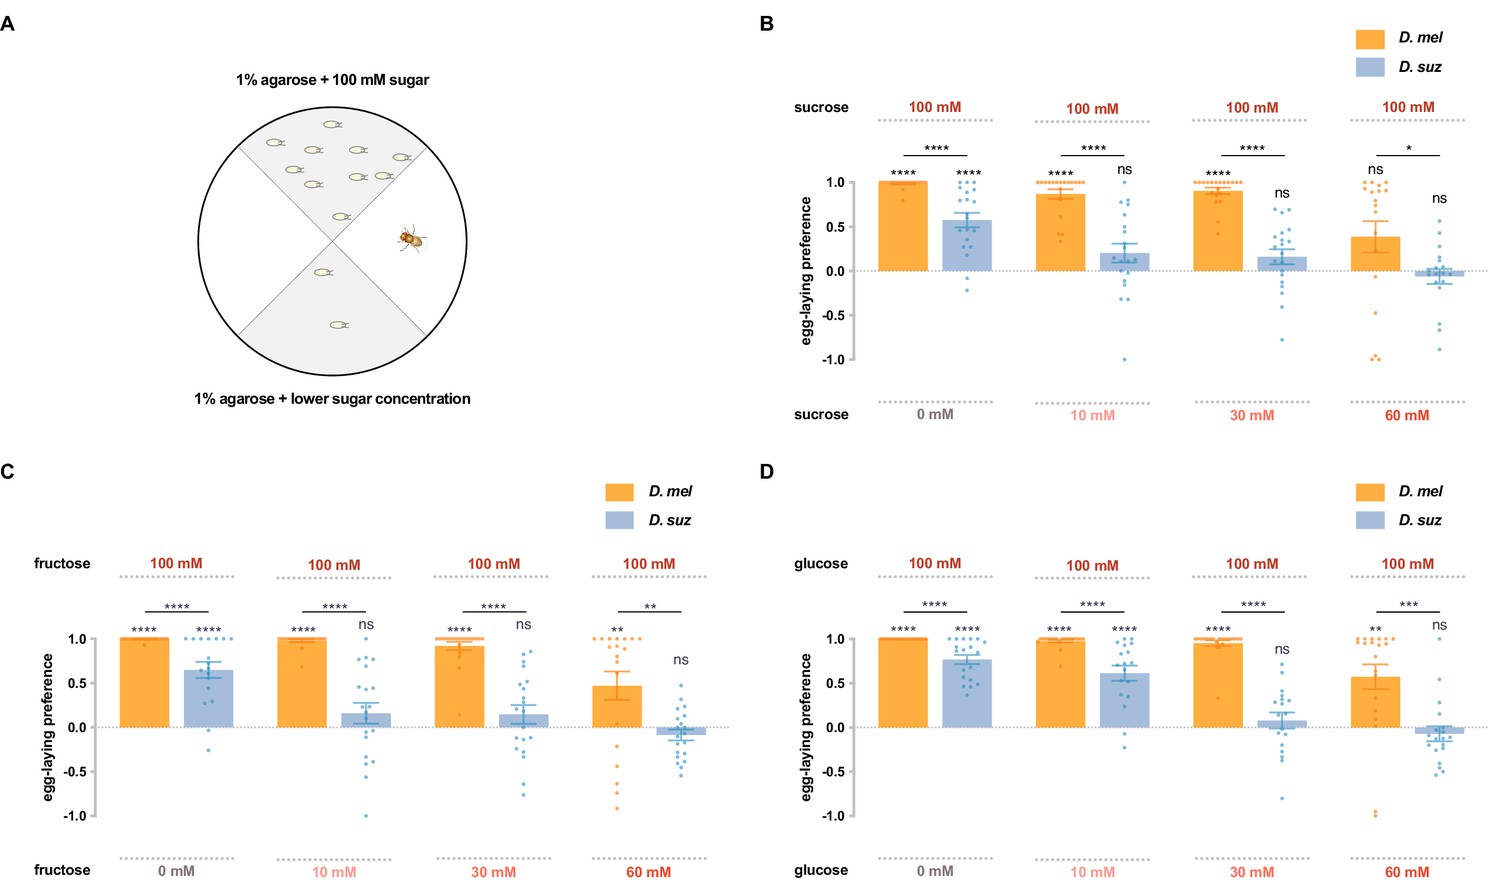
D. suzukii shows a weaker egg-laying preference than D. melanogaster for sweeter substrates.
(A) The single-fly egg-laying preference paradigm. The preference index is calculated as (#eggs in higher sugar concentration - #eggs in lower sugar concentration)/total #eggs. (B–D) Preference indices for the indicated concentrations of (B) sucrose, (C) fructose, and (D) glucose. Each egg-laying preference index was compared to 0 using the Wilcoxon signed-rank test. The Mann-Whitney test was used to compare the preference indices between species. n=18–20. ns, not significant; *p<0.05; **p<0.01; ***p<0.001; ****p<0.0001. Error bars are SEM.
Figure 2—figure supplement 1
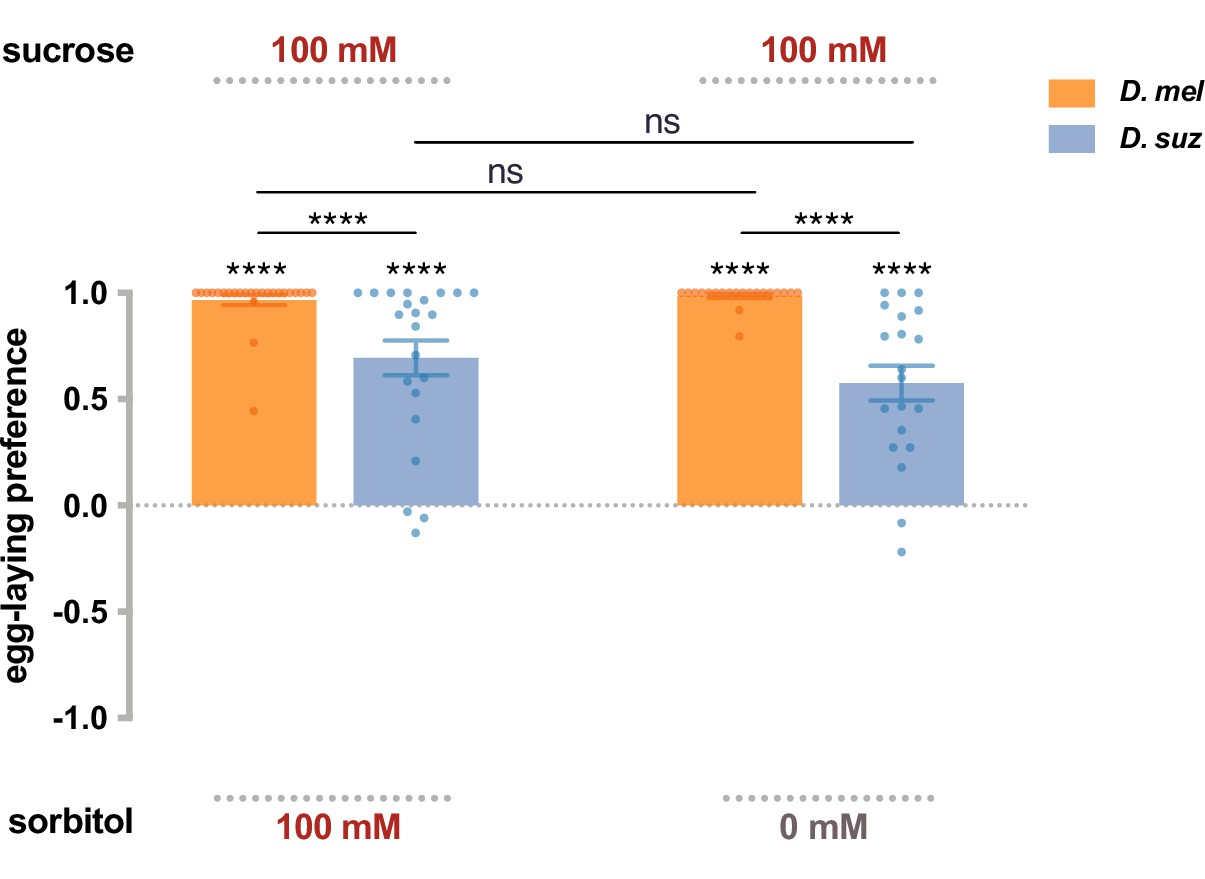
Preferences for high-sugar concentrations are not exclusively due to a preference for high osmolarity.
The egg-laying preference for sucrose vs. sorbitol, a sugar alcohol considered tasteless to the fly. The preferences are the same as between sucrose and plain agarose (taken from Figure 2B). Each egg-laying preference index is compared to 0 using the Wilcoxon signed-rank test. The Mann-Whitney test is used to compare the preference indices between species. n=18–20. ns, not significant; *p<0.05; **p<0.01; ***p<0.001; ****p<0.0001. Error bars are SEM.
Figure 3 with 1 supplement
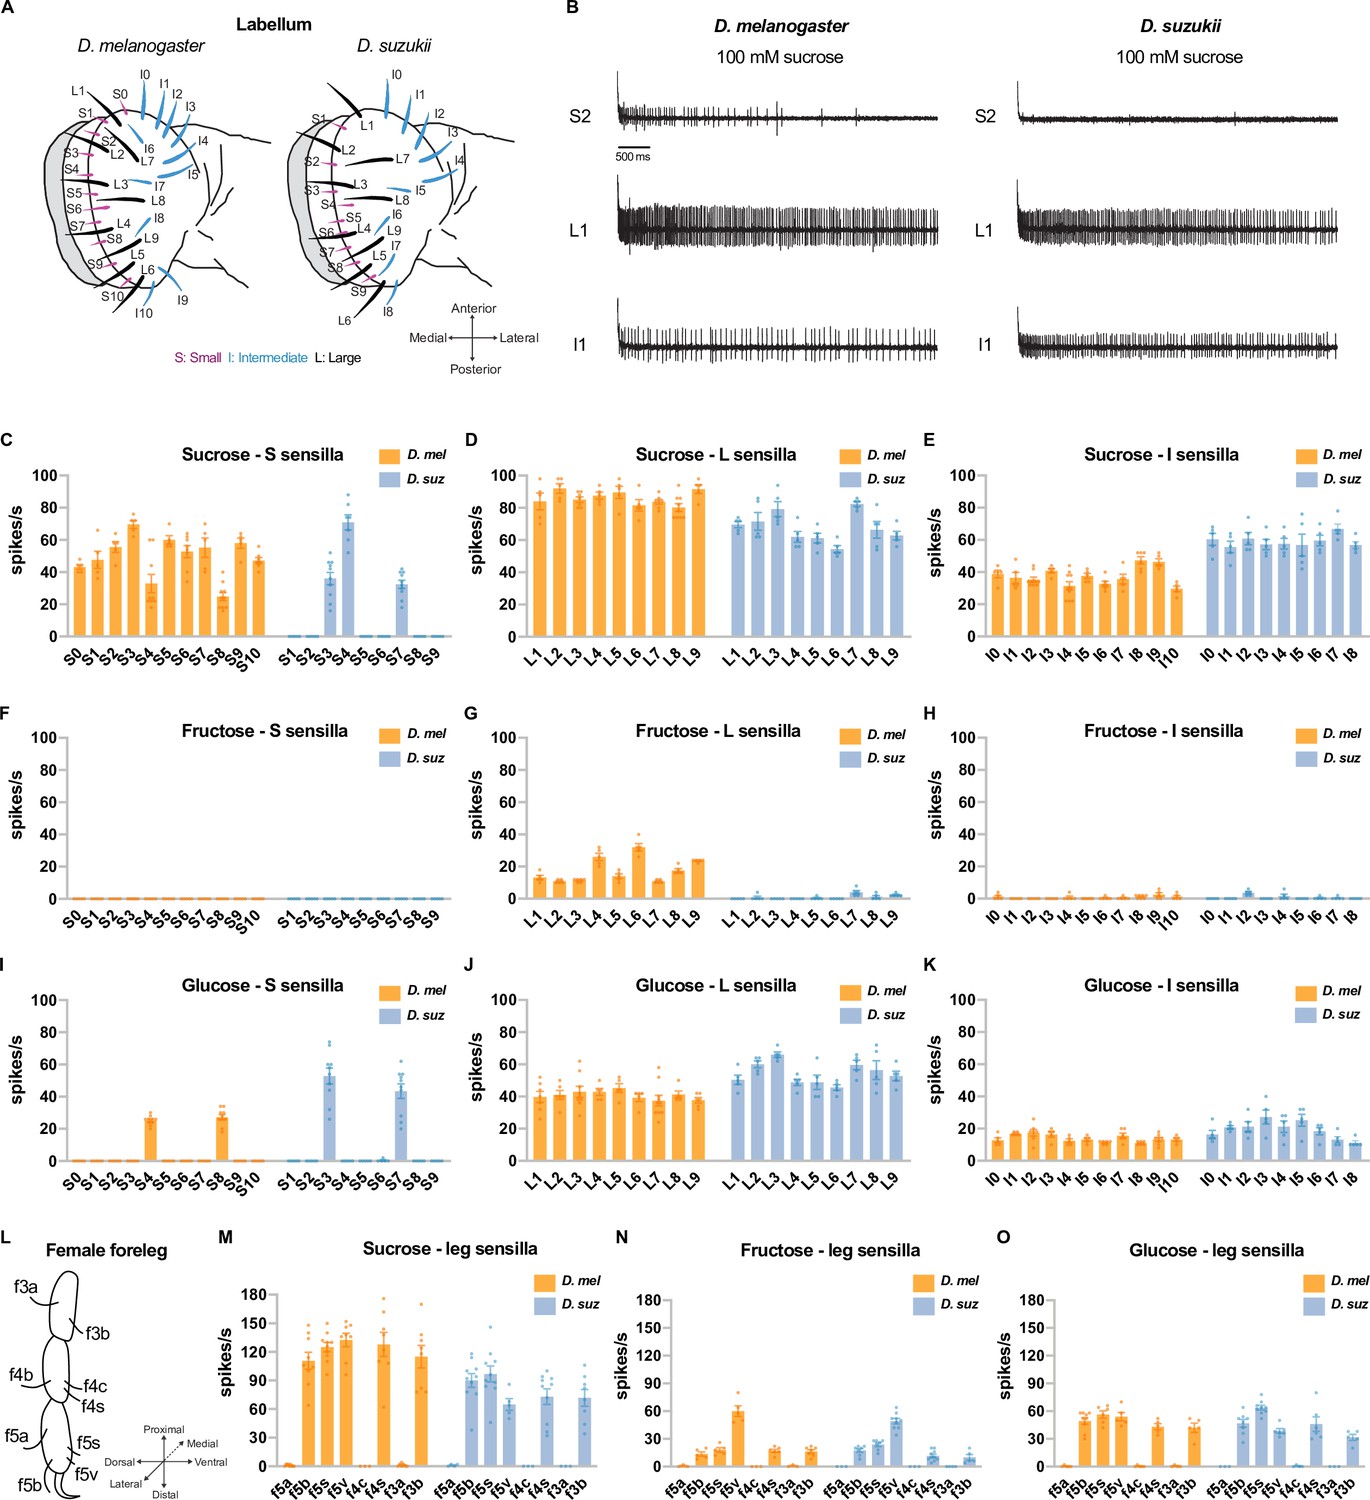
Electrophysiological responses to sugars.
All sugars were tested at 100 mM concentrations. (A) Taste sensilla of the labellum. Figure 3A is reproduced from Figure 3D by Dweck et al., 2021. (B) Sample traces from the indicated sensilla. (C–K) Responses to the indicated sugar of each sensillum of each morphological class: S=small; L=large; I=intermediate. (L) Taste sensilla on the three distal tarsal segments of the female foreleg; the map is the same for D. suzukii and D. melanogaster. (M–O) Responses to the indicated sugar of each of the indicated tarsal sensilla. n=5-10 for responses≥5 spikes/s; otherwise, n=3-10. Error bars are SEM.
Figure 3—figure supplement 1

Dose dependence of sucrose responses.
(A) Sample traces of the L8 sensillum to the indicated sucrose concentrations in each species. (B) Dose dependence of the firing frequency of the L8 sensillum of each species. ns, not significant. *p<0.05. n=5–10. The Mann-Whitney test is used to compare the spike rates between species. (C) Dose dependence of the firing frequency of the L8 sensillum of each species, taken from panel (B). ns, not significant. *p<0.05; **p<0.01; ***p<0.001. The Mann-Whitney test is used to compare the spike rates between different concentrations. (D) Sample traces from the f5s sensillum to the indicated sucrose concentrations in each species. (E) Dose dependence of the firing frequency of the f5s sensillum of each species. ns, not significant. *p<0.05; **p<0.01. n=6–10. The Mann-Whitney test is used to compare the spike rates between species. (F) Dose-dependence of firing frequency of the f5s sensillum of each species, taken from panel (E). ns, not significant. *p<0.05; ***p<0.001; ****p<0.0001. The Mann-Whitney test is used to compare the spike rates between different concentrations. (G and H) Egg-laying preferences for the indicated sucrose concentrations of D. melanogaster (G) and D. suzukii (H). Each egg-laying preference index is compared to 0 using the Wilcoxon signed-rank test. n=18–20. ns, not significant; *p<0.05; **p<0.01; ***p<0.001; ****p<0.0001. Error bars are SEM.
Figure 4 with 1 supplement
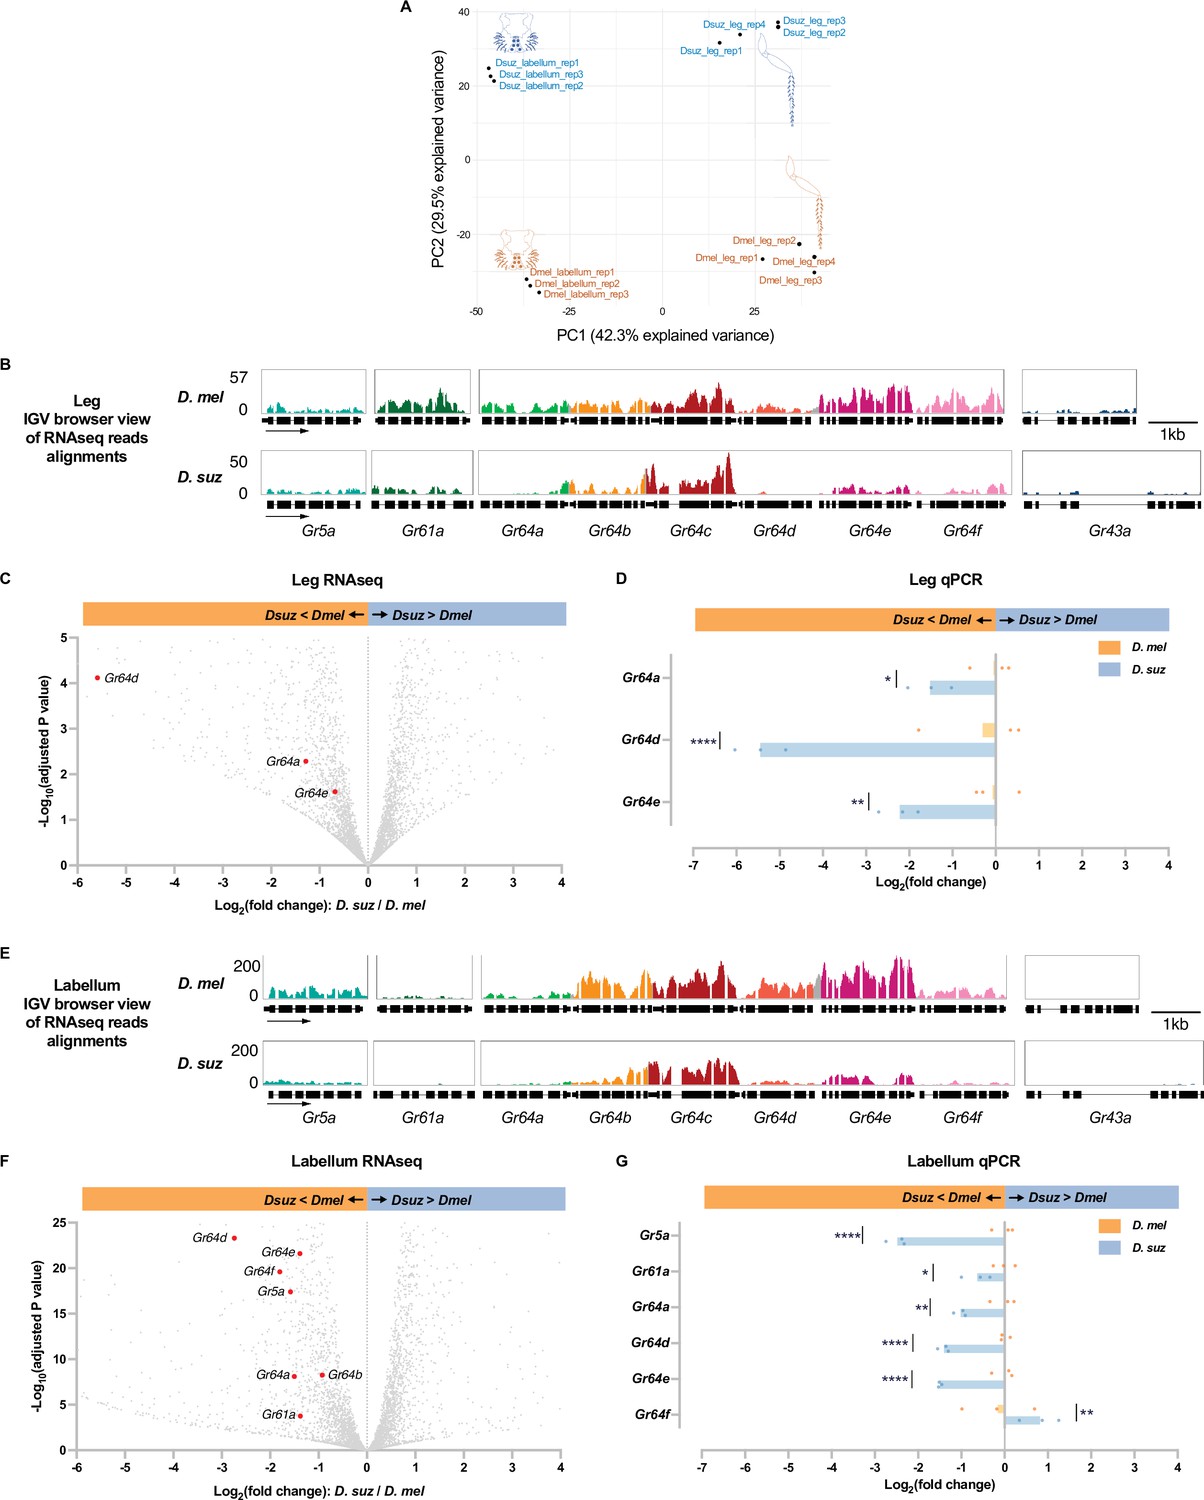
Reduced expression of taste receptor genes in the D. suzukii labellum and leg.
(A) Principal component analysis of the labellar and leg transcriptomes of D. melanogaster and D. suzukii. (B) Integrated genomics viewer (IGV) browser view of the aligned reads of the nine sugar Gr genes from RNAseq of the legs in both species. Y-axis is adjusted based on the number of mapped reads for qualitative comparison between species. (C) Volcano plot of leg transcriptome highlighting differentially expressed sugar Gr genes (|log2FC|≥0.58, adjusted p-value<0.05). All other analyzed genes with −log10 (adjusted p-value) less than 5 and log2 fold-change between –6 and 4 are shown in gray. (D) RT-quantitative PCR (qPCR) analysis of three Gr sugar receptor genes that were differentially expressed in the RNAseq analysis. Multiple unpaired t-tests are used to compare the expression level between species. n=3. *p<0.05; **p<0.01; ****p<0.0001. (E) IGV browser view of the aligned reads of the nine sugar Gr genes from RNAseq of the labellum. Y-axis is adjusted based on the number of mapped reads for qualitative comparison between species. (F) Volcano plot of labellar transcriptome highlighting differentially expressed sugar Gr genes (|log2FC|≥0.58, adjusted p-value<0.05). All other analyzed genes with −log10 (adjusted p-value) less than 25 and log2 fold-change between –6 and 4 are shown in gray. (G) RT-qPCR results of five sugar Gr genes in the labellum. Multiple unpaired t-tests are used to compare the expression level between species. n=3. *p<0.05; **p<0.01; ****p<0.0001.
Figure 4—figure supplement 1
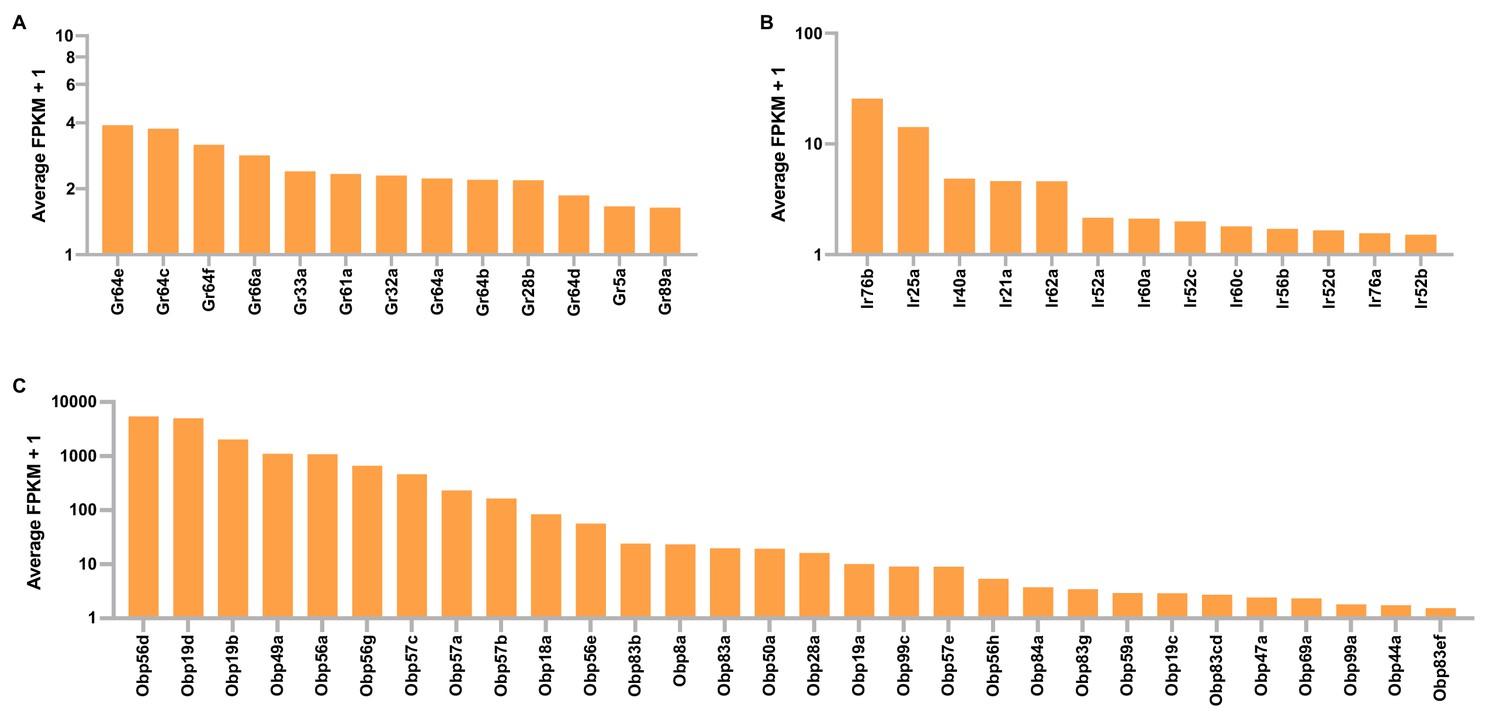
Gustatory receptor (Gr), ionotropic receptor (Ir), and odorant binding protein (Obp) expression in tibial and tarsal leg segments of D. melanogaster.
Shown are leg expression levels of Grs (A), Irs (B), and Obps (C) that have average FPKM (fragments per kilobase of feature per million mapped reads) values ≥0.5.
Figure 5
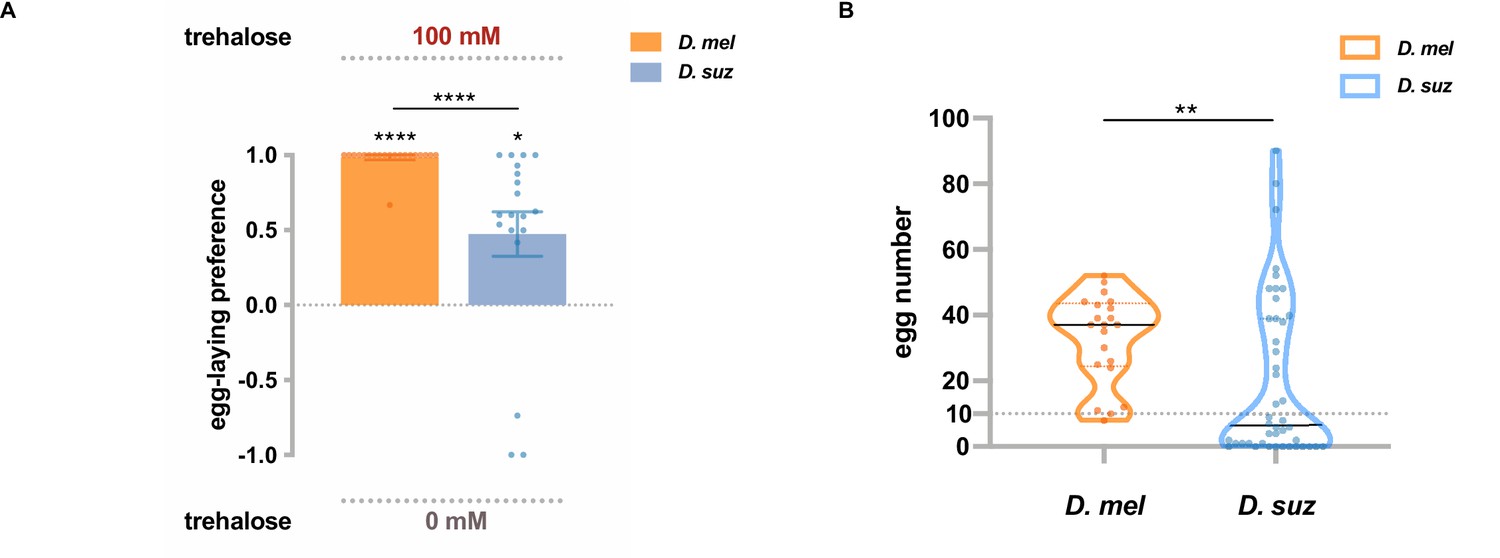
Trehalose elicits reduced egg-laying preference and egg-laying in D. suzukii.
(A) Two-choice egg-laying preferences. n=18–20 plates, each with a single fly. Each egg-laying preference index is compared to 0 using the Wilcoxon signed-rank test. The Mann-Whitney test is used to compare the preference indices between species. (B) The number of eggs laid on the plates used in (A). n=21 plates for D. melanogaster and n=44 plates for D. suzukii; note that a preference index is calculated only when there are at least 10 eggs on a plate, and thus, the n values in (B) exceed those in (A). *p<0.05; **p<0.01; ***p<0.001; ****p<0.0001. Error bars are SEM.
Figure 6
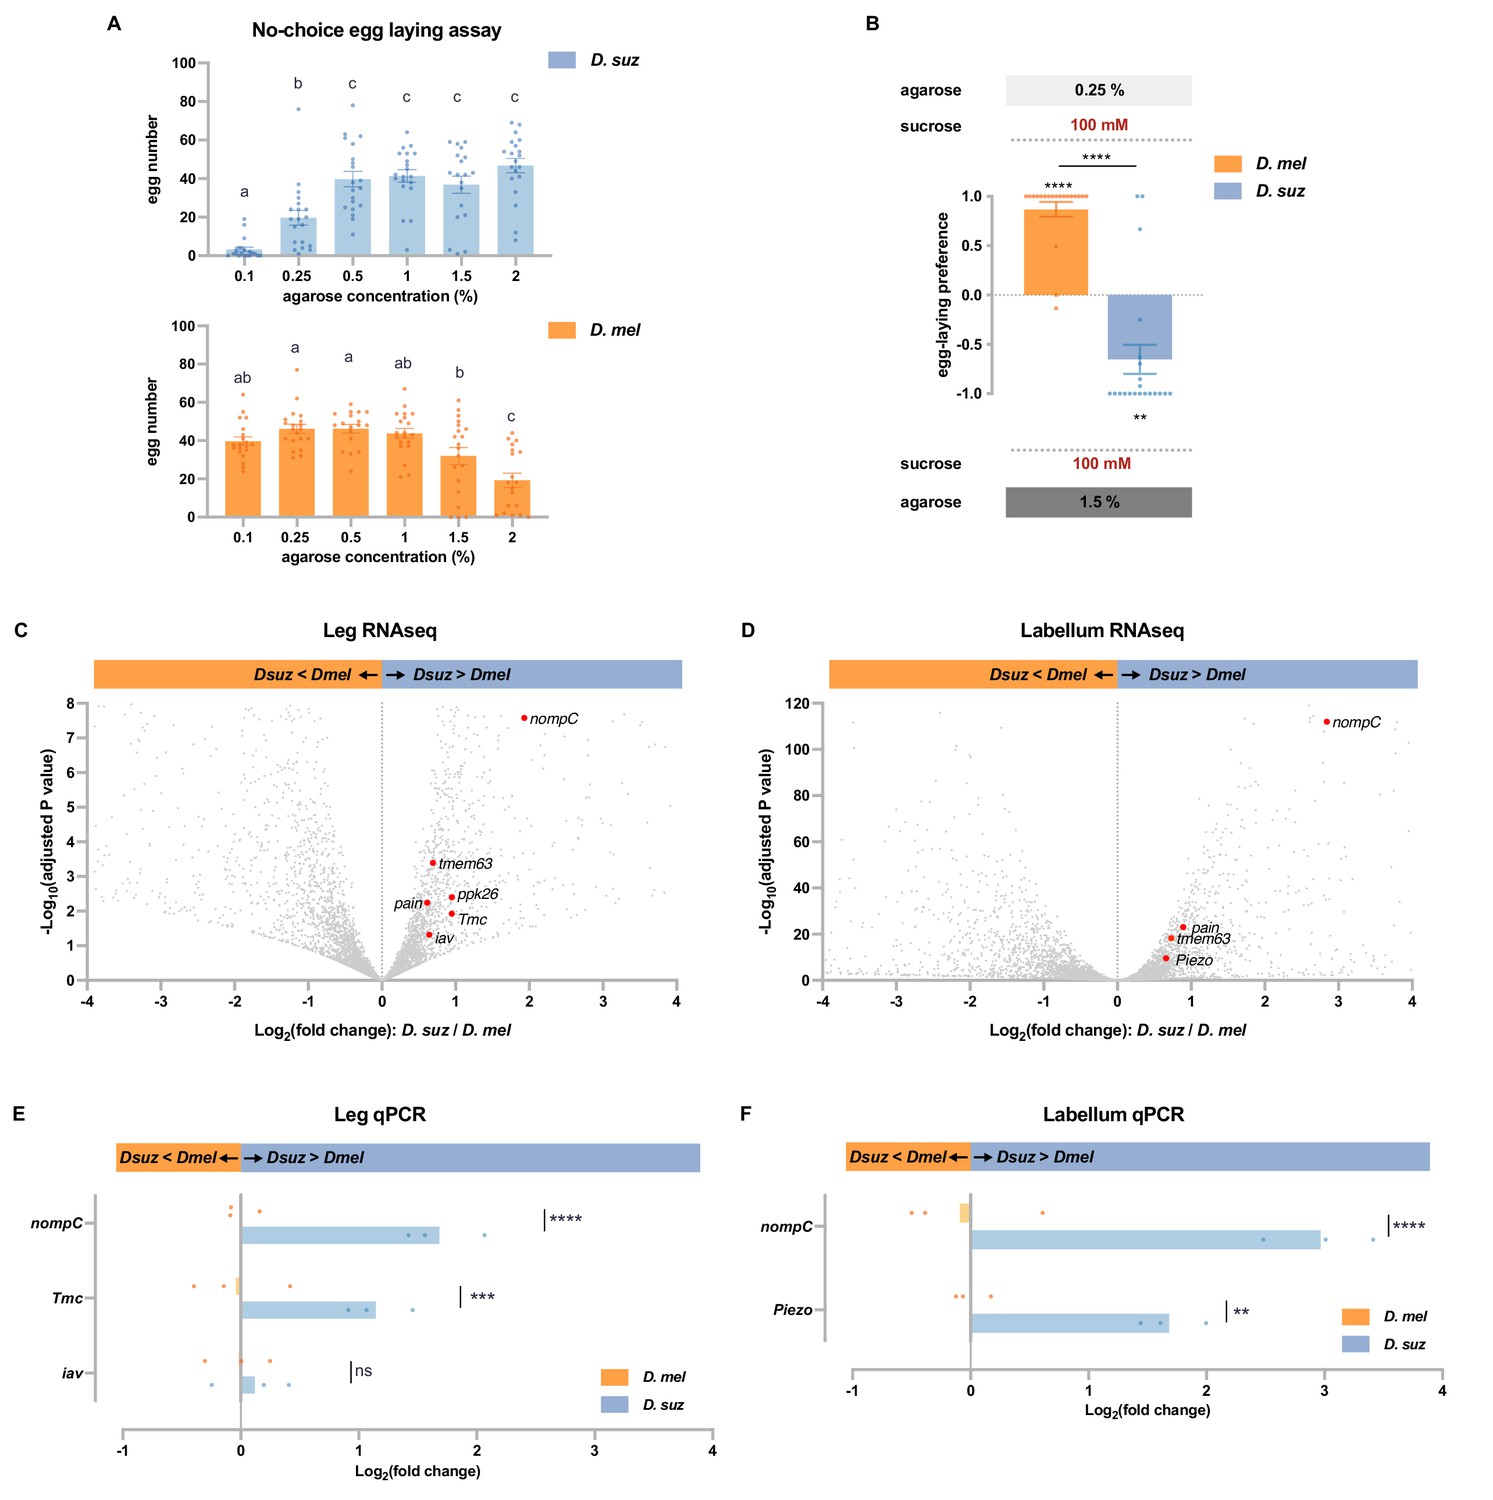
D. suzukii prefers harder substrates than D. melanogaster and expresses higher levels of mechanosensory channels in taste organs.
(A) Numbers of eggs laid in a no-choice egg-laying paradigm on substrates of the indicated agarose concentrations. n=18–20. One-way ANOVA followed by Tukey’s multiple comparison test. Values indicated with different letters are significantly different (p<0.05). Error bars are SEM. (B) Two-choice egg-laying preference test for the indicated agarose concentrations. n=18–20. The Mann-Whitney test is used to compare the preference indices between species. n=18–20. **p<0.01; ****p<0.0001. Error bars are SEM. (C and D) Volcano plots of leg (C) and labellar (D) transcriptomes highlighting differentially expressed mechanosensory channel genes. The background gray dots were all other analyzed genes with −log10 (adjusted p-value) less than 8 (C) or 120 (D) and log2 fold-change between –4 and 4. (E and F) RT-quantitative PCR (qPCR) results for selected mechanosensory channel genes that were found to differ in expression levels between species by RNAseq analysis in leg (E) and labellum (F). Multiple unpaired t-tests are used to compare the expression level between species. n=3. ns, not significant; **p<0.01; ***p<0.001; ****p<0.0001.
Figure 7
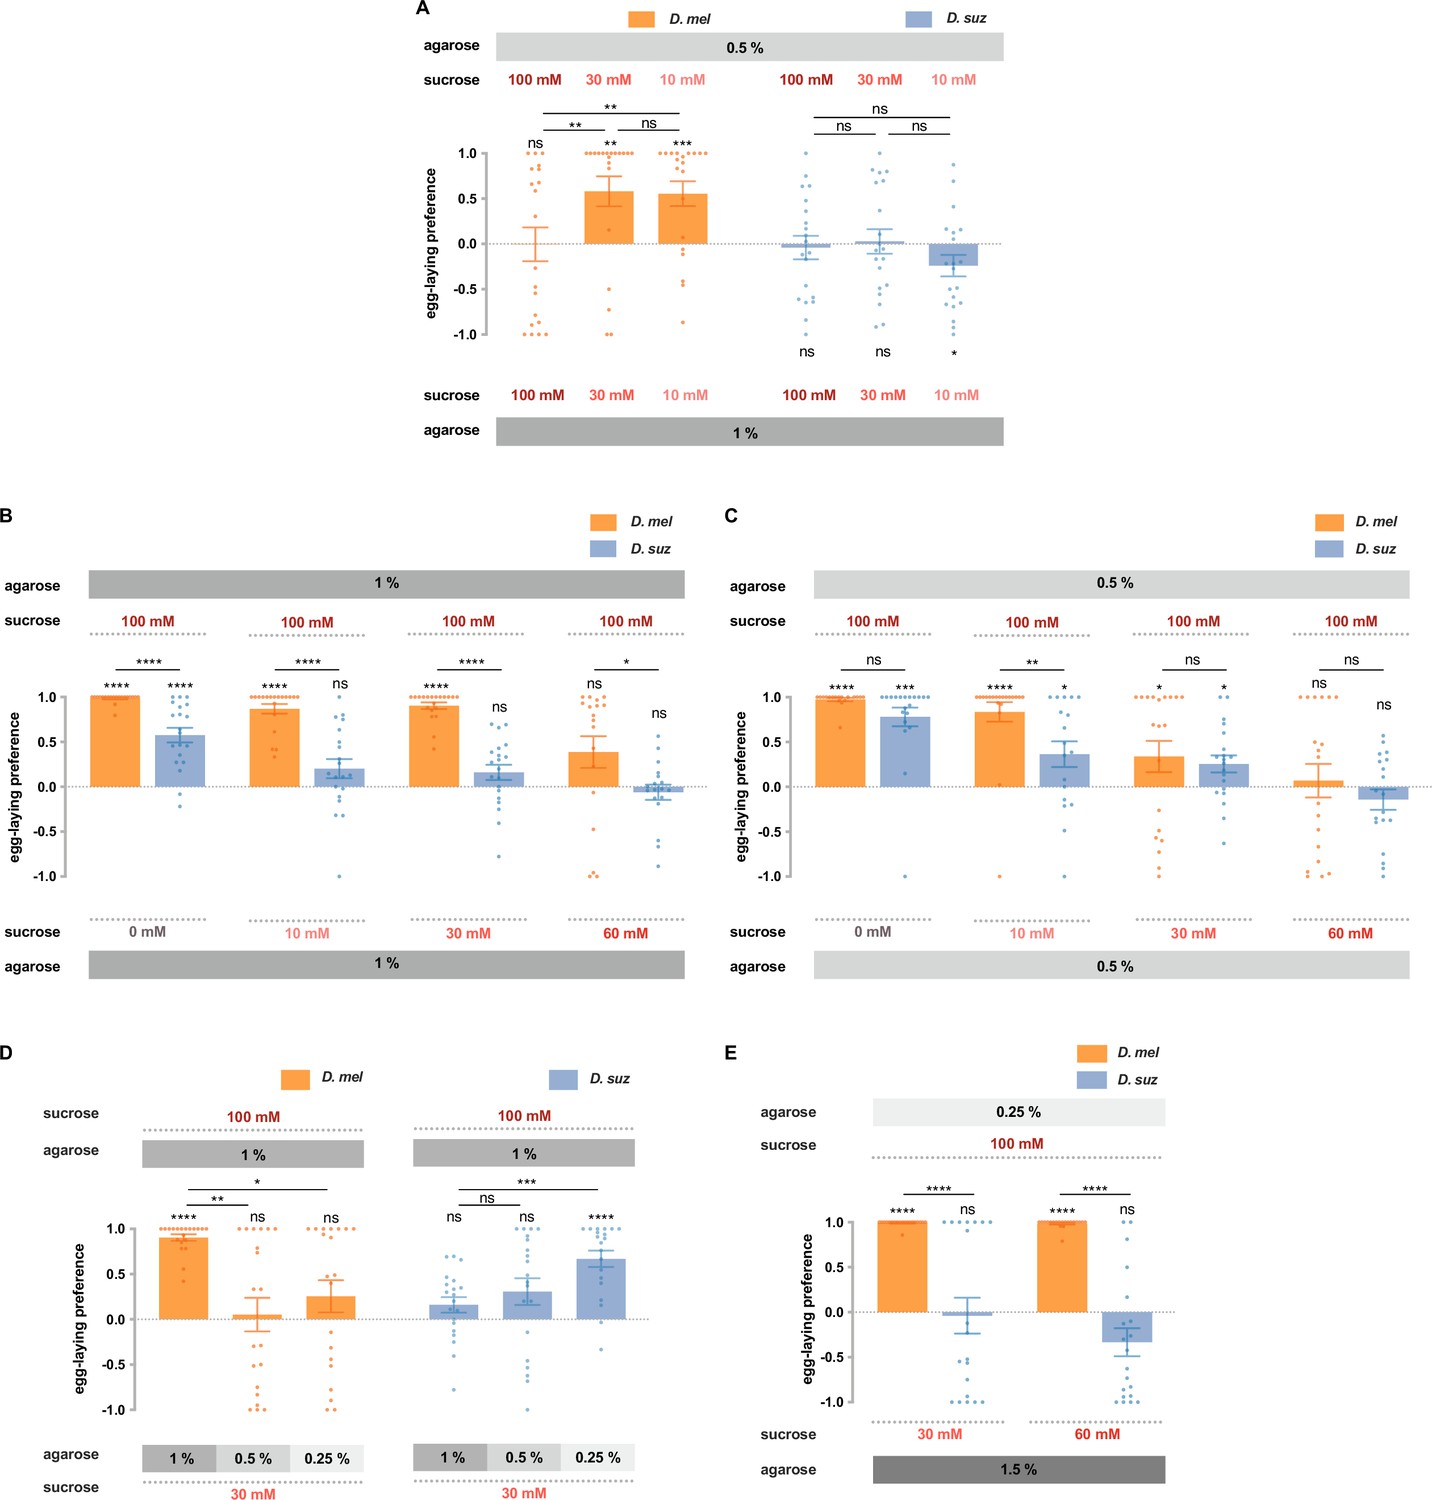
D. suzukii and D. melanogaster respond differently to combinations of sweetness and stiffness.
(A) The egg-laying preferences of D. suzukii and D. melanogaster for substrates with the same sweetness but different stiffness. (B) The egg-laying preferences for substrates with the same stiffness (1% agarose) but different sweetness (taken from Figure 2B). (C) The egg-laying preference for substrates with the same stiffness (0.5% agarose) but different sweetness. (D and E) D. melanogaster and D. suzukii respond differently to different combinations of sweetness and stiffness. In D, the first and fourth columns (D. melanogaster and D. suzukii’s preference for 100 mM sucrose in 1% agarose vs. 30 mM sucrose in 1% agarose) are taken from Figure 2B and Figure 7B. In all panels, n=18–20, error bars indicate SEM, the Mann-Whitney test is used to compare between two conditions, and the egg-laying preference index is compared to 0 by the Wilcoxon signed-rank test. ns, not significant; p>0.05, * p<0.05, ** p<0.01, *** p<0.001, and **** p<0.0001.
Additional files
-
Supplementary file 1
FPKM values for D. melanogaster leg RNAseq.
- https://cdn.elifesciences.org/articles/81703/elife-81703-supp1-v1.xlsx
-
Supplementary file 2
TPM values for all RNAseq samples of D. melanogaster and D. suzukii.
- https://cdn.elifesciences.org/articles/81703/elife-81703-supp2-v1.xlsx
-
Supplementary file 3
DESeq2 differential gene expression analysis of leg RNAseq between D. suzukii and D. melanogaster.
- https://cdn.elifesciences.org/articles/81703/elife-81703-supp3-v1.xlsx
-
Supplementary file 4
DESeq2 differential gene expression analysis of labellum RNAseq between D. suzukii and D. melanogaster.
- https://cdn.elifesciences.org/articles/81703/elife-81703-supp4-v1.xlsx
-
MDAR checklist
- https://cdn.elifesciences.org/articles/81703/elife-81703-mdarchecklist1-v1.docx
Download links
A two-part list of links to download the article, or parts of the article, in various formats.
Downloads (link to download the article as PDF)
Open citations (links to open the citations from this article in various online reference manager services)
Cite this article (links to download the citations from this article in formats compatible with various reference manager tools)
Sugar sensation and mechanosensation in the egg-laying preference shift of Drosophila suzukii
eLife 11:e81703.
https://doi.org/10.7554/eLife.81703


