PASK links cellular energy metabolism with a mitotic self-renewal network to establish differentiation competence
- Department of Biology, College of Arts and Sciences, University of Kentucky, Thomas Hunt Morgan Building, United States
- Weill Cornell/Rockefeller/Sloan Kettering Tri-Institutional MD-PhD Program, United States
- Molecular and Cellular Biochemistry, College of Medicine, University of Kentucky, United States
- Cecil H. and Ida Green Center for Reproductive Biology Sciences, Children’s Medical Center Research Institute, Department of Obstetrics & Gynecology, Hamon Center for Regenerative Science and Medicine at the University of Texas Southwestern Medical Center, United States
- Department of Neuroscience, College of Medicine, University of Kentucky, United States
Figures
Figure 1 with 4 supplements
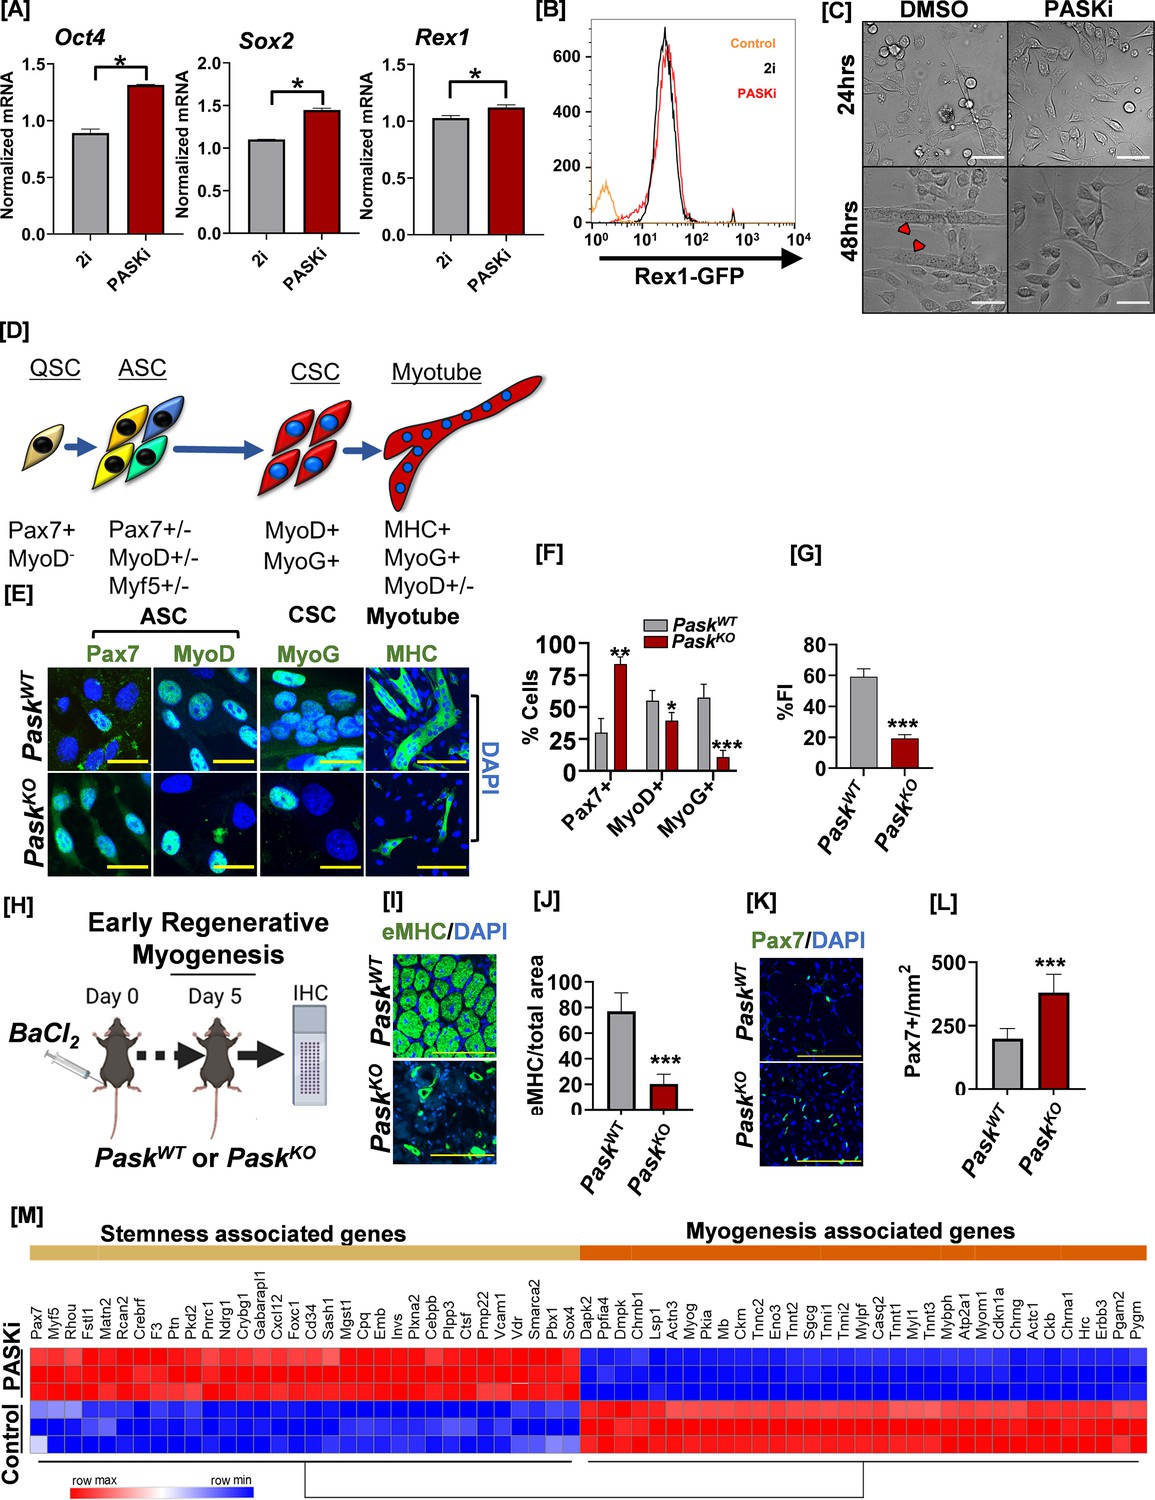
Inhibition of PAS domain-containing kinase (PASK) preserves pluripotency, decreases muscle stem cell (MuSC) heterogeneity, and inhibits precocious differentiation.
(A) RT-qPCR analysis of indicated transcript levels from 2i+LIF cultured mouse embryonic stem cells (mESCs) after transitioning into 2i+LIF or PASKi+LIF conditions and cultured for 4 days. *p<0.05, error bars ± SD. (B) Rex1-GFP intensity levels from mESCs cultured in 2i vs. in PASKi as in (A). Rex1-GFP reporter expression was quantified by flow cytometry against a non-fluorescent control (control). (C) Isolated primary myoblasts were treated with DMSO or 50 µM PASKi for 4 days during the normal growth phase. Microscopy images were taken at 24 hr or 48 hr post-isolation and treatment. Scale bar = 40 µm. (D) Myogenic transcription factor progression of MuSCs after initial activation from quiescent (Pax7+) state. Activated MuSCs (ASC) are a highly heterogeneous population marked by varying levels and coexpression patterns of Pax7, MyoD, and Myf5. MyoD+ASC further differentiates into MyoG+ committed stem cells (CSC). CSC progenitors initiate a differentiation program to generate myotubes. (E) Expression pattern of myogenic regulatory factors in fluorescence-activated cell sorting (FACS)-sorted PaskWT and PaskKO myoblasts 48 hr after isolation. (F) Quantification of percent Pax7+, MyoD+, and MyoG+ cells from PaskWT and PaskKO animals. Error bars ± SD. *p<0.05, **p<0.005, ***p<0.0005 (KO vs. WT). (G) Fusion index (% nuclei in myotubes/total nuclei) was calculated from MHC-stained cells isolated from PaskWT or PaskKO animals. Error bars ± SD. ***p<0.0005 (KO vs. WT). (H) Experimental setup designed to compare the in vivo regeneration capabilities between PaskWT and PaskKO animals. (I) Embryonic myosin heavy chain (eMHC) staining of fresh-frozen muscle sections from mice of indicated genotype 5 days after muscle injury. DAPI marked nuclei, which are centrally localized in muscle sections from both animals, indicate of muscle regeneration in progress. (J) Quantification of eMHC+ myofiber numbers from experiment in Figure (I). Error bars ± SD. ***p<0.0005 (KO vs. WT). (K) Muscle sections from PaskWT or PaskKO animals were stained with anti-Pax7 (green) antibodies 5 days post-injury and centrally located nuclei were visualized using DAPI. (L) Quantification of Pax7+ cell numbers in PaskWT vs. PaskKO muscle sections 5 days post-injury. Error bars ± SD, ***p<0.0005 (KO vs. WT). (M) Heatmap of differentially expressed genes associated with stemness and myogenesis in C2C12 myoblasts treated with DMSO (control) or PASKi for 2 days.
-
Figure 1—source data 1
Source data used to generate Figure 1.
- https://cdn.elifesciences.org/articles/81717/elife-81717-fig1-data1-v2.zip
-
Figure 1—source data 2
Source data used to generate Figure 1.
- https://cdn.elifesciences.org/articles/81717/elife-81717-fig1-data2-v2.xlsx
Figure 1—figure supplement 1
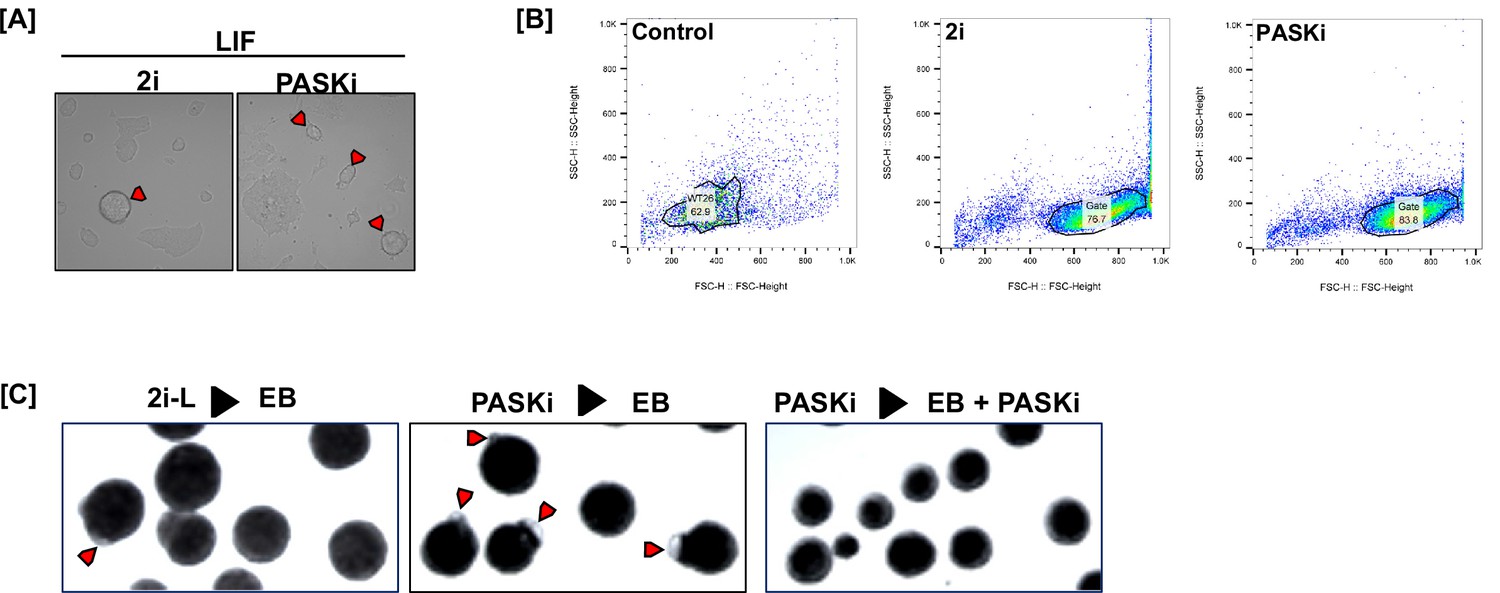
Maintenance of pluripotency and improvement of stemness properties by PAS domain-containing kinase (PASK) inhibition.
(A) Morphological comparison of mouse embryonic stem cells (mESCs) grown in 2i media vs. 75 µM PASKi media. mESCs were first cultured in 2i media to maintain pluripotency. 2i media was subsequently changed to 2i or PASKi. Cells were cultured in this media for 4 days. (B) Flow cytometry gating from the experiment in Figure 1A. (C) Embryoid body formation assay following 2i or PASKi withdrawal. Arrows indicate embryoid bodies showing at least a small, translucent fluid-filled cavitation. Box indicates a magnified section of the field. Scale bar = 100 µm.
Figure 1—figure supplement 2
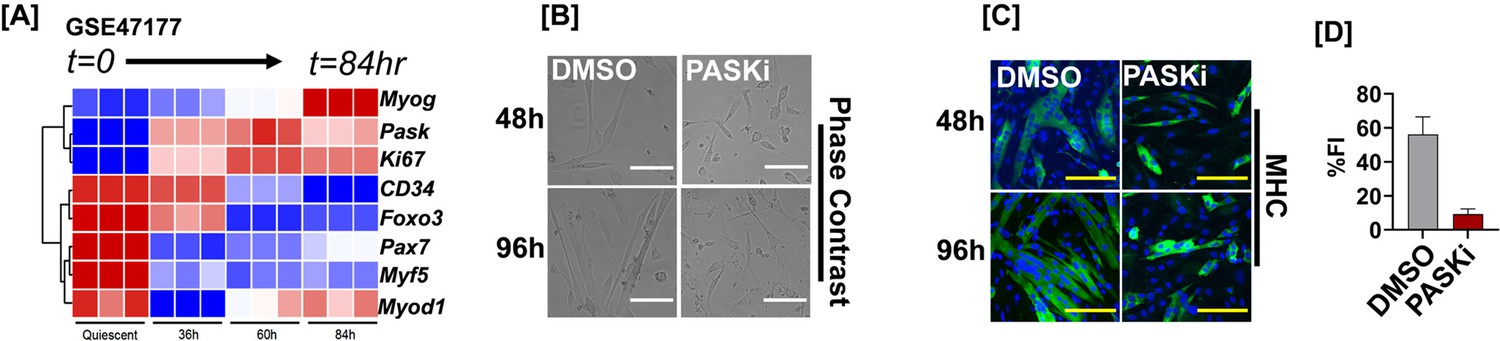
PAS domain-containing kinase (PASK) inhibition sustains the proliferation of isolated primary myoblasts and blocks precocious differentiation.
(A) Heatmap of muscle stem cell (MuSC)-associated gene expression in isolated MuSCs during their quiescence and activation (Gene Expression Omnibus GSE47177). (B) Comparative brightfield images of fluorescence-activated cell sorting (FACS)-sorted MuSCs cultured in DMSO or 50 µM PASKi for the indicated time. Scale bar = 40 µM. (C) MHC staining and (D) fusion index calculations of isolated myoblasts in control vs. PASKi-treated conditions. The fusion index was calculated for cells at 96 hr post-isolation.
Figure 1—figure supplement 3
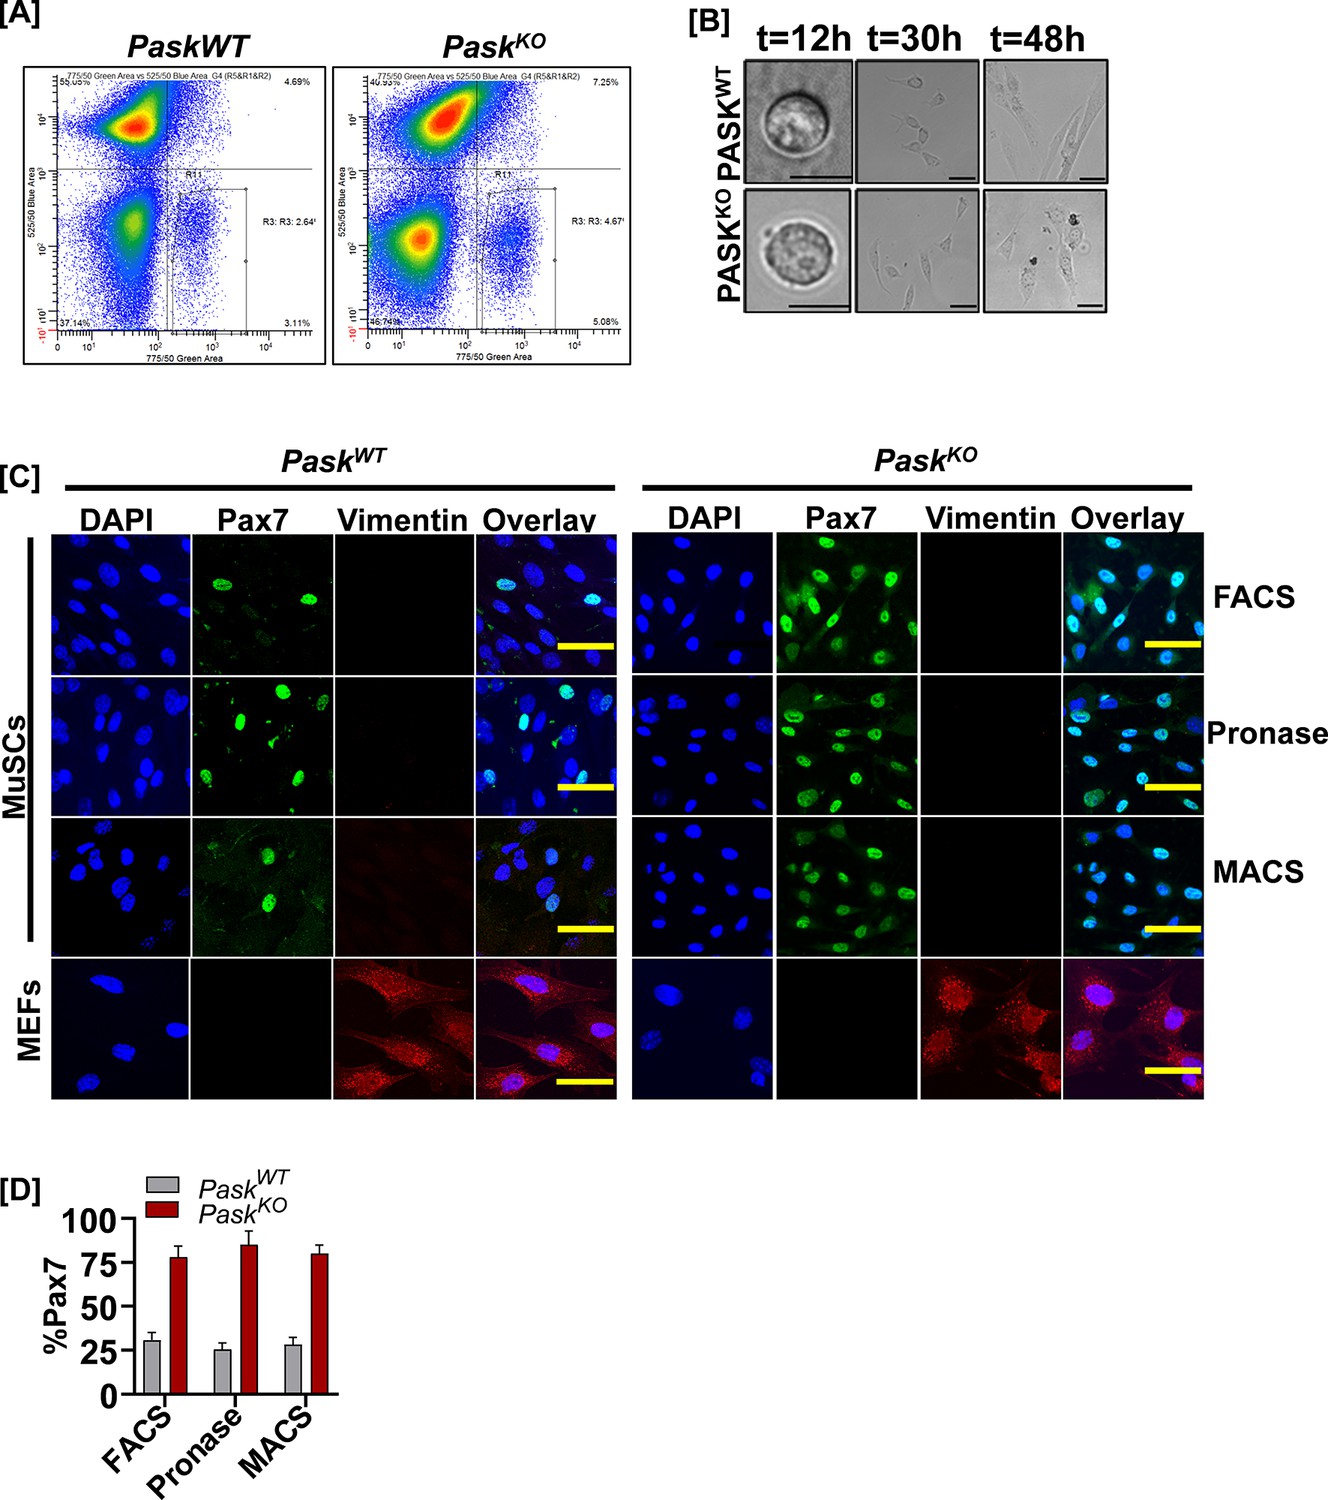
Characterization of primary myoblasts isolated from PaskWT or PaskKO animals.
(A) Sorting strategy to purify Sca1-, CD45-, CD31-, VCAM+, α7-Integrin+ muscle stem cells (MuSCs). (B) Comparative brightfield images of fluorescence-activated cell sorting (FACS)-sorted MuSCs from PaskWT or PaskKO animals cultured for the indicated time. Scale bar = 20 µM. (C) Comparison of Pax7 expression in MuSCs isolated from PaskWT or PaskKO animals using three different methods of obtaining myoblasts. Vimentin (red) staining was used to detect the presence of any contaminating fibroblasts. Mouse embryonic fibroblasts (MEFs) were isolated from PaskWT or PaskKO embryos and used as a positive control for vimentin staining. (D) Quantification of %Pax7+ myoblasts from data in (C).
Figure 1—figure supplement 4
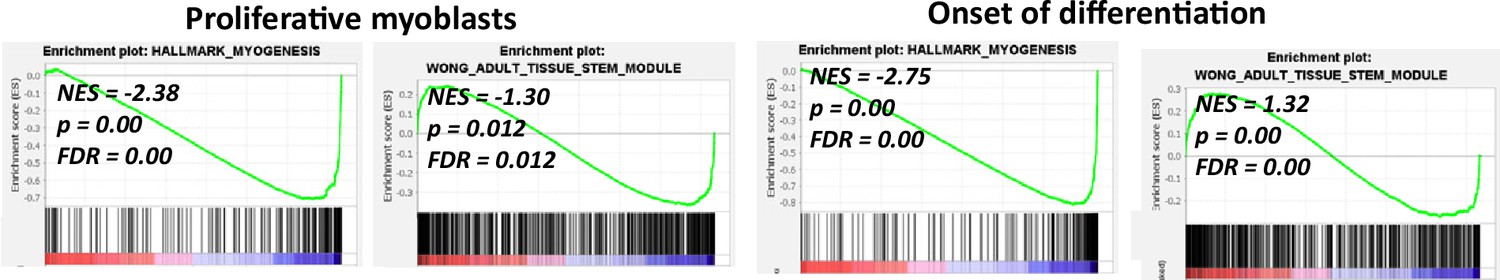
Analysis of RNAseq data from cultured myoblasts.
Gene set enrichment analysis of RNAseq data from C2C12 myoblasts treated with DMSO or PASKi.
Figure 2 with 1 supplement
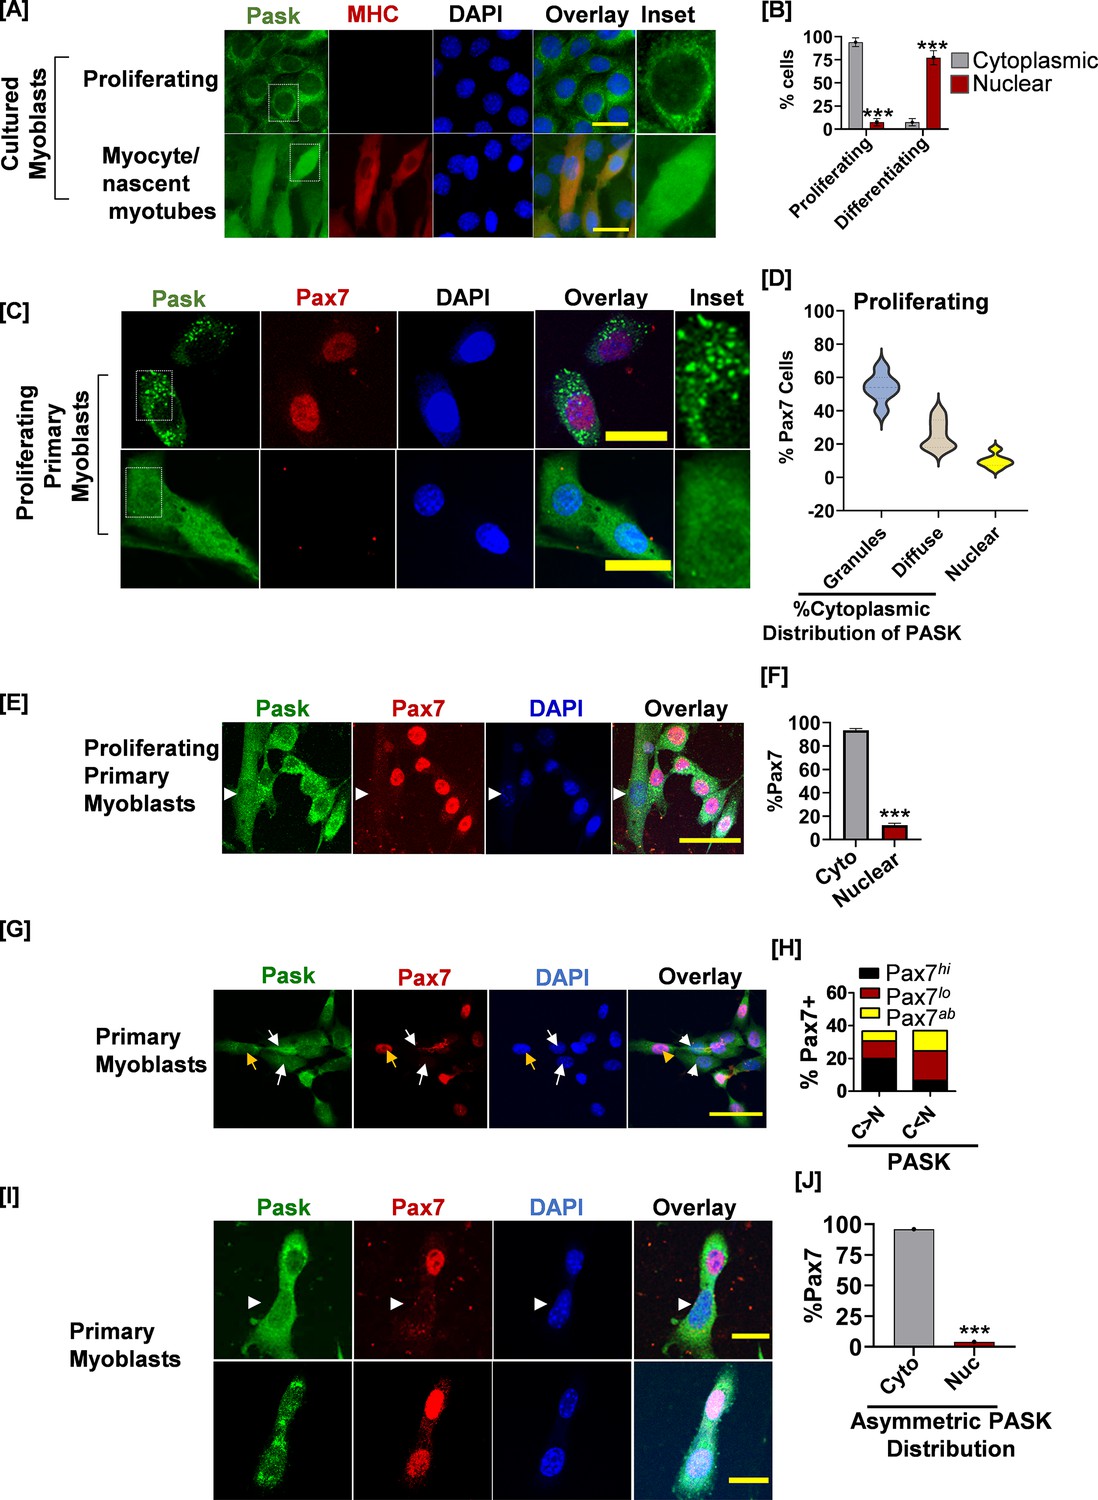
PAS domain-containing kinase (PASK) is localized in the cytoplasmic granules in self-renewing stem cells, which is redistributed to nucleus in Pax7-deficient cells.
(A) Proliferating or differentiating C2C12 myoblasts were stained with anti-PASK (green), anti-MHC (MF20, red), or nuclei marker, DAPI antibody. Scale bar = 20 µm. The inset picture shows an enlarged view of the relative distribution of PASK in proliferating or differentiating myoblasts. Notice a granular or punctate staining pattern of endogenous PASK in C2C12 myoblasts in proliferative conditions. (B) Quantification of PASK subcellular distribution as a function of myoblasts state. Error bars ± SD, ***p<0.0005 (Nuclear PASK in Differentiating vs. proliferating). (C) Fluorescence-activated cell sorting (FACS)-sorted muscle stem cells (MuSCs) from uninjured WT mice were stained for PASK and Pax7 24 hr after isolation. Notice a strong, granular staining pattern of PASK in the top panel, which is correlated with Pax7 positivity. The bottom panel shows uniform distribution of PASK, including in the nucleus. The inset picture shows the cytoplasmic granular staining pattern of PASK. (D) Violin plot showing a relationship between the subcellular localization of PASK and Pax7 expression. (E) FACS-sorted myoblasts were fixed 36 hr post-isolation and stained with PASK (green) and Pax7 (red). Arrow indicates nuclear PASK in early mononucleated myotubes. (F) Quantification of images from the experiment in (F). Error bars ± SD, ***p<0.0005 (Pax7+ in nuclear vs. cytosolic PASK). (G) Distribution of Pax7 expression (red) (high, low, or absent, as indicated by Pax7hi, Pax7lo, Pax7ab) in primary myoblasts with more cytosolic (C>N) vs. more nuclear (C<N) PASK (green). The yellow arrow indicates an example of a Pax7hi cell in which the PASK is cytoplasmic. The white arrow indicates Pax7L0 cells in which a large proportion of PASK is diffused nuclear. (H) Quantification of % Pax7+ myoblasts numbers as a function of relative PASK subcellular distribution. (I) Asynchronously proliferating primary myoblasts were stained with PASK and Pax7 antibodies. Notice the exclusion of Pax7 from daughter mitotic cells with asymmetric nuclear localization of PASK (white arrow). Scale bar = 40 µm. Error bars ± SD, ***p<0.0005 (Pax7+ in nuclear vs. cytosolic PASK).
Figure 2—figure supplement 1
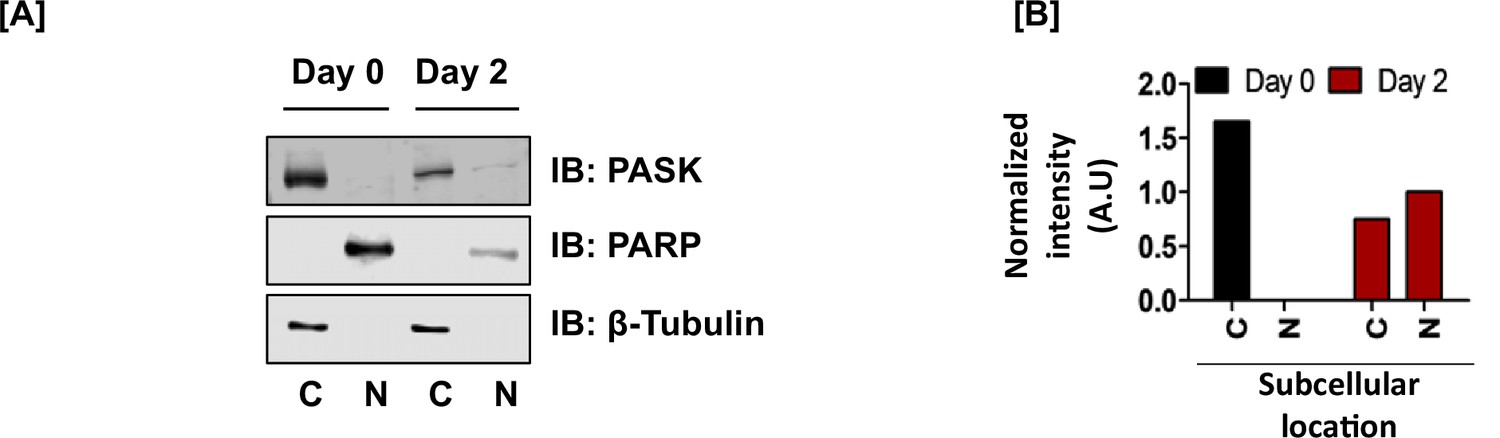
Subcellular fractionation of PAS domain-containing kinase (PASK) in proliferating vs. differentiating myoblasts.
(A) Cytoplasmic and nuclear fractionation of C2C12 cells on day 0 and day 2 showing increased nuclear accumulation of PASK during differentiation. Notice reduced levels of Parp in the nuclear fraction of differentiated cells (day 2) compared with proliferating cells (day 1). (B) Relative abundance of PASK in cytoplasmic or nuclear fraction at day 0 or day 2. For cytoplasmic and nuclear fractions, tubulin and Parp, respectively, were used to quantify PASK abundance.
-
Figure 2—figure supplement 1—source data 1
Source data used to generate Figure 2—figure supplement 1.
- https://cdn.elifesciences.org/articles/81717/elife-81717-fig2-figsupp1-data1-v2.zip
Figure 3 with 1 supplement
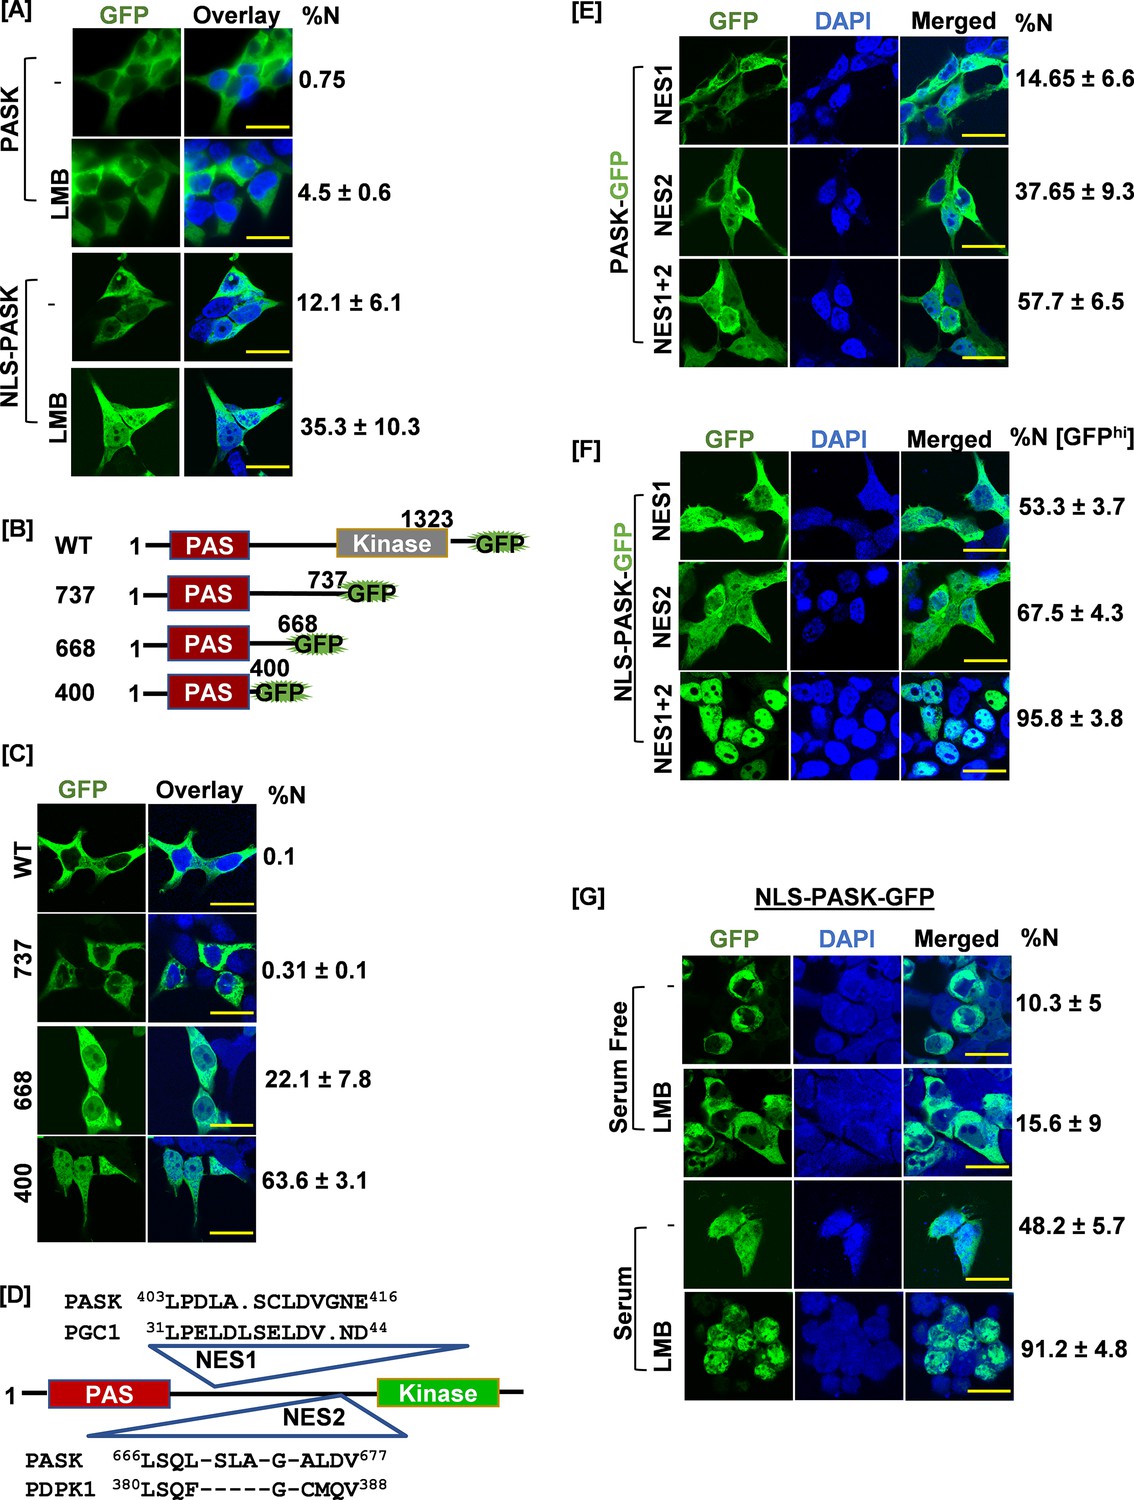
Signal regulated nuclear import mechanism for PAS domain-containing kinase (PASK).
(A) HEK-293T cells were transfected with GFP-tagged full-length human PASK (aa 1–1323, WT) or GFP-tagged full-length SV40 NLS-PASK (aa 1–1323, NLS-WT). Cells were treated with 25 nM leptomycin B (LMB) for 2 hr as indicated and analyzed by confocal microscopy. The percentage of cells containing any GFP signal in the nucleus in each condition was quantified (% cells showing nuclear [N± SD] GFP). All scale bars = 40 µm. (B) Domain illustration depicting GFP-tagged WT hPASK (aa 1–1323) and its truncated versions, GFP-tagged fragment 737 (aa 1–737), 668 (aa 1–668), and 400 (aa 1–400). The PAS domain is highlighted in red. (C) HEK-293T cells were transfected with GFP-tagged full-length PASK (aa 1–1323, WT) and various truncations. Cells were analyzed by confocal microscopy. The percentage of cells containing any GFP signal in the nucleus was included in the quantification (%N± SD). (D) Diagram showing the locations of two nuclear export sequences (NES1 and NES2) and their sequence homology relative to PGC1 (NES1) and PDPK1 (NES2), respectively. (E) HEK-293T cells were transfected with GFP-tagged full-length WT PASK (aa 1–1323, WT) or NES1 (L403AL405S) or NES2 (L666SL671A). Cells were analyzed by confocal microscopy. The percentage of cells containing any GFP signal in the nucleus in each condition was quantified (% N± SD). (F) HEK-293T cells were transfected with GFP-tagged SV40 NLS-PASK (NLS-hPASK-GFP) containing mutated nuclear export sequences (NES1, NES2, or combined NES 1+2). Cells were analyzed by microscopy. The percentage of cells containing strong GFP signal (GFPhi) in the nucleus in each condition was quantified (% N± SD). (G) HEK-293T cells were transfected with GFP-tagged full-length SV40 NLS-hPASK (aa 1–1323, NLS-PASK-GFP). Cells were serum-starved (0.1% serum) for 12 hr and then subsequently stimulated with either 0.1% serum (serum free) or 20% serum (serum) for 2 hr. Cells were treated with 25 nM leptomycin B (LMB), where indicated and analyzed by confocal microscopy. The percentage of cells containing any GFP signal in the nucleus in each condition was quantified (% N± SD).
-
Figure 3—source data 1
Source data used to generate Figure 3.
- https://cdn.elifesciences.org/articles/81717/elife-81717-fig3-data1-v2.zip
-
Figure 3—source data 2
Source data used to generate Figure 3.
- https://cdn.elifesciences.org/articles/81717/elife-81717-fig3-data2-v2.zip
-
Figure 3—source data 3
Source data used to generate Figure 3.
- https://cdn.elifesciences.org/articles/81717/elife-81717-fig3-data3-v2.zip
Figure 3—figure supplement 1
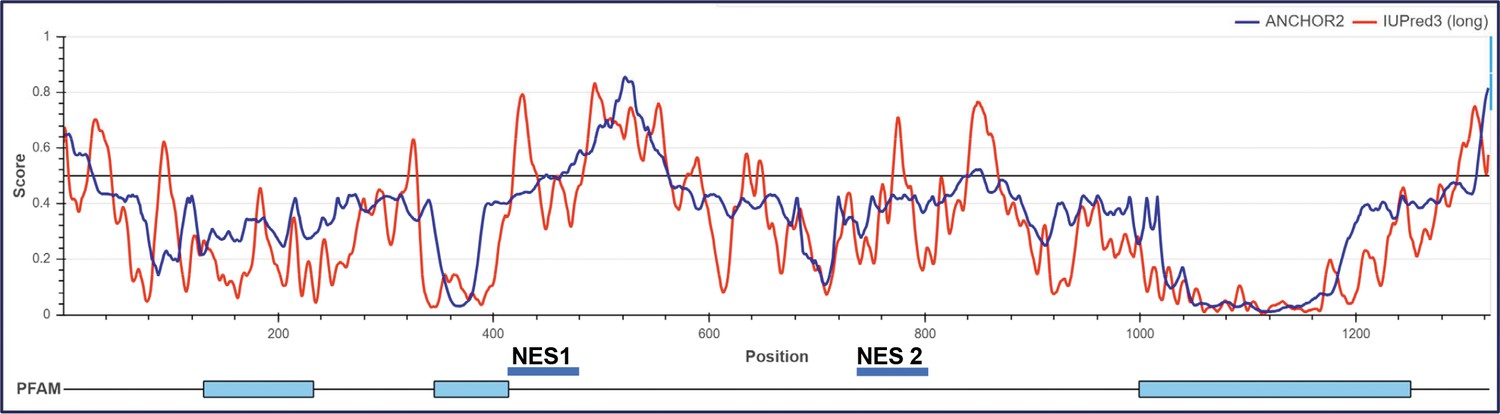
Prediction of PAS domain-containing kinase (PASK) nuclear export sequences.
Organization of secondary structure of human PASK that could participate in protein-protein interaction during nuclear export. Anchor scores indicated disorder structure that is predicted to engage in protein-protein interactions.
Figure 4 with 1 supplement
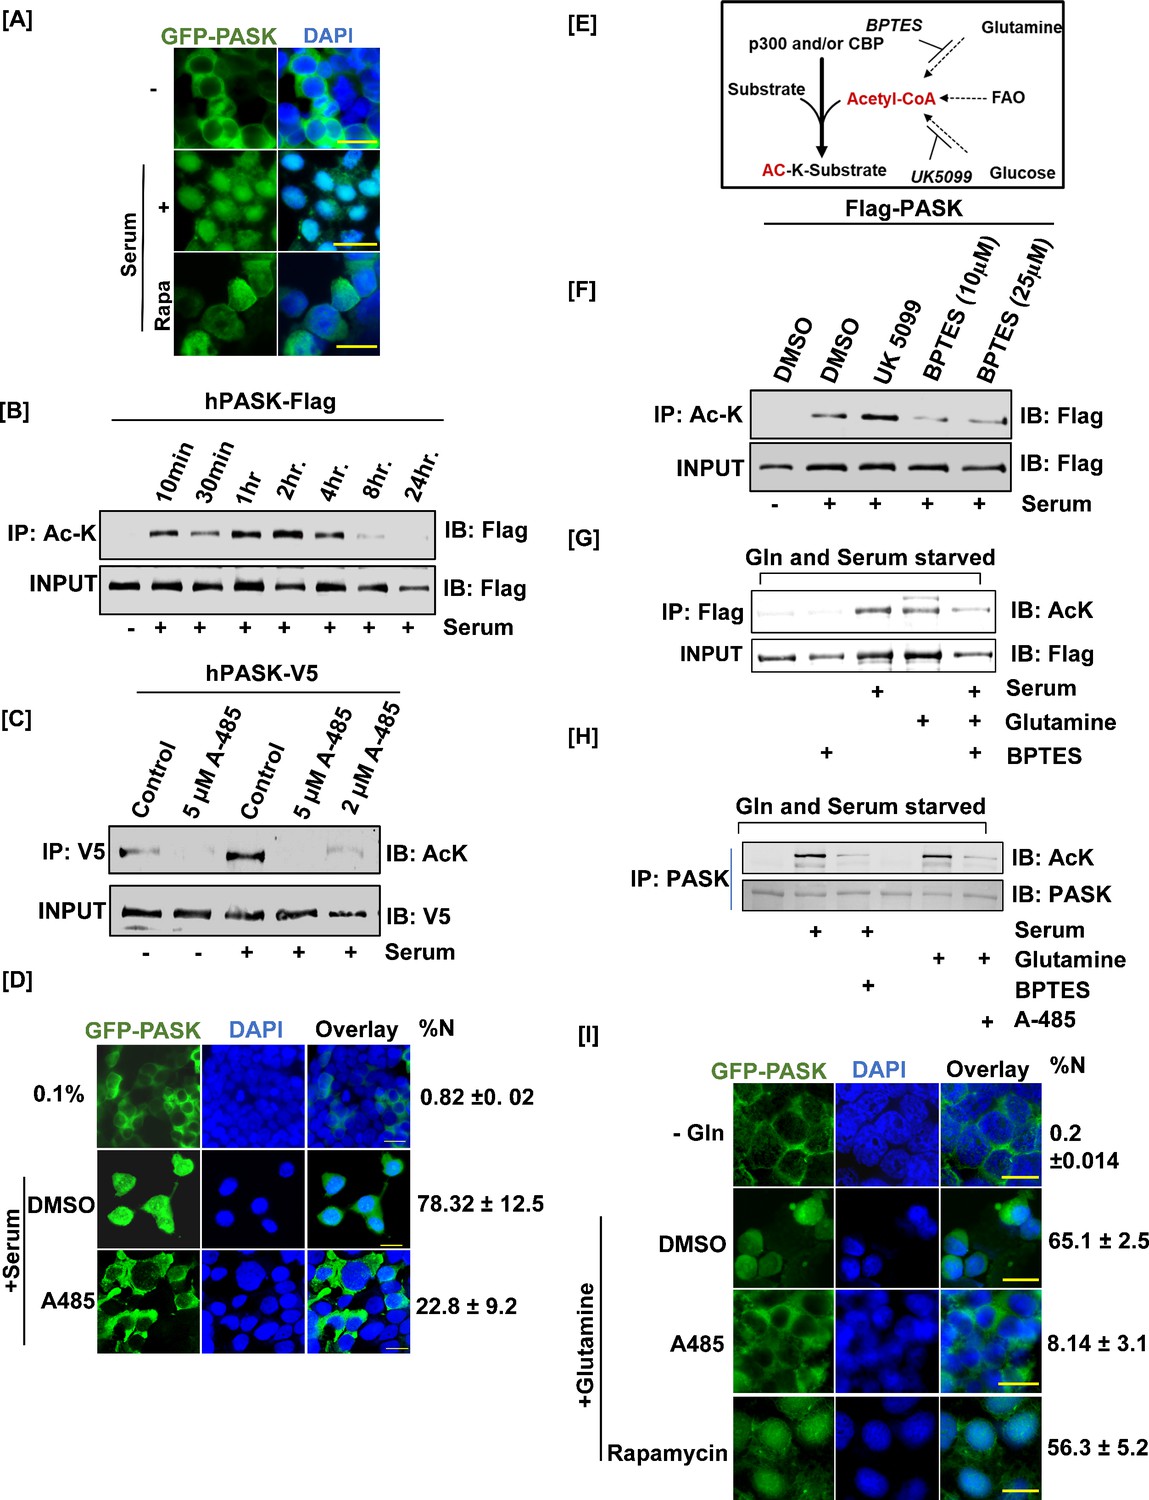
Mitochondrial glutamine metabolism stimulates CBP/EP300-dependent acetylation of PAS domain-containing kinase (PASK) to drive its nuclear translocation.
(A) HEK-293T cells stably expressing GFP-tagged full-length WT PASK (aa 1–1323) were serum-starved (0.1% serum) for 12 hr and then stimulated for 2 hr with 20% serum. For the rapamycin-treated condition, cells were pretreated with 100 nM rapamycin for 2 hr in serum-free conditions prior to 20% serum induction. Scale bar = 40 µm. Since LMB alone is ineffective at driving PASK nuclear retention (Figure 3A), we performed all treatments in the presence of low-dose (5 nM) LMB. (B) HEK-293T cells stably expressing FLAG-tagged full-length PASK (aa 1–1323) were serum-starved (0.1% serum) for 12 hr. Cells were subsequently stimulated with either 0.1% serum or 20% serum for the time intervals indicated. Total cellular acetylome was purified from cells using anti-Ac-K antibody and the presence of acetylated PASK was detected by anti-Flag antibody. (C) V5-tagged full-length PASK (aa 1–1323) was transiently expressed in HEK-293T cells. 24 hr after transfections, cells were serum-starved in 0.1% serum for 12 hr. Cells were pretreated with 5 μM or 2 μM A-485 to inhibit CBP/EP300 acetyltransferases 1 hr prior to serum stimulation. Cells were stimulated with either 0.1% serum or 20% serum for 2 hr. V5-tagged PASK was immunoprecipitated from cells, and the presence of acetylated PASK was detected using an anti-Ac-K antibody. (D) HEK-293T cells stably expressing GFP-tagged full-length PASK (aa 1–1323) were serum-starved (0.1% serum) for 12 hr. Cells were pretreated with 2 μM A-485 to inhibit CBP/EP300 acetyltransferases 1 hr prior to serum stimulation. Cells were stimulated with either 0.1% serum (-) or 20% serum (serum) for 2 hr, and the extent of nuclear GFP-tagged PASK (%Nuc ± SD) was analyzed by immunofluorescence. Scale bar = 20 µm. (E) Illustration of metabolic pathways involved in acetyl-CoA production that can fuel cellular acetylation. (F) HEK-293T cells stably expressing FLAG-tagged full-length PASK (aa 1–1323) were treated with 10 µM UK 5099 (mitochondrial pyruvate carrier inhibitor) or 10 µM BPTES (glutaminolysis inhibitor) overnight along with 0.1% serum starvation where indicated. Cells were stimulated with 20% serum in the presence of DMSO or indicated inhibitors. hPASK was purified using anti-Flag antibody and probed with anti-AcK antibody. (G) C2C12 cells stably expressing FLAG-tagged full-length PASK (aa 1–1323) were serum-starved in glutamine-free media for 12 hr. 10 µM BPTES was added along with serum/glutamine starvation where indicated and maintained during 2 hr serum stimulation. For glutamine stimulation, media containing 2 mM glutamine was added with or without 10 µM BPTES. hPASK was purified using anti-Flag antibody and probed with anti-AcK antibody. (H) Primary myoblasts were serum- and glutamine-starved for 12 hr in the presence of 10 µM BPTES where indicated. Cells were stimulated with 20% FBS or 2 mM glutamine in the presence of either 2 μM A-485 (for glutamine-stimulated cells) or 10 µM BPTES (for serum-stimulated cells) for 2 hr. The lysate was immunoprecipitated for endogenous PASK prior to immunoblotting for total acetyl-lysine (Ac-K). (I) HEK-293T cells stably expressing GFP-tagged full-length PASK (aa 1–1323) were serum- and glutamine-starved for 12 hr. Cells were pretreated with DMSO (as control), 100 nM rapamycin, or 2 μM A-485 for 2 hr prior to stimulation with 2 mM glutamine. Cells were fixed and the extent of nuclear GFP-tagged PASK was quantified by confocal microscopy (%N± SD). Scale bar = 40 µm. Since LMB alone is ineffective at driving PASK nuclear retention (Figure 3A), we performed all treatments in the presence of low-dose (5 nM) LMB.
-
Figure 4—source data 1
Source data used to generate Figure 4.
- https://cdn.elifesciences.org/articles/81717/elife-81717-fig4-data1-v2.zip
-
Figure 4—source data 2
Source data used to generate Figure 4.
- https://cdn.elifesciences.org/articles/81717/elife-81717-fig4-data2-v2.zip
-
Figure 4—source data 3
Source data used to generate Figure 4.
- https://cdn.elifesciences.org/articles/81717/elife-81717-fig4-data3-v2.zip
-
Figure 4—source data 4
Source data used to generate Figure 4.
- https://cdn.elifesciences.org/articles/81717/elife-81717-fig4-data4-v2.zip
-
Figure 4—source data 5
Source data used to generate Figure 4.
- https://cdn.elifesciences.org/articles/81717/elife-81717-fig4-data5-v2.zip
-
Figure 4—source data 6
Source data used to generate Figure 4.
- https://cdn.elifesciences.org/articles/81717/elife-81717-fig4-data6-v2.zip
Figure 4—figure supplement 1
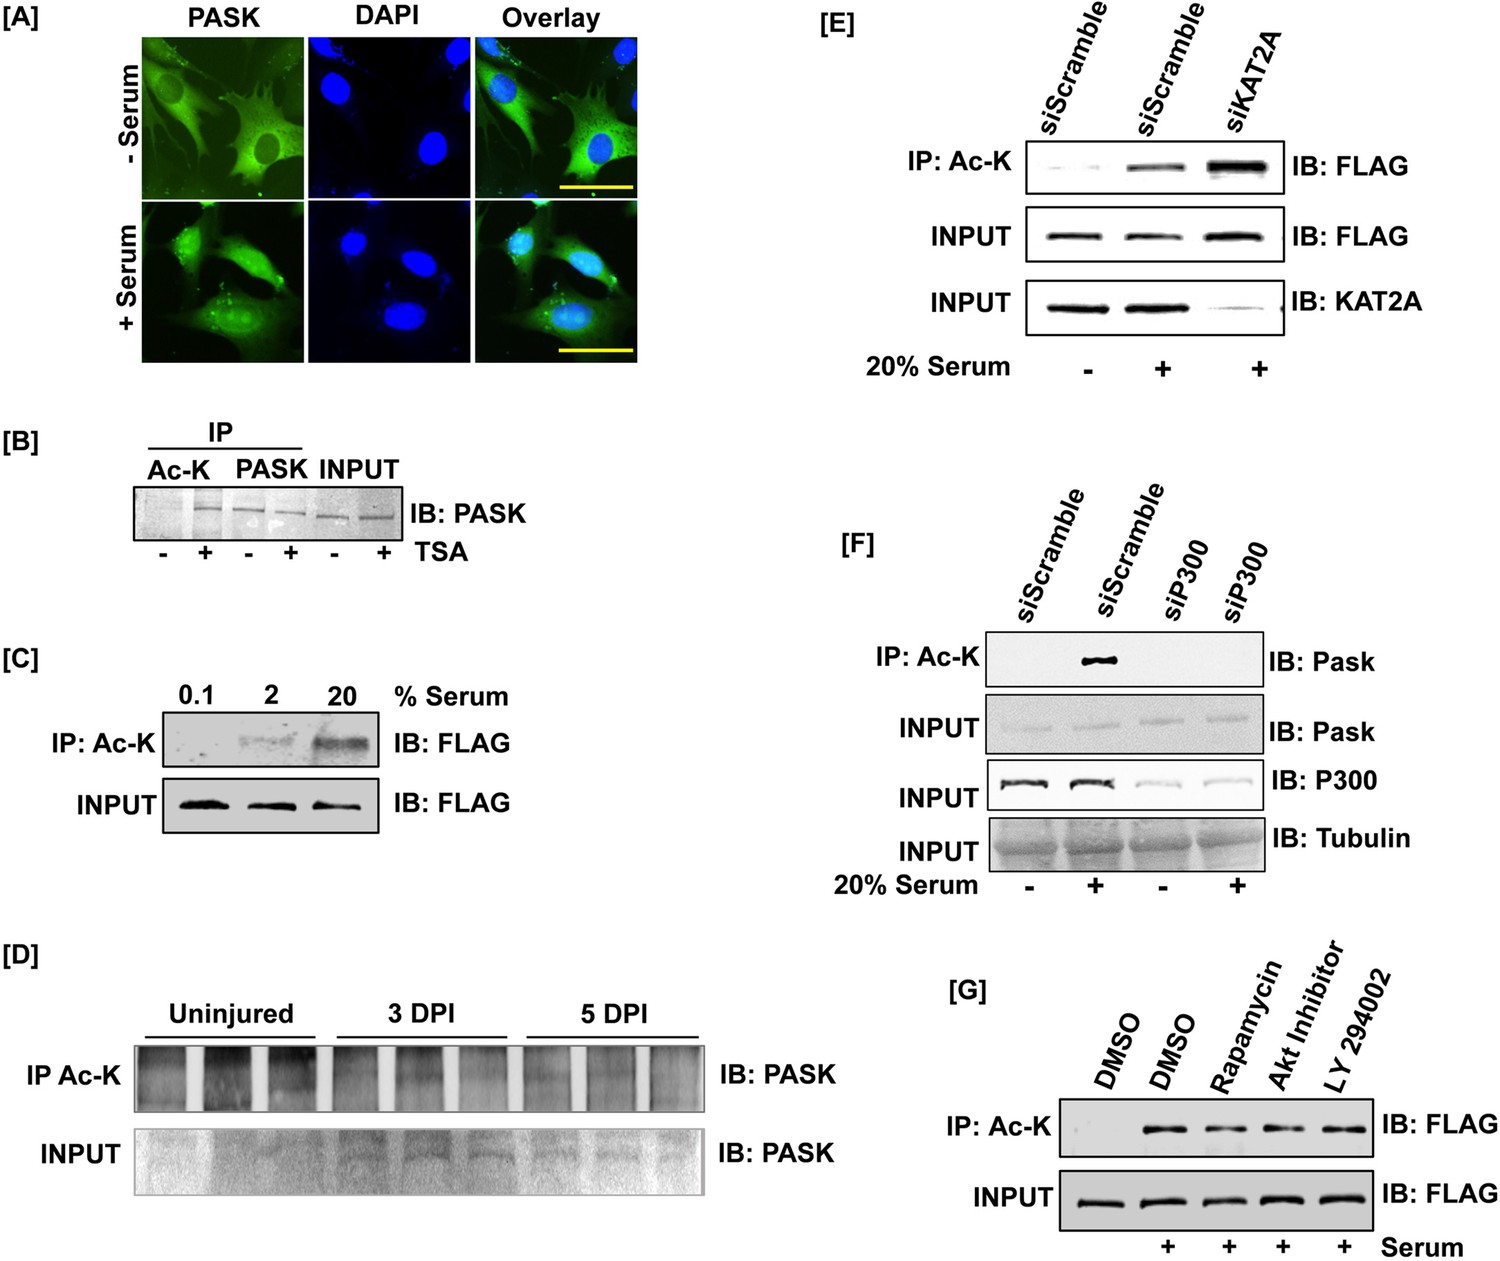
PAS domain-containing kinase (PASK) is acetylated in vitro and in vivo during muscle regeneration.
(A) Endogenous PASK is translocated to the nucleus in response to acute serum stimulation. C2C12 cells were serum-starved overnight. Cells were stimulated with 20% serum for 2 hr where indicated, followed by immunofluorescence detection of mouse PASK. (B) Acetylation of PASK in C2C12 myoblasts. Proliferating C2C12 myoblasts were treated with trichostatin A (TSA). The lysate was immunoprecipitated with total acetyl-lysine (Ac-K) prior to immunoblotting for endogenous PASK. (C) HEK-293T cells stably expressing FLAG-tagged full-length PASK (aa 1–1323) were serum-starved (0.1% serum) for 12 hr. Cells were subsequently stimulated with either 0.1% serum or 20% serum for 2 hr. The lysate was immunoprecipitated with total Ac-K prior to immunoblotting for FLAG. (D) HEK-293T cells stably expressing FLAG-tagged full-length PASK (aa 1–1323) were serum-starved (0.1% serum) for 12 hr. Cells were treated with 100 nM rapamycin during the 12 hr serum withdrawal or with 1 μM Akt inhibitor IV or 25 μM LY 294002 for 1 hr prior to serum stimulation. Cells were subsequently stimulated with either 0.1% serum or 20% serum for 2 hr. The lysate was immunoprecipitated with total Ac-K prior to immunoblotting for FLAG. (E) Acetylation of PASK in vivo. PASKhet- mice were injured with 1.2% wt/vol BaCl2 to the tibialis anterior muscles. Tissues were harvested at day 0 (uninjured), day 3, and day 5 post-injury. Lysates were immunoprecipitated with total Ac-K prior to immunoblotting for endogenous PASK. (F) p300 was silenced in myoblasts using a pooled siRNA mixture. siScramble is a non-targeting siRNA pool. 24 hr after silencing, cells were serum-starved overnight and stimulated with 20% serum for 2 hr. Total acetylome was purified and presence of PASK was detected by using anti-PASK antibody. (G) HEK-293T cells stably expressing FLAG-tagged full-length PASK (aa 1–1323) were transfected with scrambled or KAT2A targeting siRNAs. Cells were serum-starved (0.1% serum) for 12 hr and subsequently stimulated with either 0.1% serum or 20% serum for 2 hr. The lysate was immunoprecipitated with total Ac-K prior to immunoblotting for FLAG.
-
Figure 4—figure supplement 1—source data 1
Source data used to generate Figure 4—figure supplement 1.
- https://cdn.elifesciences.org/articles/81717/elife-81717-fig4-figsupp1-data1-v2.zip
-
Figure 4—figure supplement 1—source data 2
Source data used to generate Figure 4—figure supplement 1.
- https://cdn.elifesciences.org/articles/81717/elife-81717-fig4-figsupp1-data2-v2.zip
-
Figure 4—figure supplement 1—source data 3
Source data used to generate Figure 4—figure supplement 1.
- https://cdn.elifesciences.org/articles/81717/elife-81717-fig4-figsupp1-data3-v2.zip
-
Figure 4—figure supplement 1—source data 4
Source data used to generate Figure 4—figure supplement 1.
- https://cdn.elifesciences.org/articles/81717/elife-81717-fig4-figsupp1-data4-v2.zip
-
Figure 4—figure supplement 1—source data 5
Source data used to generate Figure 4—figure supplement 1.
- https://cdn.elifesciences.org/articles/81717/elife-81717-fig4-figsupp1-data5-v2.zip
Figure 5 with 1 supplement
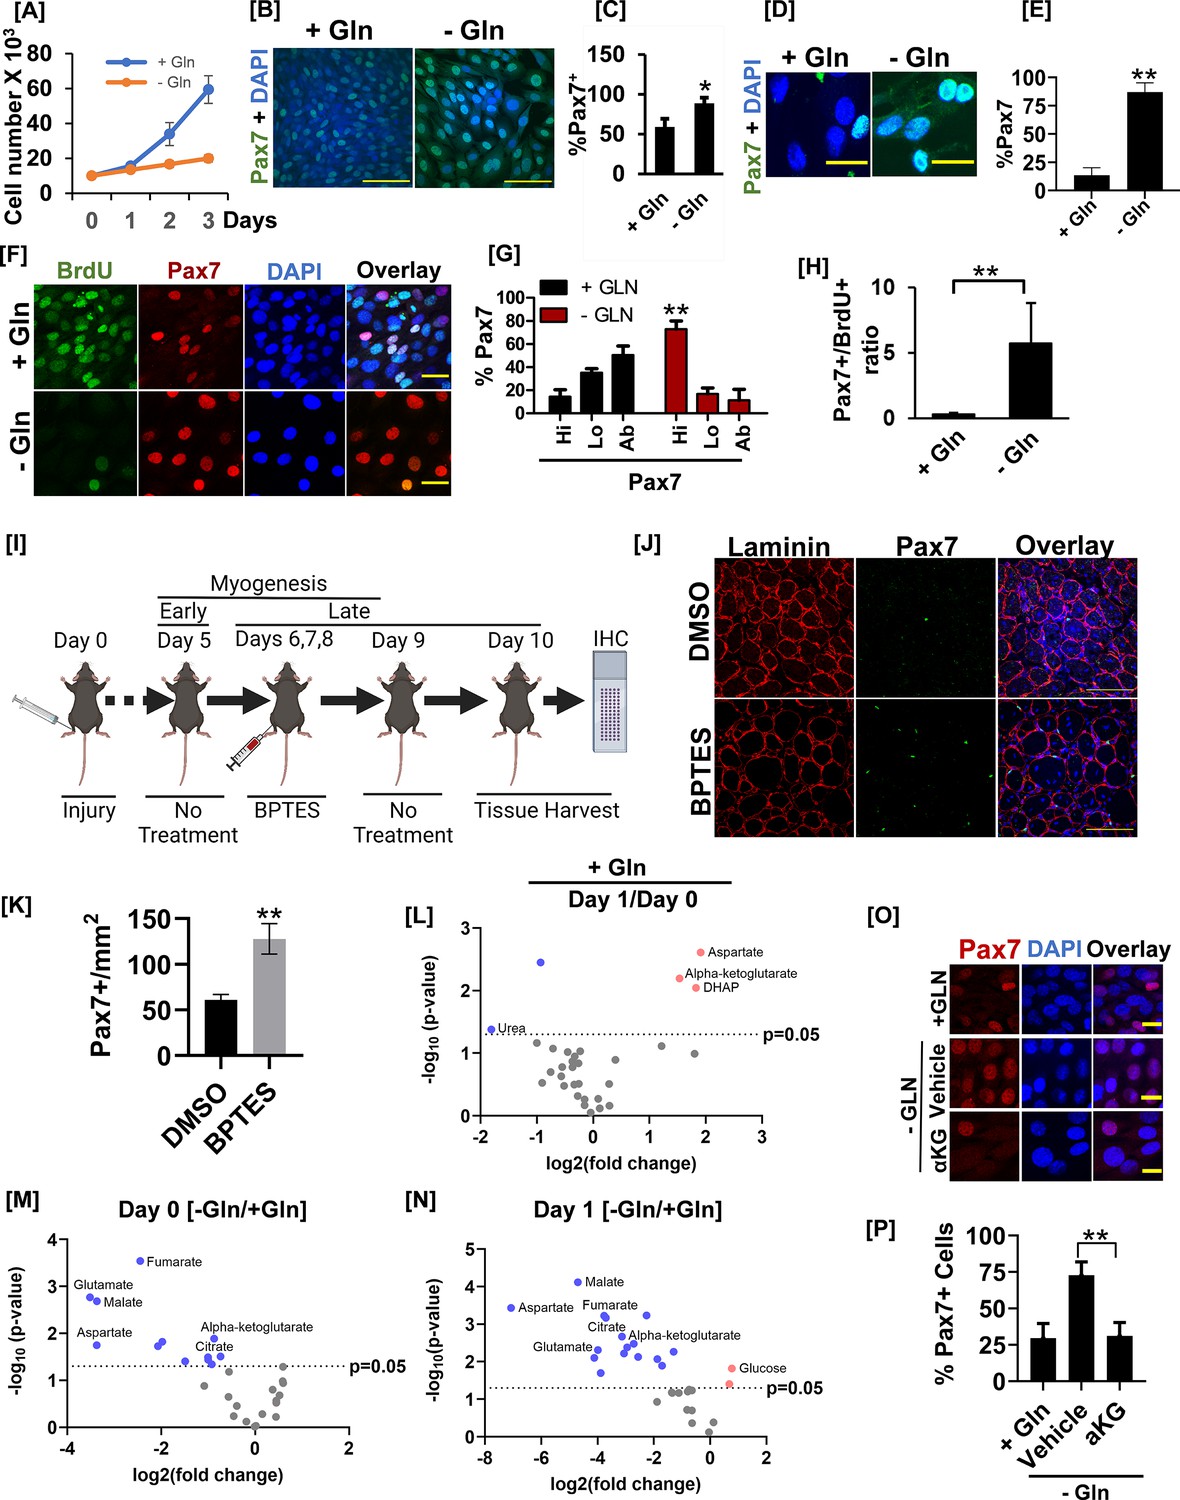
Glutamine metabolism drives muscle stem cell heterogeneity by countering Pax7 expression.
(A) The cell proliferation rate of C2C12 myoblasts cultured in the presence (+Gln) or absence (-Gln) of glutamine over 3 days. 104 cells were seeded in 60 mm tissue culture dishes. Twenty-four hr after seeding, cells were transferred to DMEM without glutamine media containing 10% serum with (+Gln) or without (-Gln) 2 mM glutamine added. Cells were counted every day for 3 days using an automated cell counter. (B) C2C12 myoblasts were allowed to proliferate in the presence (+Gln) or absence (-Gln) of glutamine for 2 days as in (A). Cells were fixed and stained with anti-Pax7 antibody and nuclei were visualized by DAPI. Scale bar = 100 µm. (C) Quantification of Pax7+ cell numbers in the presence (+Gln) or absence of glutamine (-Gln). * Error bars ± SD. p<0.05, n=5 (% Pax7 cells in -Gln vs. +Gln). (D) Primary myoblasts were plated in media containing glutamine for 24 hr. Growth media was replaced with media containing (+Gln) or lacking (-Gln) for additional 24 hr as in (A). Cells were fixed and immunostained with anti-Pax7 antibody. Scale bar = 40 µm. (E) Quantification of %Pax7+ cell numbers between +Gln and -Gln conditions. Error bars ± SD. **p<0.005, n=3 (% Pax7 cells in - Gln vs. +Gln). (F) 24hr after isolation and culture in media containing glutamine, primary myoblasts were allowed to proliferate in the presence (+Gln) or absence (-Gln) of glutamine for additional 2 days. Cells were pulsed with 10 µM BrdU in +Gln or -Gln media for 24 hr before cell fixation. Cells were fixed, and BrdU incorporation and Pax7+ cell numbers were analyzed by immunofluorescence microscopy using antibodies against BrdU and Pax7. Scale bar = 40 µm. (G) % Pax7+ cells showing Pax7 expression at high (hi), low (lo), or absent (ab) levels in the presence (+Gln) or absence (-Gln) of glutamine. Error bars ± SD. **p<0.005 (% Pax7hi cells in -Gln vs. +Gln). (H) Quantification of the ratio of % Pax7+ myoblasts over % BrdU+ myoblasts from immunofluorescence analysis in (F). Error bars ± SD. **p<0.005 (% Pax7hi cells in -Gln vs. +Gln). (I) Experimental setup to test the effect of acute Gls1 inhibition by BPTES injection on Pax7 levels. Twelve-week-old C57BL/6 mice were injured with 25 µl of 1.2 % wt/vol BaCl2 to the tibialis anterior (TA) muscles. On days 6, 7, and 8 post-injury, 10 μl of phosphate buffer saline (PBS) containing 0.01% DMSO or 10 μM BPTES was injected intramuscularly into the belly of TA muscles. Tissues were harvested on day 10. Tissue sections were stained for laminin (red) or Pax7 (green) and analyzed by confocal microscopy. N=5 mice per treatment group. Both legs were injured and treated with DMSO or BPTES and utilized for analysis as technical replicates. (J) Immunofluorescence images of muscle sections stained with Pax7 and laminin from the experiment in (G). Scale bar = 100 µm. (K) Quantification of average Pax7+ cell number/field from images in (H). **p<0.005 (BPTES vs. DMSO). (L) Volcano plot of metabolite abundances in differentiating (day 1) versus proliferating (day 0) C2C12 myoblasts in the glutamine replete condition. (M) Volcano plot of metabolite abundances in proliferating (day 0) C2C12 myoblasts cultured in the presence (+Gln) or absence (-Gln) of glutamine. (N) Volcano plot of metabolite abundances in differentiating (day 1) C2C12 myoblasts cultured in the presence (+Gln) or absence (-Gln) of glutamine. (O) C2C12 myoblasts were grown in the presence (+Gln) or absence of glutamine (-Gln) for 24 hr. One mM cell-permeable dimethyl-alpha ketoglutarate (aKG) or vehicle control was added to glutamine-depleted cells for 24 hr. After treatment, cells were fixed and stained with an anti-Pax7 antibody. (P) Quantification of Pax7+ cell number from the experiment in (M). Scale bar = 20 µm. **Error bars ± SD. p<0.005.
Figure 5—figure supplement 1
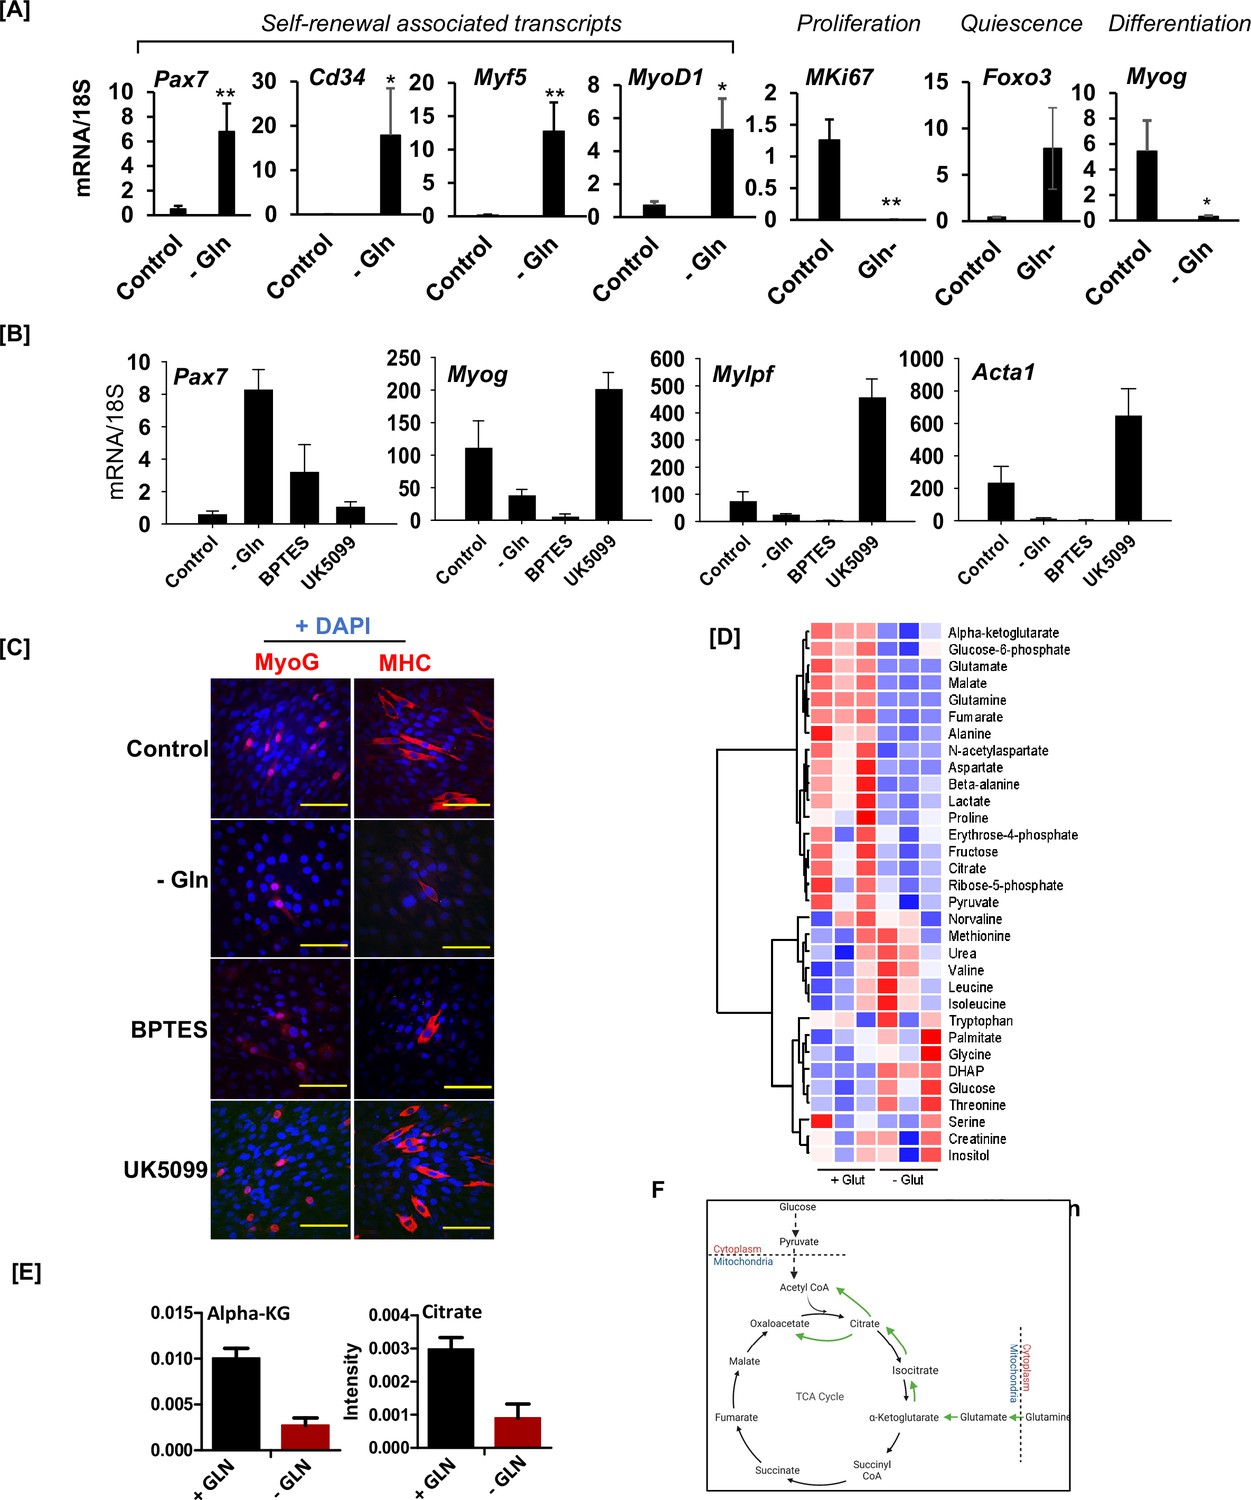
Glutamine depletion preserves stem cell identity while antagonizing differentiation.
(A) Expression of genes associated with muscle stem cell self-renewal (Pax7, Cd34, Myf5, and Myod1), proliferation (MKi67), quiescence (Foxo3), and differentiation (Myog) in primary myoblasts cultured with (control) or without (-Gln) glutamine, as quantified by RT-qPCR. (B) Expression of indicated genes in C2C12 myoblasts cultured in the presence or absence of 2 mM glutamine or in the presence of 10 µM BPTES or 10 µM UK5099 in glutamine-containing media. (C) C2C12 myoblasts were cultured in the presence (control, BPTES, UK5099) or absence (-Gln) of glutamine and treated with BPTES (glutaminolysis inhibitor) or UK 5099 (mitochondrial pyruvate carrier inhibitor) as indicated. C2C12 myoblasts were induced to differentiate for 2 days, and cells were analyzed by immunofluorescence against Myog and MHC. Scale bar = 40 µM. (D) Heatmap of metabolite concentrations in differentiating (day 1) C2C12 myoblasts cultured in the presence (+Glut) or absence (-Glut) of glutamine. (E) Levels of indicated TCA cycle metabolites (alpha-KG and citrate) implicated in glutamine-derived acetyl-CoA generation for signaling and epigenetic functions. (F) Illustration of glucose and glutamine-derived metabolic pathways leading to the generation of intracellular acetyl-CoA.
-
Figure 5—figure supplement 1—source data 1
Source data used to generate Figure 5—figure supplement 1.
- https://cdn.elifesciences.org/articles/81717/elife-81717-fig5-figsupp1-data1-v2.zip
-
Figure 5—figure supplement 1—source data 2
Source data used to generate Figure 5—figure supplement 1.
- https://cdn.elifesciences.org/articles/81717/elife-81717-fig5-figsupp1-data2-v2.zip
Figure 6 with 1 supplement

Glutamine-induced stem cell heterogeneity is mediated by nuclear PAS domain-containing kinase (PASK) function.
(A) Isolated primary myoblasts were grown in the presence or absence of 50 µM PASKi for 48 hr. Cells were fixed and Pax7+ cells were visualized by immunostaining. (B) Quantification of cells showing Pax7 expression at high (hi), low (lo), or absent (ab) levels from DMSO or 50 µM PASKi-treated cells. (C) Tibialis anterior (TA) muscles of littermates of PaskWT and PaskKO animals were injured using 1.2% BaCl2. Frozen tissue sections were stained using anti-Pax7 and anti-laminin antibodies. Arrows indicate examples of Pax7+ cells identified and used for quantification in (D). Scale bar = 40 µm. (D) Quantification of Pax7+ muscle stem cells (MuSCs) numbers at day 5 or day 14 in PaskWT vs. PaskKO mice. Scale bars = 20 μm. Error bars ± SD. **p<0.005 (5 dpi in PaskKO vs PaskWT), *p<0.005 (14 dpi in PaskKO vs PaskWT). (E) Quantification of myofiber cross-sectional area measured from laminin staining **p<0.005 (5 dpi in PaskKO vs. PaskWT). (F) C2C12 myoblasts were grown in complete media containing 2 mM glutamine for 24 hr. Culture media was replaced with glutamine depleted (-Gln) or -Gln media containing 1 mM dimethyl alpha-ketoglutarate (aKG) in the presence of DMSO or 50 µM PASKi for additional 24 hr. After treatments, cells were fixed and stained with anti-Pax7 antibody. Scale bar = 40 µM. (G) Quantification of % Pax7+ C2C12 from the experiment in (I). Error bars ± SD. p<0.05 (# Vehicle vs. DMSO, **PASKi vs. DMSO, n.s. [not significant] between PASKi and vehicle). (H) Magnetic-activated cell sorting (MACS) double-sorted (see Methods) primary myoblasts were cultured and treated as described in Figure 5D. Cells were fixed and stained using anti-PASK (green), anti-Pax7 (red), and DAPI (nuclei). Scale bar = 40 µM. Individual channels representing PASK and Pax7 are shown below a three-channel overlay for each condition (+Gln and -Gln). (I) Violin plot representing the relationship between PASK subcellular distribution and Pax7 expression in the presence or absence of glutamine. Note near-complete lack of nuclear PASK expressing cell population in glutamine-withdrawn conditions. (J) Mouse PASK was silenced using multiplex siRNAs in C2C12 cells. Twenty-four hr after siRNA transfection, GFP-tagged WT or NLS-hPASKNES1+2-hPASK (nuclear PASK, nPASK) was retrovirally expressed. Forty-eight hr after viral infection, cells were fixed, and Pax7+ cells were analyzed by immunofluorescence against Pax7. PASK-expressing cells were identified by GFP expression. Scale bar = 40 µm. (K) Quantification of %Pax7hi cell numbers in individual cells expressing GFP control (GFP+), WT-PASK (WT+), or nuclear PASK (nPASK+) compared with uninfected cells (GFP-, WT-, or nPASK-) from the experiment in (E). Mean± SD. ***p<0.0005. (L) Pax7 expression was assessed by immunofluorescence microscopy from C2C12 myoblasts cultured for 48 hr in glutamine-depleted conditions expressing GFP control, GFP tagged WT, or nPASK plasmids. Scale bar = 40 µm. (M) Quantification of %Pax7hi cell numbers in individual cells expressing GFP control (GFP+), WT-PASK (WT+), or nuclear PASK (nPASK+) compared with uninfected cells (GFP-, WT-, or nPASK-) from the experiment in (G). Data represented in quantification are mean± SD. ***p<0.0005.
Figure 6—figure supplement 1
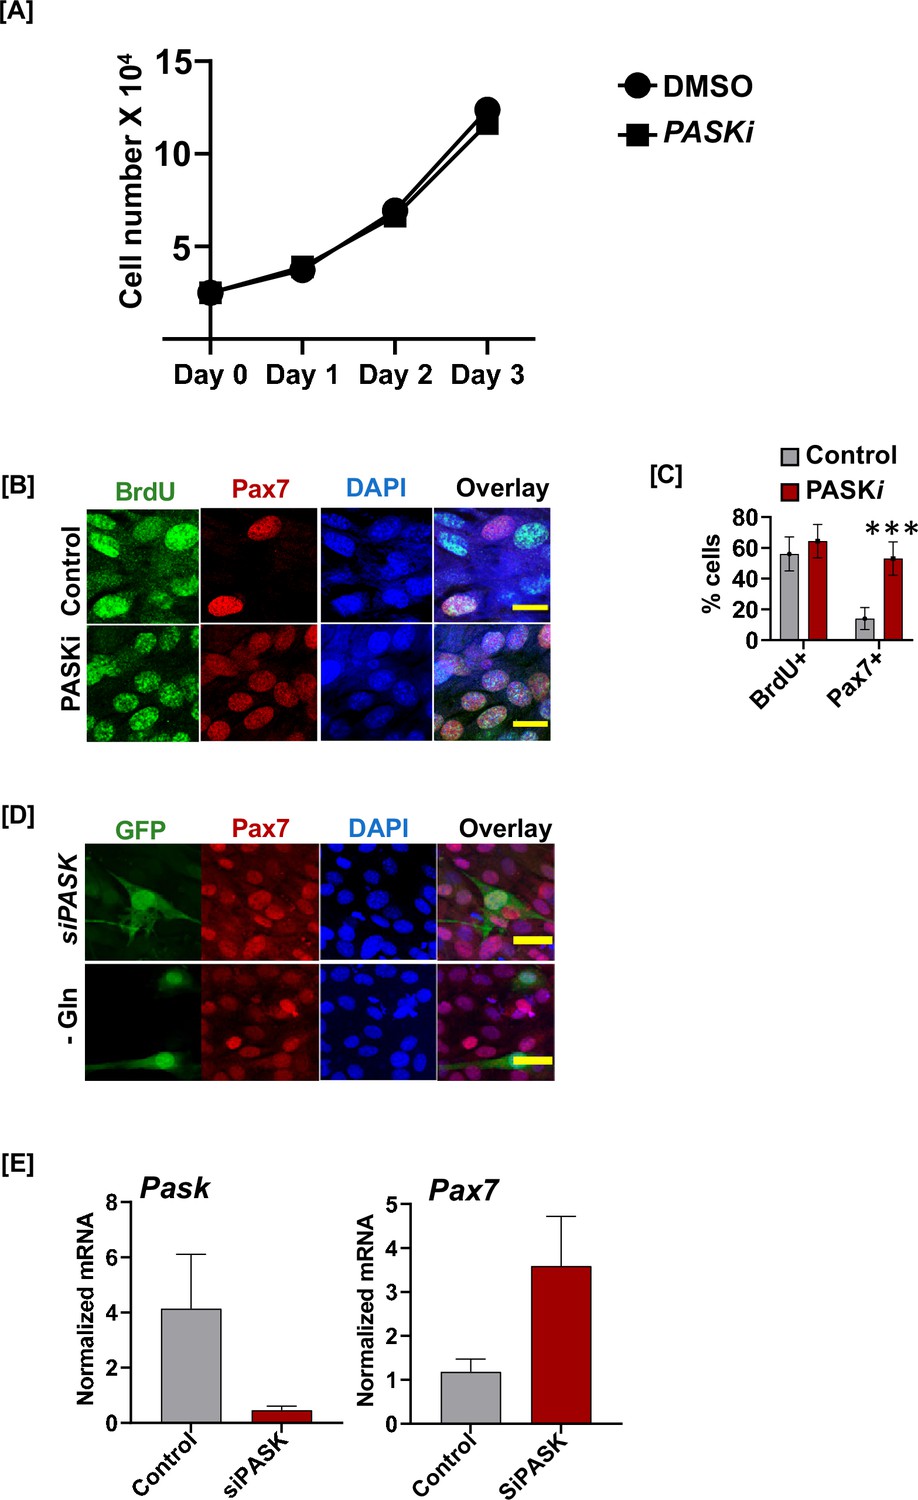
Glutamine-driven generation of differentiation-competent progenitors requires nuclear PAS domain-containing kinase (PASK) function.
(A) Growth curve of C2C12 myoblasts cultured in the presence of DMSO (vehicle control) or 50 µM PASKi treatment over 3 days. (B) BrdU incorporation assay in isolated primary myoblasts treated with DMSO or PASKi. Cells were treated with DMSO or PASKi at isolation and 24 hr isolation, BrdU incorporation was performed by adding 10 µM BrdU for 24 hr. Cells were fixed stained using anti-BrdU (green) or Pax7 (red) antibodies. Nuclei were visualized with DAPI. (C) Quantification of % BrdU+ and % Pax7+ cells in DMS vs. PASKi-treated cells. (D) Expression of control vector (GFP) did not reverse the observed increase in Pax7 levels in C2C12 cells due to PASK silencing or glutamine withdrawal. See Figure 6H for quantification. (E) siRNA of PASK effectively silences mRNA levels of mouse PASK and increases levels of Pax7 mRNA.
-
Figure 6—figure supplement 1—source data 1
Source data used to generate Figure 6—figure supplement 1.
- https://cdn.elifesciences.org/articles/81717/elife-81717-fig6-figsupp1-data1-v2.zip
Figure 7 with 2 supplements
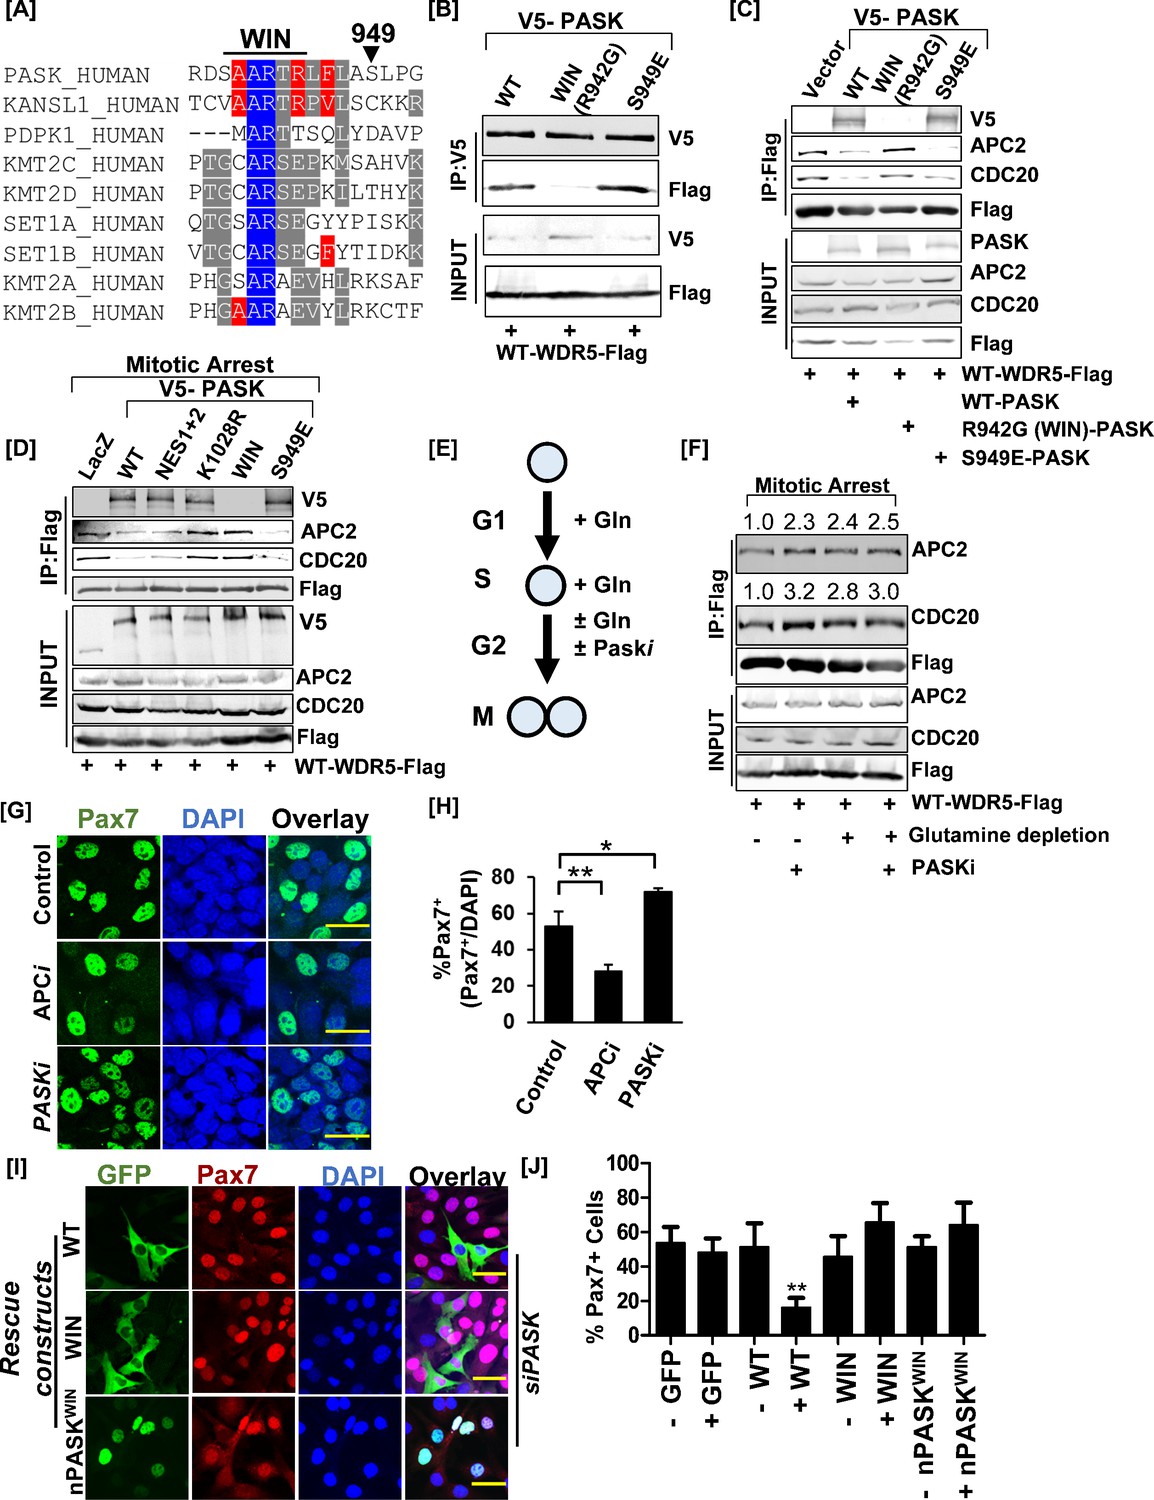
Nuclear PAS domain-containing kinase (PASK) disrupts the WDR5-anaphase-promoting complex/cyclosome (APC/C) interaction causing exit from self-renewal.
(A) Alignment of the hPASK WIN motif with previously established WIN motifs. S949 represents a previously reported mTOR phosphorylation site on PASK. (B) Biochemical characterization of PASK-WDR5 interaction via R942 (WIN motif). HEK-293T cells were co-transfected with Flag-WDR5 and full-length V5-tagged WT-PASK (WT), R942G (WIN), or a phosphomimetic mutant of S949, S949E (S949E). Cells were lysed in native lysis buffer, and Flag-WDR5 was immunoprecipitated from cell extract. Co-precipitated PASK versions were detected by probing with anti-V5 antibodies. (C) PASK disrupts the WDR5-APC/C interaction. HEK-293T cells were transfected with full-length V5-tagged WT (WT), R942G (WIN), or S949E PASK, along with FLAG-WDR5. Asynchronous cells were lysed in native lysis buffer, and WDR5 complexes were purified using anti-Flag beads. The immunoprecipitants were probed with PASK, APC2, CDC20, and FLAG antibodies. (D) PASK catalytic activity, phosphorylation of PASK by mTORC1, and WIN motif interaction converge to disrupt the WDR5-APC/C interaction during mitosis. HEK-293T cells expressing indicated plasmids were synchronized to the G2/M boundary by nocodazole treatment as described in the Methods. G2/M arrested cells were collected via centrifugation, and cell pellets were lysed in native lysis buffer. Flag-WDR5 containing protein complexes were purified using anti-Flag beads. Relative enrichment of APC2, CDC20, and PASK was determined by western blotting. (E) Graphical representation of experimental scheme testing effect of glutamine withdrawal on WDR5-APC/C interaction. Cells were arrested at the G1/S boundary in the presence of glutamine. G1/S arrested cells were released into media containing 2 µM nocodazole in the presence or absence of glutamine with or without 50 µM PASKi. (F) Western blot analysis of WDR5-APC/C interaction in G2/M arrested cells in (E). The numbers indicate the normalized intensities of western blot signal relative to Flag signal from immunoprecipitation (IP). (G) Primary myoblasts were treated with DMSO (control), 50 µM proTAME (APC/C inhibitor, APCi), or 50 µM PASKi for 30 hr. Pax7+ myoblasts numbers were quantified by immunofluorescence microscopy using anti-Pax7 antibody. Scale bar = 40 µm. (H) Quantification of % Pax7+ cells from the experiment in (G). (I) PASK-WDR5 interaction regulates myoblast identity. GFP-hPASK, GFP-hPASKR942G(WIN), or nPASK-WIN R942G(nPASK-WIN) were expressed in PASK-silenced C2C12 cells. Forty-eight hr after retroviral infection, cells were fixed, and the proportion of Pax7hi cells was quantified by immunofluorescence microscopy using an anti-Pax7 antibody. Scale bar = 40 µm. (J) Quantification of % Pax7hi cells from the experiment in (I). Data represented in quantification are mean± SD. **p<0.005.
-
Figure 7—source data 1
Source data used to generate Figure 7.
- https://cdn.elifesciences.org/articles/81717/elife-81717-fig7-data1-v2.zip
-
Figure 7—source data 2
Source data used to generate Figure 7.
- https://cdn.elifesciences.org/articles/81717/elife-81717-fig7-data2-v2.zip
-
Figure 7—source data 3
Source data used to generate Figure 7.
- https://cdn.elifesciences.org/articles/81717/elife-81717-fig7-data3-v2.zip
-
Figure 7—source data 4
Source data used to generate Figure 7.
- https://cdn.elifesciences.org/articles/81717/elife-81717-fig7-data4-v2.zip
Figure 7—figure supplement 1
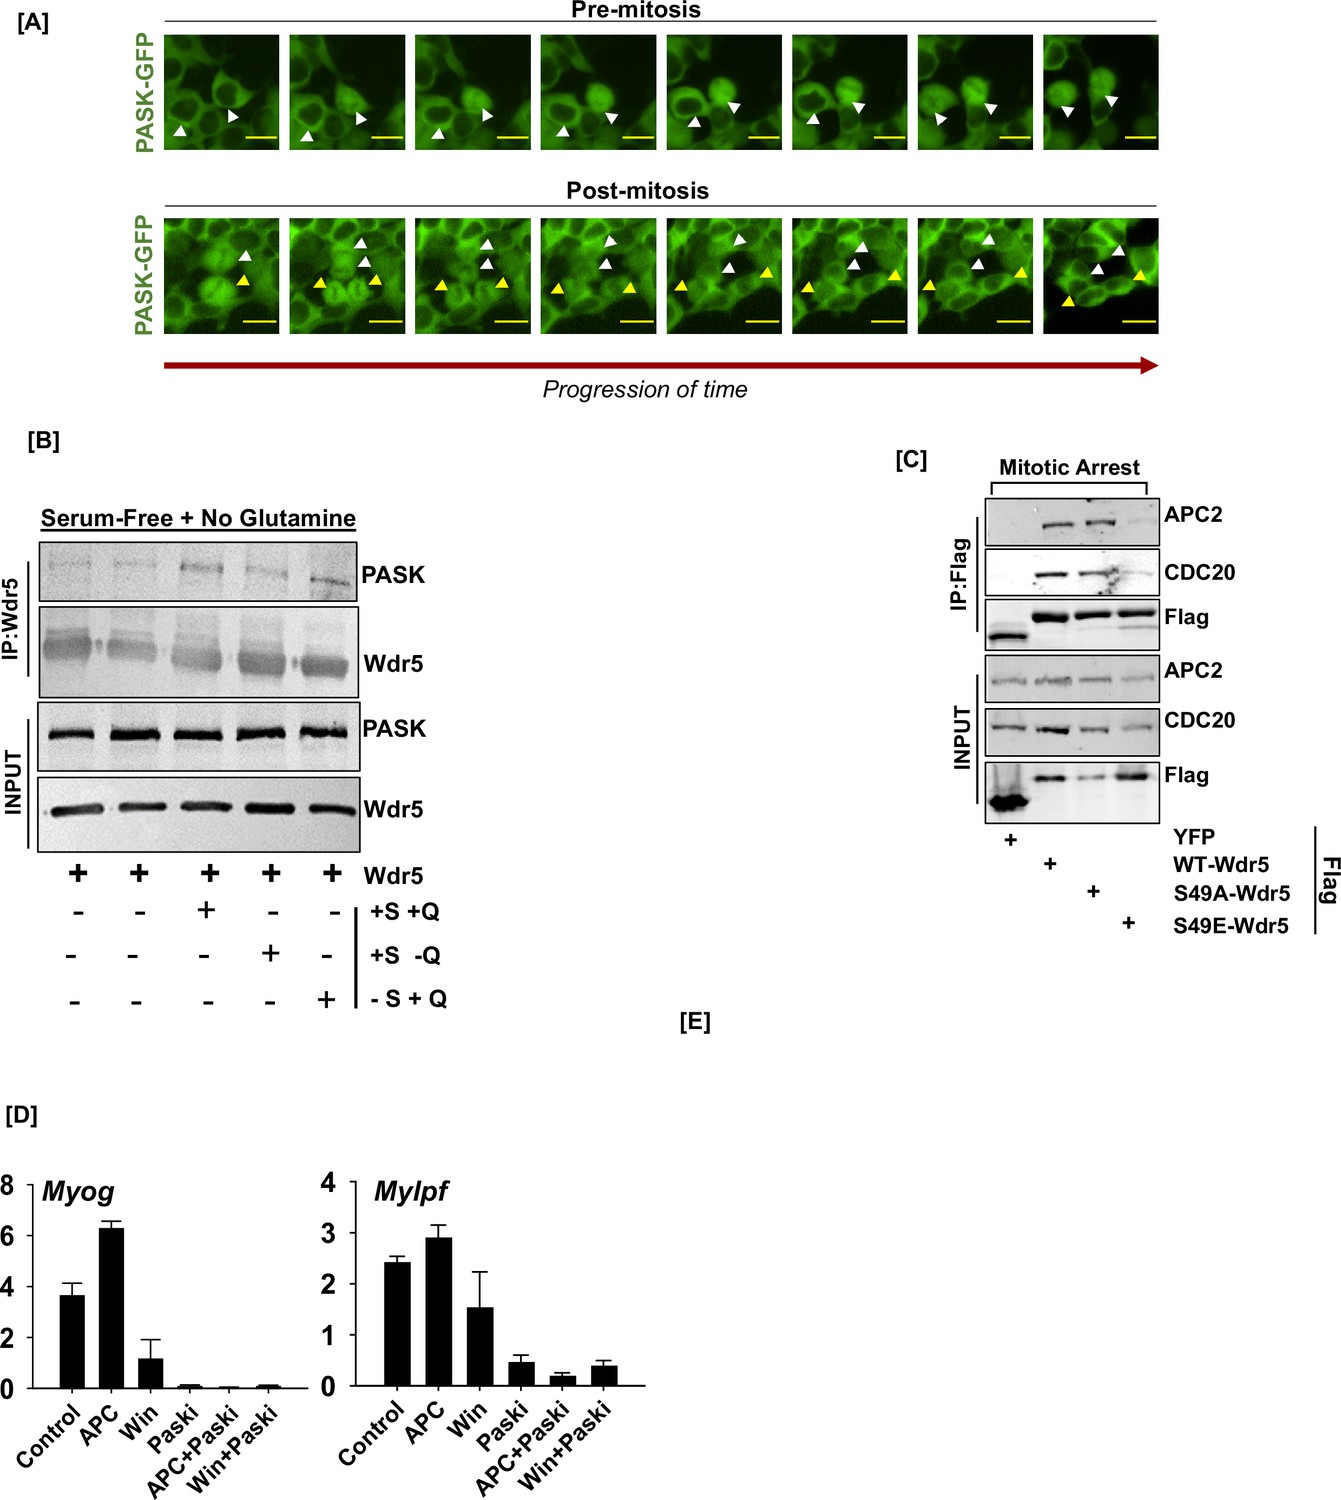
Negative regulation of the WDR5-anaphase-promoting complex/cyclosome (APC/C) interaction by PAS domain-containing kinase (PASK) drives myogenesis.
(A) Nucleo-cytoplasmic shuttling of GFP-hPASK during mitosis in asynchronous HEK293T cells showing nuclear entry of PASK in pre-mitotic cells. (B) Effect of acute glutamine stimulation on PASK-WDR5 association. C2C12 myoblasts were serum- and glutamine-starved (first two lanes from the left) overnight. Cells were stimulated with serum (S) and glutamine (Q, lane 3), serum alone (+S -Q, lane 4), or 2 mM glutamine alone (-S +Q) for 2 hr. Cells were lysed, and WDR5 was immunoprecipitated from lysates. Immunoprecipitants were probed with anti-PASK antibodies to detect endogenous PASK association with WDR5. (C) Phosphomimetic mutant of WDR5 disrupts the WDR5-APC/C interaction during mitosis. HEK-293T cells were transfected with FLAG-WDR5 (WT-WDR5), FLAG-WDR5 S49A (S49A-WDR5), FLAG-WDR5 S49E (S49E-WDR5), or YFP vector control (YFP). Cells were synchronized and released from G2/M phase arrest, and the lysate was immunoprecipitated with anti-FLAG beads prior to immunoblotting for APC2, CDC20, and FLAG. (D) Disruption of the WDR5-APC/C interaction by PASK is required for the expression of genes associated with skeletal muscle differentiation. Proliferating C2C12 myoblasts were treated with DMSO (control), proTAME (a selective inhibitor of APC/C, APCi), WIN inhibitor (WIN), PASKi (BioE-1197, PASKi), proTAME+PASKi (APC+PASKi), or WIN inhibitor+PASKi (WIN+PASKi). Transcript levels of Myog and Mylpf were quantified by RT-qPCR. Error bars = ± SD of three independent experiments.
-
Figure 7—figure supplement 1—source data 1
Source data used to generate Figure 7—figure supplement 1.
- https://cdn.elifesciences.org/articles/81717/elife-81717-fig7-figsupp1-data1-v2.zip
-
Figure 7—figure supplement 1—source data 2
Source data used to generate Figure 7—figure supplement 1.
- https://cdn.elifesciences.org/articles/81717/elife-81717-fig7-figsupp1-data2-v2.zip
Figure 7—figure supplement 2
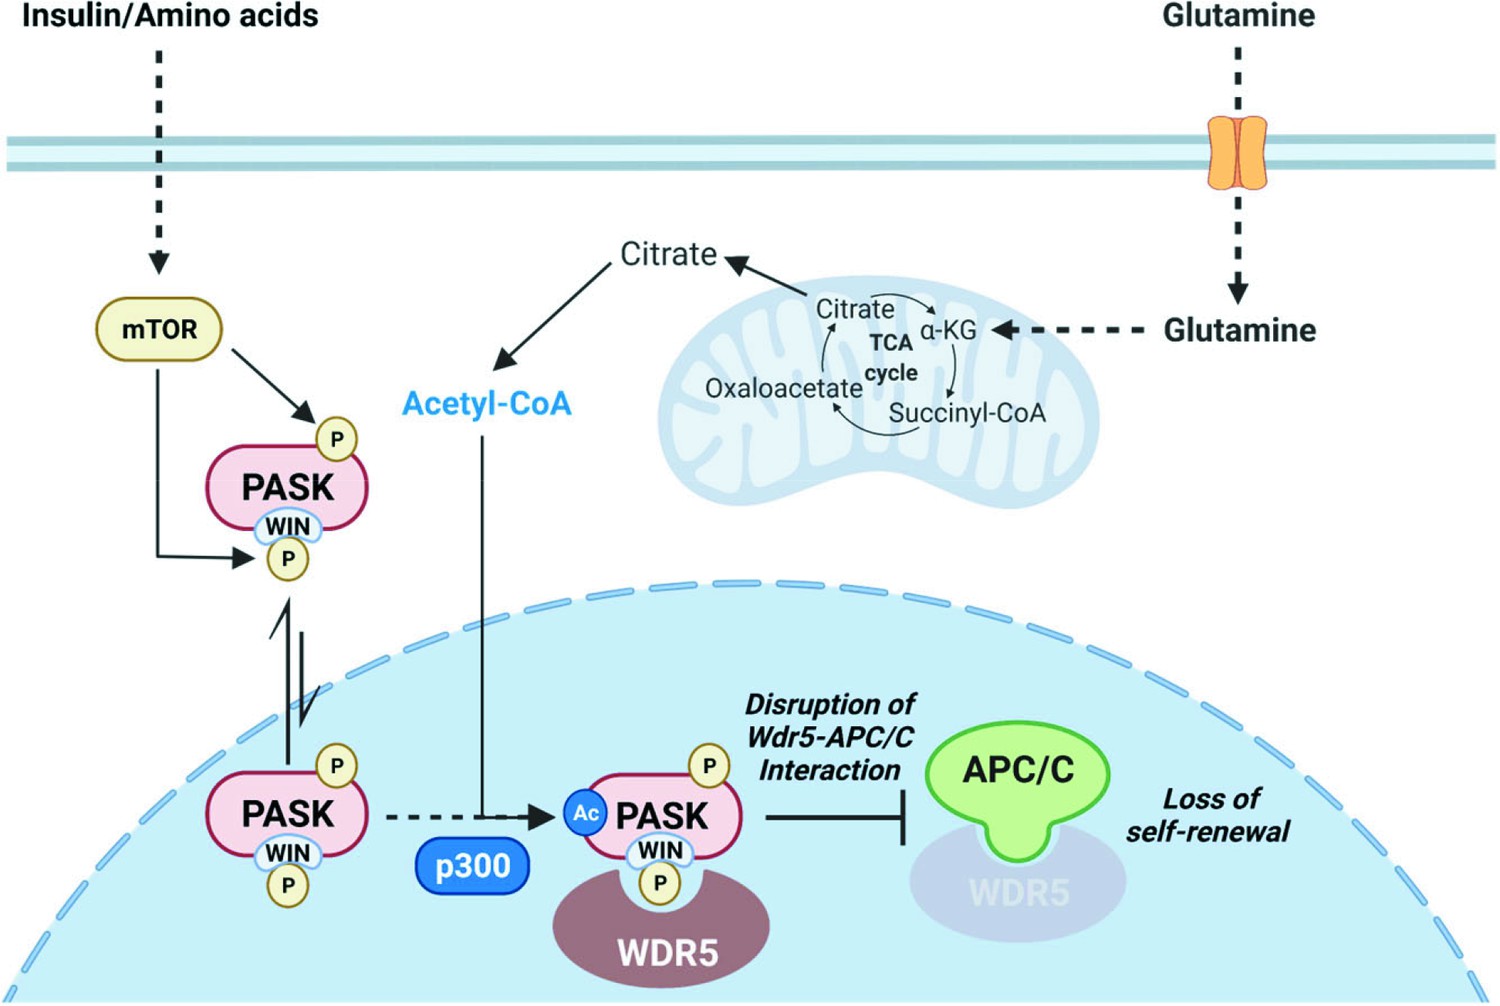
Model.
A model describing the mechanistic control of cell fate and identity by glutamine metabolism via PAS domain-containing kinase (PASK) acetylation and nuclear translocation.
Author response image 1
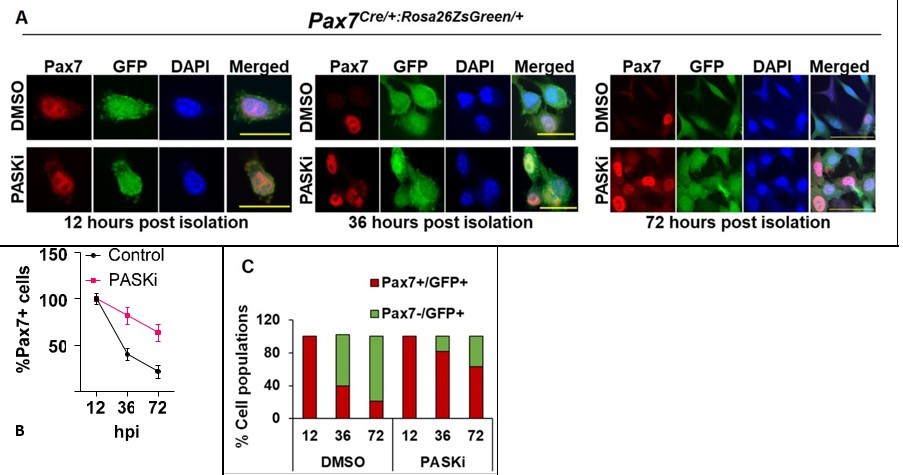
PASK inhibition preserves Pax7 expression in proliferative myoblasts.
A. MuSCs were isolated from TA muscles of 4 months old mice using the collagenase-dispase method. GFP+ cells were sorted using flow-cytometry and cultured in myoblast proliferation media in the presence of DMSO or 50 µM PASKi. Cells were fixed at different time points, as indicated in A and B. Cells were stained using Anti-Pax7. Scale bars = 20 µm (12hr and 36hr) and 40 µm (72hrs). B. Quantification of % Pax7+ cells during in vitro culture of myoblasts in control (DMSO) vs. PASKi treated conditions. C. % Total cell population of Pax7+/GFP+ and Pax7-/GFP+ populations at 12, 36, and 72 hours post isolation of primary myoblasts in control (DMSO) vs PASKi cultured cells.
Tables
Key resources table
| Reagent type (species) or resource | Designation | Source or reference | Identifiers | Additional information |
|---|---|---|---|---|
| Antibody | Mouse monoclonal Anti-Pax7 | DSHB, University of Iowa | DSHB Cat# PAX7, RRID:AB_2299243 | IF: 1:100 IHC: 1:50 |
| Antibody | Mouse monoclonal Anti-MyoG | DSHB, University of Iowa | DSHB Cat# f5d, RRID:AB_2146602 | IF: 1:100 |
| Antibody | Mouse monoclonal Anti-MHC | DSHB, University of Iowa | DSHB Cat# MF 20, RRID:AB_214778 | IF: 1:100 |
| Antibody | Rabbit polyclonal Anti-Laminin | Sigma-Aldrich | Sigma-Aldrich Cat# L9393, RRID:AB_477163 | IF: 1:100 |
| Antibody | Mouse monoclonal Anti-FLAG | Sigma-Aldrich | Sigma-Aldrich Cat# F3165, RRID:AB_259529 | IF: 1:100 |
| Antibody | Mouse monoclonal Anti-V5 | Thermo Fisher | Thermo Fisher Scientific Cat# R960-25, RRID:AB_2556564 | IF: 1:100 |
| Antibody | Rabbit polyclonal Anti-PASK | Cell Signaling Technology | Cell Signaling Technology Cat# 3086, RRID:AB_2159082 | IF: 1:100 WB: 1:1000 |
| Antibody | Rabbit monoclonal Anti-Acetylated lysine | Cell Signaling Technology | Cell Signaling Technology Cat# 9814, RRID:AB_10544700 | IP: 5 µg WB: 1:1000 |
| Antibody | Rabbit polyclonal Anti-APC2 | Cell Signaling Technology | Cell Signaling Technology Cat# 12301, RRID:AB_2754994 | WB: 1:1000 |
| Antibody | Rabbit monoclonal Anti-CDC20 | Cell Signaling Technology | Cell Signaling Technology Cat# 14866, RRID:AB_2715567 | WB: 1:1000 |
| Antibody | Rabbit polyclonal α/β Tubulin | Cell Signaling Technology | Cell Signaling Technology Cat# 2148, RRID:AB_2288042 | WB: 1:1000 |
| Antibody | Rabbit monoclonal Anti-KAT2A (GCN5L2) | Cell Signaling Technology | Cell Signaling Technology Cat# 3305, RRID:AB_2128281 | WB: 1:1000 |
| Antibody | Rabbit monoclonal Anti-p300 | Cell Signaling Technology | Cell Signaling Technology Cat# 70088, RRID:AB_2799773 | WB: 1:1000 |
| Antibody | Rabbit polyclonal Anti-BrdU | Thermo Fisher Scientific | Thermo Fisher Scientific Cat# PA5-32256, RRID:AB_2549729 | IF: 1:100 |
| Antibody | Rabbit monoclonal Anti-WDR5 | Cell Signaling Technology | Cell Signaling Technology Cat# 13105, RRID:AB_2620133 | IP: 5 µg WB: 1:1000 |
| Commercial assay kit | Tyramide Signal Amplication kit | Biotium | 33000 | |
| Commercial assay kit | TruSeq Stranded Total RNA Library Prep Kit with Ribo-Zero Gold | Illumina | RS-122–2302 | |
| Commercial assay kit | QIAGEN’s RNeasy | QIAGEN | Cat# 75162 | |
| Cell line (Human) | HEK 293T | ATCC | ATCC Cat# CRL-3216 | |
| Cell line (Mouse) | C2C12 | ATCC | ATCC Cat# CRL-1772, RRID:CVCL_0188 | |
| Cell line (Mouse) | Mouse ES cells | ATCC | Isolated from mice | |
| Cell line (Mouse) | Primary mouse myoblasts | Isolated fresh from mice | Isolated from mice | |
| Chemical compounds | BPTES | Selleck Chem | S7753 | |
| Chemical compounds | A-485 | Selleck Chem | S8740 | |
| Chemical compounds | UK5099 | Selleck Chem | S5317 | |
| Chemical compound, drug | BioE-1197 | Jared Rutter, University of Utah | Not applicable | |
| Chemical compound, drug | Rapamycin | LC Labs | R-5000 | |
| Chemical compound, drug | Akt inhibitor IV | Sigma-Aldrich | 124011 | |
| Chemical compound, durg | LY294002 | Cell Signaling Technology | 9901 | |
| Chemical compound, drug | Leptomycin B | LC Labs | L-6100 | |
| Chemical compound, drug | proTAME | Cayman Chemicals | 25835 | |
| Chemical compound, drug | WDR5-0103 | Cayman Chemicals | 13945 | |
| Software, algorithm | GraphPad Prism v 9.0 | GraphPad | ||
| Software, algorithm | BioRender | BioRender |
Additional files
-
MDAR checklist
- https://cdn.elifesciences.org/articles/81717/elife-81717-mdarchecklist1-v2.pdf
-
Supplementary file 1
Plasmids available upon request.
- https://cdn.elifesciences.org/articles/81717/elife-81717-supp1-v2.docx
Download links
A two-part list of links to download the article, or parts of the article, in various formats.
Downloads (link to download the article as PDF)
Open citations (links to open the citations from this article in various online reference manager services)
Cite this article (links to download the citations from this article in formats compatible with various reference manager tools)
PASK links cellular energy metabolism with a mitotic self-renewal network to establish differentiation competence
eLife 12:e81717.
https://doi.org/10.7554/eLife.81717


