Differential axonal trafficking of Neuropeptide Y-, LAMP1-, and RAB7-tagged organelles in vivo
- Departments of Functional Genomics and Clinical Genetics, Center for Neurogenomics and Cognitive Research (CNCR), VU University Amsterdam and VU University Medical Center, Netherlands
Figures
Figure 1

In vivo two-photon imaging of organelle dynamics in thalamocortical axons.
(A) Adeno-associated virus (AAV) injections into the thalamus lead to the expression of fluorescent organelle markers in thalamocortical projections.(B) Implantation of a chronic cranial window enables two-photon imaging of thalamocortical axons in cortical layers 1 and 2. Typically, mice were imaged in 1 hr sessions starting at 3 weeks after injection. (C) Example raw data image of axons in cortical layer 1 expressing Neuropeptide Y (NPY)-Venus. Scalebar 20 µm. (D) Background subtracted and mean filtered version of C. (E) Z-projection of dataset from C (480 images acquired at 0.87 frames per second) with a sample organelle track in yellow. (F) Kymograph of an in vivo time-lapse recording. Scalebar 20 µm. (G) Zoom-in of the episode between the yellow lines in F. Two NPY-tagged organelles moving in opposite directions marked with pink and blue circles. Scale bar 20 µm. (H) Tracking of moving organelles in F with the faster moving organelles indicated in green (anterograde), the slower in red (retrograde), and pausing in blue. (I) Mean speed of 394 tracked NPY-tagged organelles in 25 axons in 5 mice. Anterograde mean speed 1.52 µm/s; retrograde mean speed 1.07 µm/s. Asterisks indicate level of significance (significance tested with Kolmogorov-Smirnov test, p-value<0.0001 ****).
Figure 2
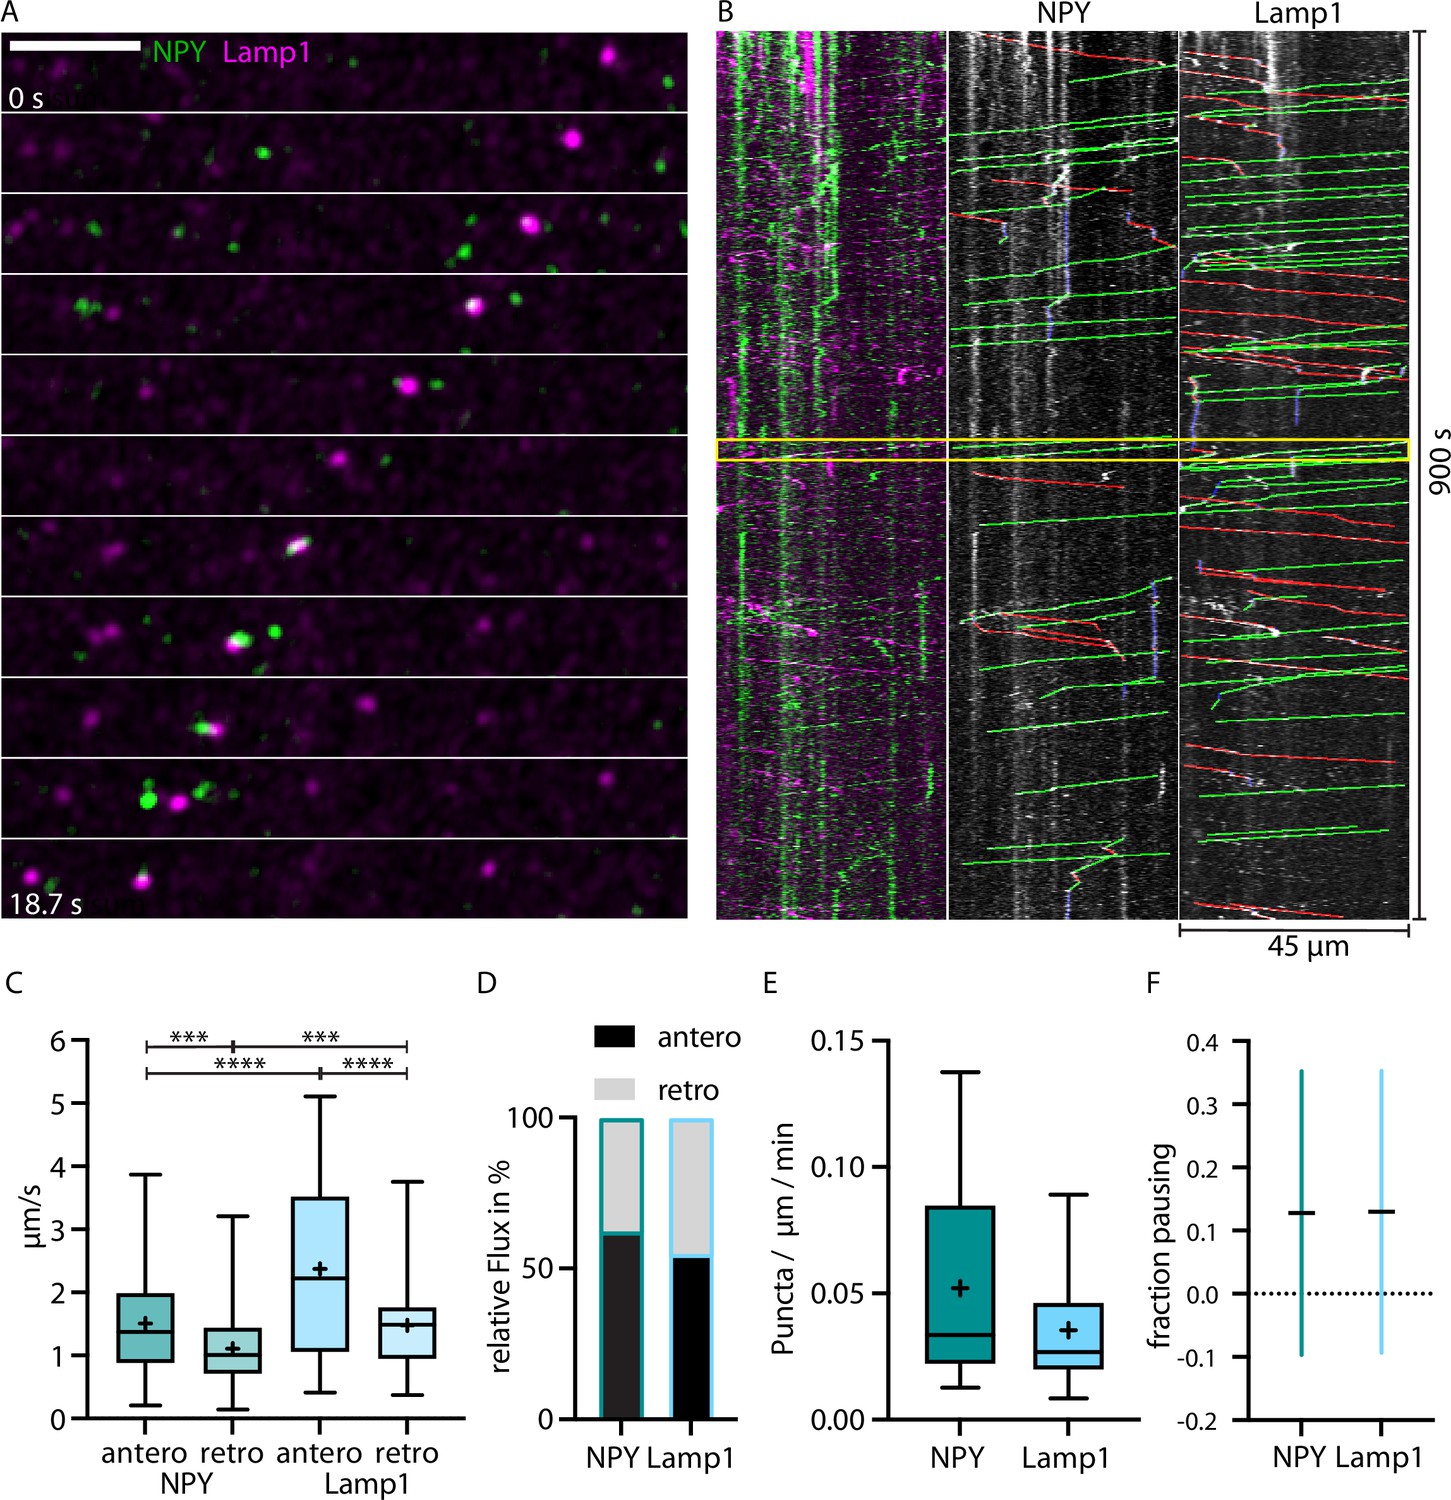
LAMP1-tagged organelles move faster than Neuropeptide Y (NPY)-tagged organelles in thalamocortical axons.
(A) Zoom-in of in vivo time-lapse recording of an axon stretch in cortical layer 1 from thalamocortical neuron co-infected with NPY-Venus (green) and LAMP1-mScarlet (magenta) showing NPY- and LAMP1-tagged organelles passing each other. Scale bar 10 µm (B) Left: kymograph of the in vivo time-lapse recording depicted in A. The two yellow lines indicate the zoom-in area depicted in A. Middle: tracked moving NPY-tagged organelles in anterograde direction indicated in green, in retrograde direction in red, and pausing in blue. Right: tracked moving LAMP1-tagged organelles in anterograde direction indicated in green, in retrograde direction in red, and pausing in blue. (C) Mean speed of 159 NPY-tagged organelles and 122 LAMP1-tagged organelles in 7 axons in 4 mice. NPY mean speed: anterograde 1.51 µm/s and retrograde 1.11 µm/s. LAMP1 mean speed: anterograde 2.37 µm/s and retrograde 1.48 µm/s. Asterisks indicate level of significance (significance tested with Kolmogorov-Smirnov test, p-value<0.001 *** and <0.0001 ****). (D) Relative flux of the same NPY-and LAMP1-tagged organelles as in C. (E) Absolute flux (number of moving organelles per µm axon stretch per minute). Boxplots depicting distribution median (center line), mean (plus), and quartiles (top/bottom of box). (F) Mean fraction of pausing NPY- and LAMP1-tagged organelles. Is similar for NPY- and LAMP1-tagged organelles (0.127 for NPY and 0.13 for LAMP1). Error bars show SD.
Figure 3
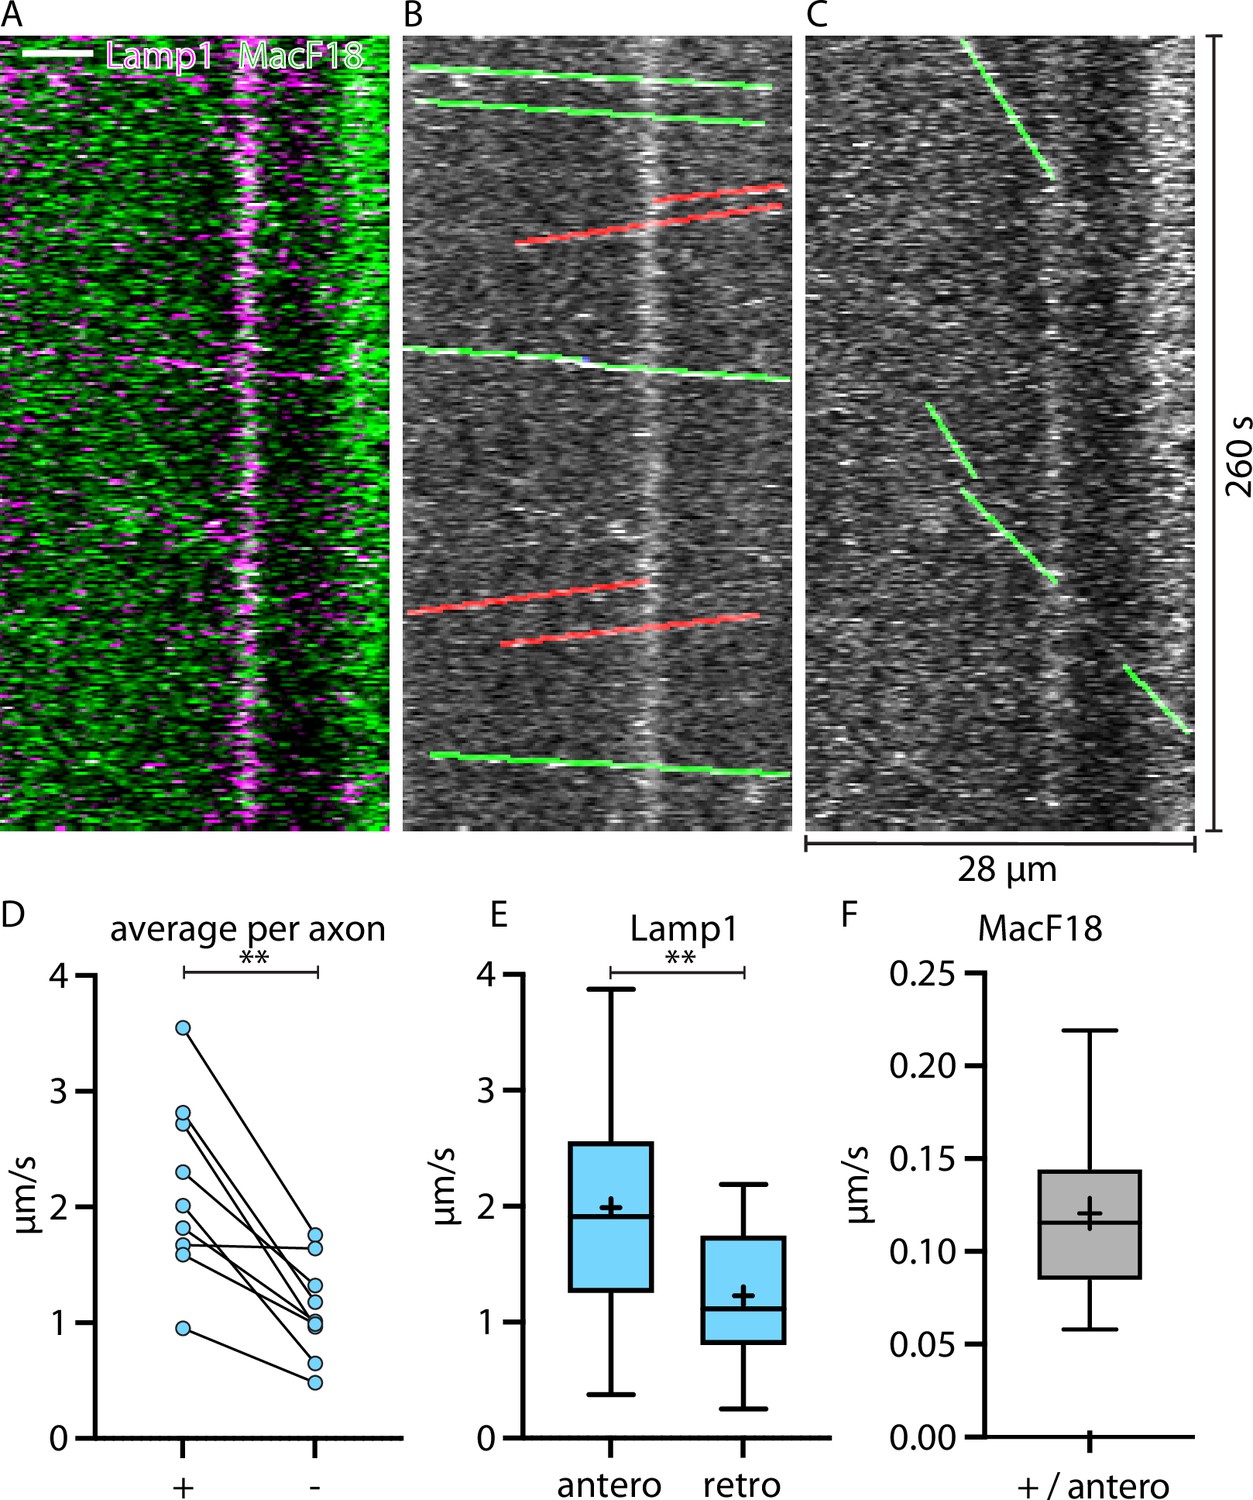
Lamp1-tagged organelles travel faster in anterograde direction, indicated with the microtubule plus-end marker MacF18.
(A) Kymograph of an in vivo time-lapse recording of an axon stretch co-expressing Lamp1-mScarlet and MacF18-GFP. Scale bar 5 µm. (B) Lamp1 channel from A. Tracked Lamp1-tagged organelles with faster speed overlayed in green and slower overlayed in red. (C) MacF18 channel from A. Tracked MacF18 puncta overlayed in green indicating anterograde movement. (D) Paired analysis of average speeds in + and − end microtubule direction in individual axons (nine different axons) (E) Mean speed of Lamp1-tagged organelles in MacF18 co-expressing axons (9 different axons and 78 tracks). Asterisks indicate level of significance (significance tested with Wilcoxon signed-rank test, p-value<0.01 **). Asterisks indicate level of significance (significance tested with Kolmogorov-Smirnov test, p-value<0.01 **). (F) Mean speed of MacF18 puncta in with Lamp1 co-expressing axons (9 different axons and 36 tracks).
Figure 4

RAB7-tagged organelles move faster than Neuropeptide Y (NPY)-tagged organelles in both directions.
(A) Zoom-in of vivo time-lapse of axon co-expressing NPY-Venus (green) and RAB7-mScarlet (magenta) showing NPY- and RAB7-tagged organelles moving in opposite direction crossing each other. Scale bar 10 µm. (B) Left: kymograph of same in vivo time-lapse recording as the axon stretch depicted in A. Yellow box indicates zoom-in area depicted in A. Middle: tracked moving NPY-tagged organelles in anterograde direction indicated in green, retrograde direction in red, and pausing in blue. Right: tracked moving RAB7-tagged organelles in anterograde direction indicated in green, retrograde direction in red, and pausing in blue. (C) Mean speed of 244 NPY-tagged organelles and 195 RAB7-tagged organelles in 18 axons in 2 mice. NPY mean speed: anterograde 1.52 µm/s and retrograde 1.02 µm/s. LAMP1 mean speed: anterograde 2.34 µm/s and retrograde 1.37 µm/s. Asterisks indicate level of significance (significance tested with Kolmogorov-Smirnov test, p-value<0.05 *, <0.01 **, <0.001 ***, and <0.0001 ****). (D) Relative flux of the same NPY- and RAB7-tagged organelles as in C. (E) Absolute flux per µm axon stretch per minute. (F) Mean fraction of pausing NPY- and RAB7-tagged organelles. 0.22 for NPY and 0.085 for RAB7. Error bars show SD. Asterisks indicate level of significance (significance tested with Kolmogorov-Smirnov test, p-value<0.0001 ****).
Figure 5
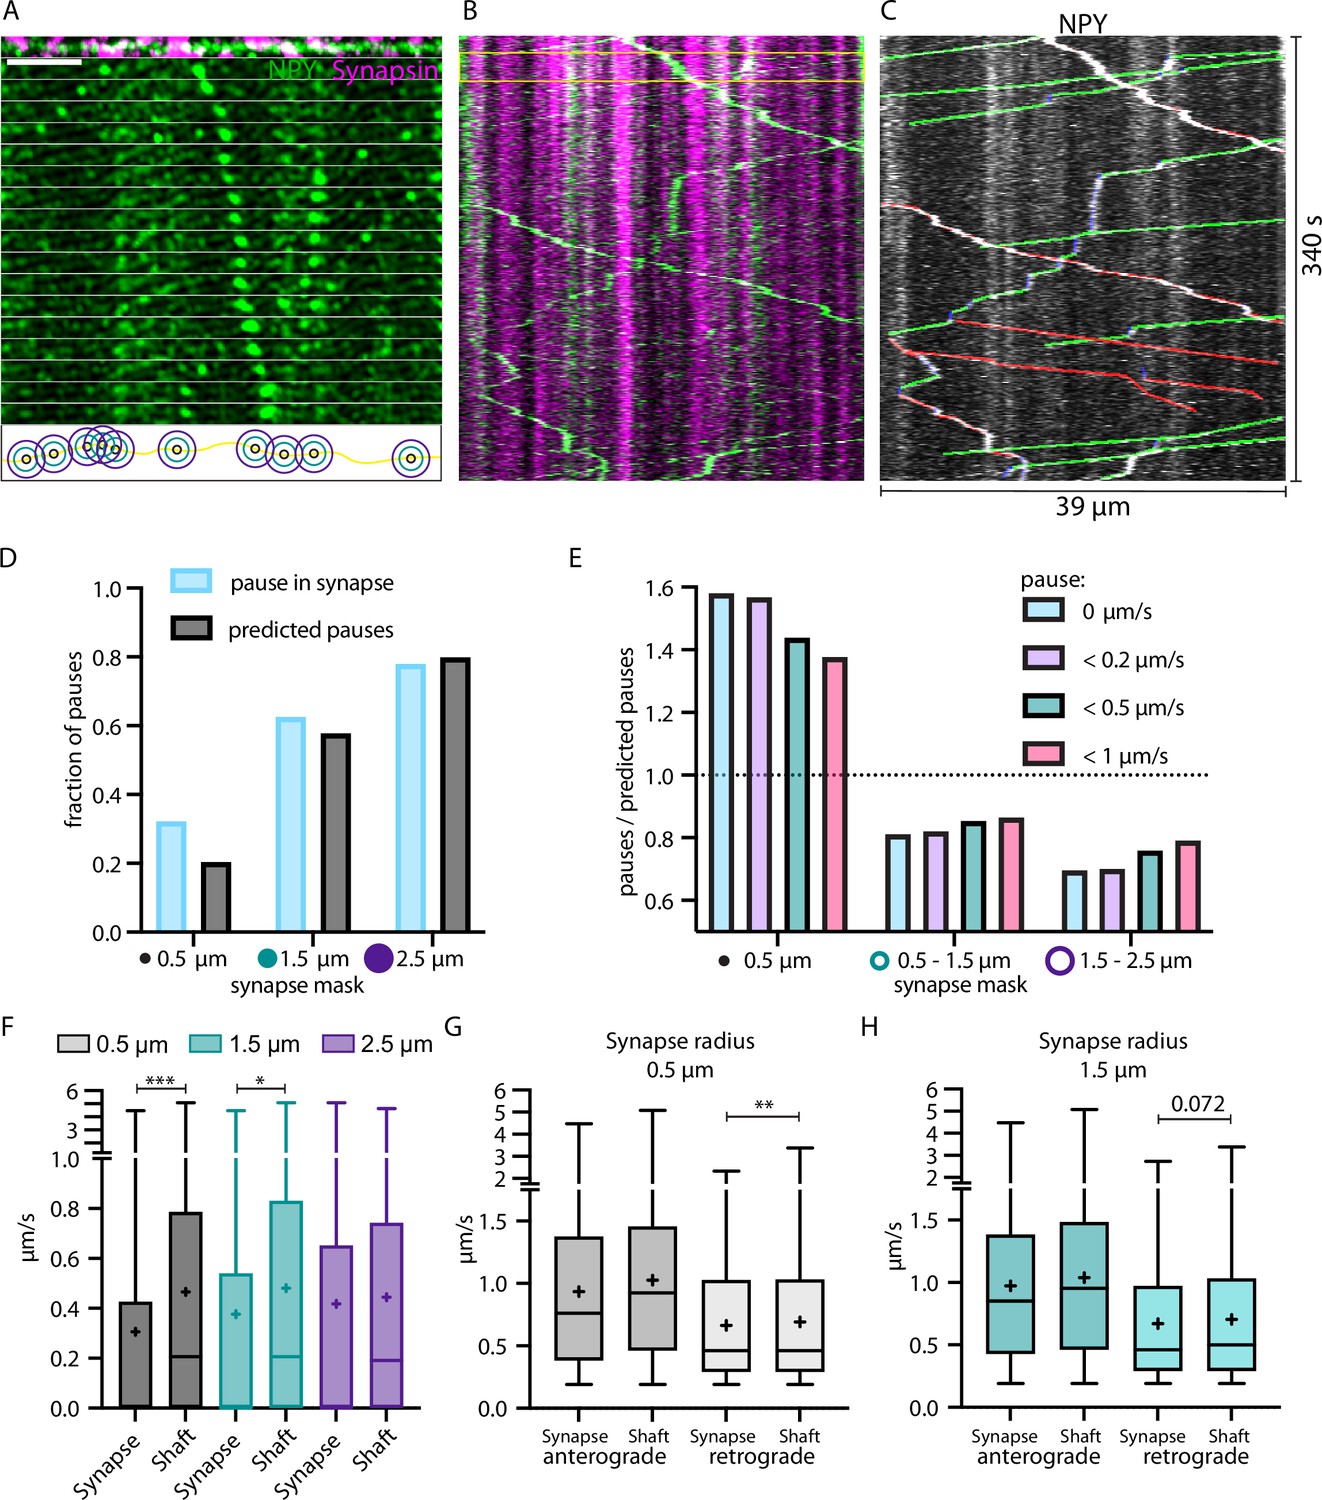
Neuropeptide Y (NPY)-tagged organelles slow down in Synapsin-labeled synapses.
(A) Top: max-projection of axon stretch co-expressing NPY-Venus and Synapsin-mScarlet. Middle: time-lapse of NPY-Venus in the same axon stretch. Bottom: scheme of increasing radius of synapse mask from midpoint of Synapsin signal. Scale bar 10 µm. (B) Kymograph of axon stretch from A with area of time-lapse from A marked in yellow. (C) Tracked kymograph from B. With anterograde direction indicated in green, retrograde in red, and pausing in blue. (D) Fraction of pauses (speed value = 0; in blue) within synapse mask with increasing radius compared to predicted pauses (fraction of synapse mask area of the whole axon; in black). (E) Factor of pauses/predicted pauses for synapse area of 0.5 µm, 0.5–1.5 µm, and 1.5–2.5 µm (donut shape) with changing definition of pauses, only 0 µm/s, <0.2 µm/s, <0.5 µm/s, and <1 µm/s. Factor of one corresponds to same amount of measured and predicted pauses. (F) Individual local speed values in shaft (outside mask) vs synapse (inside mask) with increasing radius of synapse mask. 6324 individual speed values from 72 tracks (five axons and two mice). Means in µm/s: 0.5 µm synapse 0.31, shaft 0.47; 1.5 µm synapse 0.38, shaft 0.48; 2.5 µm synapse 0.42, shaft 0.44. Differences tested with linear mixed effect model including mouse, slice, and track level as random effects and location (synapse/shaft) as fixed effect. ANOVA was used to test model including location with model excluding it. Asterisks indicate level of significance test, p-value<0.05 ≙ * and p-value<0.001 ≙ ***. (G and H) Values from F for 0.5 µm and 1.5 µm synapse mask split up into anterograde and retrograde direction. Means in µm/s: (G) anterograde synapse 0.94, shaft 1.03; retrograde synapse 0.66, shaft 0.69; (H) anterograde synapse 0.97, shaft 1.04; retrograde synapse 0.67, shaft 0.71. Differences tested with linear mixed effect model including mouse, slice, and track level as random effects and location (synapse/shaft) as fixed effect. ANOVA was used to test model including location to model excluding it. Asterisks indicate level of significance test, p-value<0.01 ≙ **.
Figure 6 with 2 supplements
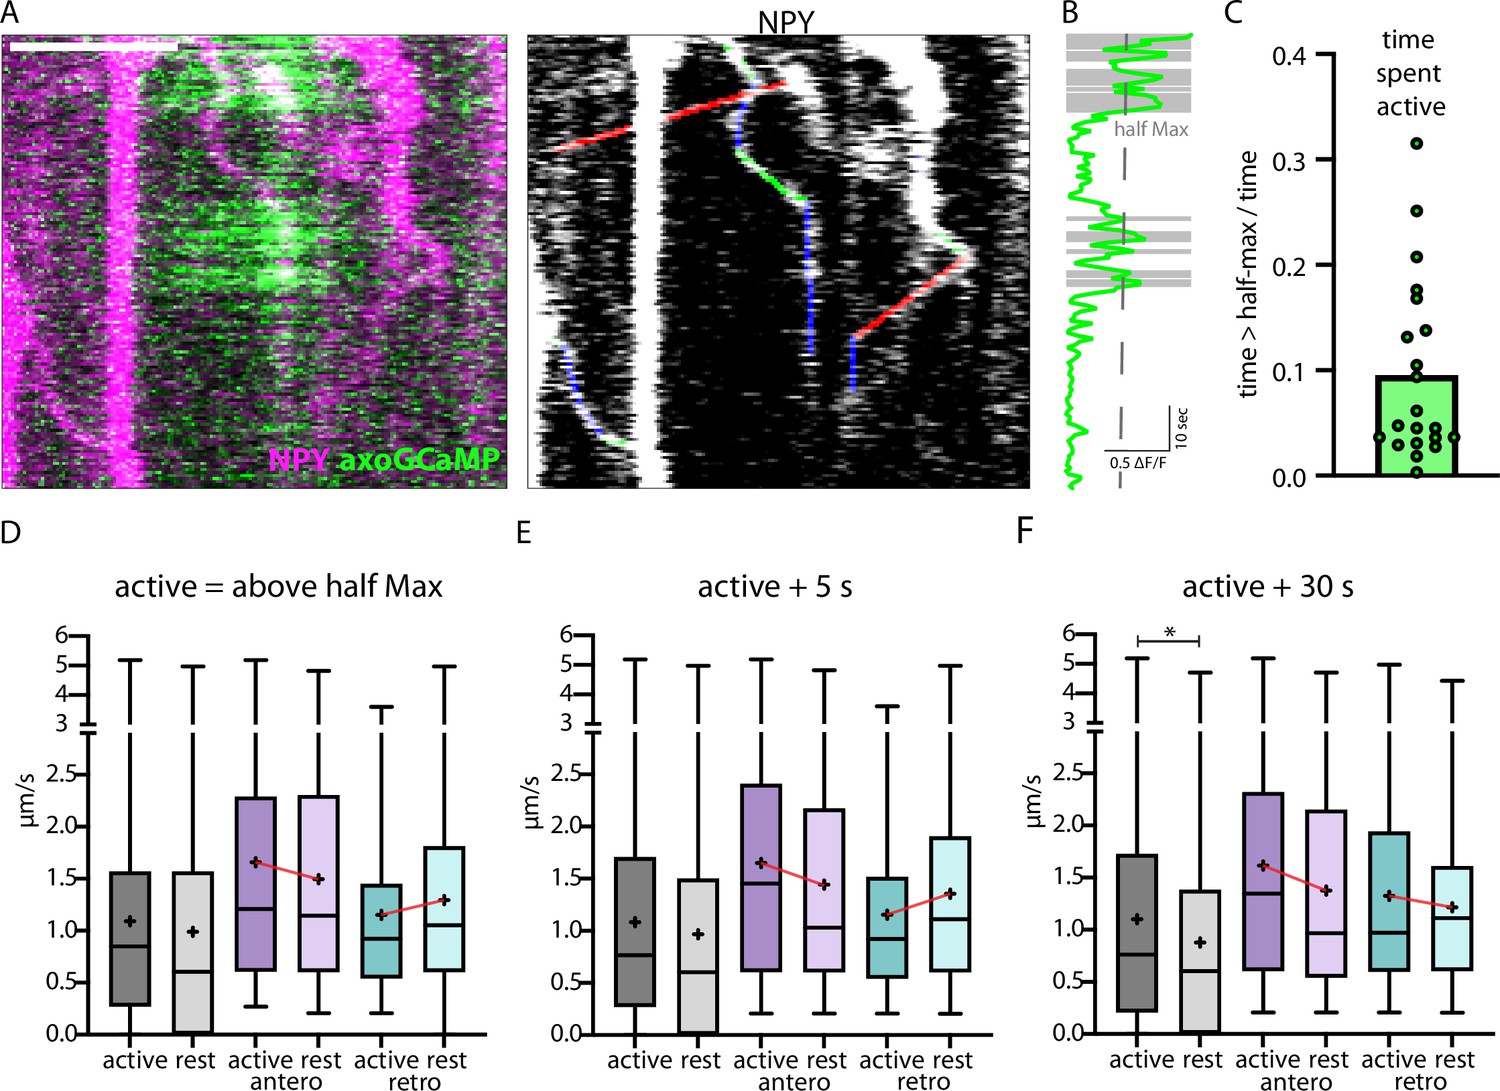
Correlation of axonal calcium influx measured with AxoGCamp and trafficking of Neuropeptide Y (NPY)-tagged organelles.
(A) Kymograph of axon stretch co-expressing axoGCaMP (green) and NPY-mScarlet (magenta). Scale bar 10 µm. Right: tracked moving NPY-tagged organelles in one direction indicated in green, the other in red, and pausing in blue. (B) Calcium trace corresponding to A in green and above half maximal ΔF/F in gray. (C) Mean ratio of time the calcium level was above half max (21 axon stretches). The intensity of the maximal axoGCamp in between axon stretches varied from 0.2 to 1 ΔF/F. (D) Box plots of speed values (4313 speed values of 129 tracks in 18 axons from 8 datasets in 3 mice) of NPY-tagged organelles during activity and at rest (above and below half max of ΔF/F GCamp signal). Means in µm/s: active 1.09, rest 0.99, active antero 1.66, rest antero 1.50, active retro 1.15, and rest retro 1.30. (E and F) +5 and +30 depict the same tracks but with longer defined activity windows after ΔF/F falls below half max (5 s or 30 s longer window). Means for E in µm/s: active 1.08, rest 0.97, active antero 1.65, rest antero 1.44, active retro 1.15, and rest retro 1.36. Means for F in µm/s: active 1.10, rest 0.88, active antero 1.62, rest antero 1.38, active retro 1.33, and rest retro 1.22. Differences tested with linear mixed effect model including mouse, dataset, and track level as random effects and location (synapse/shaft) as fixed effect. ANOVA was used to test model including activity with model excluding it. Asterisks indicate level of significance test, p-value<0.05 *.
Figure 6—figure supplement 1
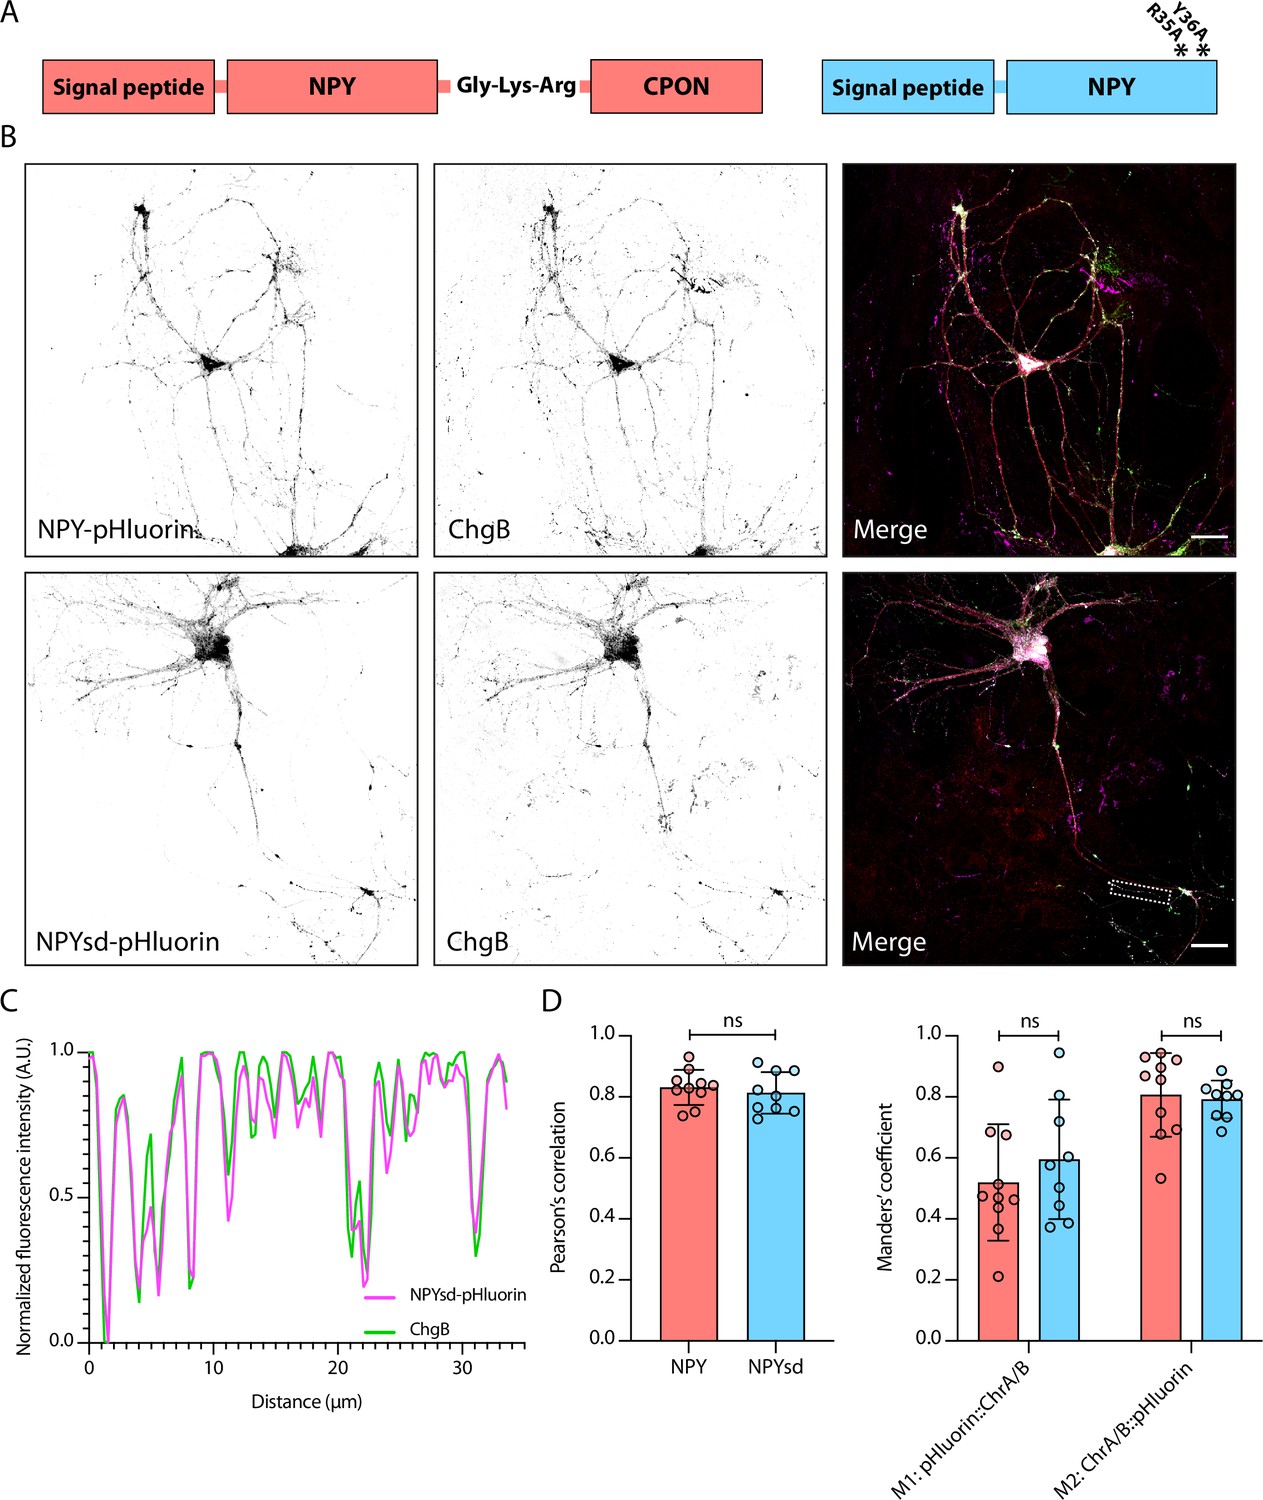
Neuropeptide Y (NPY)-pHluorin and signaling-dead NPY (NPYsd)-pHluorin both co-localize to endogenous dense core vesicle (DCV) markers.
(A) Schematic representation of NPY (left) and NPYsd (right), with asterisks representing mutations in NPY receptor binding residues. (B) Representative confocal image of wildtype hippocampal neurons infected with NPY-pHluorin (top panel) and NPYsd-pHluorin (bottom panel). Dendrites (MAP2, red) and DCVs (ChromograninB, magenta) were labeled. Scalebars = 30 μm. (C) Profile plot of signal intensity along a neurite indicated by the dashed box in (B).(D) Summary data of co-localization analysis of NPY-pHluorin and NPYsd-pHluorin with endogenous DCV markers (NPY: n = 10 neurons, NPYsd: n = 9 neurons). Pearson’s correlation coefficient (left) and Manders’ correlation coefficient (right) were calculated for NPY:ChgA/B and NPYsd:ChgA/B. Left: Mann-Whitney U test: ns, p>0.05. Right: two-way ANOVA: ns, p>0.05.
Figure 6—figure supplement 2
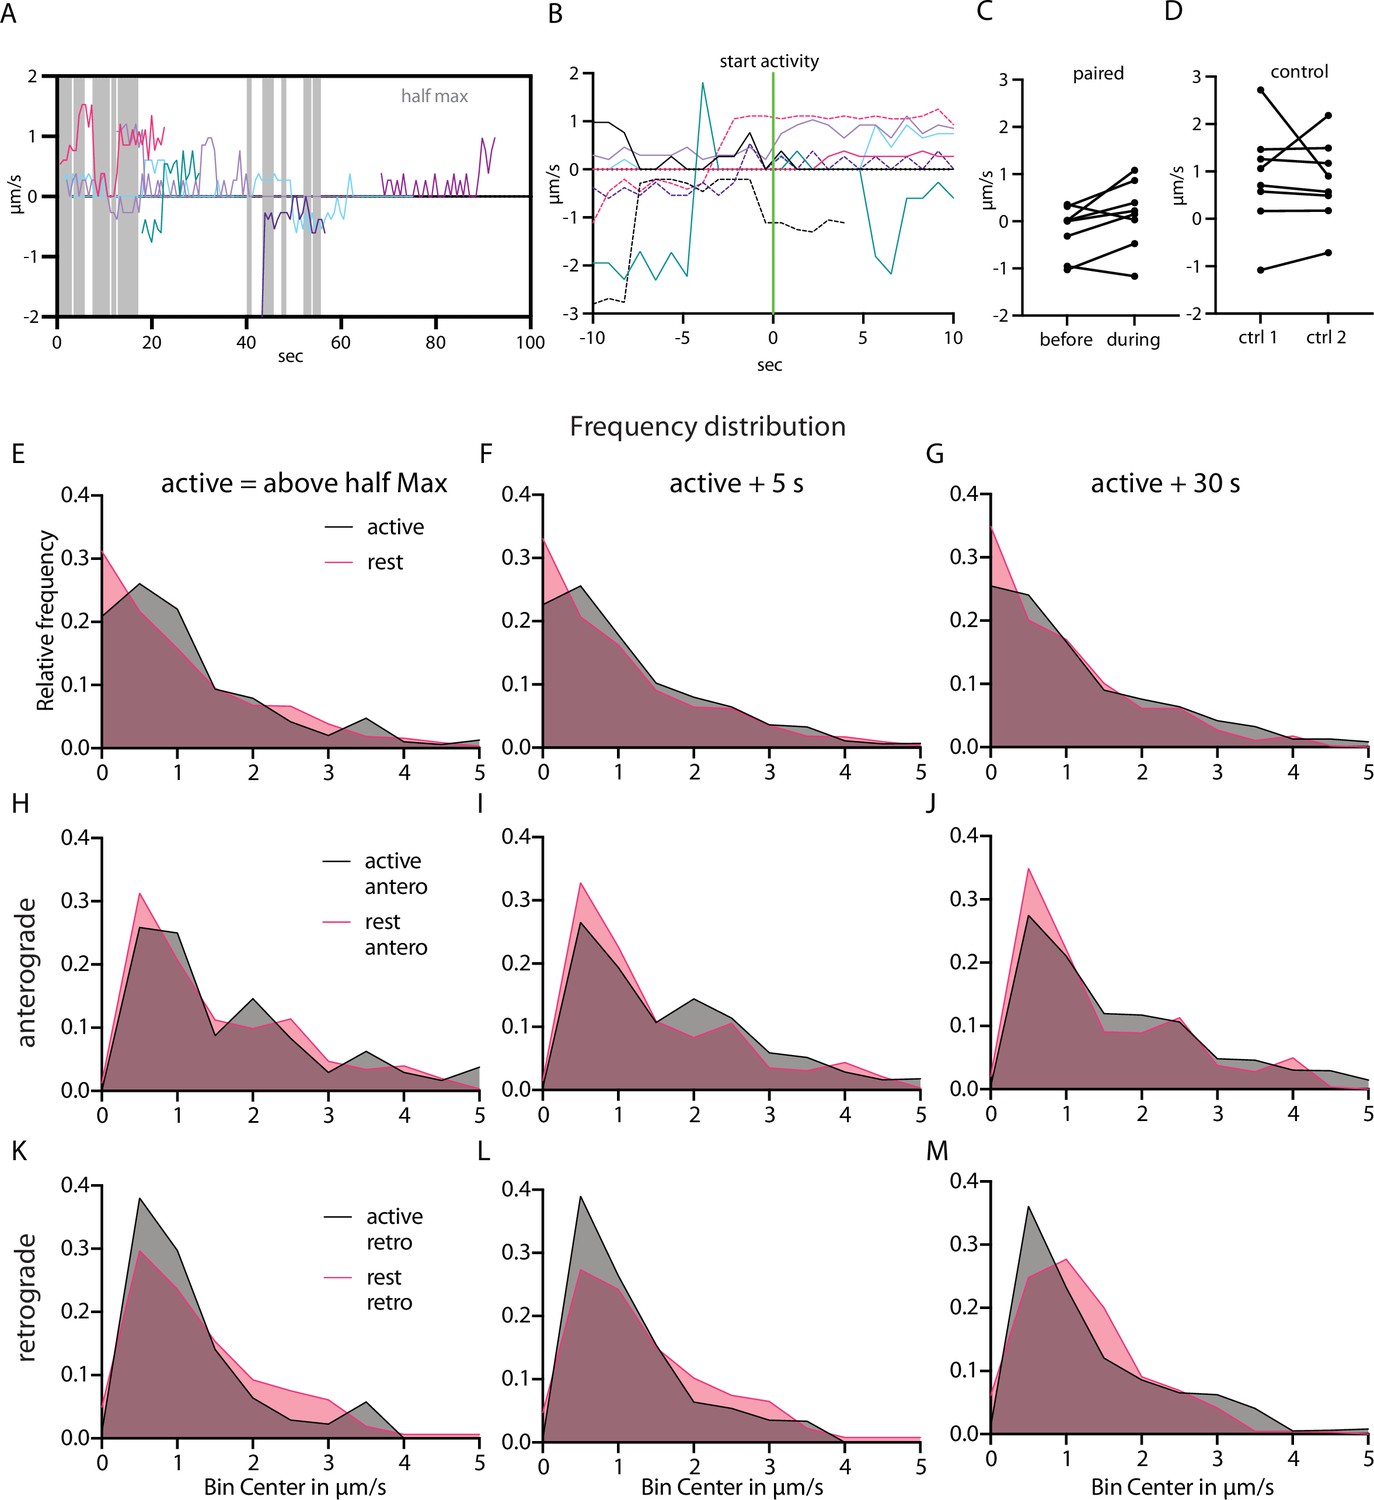
Speed of Neuropeptide Y (NPY)-tagged organelles correlated to activity state.
(A) Local speed of eight NPY-tagged organelles in the same axon. In gray, the timepoints at which half maximal axoGCaMP level is reached in that axon. Negative and positive speed depict different traveling direction. (B) Tracks of eight different NPY-tagged organelles from different datasets aligned to the start of a rise in calcium level (half max reached). (C) Paired average speed of 10 s before and after the start of a calcium event of the tracks in D. (D) Control for C. Paired average speed of first and second half of 20 s of NPY-tagged organelles in axons without calcium activity (n=8) (E–M) Frequency distribution of speed values of NPY-tagged organelles during active and rest state. Bin size 0.5 µm/s. E–G pooled values including 0 µm/s values. H–J speed values of anterograde and K–M retrograde transported organelles. Left column: active defined as axoGCaMP signal above half maximum. Middle column: active state additionally includes +5 s after each activity. Right column: active state additionally includes +30 s after each activity.
Figure 7 with 1 supplement
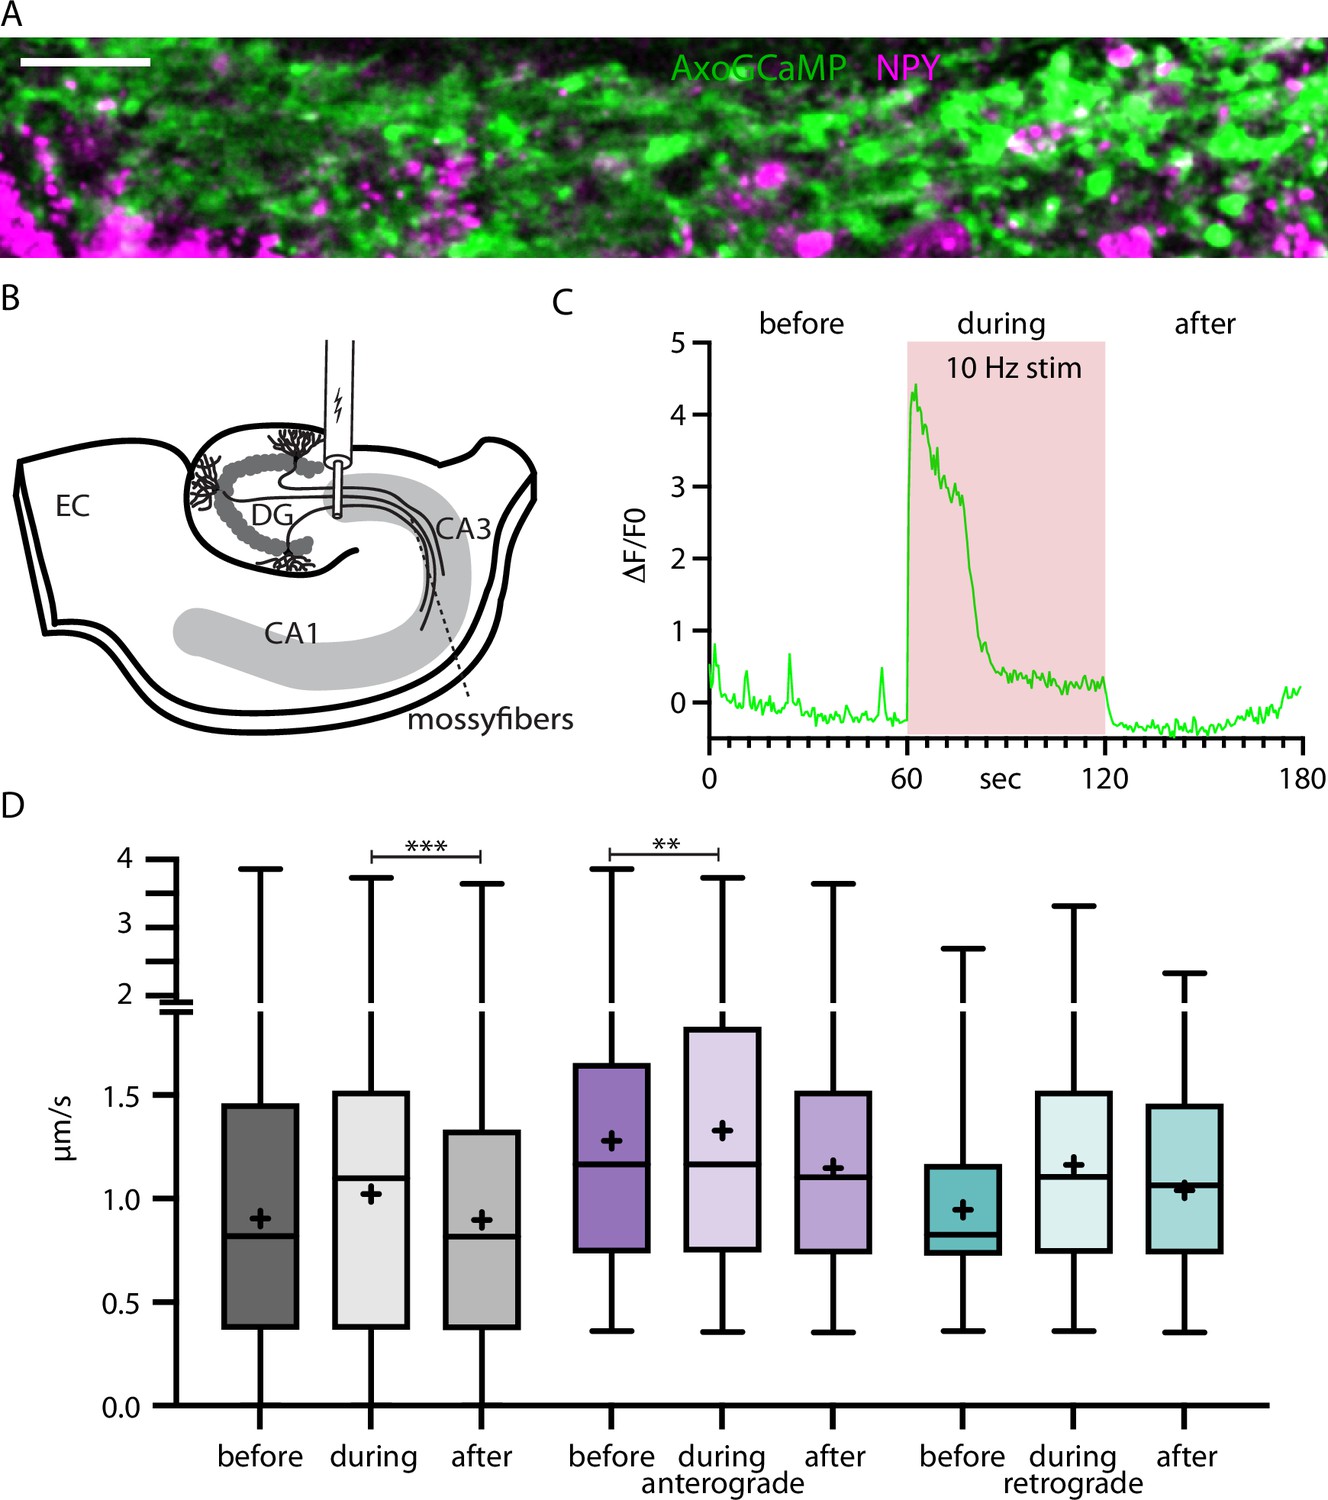
Neuropeptide Y (NPY)-tagged organelle trafficking during electrical stimulation in acute hippocampal slices.
(A) Max-projection of dentate gyrus (DG) mossy fibers in the CA3 region of the hippocampus co-expressing axoGCaMP and NPY-mScarlet in an acute-slice. Scale bar 20 µm. (B) Scheme of acute slice electrical stimulation in DG/CA3 region. Adeno-associated virus (AAV) axoGCaMP and NPY-mScarlet injected in DG. (C) Example axoGCaMP trace of a mossy-fiber bouton with 1 min 10 Hz stimulation (red box). (D) Box plots of speed values (5446 speed values of 247 tracks in 100 axons from 5 slices from 2 mice) tracked NPY-tagged organelles divided into before, during, and after the 1 min long 10 Hz electrical stimulation. Gray: pooled values; violet: speed values from anterograde transported organelles; green: speed values from retrograde transported organelles. Differences tested with linear mixed effect model including mouse, dataset, and track level as random effects and location (synapse/shaft) as fixed effect. ANOVA was used to test model including activity with model excluding it. Asterisks indicate level of significance test, p-value<0.01 **, and p-value<0.001 ***.
Figure 7—figure supplement 1
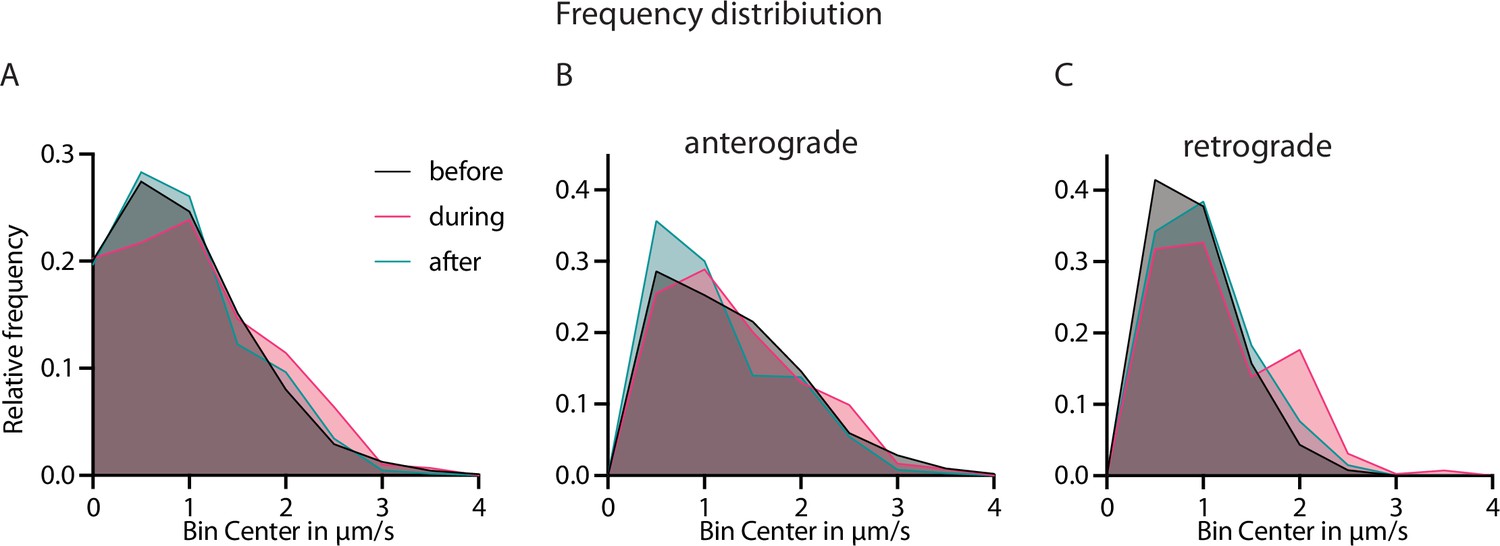
Speed distribution of Neuropeptide Y (NPY)-tagged organelles across activity states.
(A) Frequency distribution of NPY-tagged organelles before, during and after 10 Hz electrical stimulation bin size of 0.5 µm/s. (B and C) Frequency distribution of A split in anterograde and retrograde direction.
Figure 8
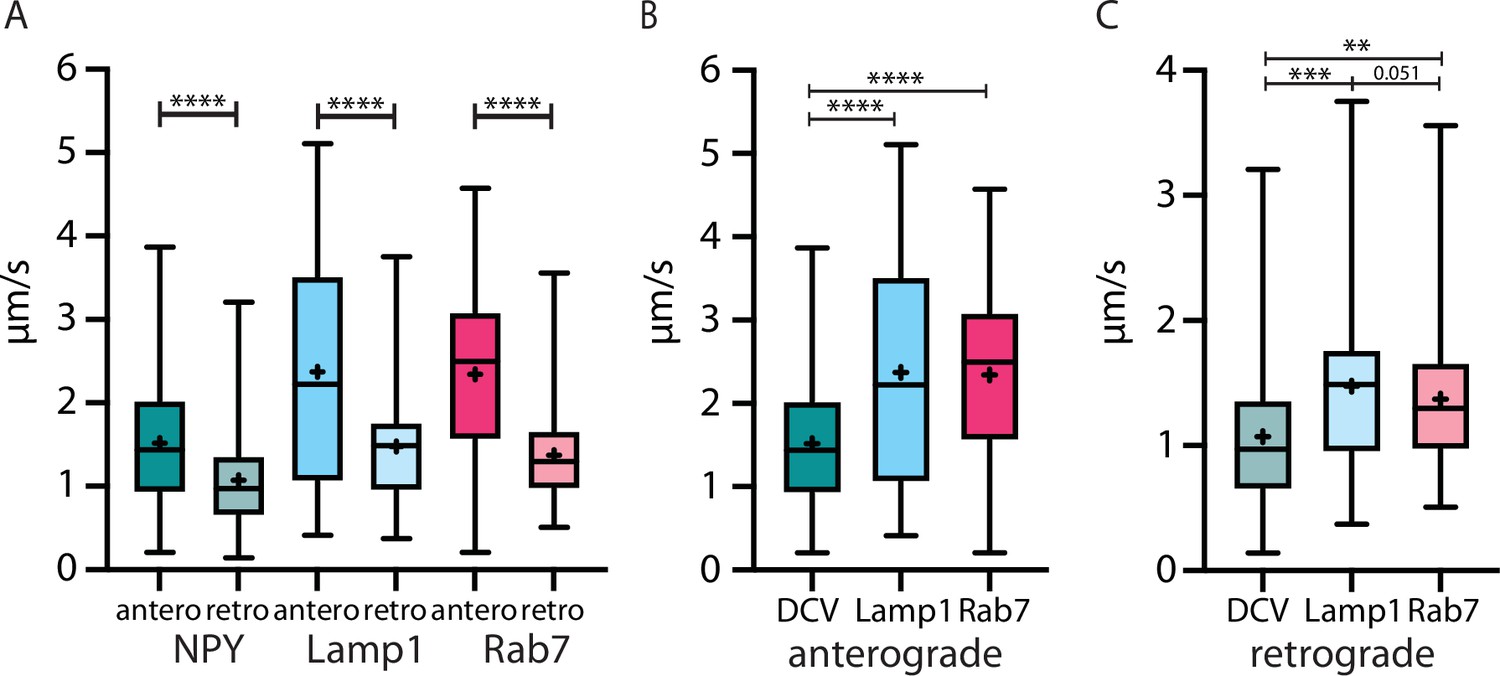
The velocity of three different organelle markers in vivo speed from Neuropeptide Y (NPY)-, LAMP1-, and RAB7-tagged organelles in anterograde and retrograde direction.
(A) All markers traveled significantly faster in anterograde than in retrograde direction. (B and C): NPY-tagged organelles moved significantly slower than both endo-lysosomal markers in both directions. Asterisks indicate level of significance (significance tested with Kolmogorov-Smirnov test, p-value<0.05 *, <0.01 **, <0.001 ***, and <0.0001 ****).
Videos
Video 1
Mobile Neuropeptide Y (NPY)- and LAMP1-tagged organelles in thalamic neurons.
Video 2
Trafficking Neuropeptide Y (NPY)- and RAB7-tagged organelles in thalamic neurons.
Video 3
Axonal-targeted GCamp6 and signaling-dead Neuropeptide Y (NPYsd)-mScarlet in a single thalamic neuron.
Video 4
Mossy fiber bundles with axonal targeted GCamp6 and signaling-dead Neuropeptide Y (NPYsd)-mScarlet in acute hippocampal slices.
Tables
Table 1
Comparison of organelle marker trafficking characteristics in different model systems from literature.
| Model | Marker | Source | Speed in µm/s | Fraction | Rel. flux in | Abs. flux in | |
|---|---|---|---|---|---|---|---|
| Antero | Retro | Pausing | Antero dir. | Org./µm/min | |||
| Mouse thalamocortical neurons | Neuropeptide Y (NPY) | Nassal et al. | 1.518 | 1.073 | 0.13/0.22 | 0.61/0.82 | 0.052/0.025 |
| Mouse thalamocortical neurons | NPY | Knabbe et al. | 2.14 | 1.4 | 0.11 | ||
| Mouse sciatic nerve motor neurons | HcT/Neurotrophin | Sleigh et al. | 2.5–2.8* | 0.01* | |||
| Mouse sciatic nerve sensory neurons | HcT/Neurotrophin | Sleigh et al. | 1.8* | 0.005* | |||
| Mouse thalamocortical neurons | LAMP1 | Nassal et al. | 2.371 | 1.476 | 0.1298 | 0.54 | 0.035 |
| Mouse thalamocortical neurons | RAB7 | Nassal et al. | 2.344 | 1.37 | 0.085 | 0.51 | 0.017 |
| Mouse cultured cortical neurons | Sema3A | de Wit et al. | 0.78 | 0.43 | 0.22 | ||
| Mouse cultured hippocampal neurons | NPY | Bittins et al. | 1.14 | 0.75 | 0.023* | ||
| Rat cultured hippocampal neurons | tPA | Kwinter et al. | 1.23 | 1.28 | 0.16 | ||
| Rat cultured hippocampal neurons | BDNF | Cavolo et al. | 1.37 | 1.42 | |||
| Rat cultured hippocampal neurons | LAMP1 | Boecker et al. | 2 | 1.5* | 0.5$§ | ||
| Human iPSC derived cultured neurons | LAMP1 | Boecker et al. | 1.5 | 1* | 0.5$§ | ||
| Mouse cultured hippocampal neurons | LAMP1 | De Pace et al. | 1.7 | ||||
| Mouse cultured hippocampal neurons | LAMP1 | Snouwaert et al. | 0.85* | 0.75* | |||
| Rat cultured hippocampal neurons | RAB7 | Boecker et al. | 1* | 1* | 0.29$§ | ||
| Human iPSC (induced pluripotent stem cell) derived cultured neurons | RAB7 | Boecker et al. | 0.7* | 0.9* | 0.25$§ | ||
| Rat cultured cortical neurons | RAB7 | Castle et al. | 0.57 | 0.57 | 0.73/0.62§ | ||
| Rat cultured DRG neurons | RAB7 | Zhang et al. | 0.31 | 0.53 | 0.33$ | ||
| Drosophila larval motor neurons | Ilp-2 | Lund et al. | 0.9* | 0.75* | 0.1* | 0.4* | |
| Drosophila larval motor neurons | ANF | Sung et al. | 0.78* | 0.78* | |||
| Drosophila larval motor neurons | RAB7 | Lund et al. | 0.9* | 0.85* | 0.15* | 0.25* | |
| Drosophila larval motor neurons | Spinster | Lund et al. | 0.95* | 0.85* | 0.1* | 0.4* | |
| C. elegans larval motor neurons | ANF | Barkus et al. | 1.14 | 0.41 | 0.13 | ||
-
*
Values have been estimated from graph in figures, §comparability issues, $values were transformed from original for better comparability.
Key resources table
| Reagent type (species) or resource | Designation | Source or reference | Identifiers | Additional information |
|---|---|---|---|---|
| Genetic reagent (M. musculus) | C57Bl/6 J | Charles River | C57Bl/6 J Strain code:632 | |
| Antibody | MAP2 (chicken, monoclonal) | Abcam | ab5392 | 1:500 |
| Antibody | Chromogranin B (rabbit, polyclonal) | Synaptic Systems | SySy 259103 | 1:500 |
| Antibody | Chromogranin A (rabbit, polyclonal) | Synaptic Systems | SySy 259003 | 1:500 |
| Software and algorithm | ImageJ/Fiji | ImageJ | RRID:SCR 002285 | - |
| Software and algorithm | Prism | Graphpad | RRID:SCR 002798 | - |
| Software and algorithm | R/RStudio | The R Foundation | RRID:SCR_0019057 RRID:SCR_000432 | - |
Additional files
Download links
A two-part list of links to download the article, or parts of the article, in various formats.
Downloads (link to download the article as PDF)
Open citations (links to open the citations from this article in various online reference manager services)
Cite this article (links to download the citations from this article in formats compatible with various reference manager tools)
Differential axonal trafficking of Neuropeptide Y-, LAMP1-, and RAB7-tagged organelles in vivo
eLife 11:e81721.
https://doi.org/10.7554/eLife.81721


