Antisense oligonucleotide therapy rescues disturbed brain rhythms and sleep in juvenile and adult mouse models of Angelman syndrome
- Department of Neuroscience, Baylor College of Medicine, United States
- The Cain Foundation Laboratories, Jan and Dan Duncan Neurological Research Institute at Texas Children’s Hospital, United States
- Department of Molecular and Human Genetics, Baylor College of Medicine, United States
- Ionis Pharmaceuticals, United States
- Jan and Dan Duncan Neurological Research Institute at Texas Children’s Hospital, United States
Figures
Figure 1
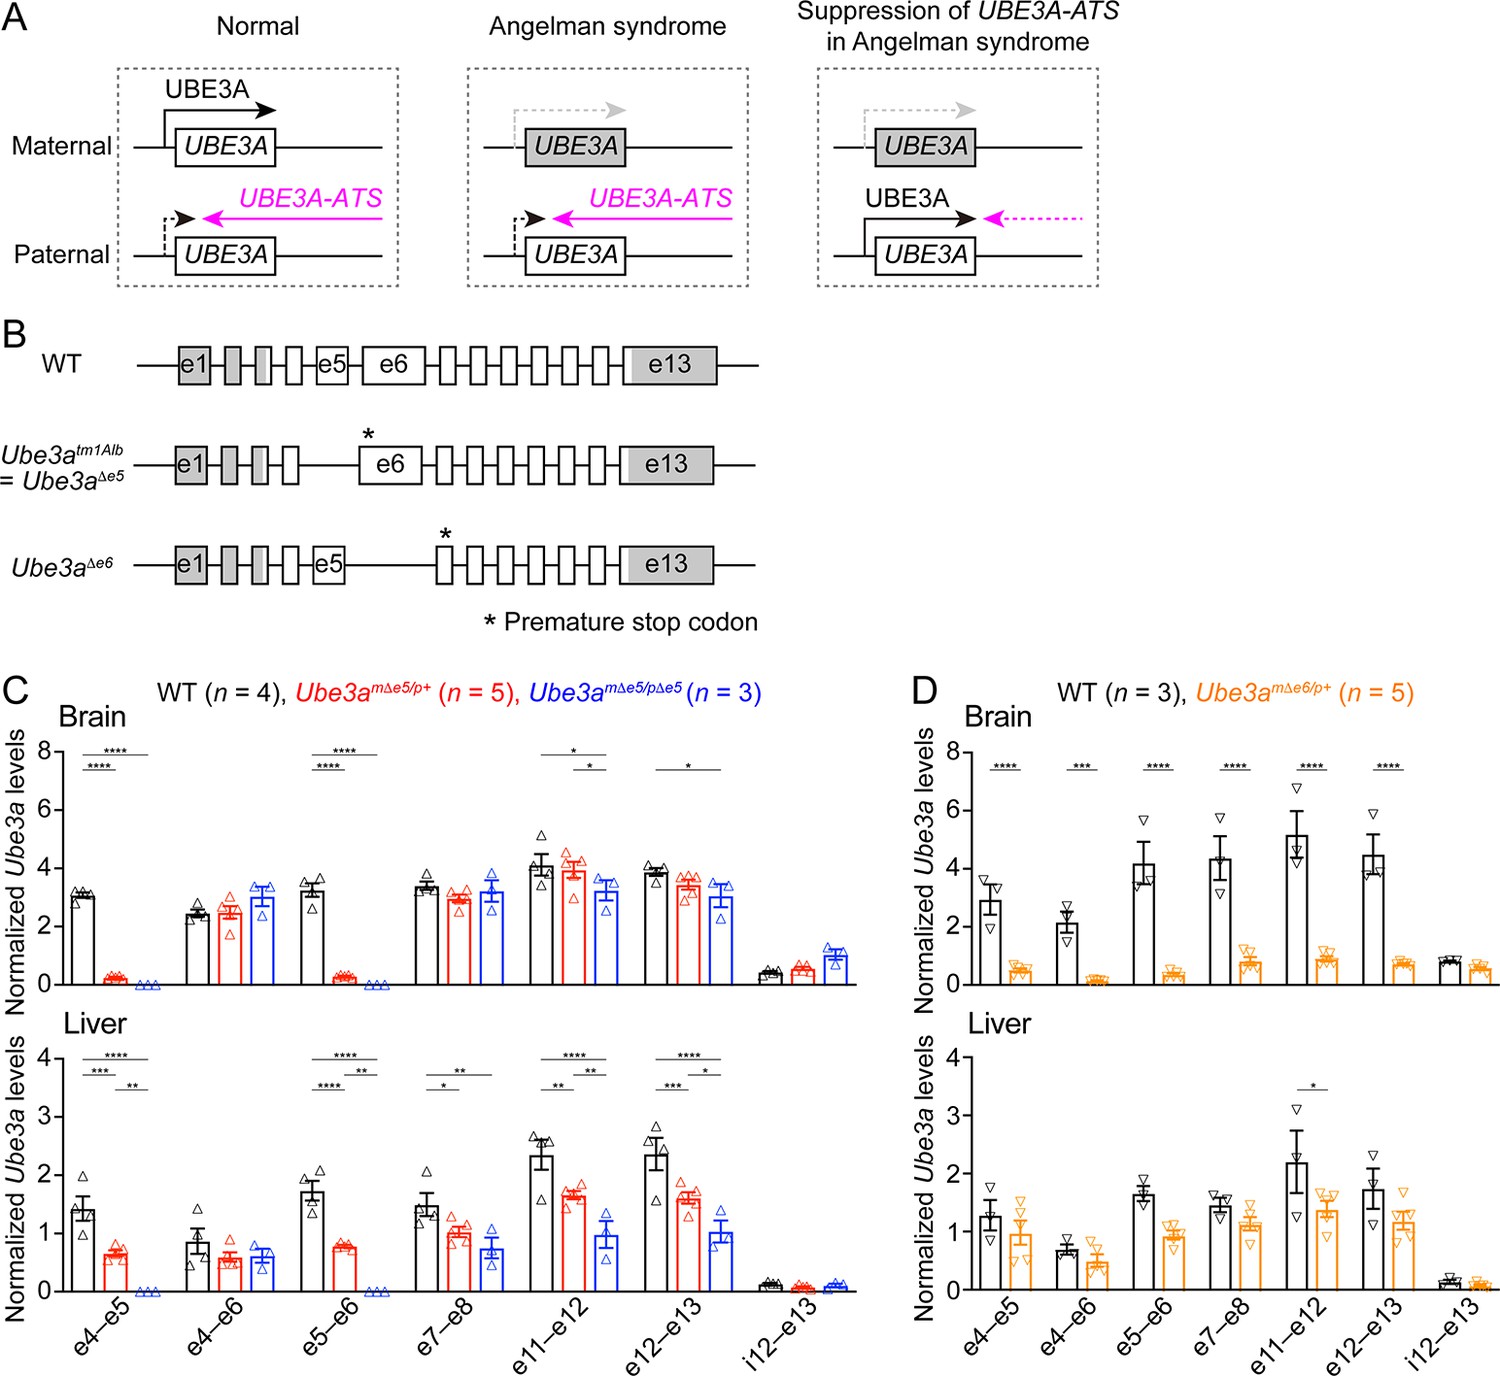
Ube3a mRNA is diminished in the brain of a new maternal Ube3a knockout mouse but remains in a previously generated Angelman syndrome mouse model.
(A) Schematics of UBE3A imprinting and Angelman syndrome. Left, in normal neurons, UBE3A proteins are only produced from the maternal copy of UBE3A because the paternal copy is silenced by UBE3A-ATS. Middle, deficiency of the maternal UBE3A (gray) leads to the loss of UBE3A proteins in neurons and causes Angelman syndrome. Right, suppressing UBE3A-ATS expression leads to the unsilencing of the paternal UBE3A. (B) Genomic structures of Ube3a wild-type (WT), Δe5 (also known as tm1Alb), and Δe6 alleles. The boxes indicate exons (e) 1–13. The white and gray regions indicate the coding and non-coding exon sequences of the longest Ube3a transcript, respectively. In the Δe5 and Δe6 alleles, exons 5 and 6 are deleted, resulting in a premature stop codon in exons 6 and 7, respectively. (C) Ube3a transcript levels were measured from the brains and livers of WT, Ube3amΔe5/p+ and Ube3amΔe5/pΔe5 mice using primer sets targeting different exons or introns as indicated in the figure. Ube3a mRNA levels were normalized by the Gapdh mRNA levels. Except the deleted exon 5, other exons in the brains of Ube3amΔe5/p+ and Ube3amΔe5/pΔe5 mice remain at the similar levels as WT mice. (D) Similar to (C), but for WT and Ube3amΔe6/p+ mice. Ube3a transcript is greatly reduced in the Ube3amΔe6/p+ mouse brains. The numbers of tested mice are indicated in the figure. Each symbol represents one mouse. Bar graphs are mean ± standard error of the mean (SEM). Two-way analysis of variance (ANOVA) with Tukey (C) or Šídák (D) multiple comparison test for all pairs of groups, *p < 0.05, **p < 0.01, ***p < 0.001, ****p < 0.0001.
Figure 2 with 1 supplement
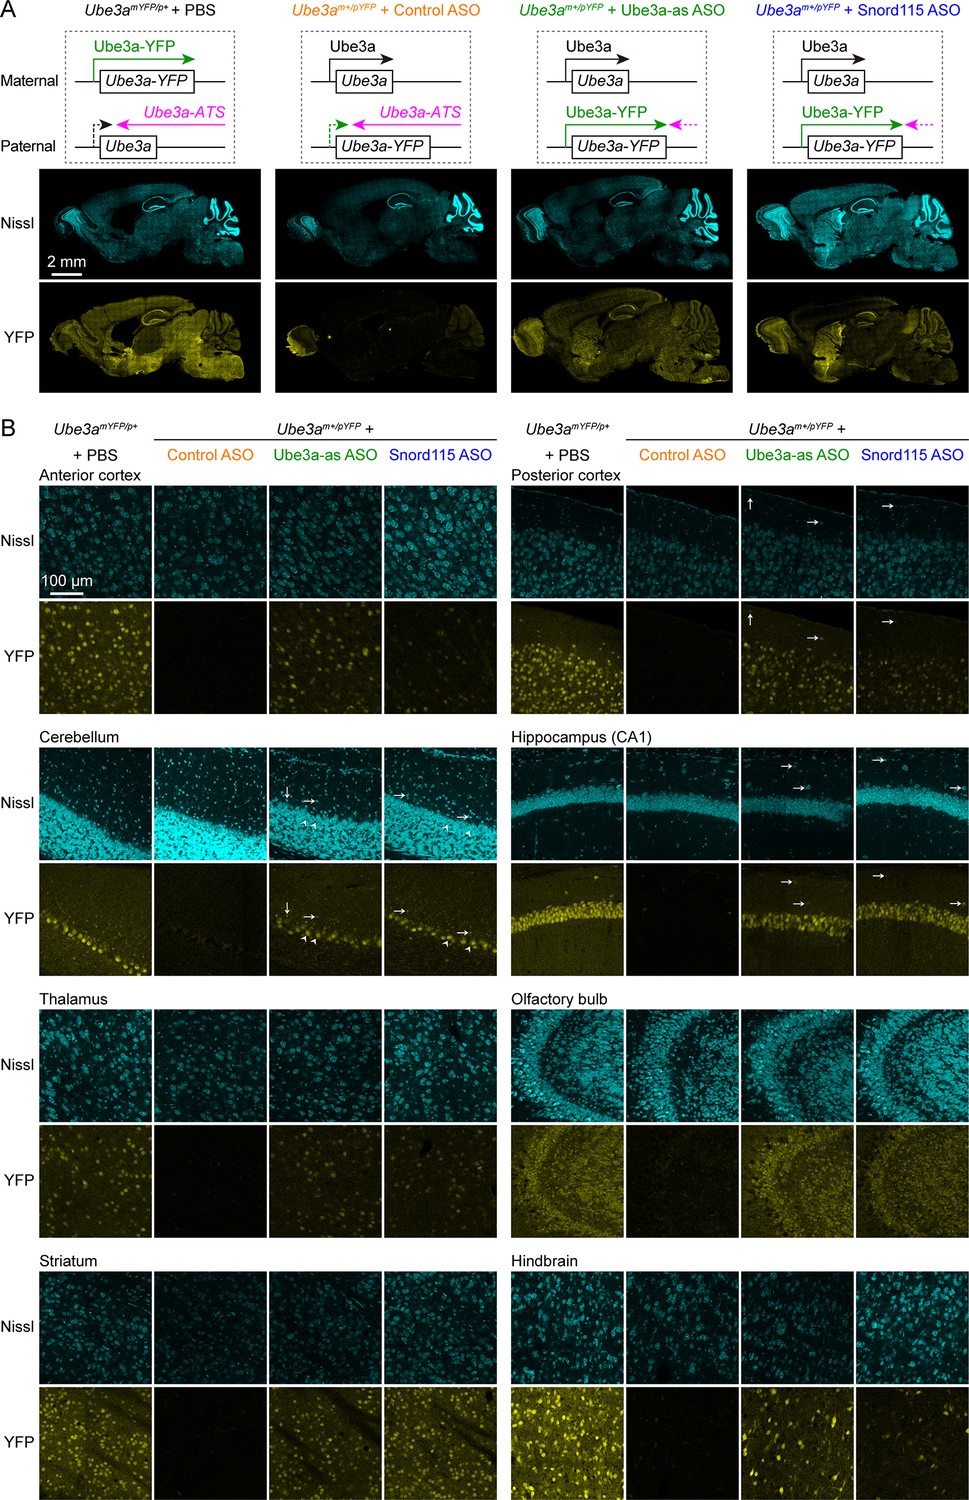
Antisense oligonucleotides (ASOs) targeting Ube3a-ATS reactivate paternal Ube3a-YFP expression.
(A) Schematics of Ube3a-YFP expression (upper panels) and representative fluorescent images of sagittal brain sections (lower panels) from maternal Ube3aYFP mice (Ube3amYFP/p+, n = 2) injected with phosphate-buffered saline (PBS) and paternal Ube3aYFP mice (Ube3am+/pYFP) injected with control (n = 2), Ube3a-as (n = 2), or Snord115 (n = 2) ASO. Sections were stained with fluorescent Nissl and an antibody recognizing YFP. Ube3a-YFP proteins are produced from the maternal copy of Ube3a-YFP in Ube3amYFP/p+ mice, but not from the paternal copy in Ube3am+/pYFP mice injected with control ASO because the paternal copy is silenced by Ube3a-ATS. Both Ube3a-as and Sord115 ASOs can suppress Ube3a-ATS expression in Ube3am+/pYFP mice and broadly reactivate the paternal Ube3a-YFP expression in the brains. (B) Similar to (A), but for images of eight different brain regions at high magnification. Arrows indicate YFP-positive GABAergic interneurons in cortical layer 1, cerebellar molecular layer, and hippocampal stratum oriens. Arrow heads indicate YFP-positive cerebellar Purkinje cells.
Figure 2—figure supplement 1

Antisense oligonucleotides (ASOs) targeting Ube3a-ATS increase Ube3a transcripts in wild-type (WT) mice and Ube3a-YFP expression in Ube3am+/pYFP mice.
(A, B) Ube3a-as ASO (A), Snord115 ASO (B), or phosphate-buffered saline (PBS) were injected into WT mice at the age of 8 weeks, followed by another injection 29 days later. Ube3a-ATS (A), Ipw (B), and Ube3a mRNA levels were measured from the cortex and spinal cord at 8 weeks post the first injection. Note, Ipw is part of the Ube3a-ATS and located upstream of the Snord115 small nuclear RNA cluster. Ube3a-ATS, Ipw, and Ube3a transcript levels were first normalized by the Gapdh levels and then by the average Ube3a-ATS, Ipw, and Ube3a transcript levels of PBS injected WT mice, respectively. Both ASOs reduced Ube3a-ATS or Ipw levels and increased Ube3a mRNA levels. The numbers of tested mice are indicated in the figure. Each open circle represents one female mouse. Bar graphs are mean ± standard error of the mean (SEM). Unpaired t-test for PBS and ASO comparison. **p <0.01, ***p < 0.001, ****p < 0.0001. (C) Summary data of normalized YFP intensities in different brain regions from Ube3amYFP/p+ mice injected with PBS (n = 2 or 3 sections from 2 mice) and Ube3am+/pYFP mice with control (n = 3 sections from 2 mice), Ube3a-as (n = 3 sections from 2 mice), or Snord115 (n = 2 or 3 sections from 2 mice) ASO. Ube3a-YFP intensities were normalized by the average Ube3a-YFP intensity of PBS injected Ube3amYFP/p+ sections. Both Ube3a-as and Snord115 ASOs increased Ube3a-YFP levels in Ube3am+/pYFP mice, albeit did not reach statistical significance due to small sample sizes. The circle and triangle shapes of symbols represent two different mice with filled symbols for males and open symbols for female. Each symbol represents one brain section. Bar graphs are mean ± SEM. Nested one-way analysis of variance (ANOVA) with Tukey multiple comparison test for all pairs of groups. *p < 0.05, **p < 0.01, ***p < 0.001.
Figure 3 with 5 supplements
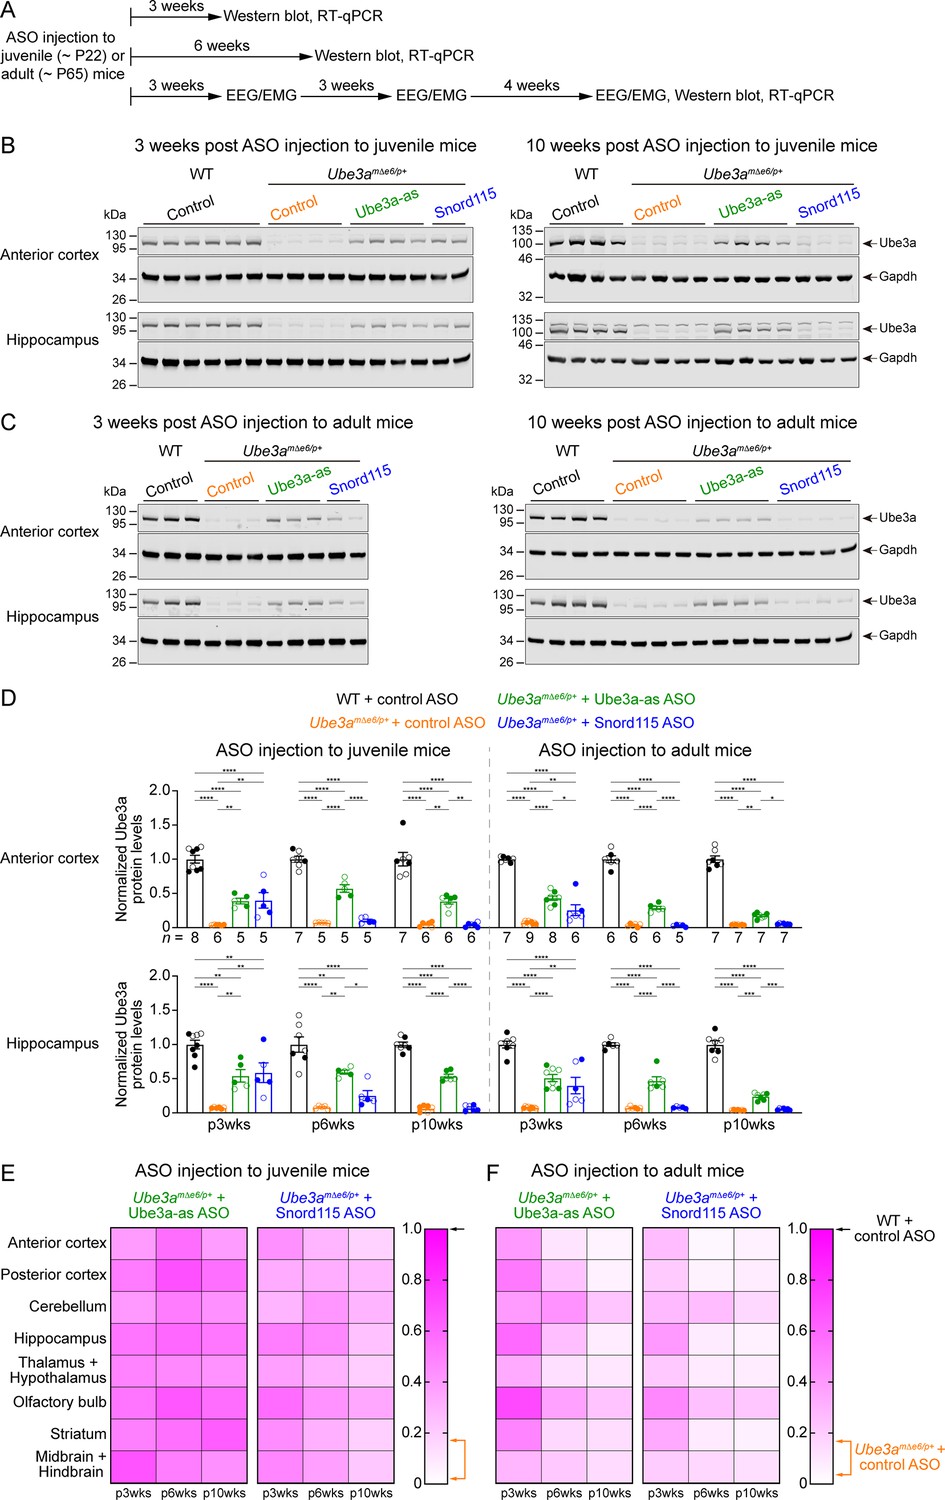
Antisense oligonucleotides (ASOs) targeting Ube3a-ATS upregulate Ube3a protein in Ube3amΔe6/p+ mice.
(A) Experimental designs and timelines. ASOs were injected into three cohorts of juvenile mice around postnatal day 22 (P22). Protein and RNA were measured from two cohorts of mice at 3 and 6 weeks post ASO injection. Electroencephalogram (EEG) and electromyogram (EMG) were measured from the third cohort of mice at 3, 6, and 10 weeks post ASO injection, and protein and RNA were measured after the last EEG/EMG recording. The same experiments were performed for three cohorts of adult mice injected with ASOs around P65. (B, C) ASOs were injected into juvenile (B) or adult (C) mice. Representative Western blots at 3 and 10 weeks post ASO injection from the anterior cortex and hippocampus of wild-type (WT) mice injected with control ASO and Ube3amΔe6/p+ mice with control, Ube3a-as, or Snord115 ASO. Gapdh, a housekeeping protein as loading control. (D) Summary data of normalized Ube3a protein levels from the anterior cortex (upper panel) and hippocampus (lower panel) at 3, 6, and 10 weeks post ASO injection indicated by p3wks, p6wks, and p10wks, respectively. Ube3a levels were first normalized by the Gapdh levels and then by the average Ube3a levels of all WT mice from the same blot. Ube3a levels are diminished in control ASO-treated Ube3amΔe6/p+ mice as compared to control ASO-treated WT mice. The upregulation of Ube3a protein by Ube3a-as ASO is evident up to 10 weeks post ASO injection, whereas the effect of Snord115 ASO diminishes over time. The numbers of tested mice are indicated in the figure. Each filled (male) or open (female) circle represents one mouse. Bar graphs are mean ± standard error of the mean (SEM). One-way analysis of variance (ANOVA) with Tukey multiple comparison test for all pairs of groups, *p < 0.05, **p < 0.01, ***p < 0.001, ****p < 0.0001. (E, F) Heat maps showing the normalized Ube3a protein levels from different brain regions of Ube3a-as or Snord115 ASO-treated juvenile (E) and adult (F) Ube3amΔe6/p+ mice at 3, 6, and 10 weeks post ASO injection. In the color scales, 1 represents the Ube3a levels in control ASO-treated WT mice for each brain region (black arrows), and the orange arrows indicate the range of Ube3a levels in control ASO-treated Ube3amΔe6/p+ mice.
-
Figure 3—source data 1
Raw images of the Western blots in Figure 3B.
The dashed boxes indicate the areas of blots presented in the figure.
- https://cdn.elifesciences.org/articles/81892/elife-81892-fig3-data1-v3.zip
-
Figure 3—source data 2
Raw images of the Western blots in Figure 3C.
The dashed boxes indicate the areas of blots presented in the figure.
- https://cdn.elifesciences.org/articles/81892/elife-81892-fig3-data2-v3.zip
Figure 3—figure supplement 1
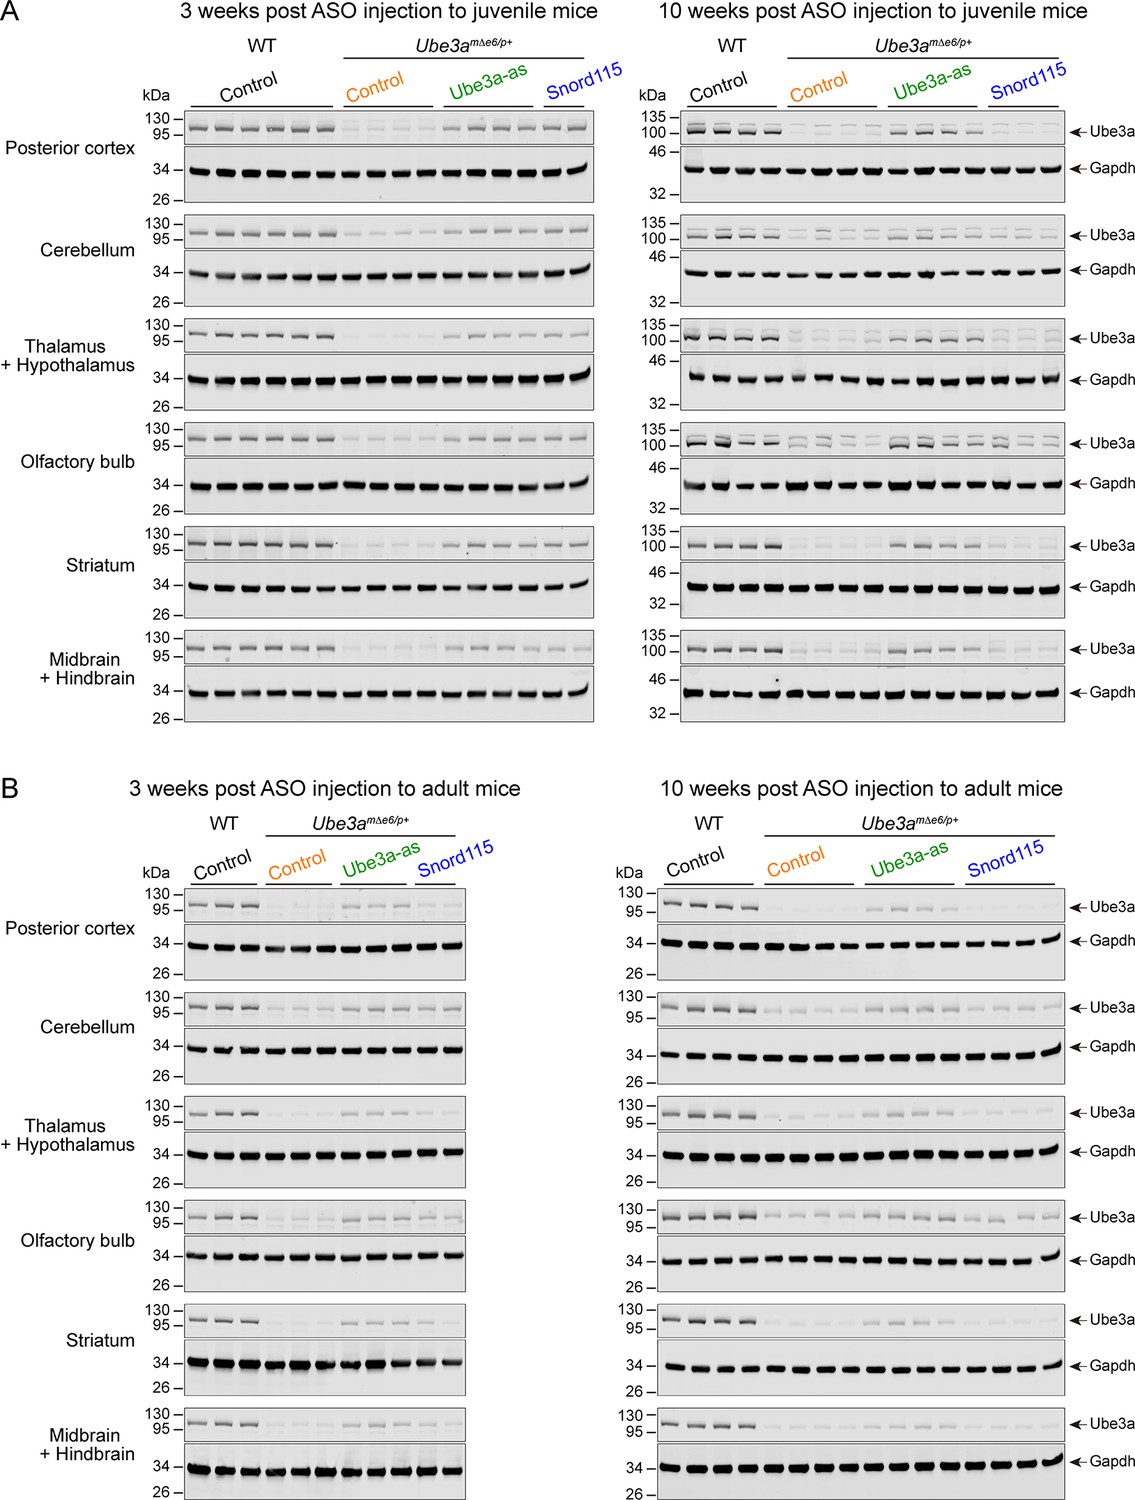
Antisense oligonucleotides (ASOs) targeting Ube3a-ATS upregulate Ube3a protein in different brain regions of Ube3amΔe6/p+ mice (Part I).
(A, B) ASOs were injected into juvenile (A) or adult (B) wild-type (WT) and Ube3amΔe6/p+ mice. Representative Western blots at 3 and 10 weeks post ASO injection from different brain regions as indicated in the figure.
-
Figure 3—figure supplement 1—source data 1
Raw images of the Western blots in Figure 3—figure supplement 1A, left panels.
The dashed boxes indicate the areas of blots presented in the figure.
- https://cdn.elifesciences.org/articles/81892/elife-81892-fig3-figsupp1-data1-v3.zip
-
Figure 3—figure supplement 1—source data 2
Raw images of the Western blots in Figure 3—figure supplement 1A, right panels.
The dashed boxes indicate the areas of blots presented in the figure.
- https://cdn.elifesciences.org/articles/81892/elife-81892-fig3-figsupp1-data2-v3.zip
-
Figure 3—figure supplement 1—source data 3
Raw images of the Western blots in Figure 3—figure supplement 1B, left panels.
The dashed boxes indicate the areas of blots presented in the figure.
- https://cdn.elifesciences.org/articles/81892/elife-81892-fig3-figsupp1-data3-v3.zip
-
Figure 3—figure supplement 1—source data 4
Raw images of the Western blots in Figure 3—figure supplement 1B, right panels.
The dashed boxes indicate the areas of blots presented in the figure.
- https://cdn.elifesciences.org/articles/81892/elife-81892-fig3-figsupp1-data4-v3.zip
Figure 3—figure supplement 2
Antisense oligonucleotides (ASOs) targeting Ube3a-ATS upregulate Ube3a protein in different brain regions of Ube3amΔe6/p+ mice (Part II).
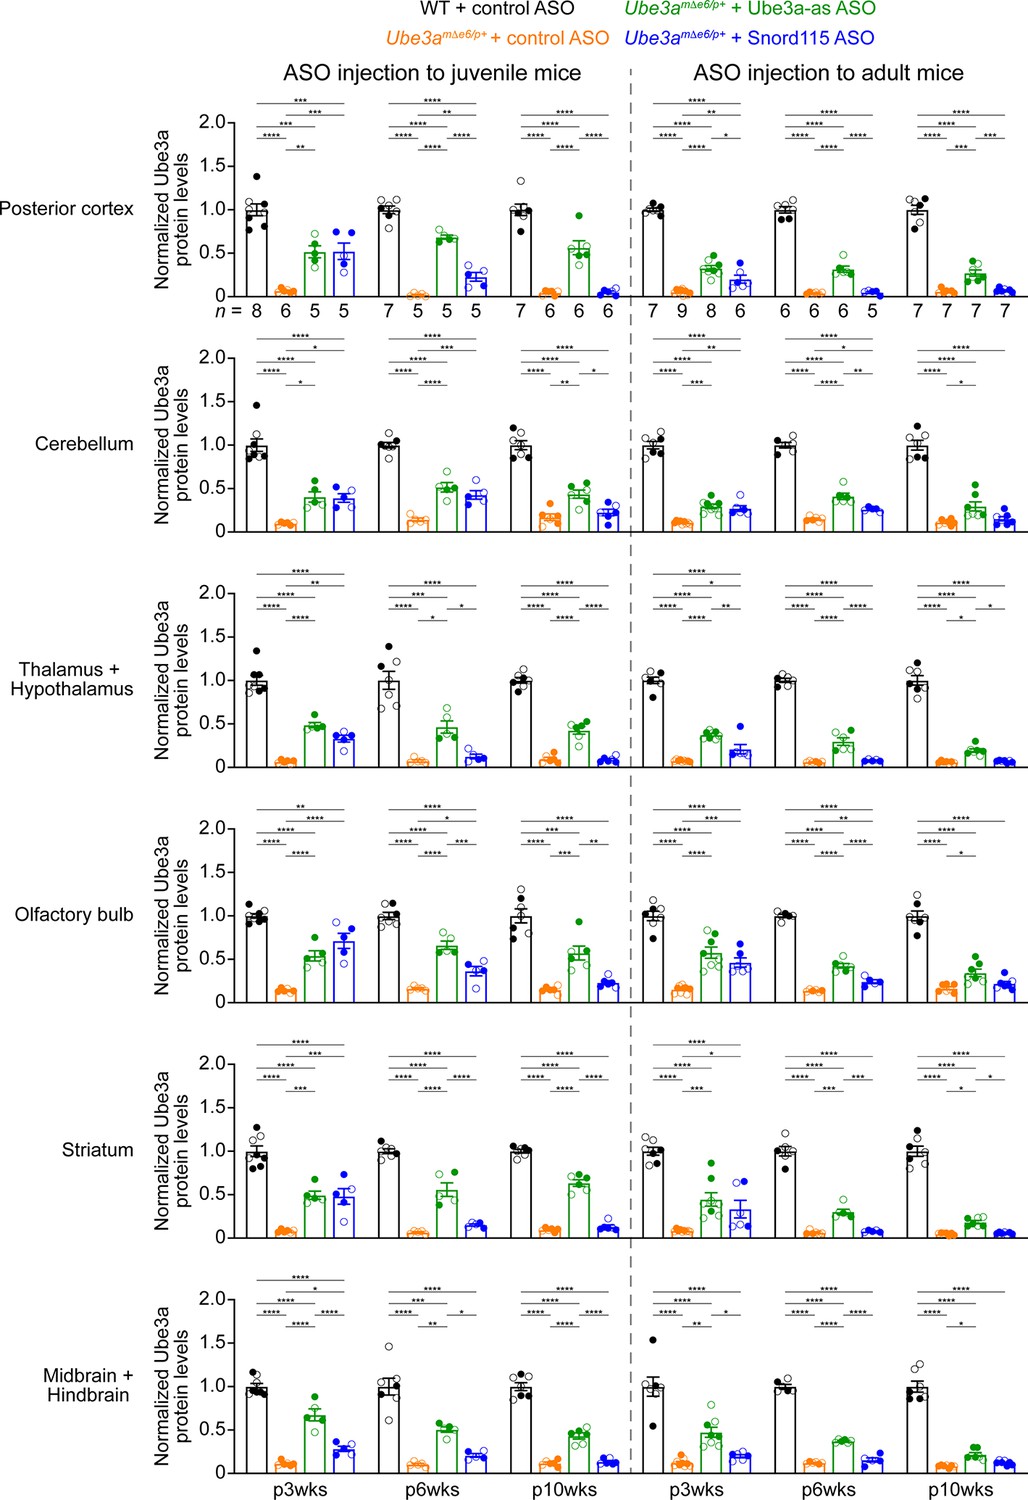
Summary data of normalized Ube3a protein levels from different brain regions at 3, 6, and 10 weeks post ASO injection indicated by p3wks, p6wks, and p10wks, respectively. Ube3a levels were first normalized by the Gapdh levels and then by the average Ube3a levels of all wild-type (WT) mice from the same blot. Ube3a levels are diminished in all brain regions of control ASO-treated Ube3amΔe6/p+ mice as compared to control ASO-treated WT mice. The upregulation of Ube3a protein by Ube3a-as ASO is evident up to 10 weeks post ASO injection, whereas the effect of Snord115 ASO diminishes over time. The numbers of tested mice are indicated in the figure. Each filled (male) or open (female) circle represents one mouse. Bar graphs are mean ± standard error of the mean (SEM). One-way analysis of variance (ANOVA) with Tukey multiple comparison test for all pairs of groups, *p < 0.05, **p < 0.01, ***p < 0.001, ****p < 0.0001.
Figure 3—figure supplement 3
Ube3a isoforms 2 and 3 are similarly upregulated by Ube3a-ATS-targeted antisense oligonucleotides (ASOs) in juvenile Ube3amΔe6/p+ mice.
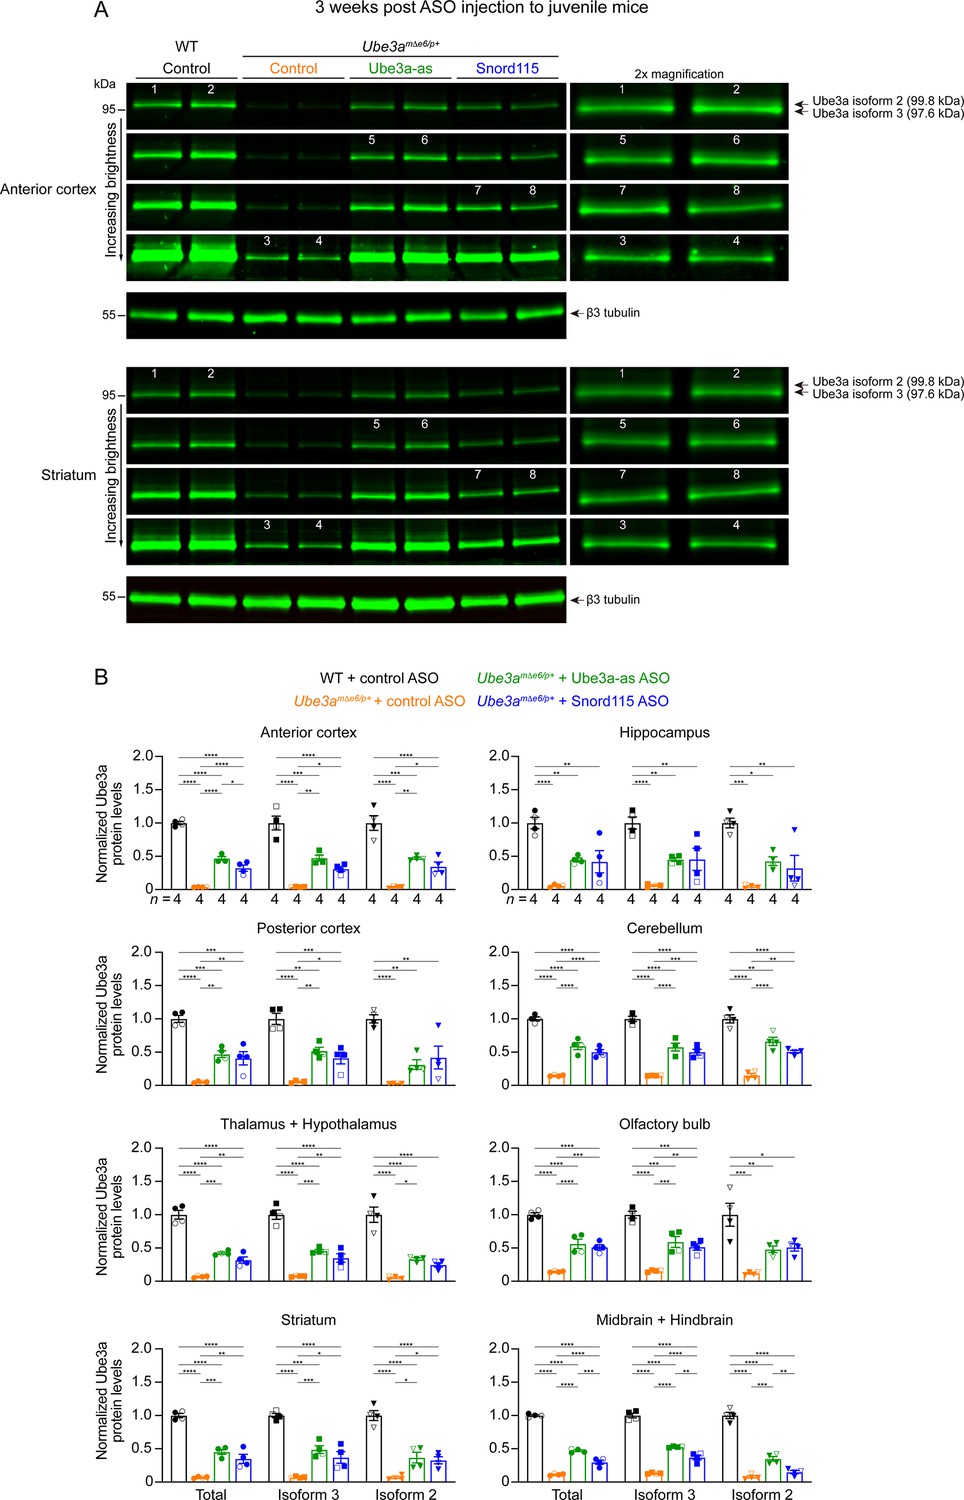
(A) ASOs were injected into juvenile wild-type (WT) and Ube3amΔe6/p+ mice. Representative Western blots for the anterior cortex and striatum at 3 weeks post ASO injection. To visualize the two Ube3a isoforms (isoform 2, 99.8 kDa; isoform 3, 97.6 kDa) in different groups, the same blot images were adjusted to four different levels of brightness. Selected bands were also magnified by two times and presented on the right. β3 tubulin, a housekeeping protein as loading control. (B) Summary data of normalized Ube3a protein levels at 3 weeks post ASO injection to juvenile mice from different brain regions. Total Ube3a and Ube3a isoform 3 levels were first normalized by the β3 tubulin levels and then by the average total Ube3a and Ube3a isoform 3 levels of all WT mice from the same blot, respectively. Ube3a isoform 2 levels were measured by subtracting the Ube3a isoform 3 levels from the total Ube3a levels. Both Ube3a isoforms 2 and 3 were similarly upregulated by Ube3a-as or Snord115 ASO in Ube3amΔe6/p+ mice. The numbers of tested mice are indicated in the figure. Each filled (male) or open (female) circle (total Ube3a), square (Ube3a isoform 3), triangle (Ube3a isoform 2) represents one mouse. Bar graphs are mean ± standard error of the mean (SEM). One-way analysis of variance (ANOVA) with Tukey multiple comparison test for all pairs of groups. *p < 0.05, **p < 0.01, ***p < 0.001, ****p < 0.0001.
-
Figure 3—figure supplement 3—source data 1
Raw images of the Western blots in Figure 3—figure supplement 3A, upper panels.
The dashed boxes indicate the areas of blots presented in the figure.
- https://cdn.elifesciences.org/articles/81892/elife-81892-fig3-figsupp3-data1-v3.zip
-
Figure 3—figure supplement 3—source data 2
Raw images of the Western blots in Figure 3—figure supplement 3A, lower panels.
The dashed boxes indicate the areas of blots presented in the figure.
- https://cdn.elifesciences.org/articles/81892/elife-81892-fig3-figsupp3-data2-v3.zip
Figure 3—figure supplement 4
Ube3a isoforms 2 and 3 are similarly upregulated by Ube3a-ATS-targeted antisense oligonucleotides (ASOs) in adult Ube3amΔe6/p+ mice.
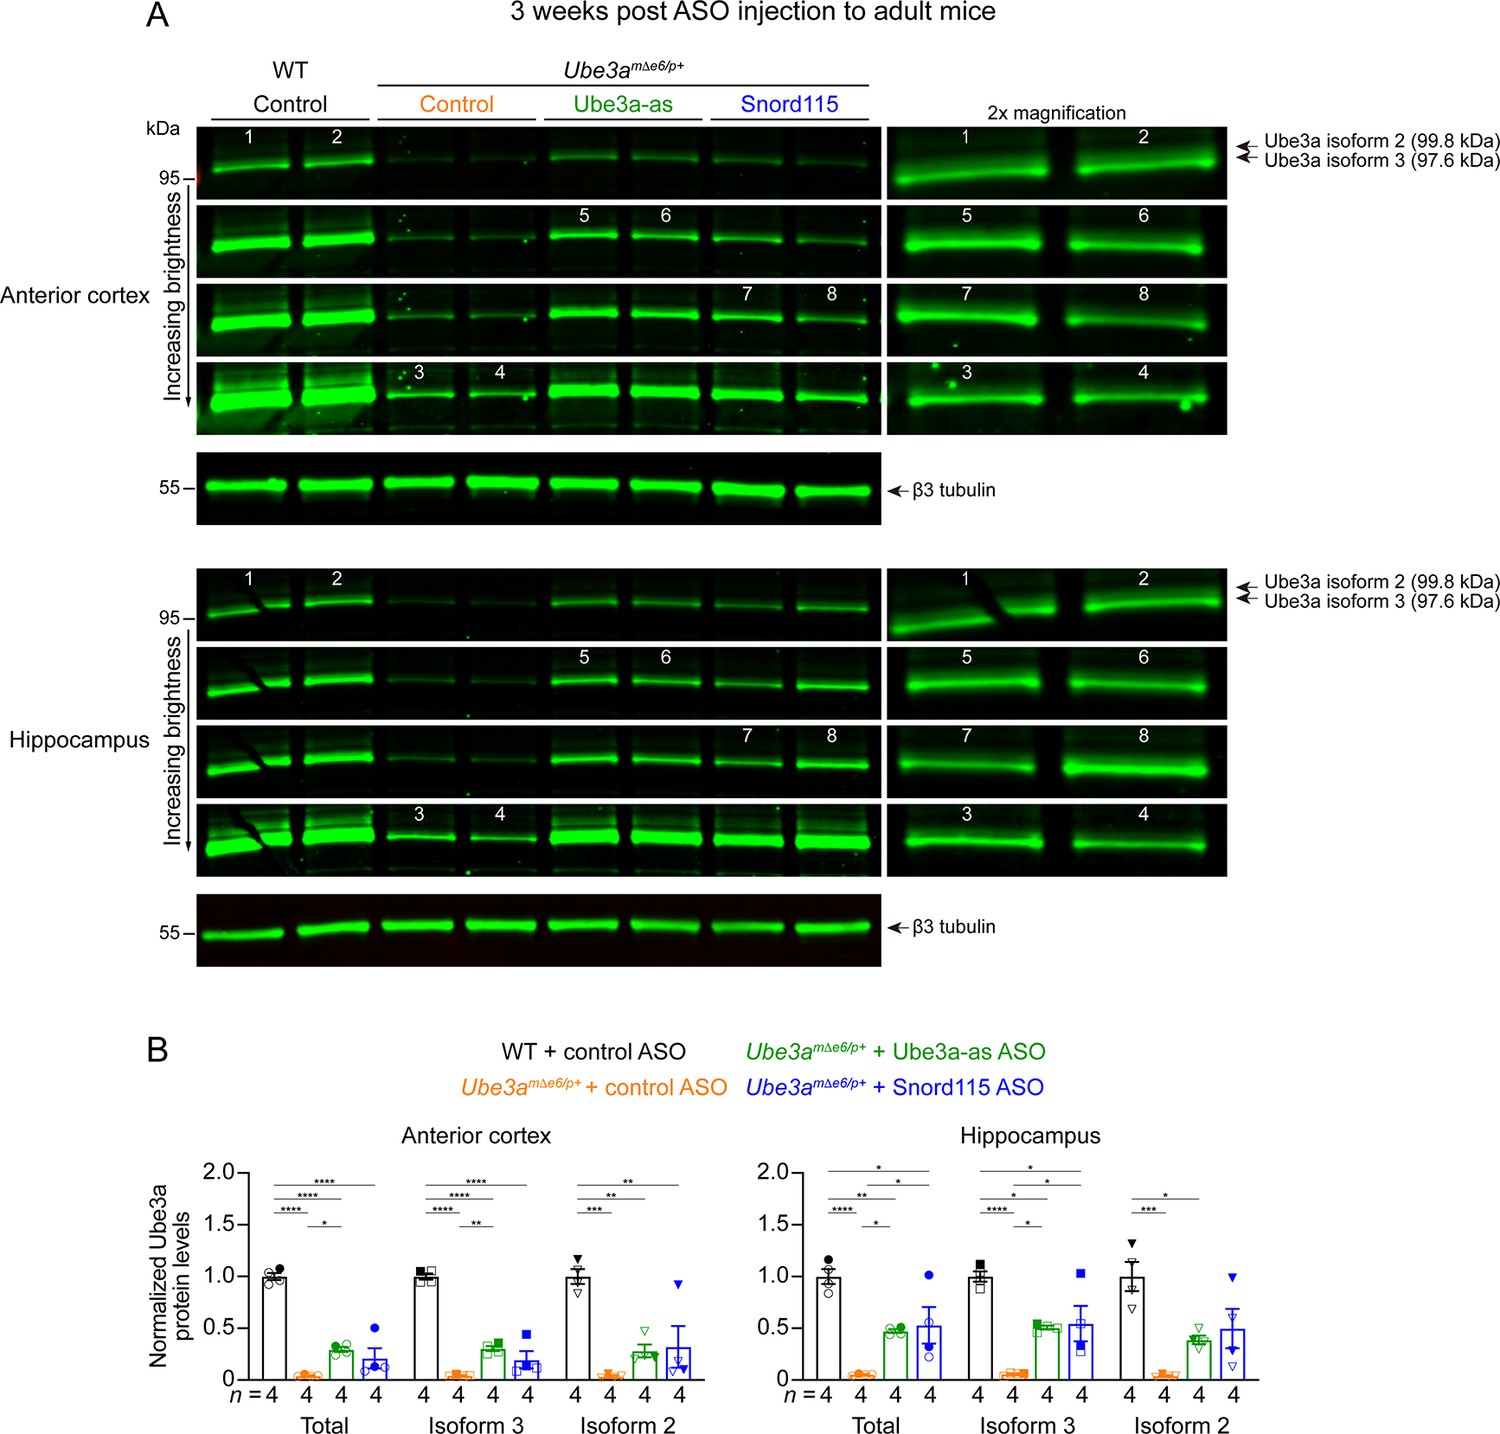
(A) ASOs were injected into adult wild-type (WT) and Ube3amΔe6/p+ mice. Representative Western blots for the anterior cortex and hippocampus at 3 weeks post ASO injection. To visualize the two Ube3a isoforms (isoform 2, 99.8 kDa; isoform 3, 97.6 kDa) in different groups, the same blot images were adjusted to four different levels of brightness. Selected bands were also magnified by two times and presented on the right. β3 tubulin, a housekeeping protein as loading control. (B) Summary data of normalized Ube3a protein levels at 3 weeks post ASO injection to adult mice from the anterior cortex and hippocampus. Total Ube3a and Ube3a isoform 3 levels were first normalized by the β3 tubulin levels and then by the average total Ube3a and Ube3a isoform 3 levels of all WT mice from the same blot, respectively. Ube3a isoform 2 levels were measured by subtracting the Ube3a isoform 3 levels from the total Ube3a levels. Both Ube3a isoforms 2 and 3 were similarly upregulated by Ube3a-as or Snord115 ASO in Ube3amΔe6/p+ mice. The numbers of tested mice are indicated in the figure. Each filled (male) or open (female) circle (total Ube3a), square (Ube3a isoform 3), triangle (Ube3a isoform 2) represents one mouse. Bar graphs are mean ± standard error of the mean (SEM). One-way analysis of variance (ANOVA) with Tukey multiple comparison test for all pairs of groups. *p < 0.05, **p < 0.01, ***p < 0.001, ****p < 0.0001.
-
Figure 3—figure supplement 4—source data 1
Raw images of the Western blots in Figure 3—figure supplement 4A, upper panels.
The dashed boxes indicate the areas of blots presented in the figure.
- https://cdn.elifesciences.org/articles/81892/elife-81892-fig3-figsupp4-data1-v3.zip
-
Figure 3—figure supplement 4—source data 2
Raw images of the Western blots in Figure 3—figure supplement 4A, lower panels.
The dashed boxes indicate the areas of blots presented in the figure.
- https://cdn.elifesciences.org/articles/81892/elife-81892-fig3-figsupp4-data2-v3.zip
Figure 3—figure supplement 5
Similar increase of Ube3a protein by two different doses of antisense oligonucleotides (ASOs) in Ube3amΔe6/p+ mice.
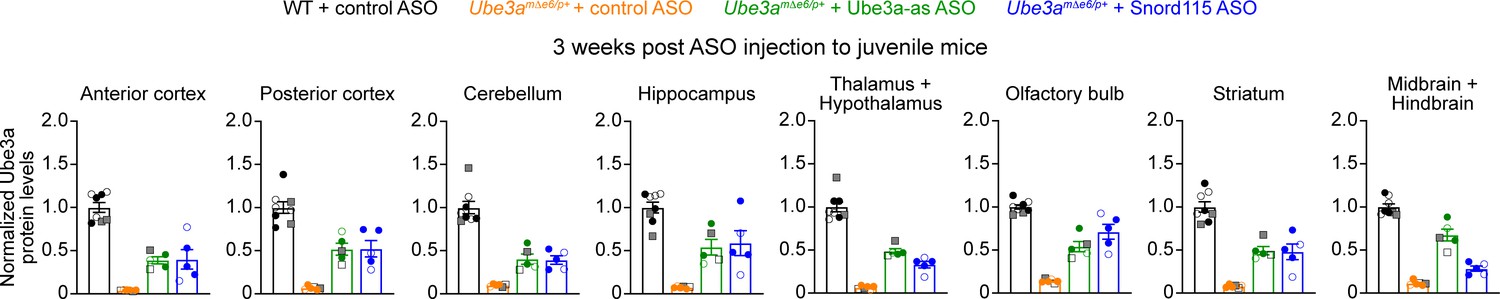
The same summary data presented in Figure 3D and Figure 3—figure supplement 2 for the normalized Ube3a protein levels from 3 weeks post ASO injection into juvenile mice. The filled (male) and open (female) squares represent two wild-type (WT) and two Ube3amΔe6/p+ mice injected with 250 µg control ASO and 2 Ube3amΔe6/p+ mice with 250 µg Ube3a-as ASO. The filled (male) and open (female) circles represent the rest of mice injected with 500 µg ASOs. Note the similar Ube3a levels in Ube3amΔe6/p+ mice injected with 250 or 500 µg Ube3a-as ASO.
Figure 4 with 2 supplements
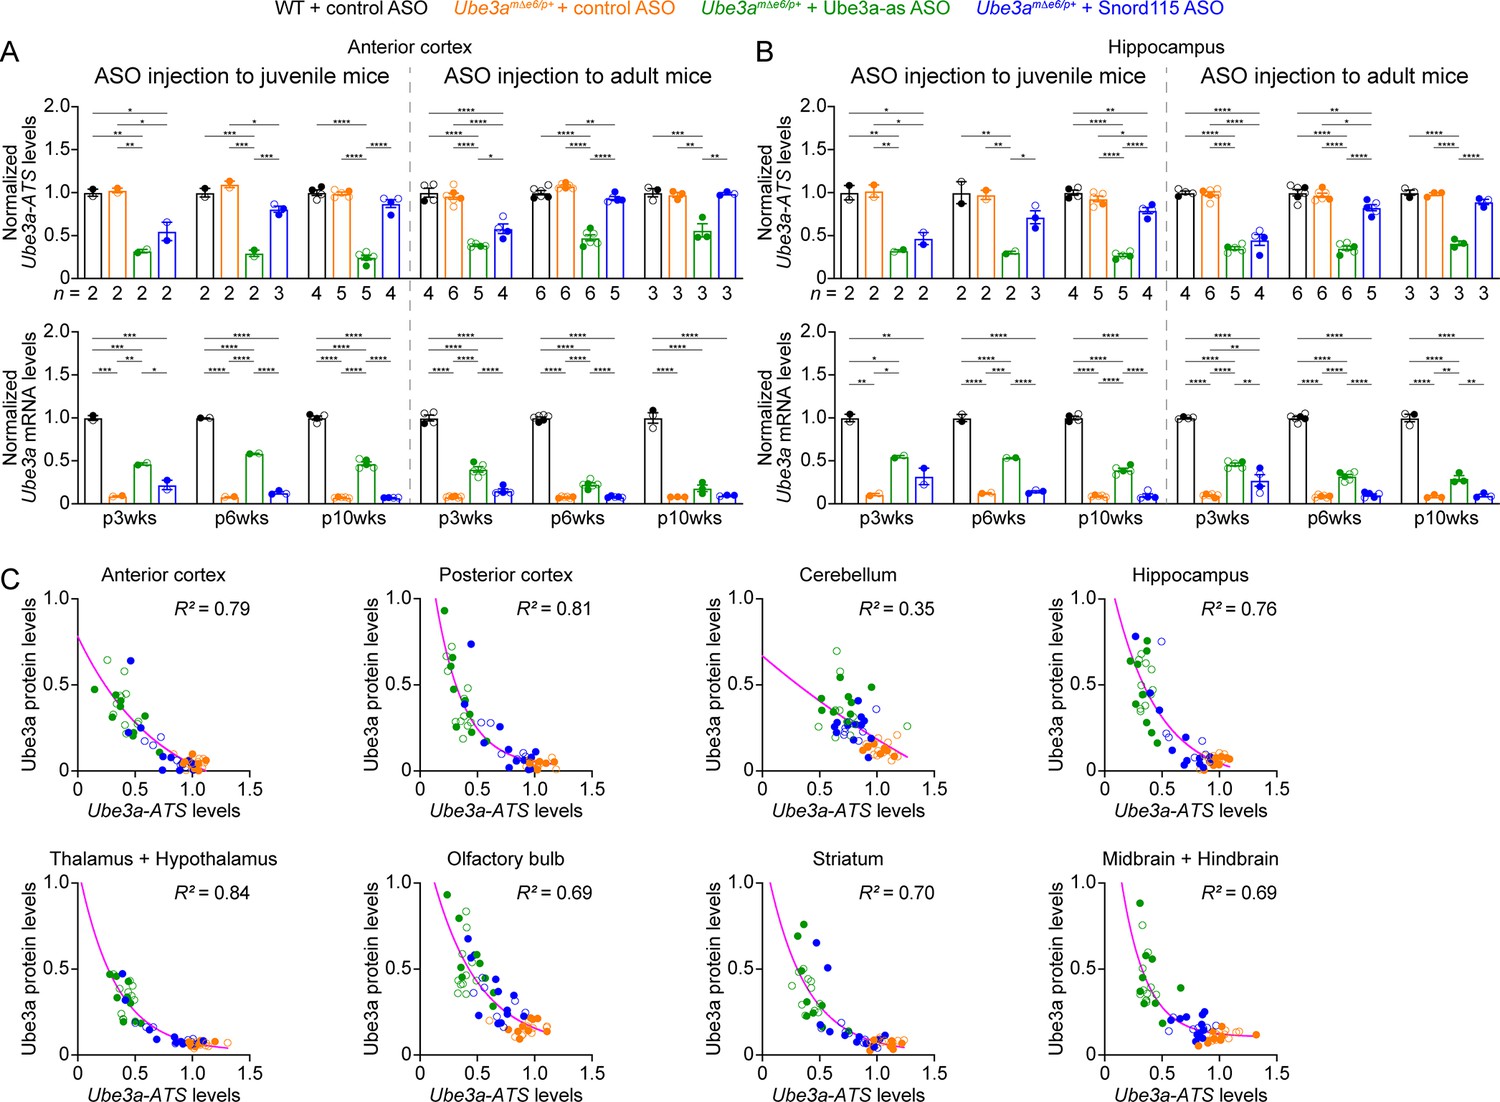
Antisense oligonucleotides (ASOs) targeting Ube3a-ATS reduce Ube3a-ATS and increase Ube3a transcripts in Ube3amΔe6/p+ mice.
(A, B) Juvenile or adult wild-type (WT) mice were injected with control ASO and Ube3amΔe6/p+ mice with control, Ube3a-as, or Snord115 ASO. Summary data show the normalized Ube3a-ATS (upper panels) and Ube3a (lower panels) transcript levels from the anterior cortex (A) and hippocampus (B) at 3, 6, and 10 weeks post ASO injection indicated by p3wks, p6wks, and p10wks, respectively. Ube3a-ATS and Ube3a mRNA levels were first normalized by the Gapdh levels and then by the average Ube3a-ATS and Ube3a mRNA levels of all WT mice, respectively. The downregulation of Ube3a-ATS and upregulation of Ube3a mRNA by Ube3a-as ASO are evident up to 10 weeks post ASO injection, whereas the effect of Snord115 ASO diminishes over time. The numbers of tested mice are indicated in the figure. Bar graphs are mean ± standard error of the mean (SEM). One-way analysis of variance (ANOVA) with Tukey multiple comparison test for all pairs of groups, *p < 0.05, **p < 0.01, ***p < 0.001, ****p < 0.0001. (C) The negative correlations between Ube3a-ATS transcript levels and Ube3a protein levels from different brain regions of Ube3amΔe6/p+ mice injected with control, Ube3a-as, or Snord115 ASO were fitted with a one phase exponential decay (; X, Ube3a-ATS transcript levels; Y, Ube3a protein levels; a, b, k, constants). Data from 3, 6, and 10 weeks post ASO injection into juvenile and adult mice were all included. Each filled (male) or open (female) circle represents one mouse. R2 indicates the goodness of fit.
Figure 4—figure supplement 1
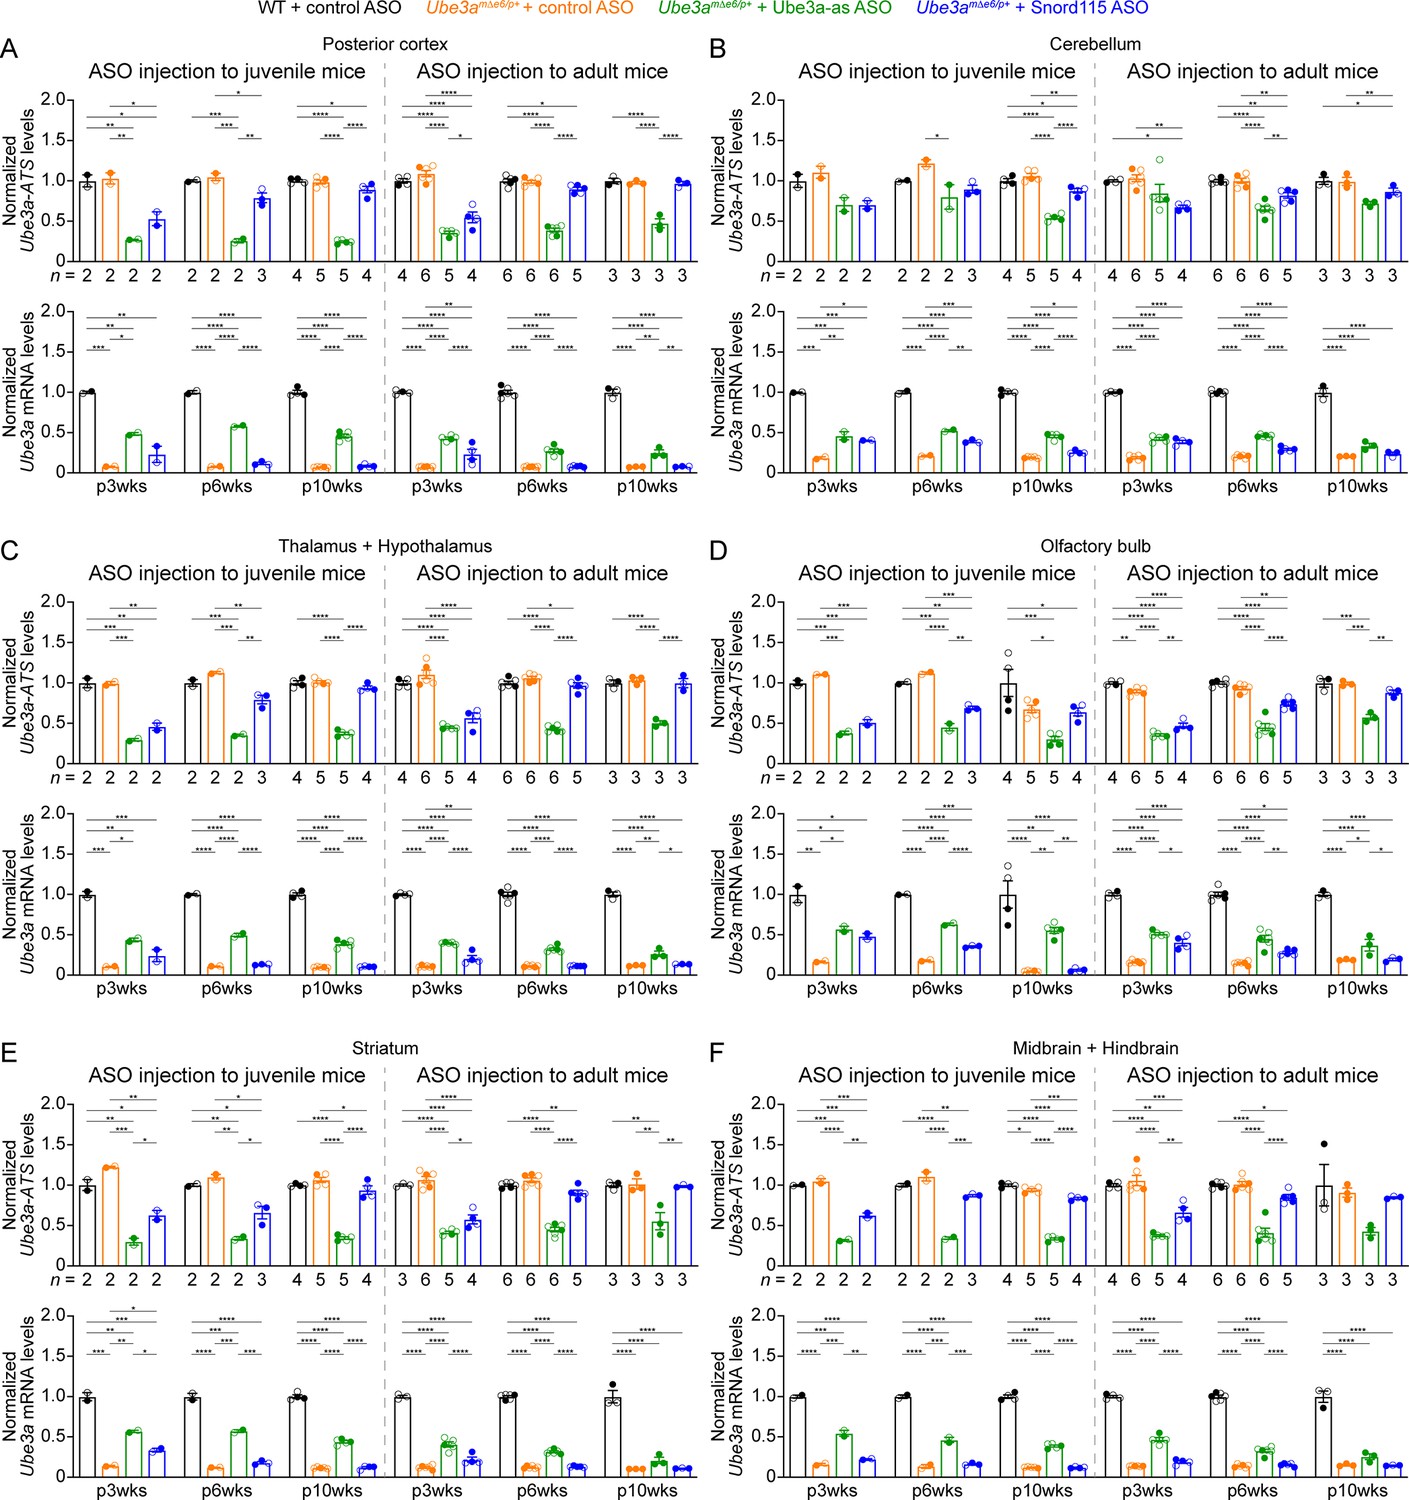
Antisense oligonucleotides (ASOs) targeting Ube3a-ATS reduce Ube3a-ATS and increase Ube3a transcripts in different brain regions of Ube3amΔe6/p+ mice (Part I).
(A–F) Juvenile or adult wild-type (WT) mice were injected with control ASO and Ube3amΔe6/p+ mice with control, Ube3a-as, or Snord115 ASO. Summary data from different brain regions show the normalized Ube3a-ATS (upper panels) and Ube3a (lower panels) transcript levels at 3, 6, and 10 weeks post ASO injection indicated by p3wks, p6wks, and p10wks, respectively. Ube3a-ATS and Ube3a mRNA levels were first normalized by the Gapdh levels and then by the average Ube3a-ATS and Ube3a mRNA levels of all WT mice, respectively. The downregulation of Ube3a-ATS and upregulation of Ube3a mRNA by Ube3a-as ASO are evident in different brain regions up to 10 weeks post ASO injection, whereas the effect of Snord115 ASO diminishes over time. The numbers of tested mice are indicated in the figure. Each filled (male) or open (female) circle represents one mouse. Bar graphs are mean ± standard error of the mean (SEM). One-way analysis of variance (ANOVA) with Tukey multiple comparison test for all pairs of groups, *p < 0.05, **p < 0.01, ***p < 0.001, ****p < 0.0001.
Figure 4—figure supplement 2

Antisense oligonucleotides (ASOs) targeting Ube3a-ATS reduce Ube3a-ATS and increase Ube3a transcripts in different brain regions of Ube3amΔe6/p+ mice (Part II).
(A) The negative correlations between Ube3a-ATS transcript levels and Ube3a mRNA levels from different brain regions of Ube3amΔe6/p+ mice injected with control, Ube3a-as, or Snord115 ASO were fitted with a one phase exponential decay (; X, Ube3a-ATS transcript levels; Y, Ube3a mRNA levels; a, b, k, constants). (B) The positive correlations between Ube3a mRNA levels and Ube3a protein levels from different brain regions of wild-type (WT) mice injected with control ASO and Ube3amΔe6/p+ mice with control, Ube3a-as, or Snord115 ASO were fitted with a linear regression ( X, Ube3a mRNA levels; Y, Ube3a protein levels; a, b, constants). Data from 3, 6, and 10 weeks post ASO injection into juvenile and adult mice were all included. Each filled (male) or open (female) circle represents one mouse. R2 indicates the goodness of fit. p < 0.05 indicates a significant deviation of slope from zero.
Figure 5 with 4 supplements
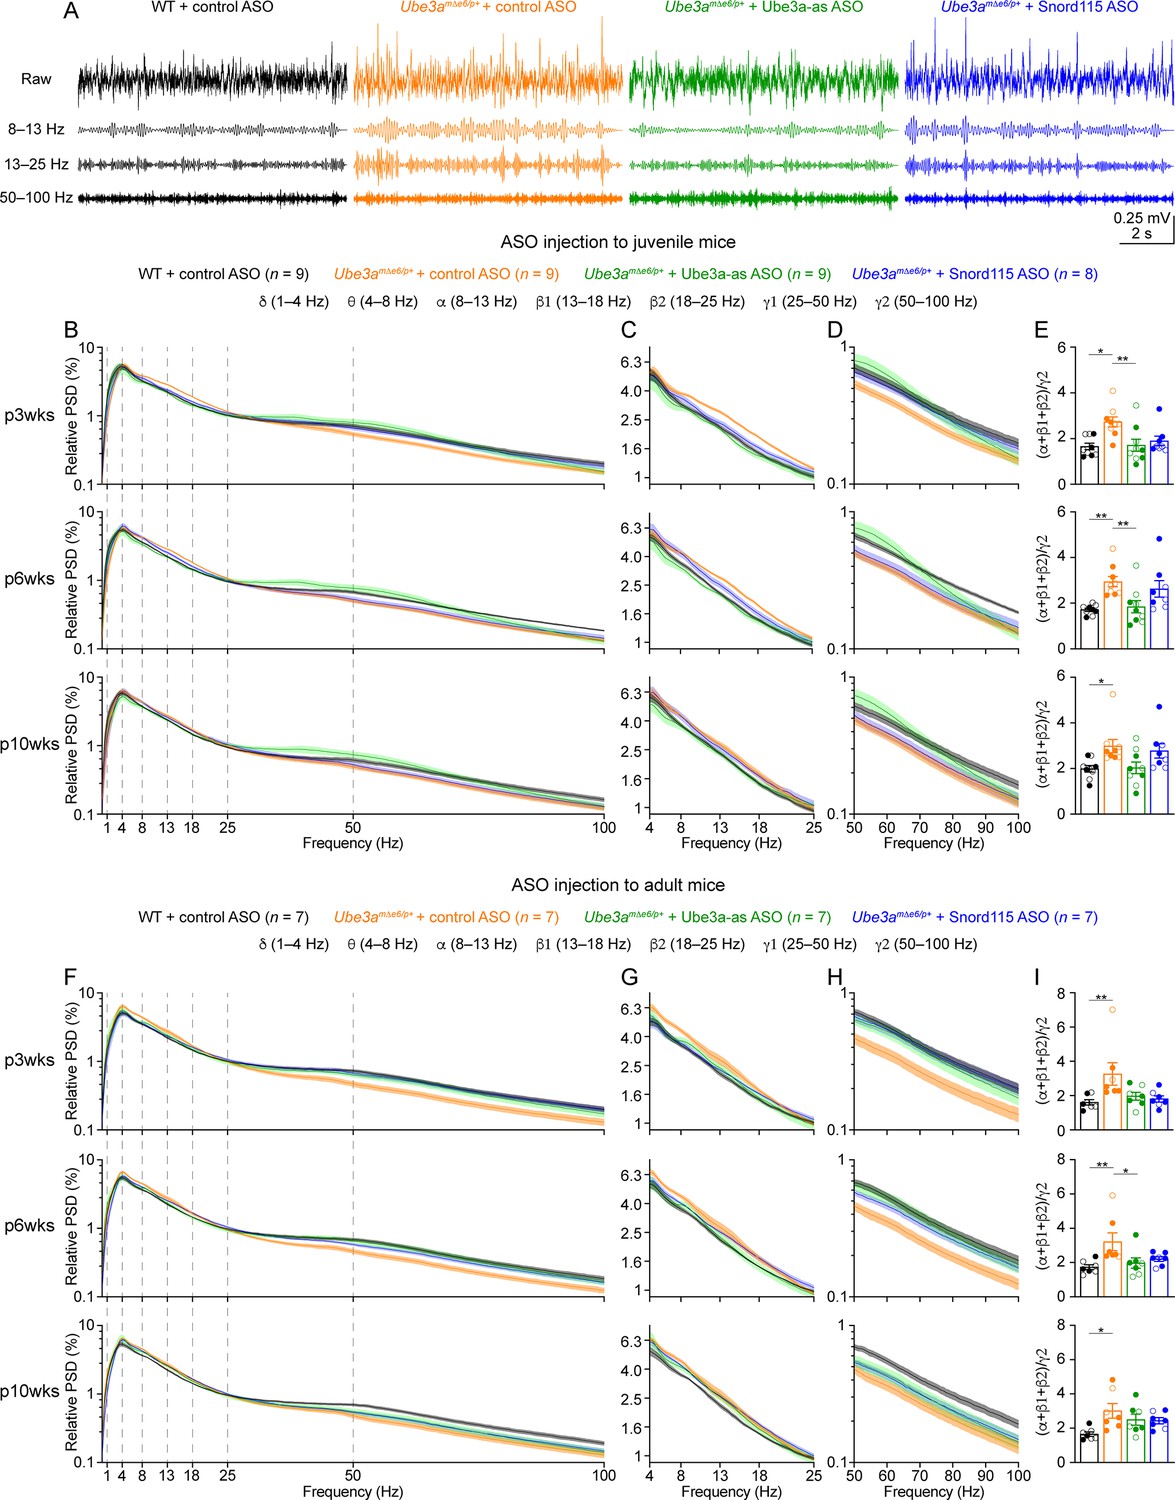
Reactivation of paternal Ube3a rescues abnormal electroencephalogram (EEG) rhythms in Ube3amΔe6/p+ mice.
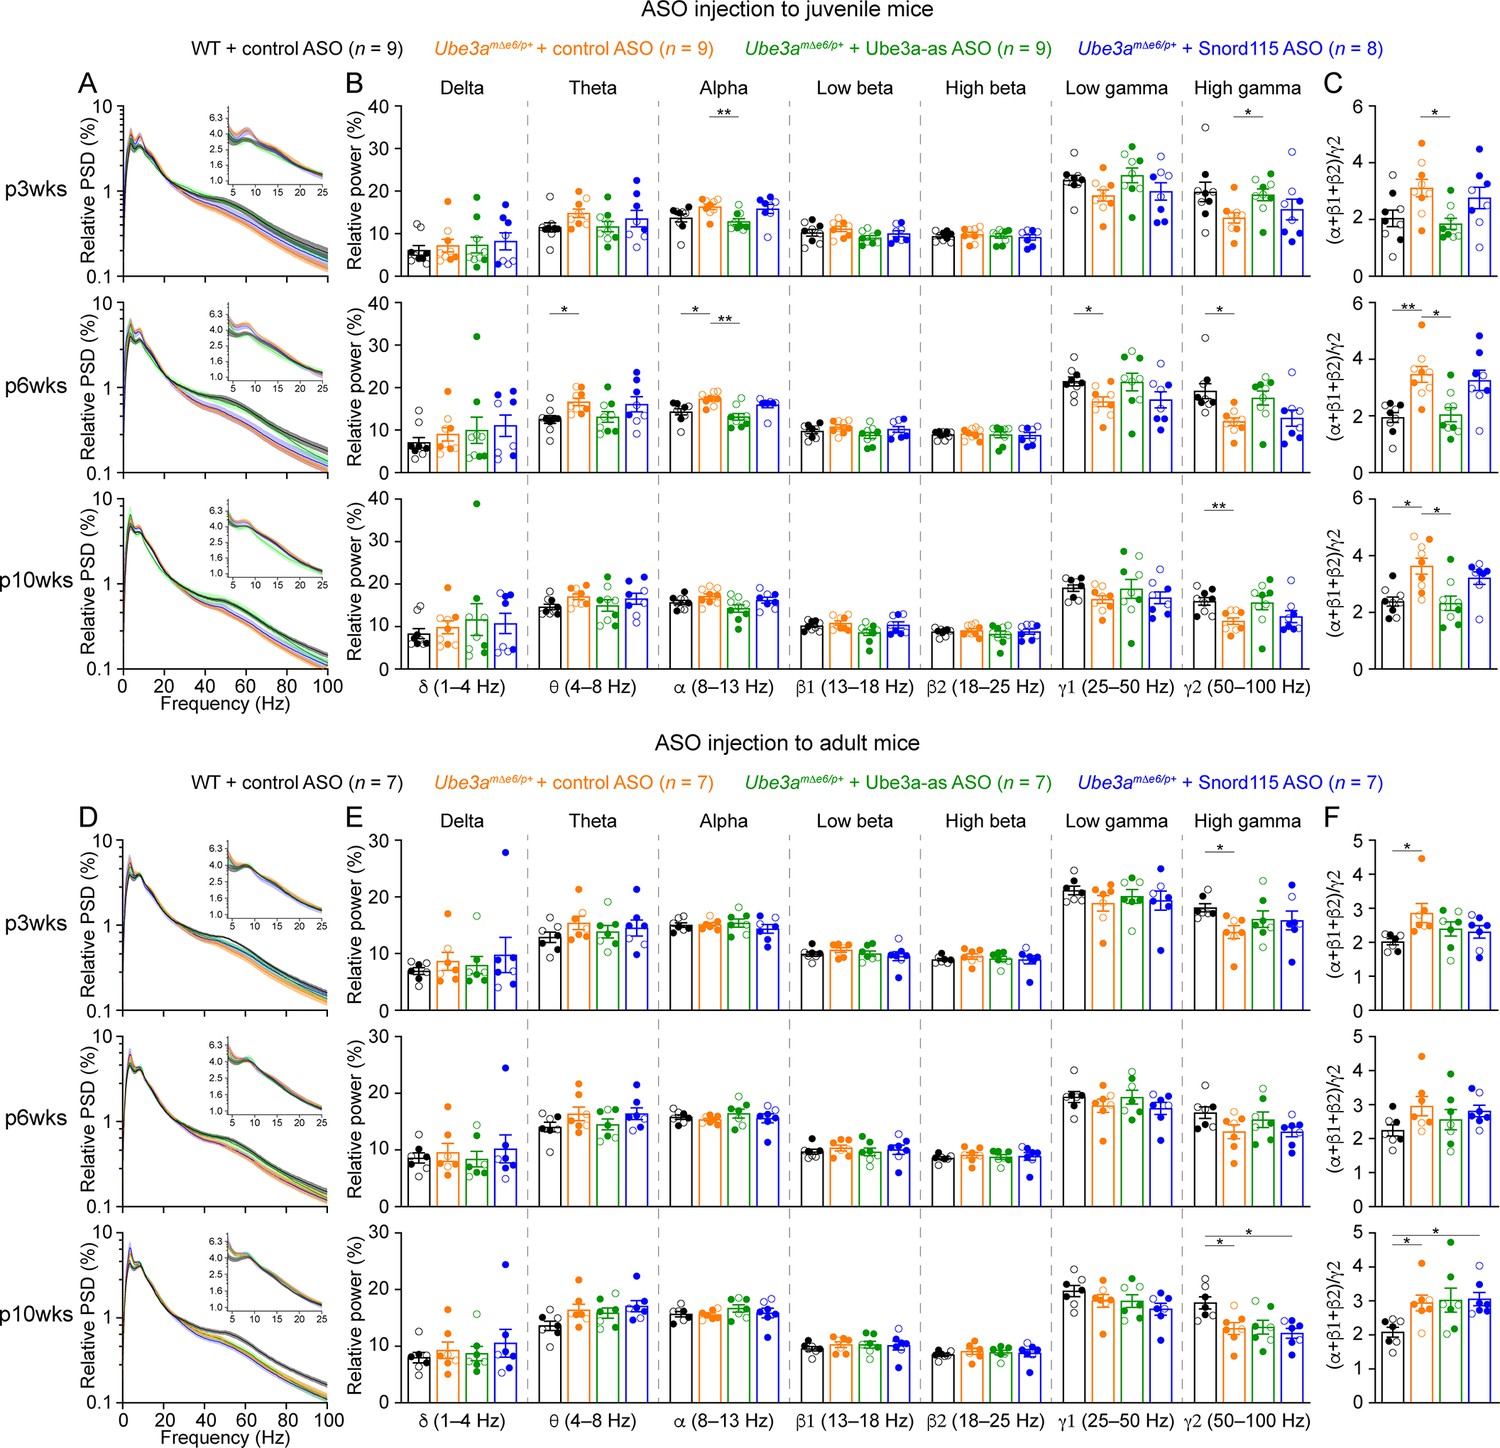
(A) Juvenile wild-type (WT) mice were injected with control antisense oligonucleotide (ASO) and Ube3amΔe6/p+ mice with control, Ube3a-as, or Snord115 ASO. Representative raw EEG traces and their band-pass filtered traces from the left frontal cortices at 6 weeks post ASO injection. (B–D) Relative EEG power spectral density (PSD) curves from the left front cortices at 3, 6, and 10 weeks post ASO injection indicated by p3wks, p6wks, and p10wks, respectively. The dashed lines indicate different frequency bands (B). The expanded theta (θ)–high beta (β2) and high gamma (γ2) bands are shown in (C) and (D). Lines and shades are mean and standard error of the mean (SEM), respectively. Control ASO-treated Ube3amΔe6/p+ mice show an increase of power in the 8–25 Hz range and a decrease of power in the 50–100 Hz range as compared to control ASO-treated WT mice. Ube3a-as ASO reduces the power in 8–25 Hz and increases the power in 50–100 Hz in Ube3amΔe6/p+ mice. Snord115 ASO has a similar effect in Ube3amΔe6/p+ mice at 3 weeks post ASO injection. See Figure 5—figure supplement 2 for statistical comparisons. (E) Summary data show the ratio of power in 8–25 over 50–100 Hz. Control ASO-treated Ube3amΔe6/p+ mice show a higher ratio than control ASO-treated WT mice. Ube3a-as ASO reduces the ratio in Ube3amΔe6/p+ mice. Snord115 ASO has a similar effect at 3 weeks post ASO injection. (F–I) Similar to (B–E), but for ASO injection into adult mice. Note, Ube3a-as ASO reduces the ratio of power in 8–25 Hz over 50–100 Hz in Ube3amΔe6/p+ mice. The numbers of tested mice are indicated in the figure. Each filled (male) or open (female) circle represents one mouse. Bar graphs are mean ± SEM. Kruskal–Wallis test with Dunn’s multiple comparison test (E, I) for all pairs of groups, *p < 0.05, **p < 0.01.
Figure 5—figure supplement 1
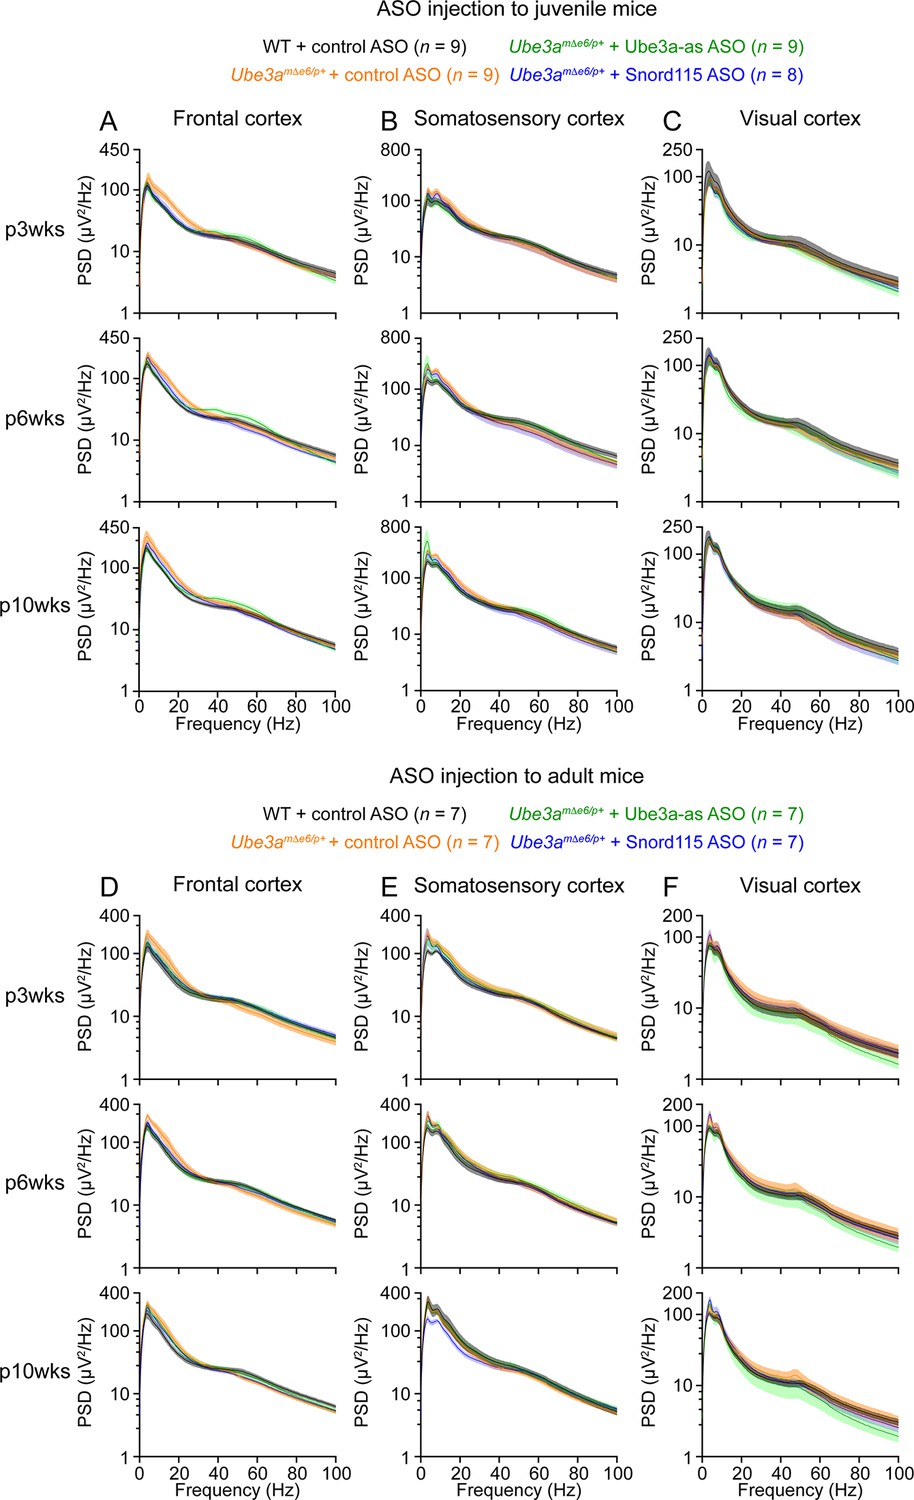
Absolute power spectral densities (PSDs) of electroencephalogram (EEG) signals from different brain regions.
(A–C) EEG PSD curves from the left front cortices (A), left somatosensory cortices (B), and right visual cortices (C) at 3, 6, and 10 weeks post antisense oligonucleotide (ASO) injection into juvenile mice. (D–F) Similar to (A–C), but for ASO injection into adult mice. The numbers of tested mice are indicated in the figure. Lines and shades are mean and standard error of the mean (SEM), respectively.
Figure 5—figure supplement 2
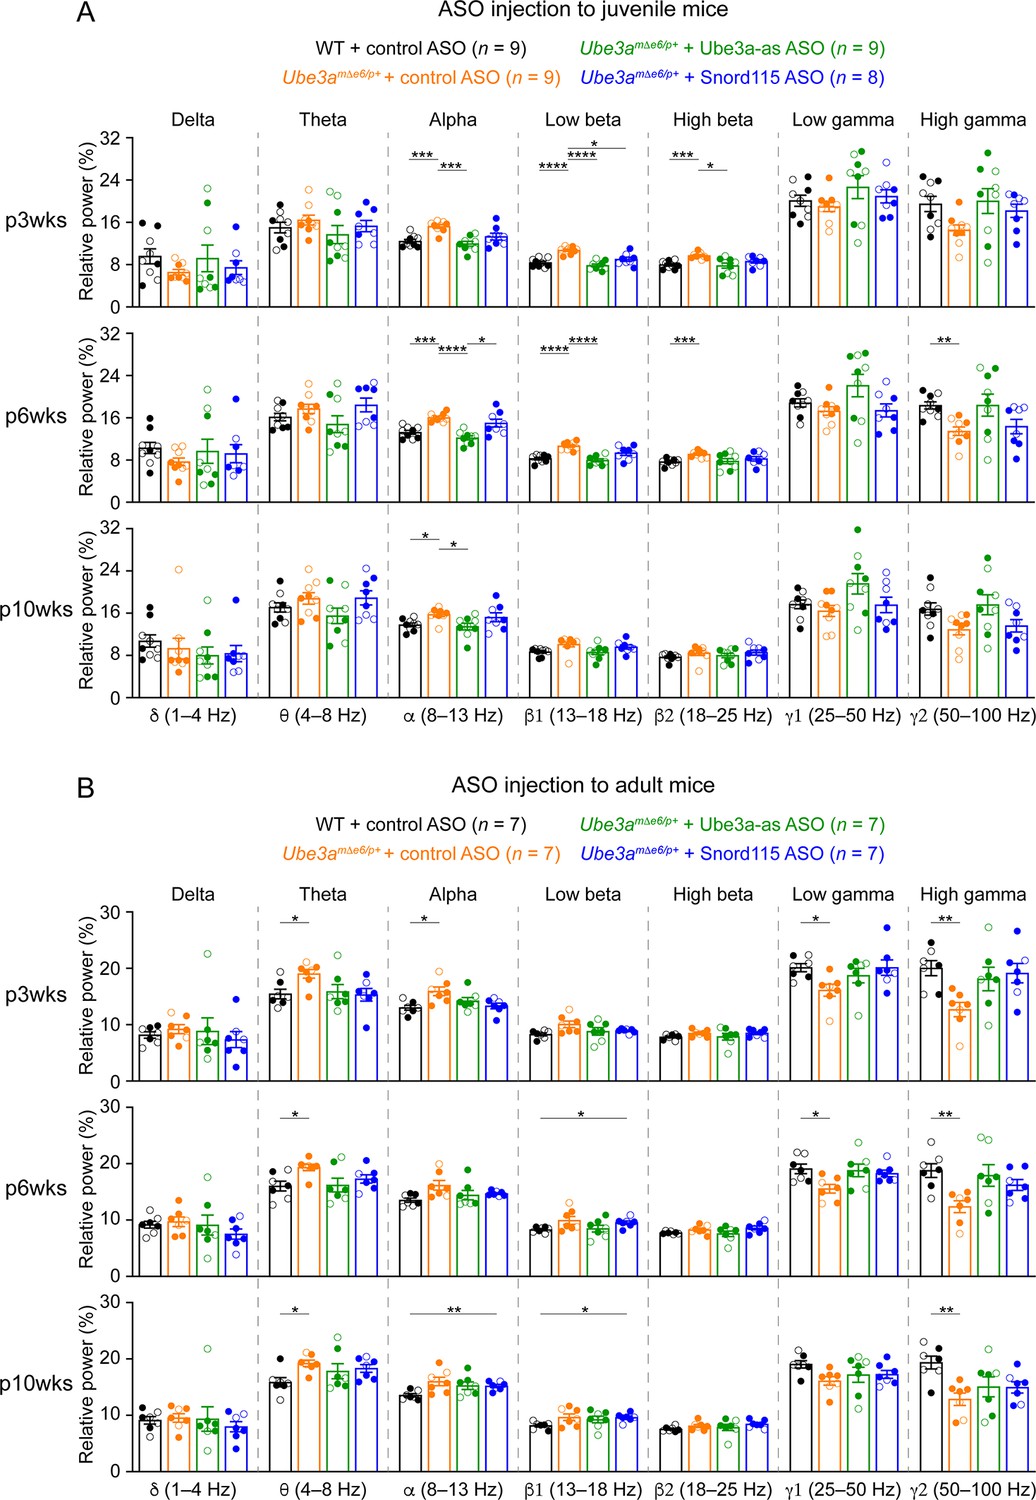
Reactivation of paternal Ube3a in Ube3amΔe6/p+ mice restores the relative power in different electroencephalogram (EEG) frequency bands.
(A) Summary data show the relative power in each of the frequency bands indicated in the figure. Control antisense oligonucleotide (ASO)-treated Ube3amΔe6/p+ mice show an increase of power in the 8–25 Hz range and a decrease of power in the 50–100 Hz range as compared to control ASO-treated wild-type (WT) mice. Ube3a-as ASO reduces the power in 8–25 Hz and increases the power in 50–100 Hz in Ube3amΔe6/p+ mice. Snord115 ASO has a similar effect in Ube3amΔe6/p+ mice at 3 weeks post ASO injection. (B) Similar to (A), but for ASO injection into adult mice. The numbers of tested mice are indicated in the figure. Each filled (male) or open (female) circle represents one mouse. Bar graphs are mean ± standard error of the mean (SEM). Two-way analysis of variance (ANOVA) with Tukey multiple comparison test for all pairs of groups, *p < 0.05, **p < 0.01, ***p < 0.001, ****p < 0.0001.
Figure 5—figure supplement 3
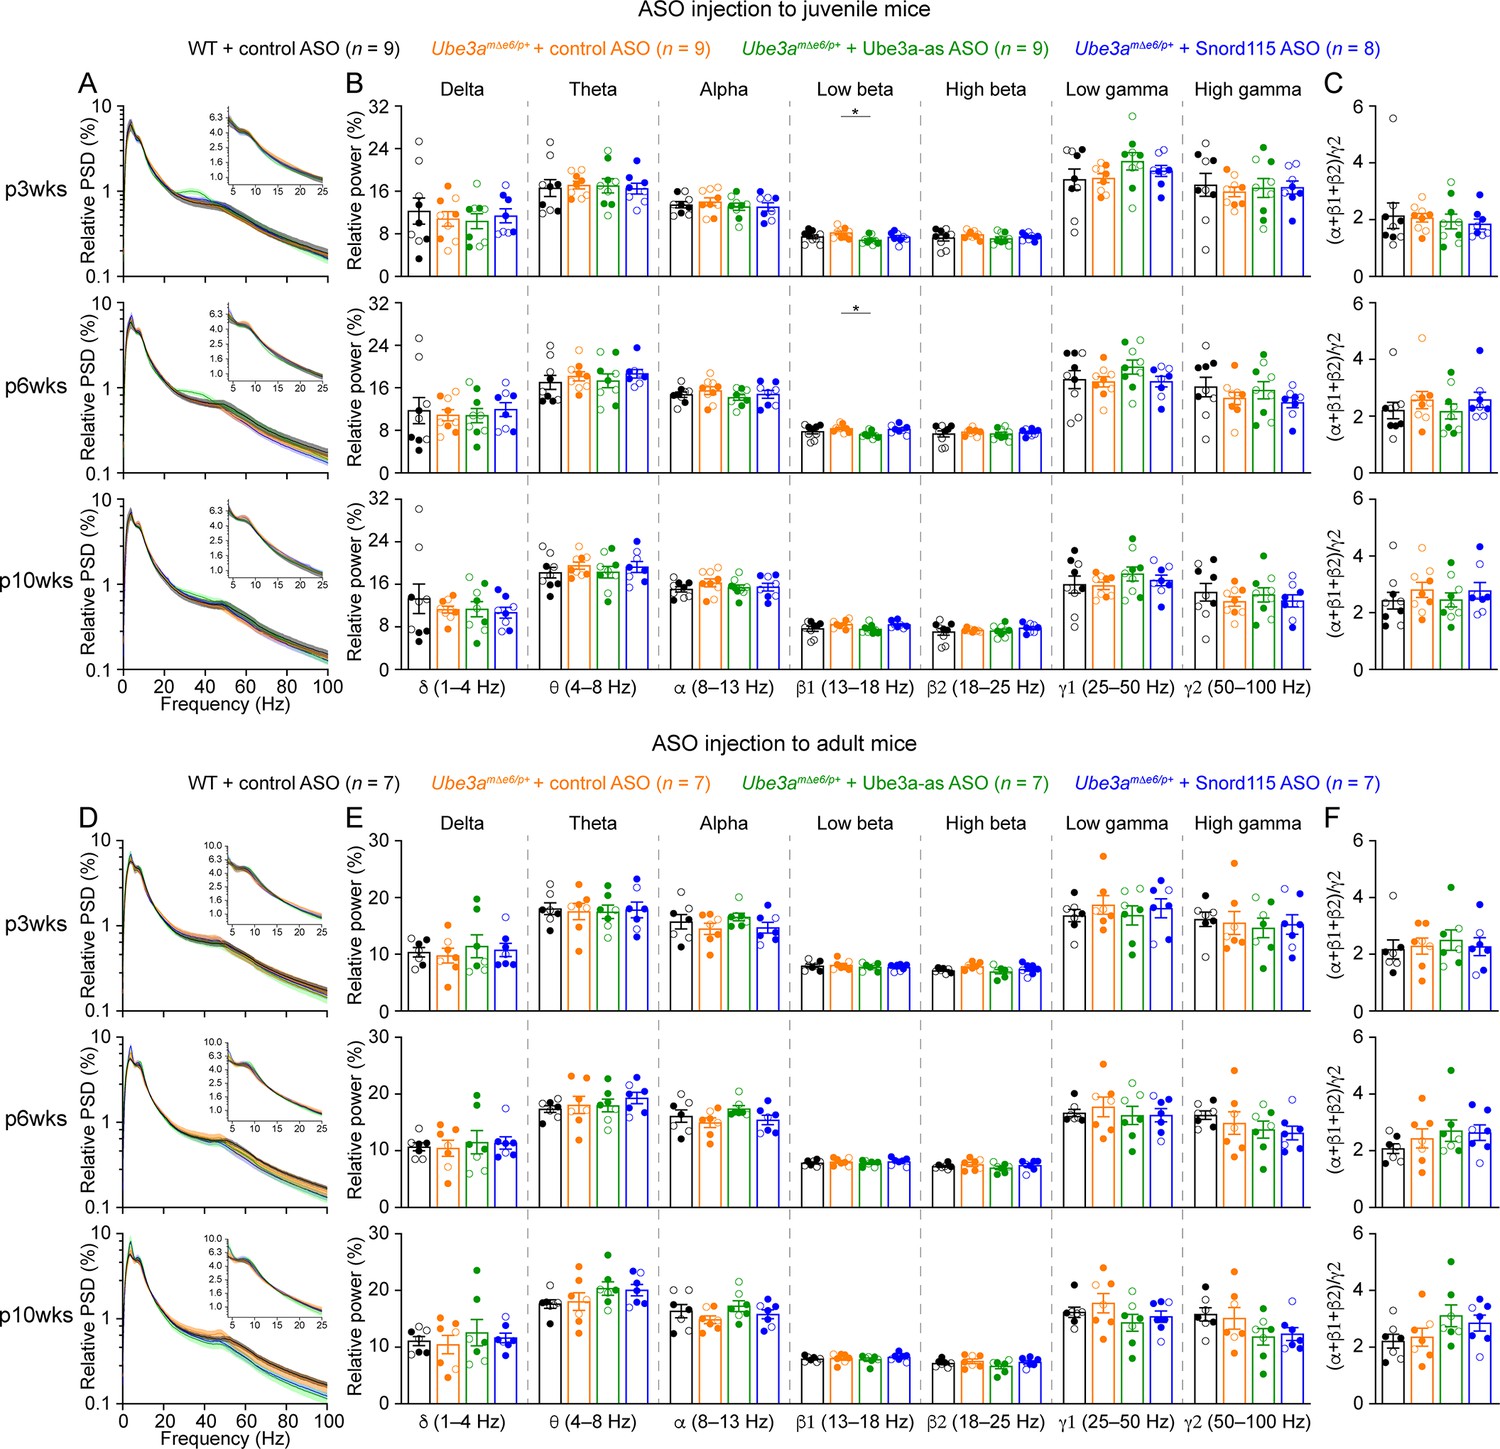
Reactivation of paternal Ube3a rescues abnormal electroencephalogram (EEG) rhythms in the somatosensory cortex of Ube3amΔe6/p+ mice.
(A) Relative EEG power spectral density (PSD) curves from the left somatosensory cortices at 3, 6, and 10 weeks post antisense oligonucleotide (ASO) injection into juvenile mice. The insets show the relative PSDs in 4–25 Hz. Lines and shades are mean and standard error of the mean (SEM), respectively. (B) Summary data show the relative power in each of the frequency bands indicated in the figure. (C) Summary data show the ratio of power in 8–25 Hz over 50–100 Hz. Control ASO-treated Ube3amΔe6/p+ mice show a higher ratio than control ASO-treated wild-type (WT) mice. Ube3a-as ASO, but not Snord115 ASO, reduces the ratio when injected into juvenile Ube3amΔe6/p+ mice. (D–F) Similar to (A–C), but for ASO injection into adult mice. The numbers of tested mice are indicated in the figure. Each filled (male) or open (female) circle represents one mouse. Bar graphs are mean ± SEM. Two-way analysis of variance (ANOVA) with Tukey multiple comparison test (B, E) and Kruskal–Wallis test with Dunn’s multiple comparison test (C, F) for all pairs of groups, *p < 0.05, **p < 0.01.
Figure 5—figure supplement 4
Normal electroencephalogram (EEG) rhythms in the visual cortex of Ube3amΔe6/p+ mice.
(A) Relative EEG power spectral density (PSD) curves from the right visual cortices at 3, 6, and 10 weeks post antisense oligonucleotide (ASO) injection into juvenile mice. The insets show the relative PSDs in 4–25Hz. Lines and shades are mean and standard error of the mean (SEM), respectively. (B) Summary data show the relative power in each of the frequency bands indicated in the figure. (C) Summary data show the ratio of power in 8–25 Hz over 50–100 Hz. (D–F) Similar to (A–C), but for ASO injection into adult mice. The numbers of tested mice are indicated in the figure. Each filled (male) or open (female) circle represents one mouse. Bar graphs are mean ± SEM. Two-way analysis of variance (ANOVA) with Tukey multiple comparison test (B, E) and Kruskal–Wallis test with Dunn’s multiple comparison test (C, F) for all pairs of groups, *p < 0.05.
Figure 6 with 1 supplement
Reactivation of paternal Ube3a rescues abnormal rapid eye movement (REM) sleep in Ube3amΔe6/p+ mice.
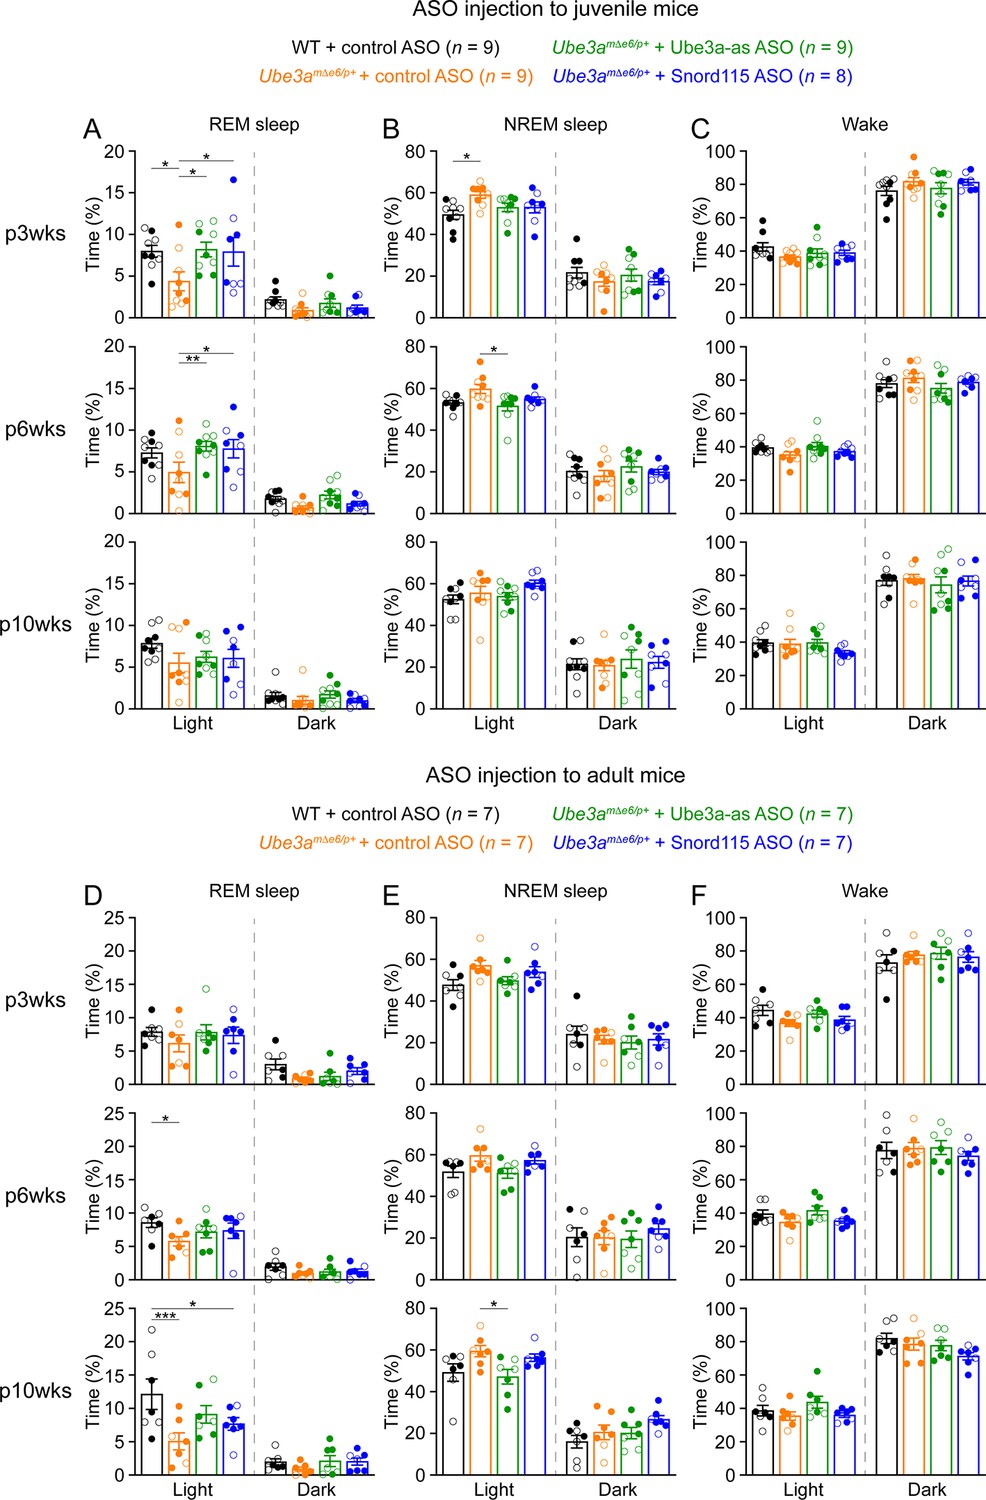
(A) Summary data of the cumulative REM sleep time at 3, 6, and 10 weeks post antisense oligonucleotide (ASO) injection into juvenile mice. Control ASO-treated Ube3amΔe6/p+ mice spend less time in REM sleep than control ASO-treated wild-type (WT) mice. Both Ube3a-as and Snord115 ASOs improve REM sleep in Ube3amΔe6/p+ mice. (B, C) Similar to (A), but for non-rapid eye movement (NREM) sleep (B) and wake (C). (D–F) Similar to (A–C), but for ASO injection into adult mice. The rescue effect of Ube3a-as and Snord115 ASOs is reduced as compared to ASO injection into juvenile mice. The numbers of tested mice are indicated in the figure. Each filled (male) or open (female) circle represents one mouse. Bar graphs are mean ± standard error of the mean (SEM). Two-way analysis of variance (ANOVA) with Tukey multiple comparison test for all pairs of groups, *p < 0.05, **p < 0.01, ***p < 0.001.
Figure 6—figure supplement 1
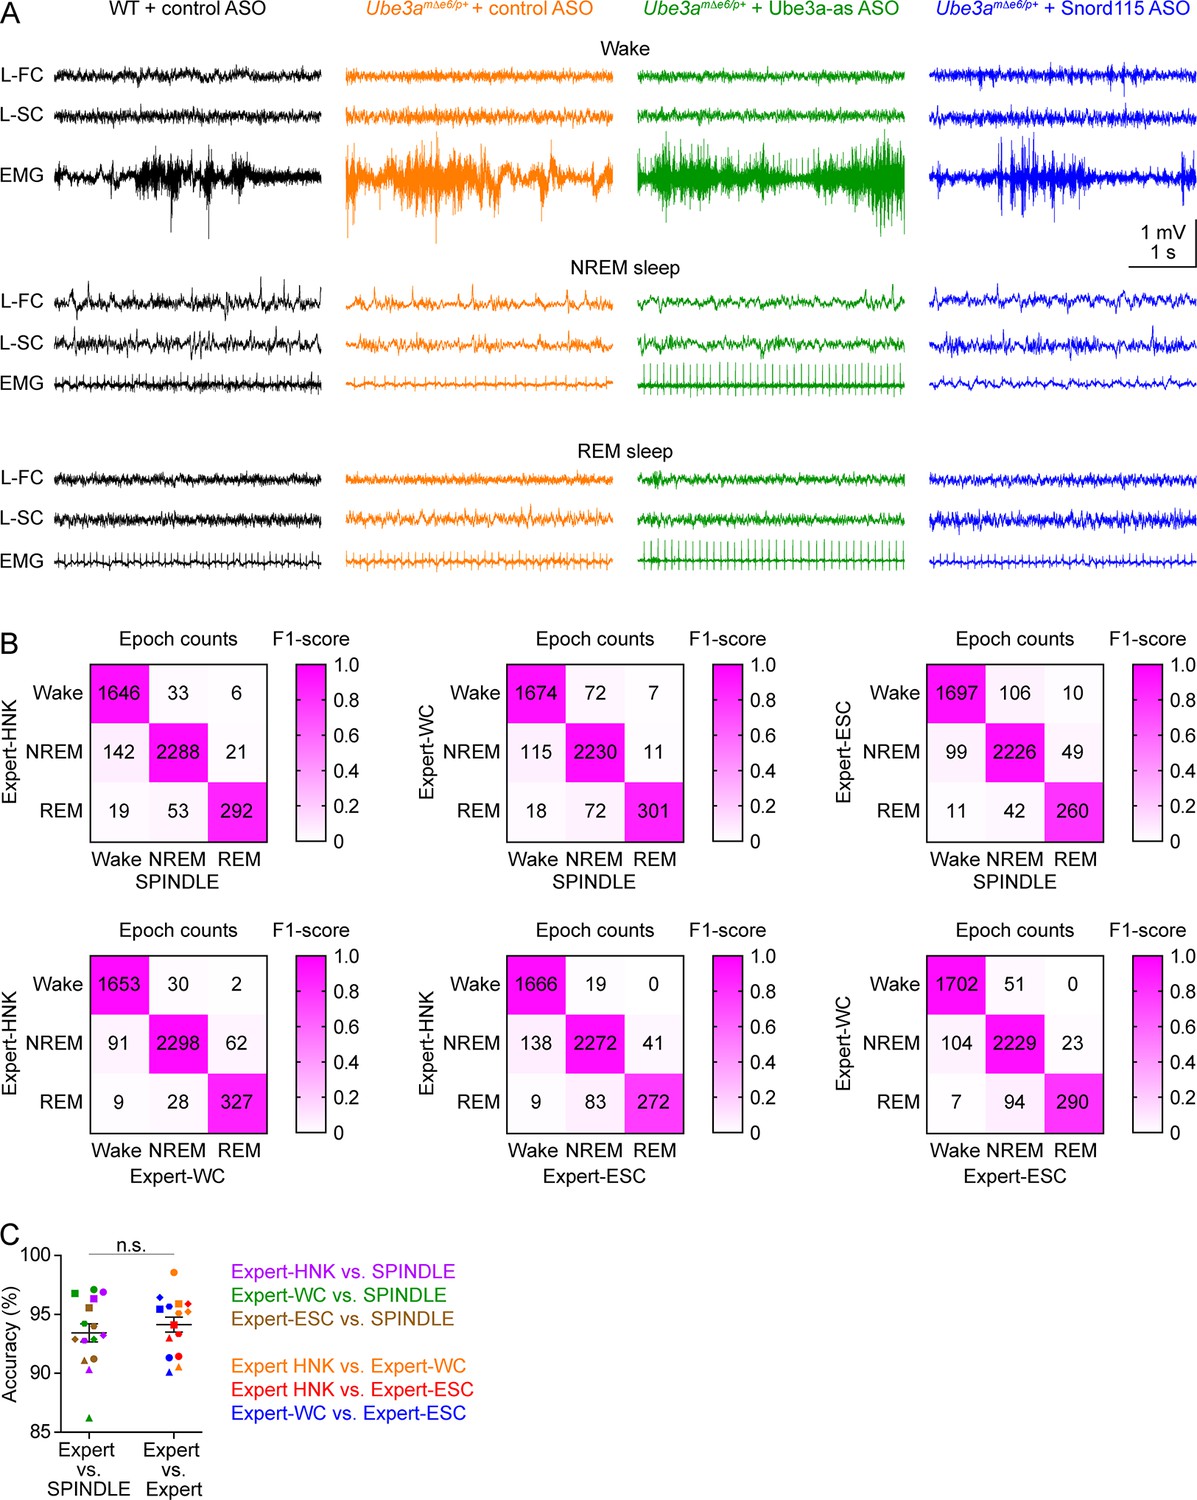
Validation of sleep staging by SPINDLE program.
(A) Representative electroencephalogram (EEG) traces from the left frontal cortices (L-FC) and left somatosensory cortices (L-SC), and electromyogram (EMG) traces from the neck muscles during wake (top panels), non-rapid eye movement (NREM) sleep (middle panels), and rapid eye movement (REM) sleep (bottom panels) at 3 weeks post antisense oligonucleotide (ASO) injection into juvenile mice. (B) The wake, NREM sleep, and REM sleep of five mice (two wild-type [WT] mice injected with control ASO, two Ube3amΔe6/p+ mice with control ASO, and one Ube3amΔe6/p+ mouse with Ube3a-as ASO, 1 hr of data from each mouse) were determined by SPINDLE program and three human experts (HNK, WC, and ESC). The matrices compare the epoch counts of wake, NREM sleep, and REM sleep between SPINDLE and experts (upper panels) and between experts (low panels). The colors indicate the F1-score. (C) The accuracy of sleep staging between SPINDLE and experts is similar to that between experts. The symbol color represents a pair of comparisons as indicated in the figure, and the symbol shape represents a mouse. Line graphs are mean ± standard error of the mean (SEM). Unpaired t-test with Welch’s correction (two-tailed), n.s., p = 0.5.
Figure 7 with 1 supplement
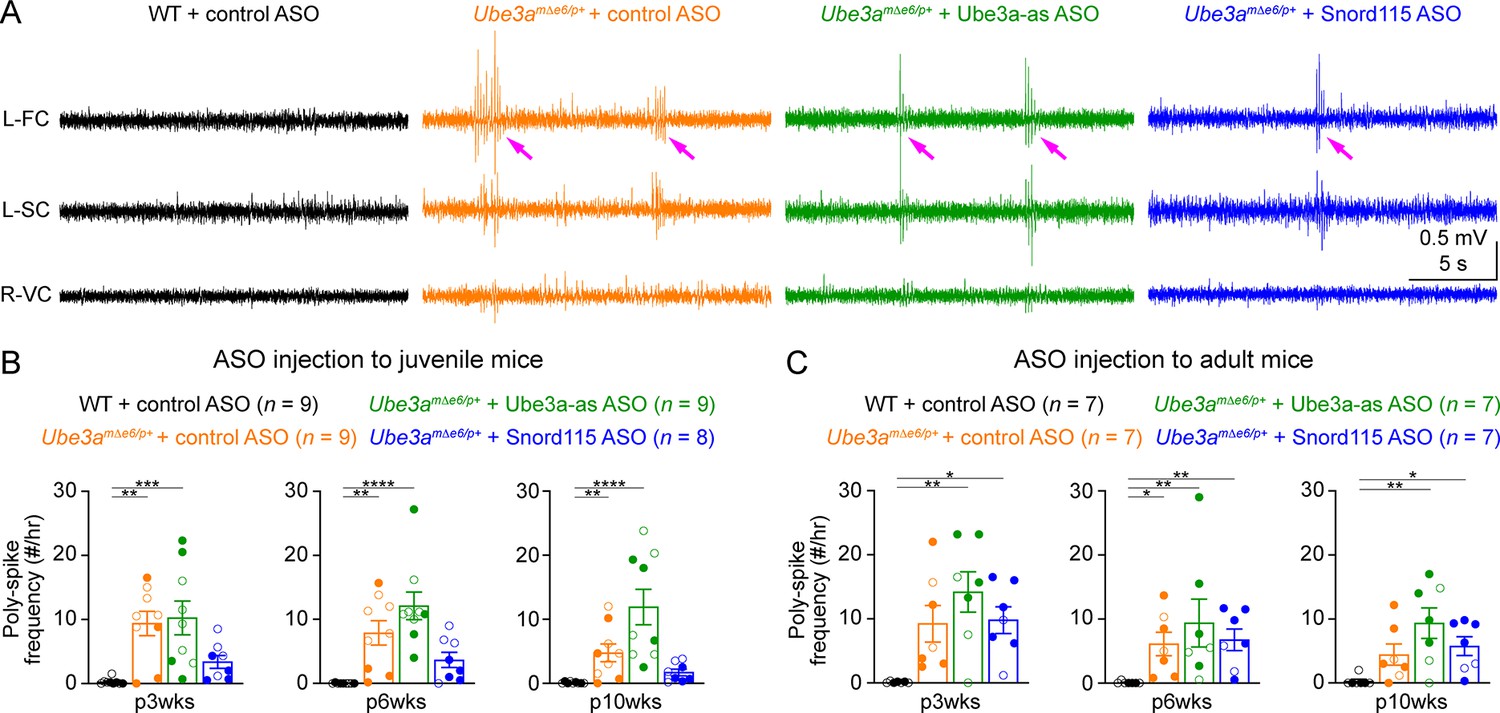
Reactivation of paternal Ube3a does not suppress poly-spikes in Ube3amΔe6/p+ mice.
(A) Representative electroencephalogram (EEG) traces from the left frontal cortices (L-FC), left somatosensory cortices (L-SC), and right visual cortices (R-VC) at 3 weeks post antisense oligonucleotide (ASO) injection into juvenile mice. (B) Summary data showing the frequencies of poly-spikes from the left frontal cortices at 3, 6, and 10 weeks post ASO injection into juvenile mice. Control ASO-treated Ube3amΔe6/p+ mice show many more poly-spikes than control ASO-treated wild-type (WT) mice. Snord115 ASO modestly reduces poly-spikes, whereas Ube3a-as ASO does not. (C) Similar to (B), but for ASO injection into adult mice. Neither Ube3a-as nor Snord115 reduces poly-spikes. The numbers of tested mice are indicated in the figure. Each filled (male) or open (female) circle represents one mouse. Bar graphs are mean ± standard error of the mean (SEM). Kruskal–Wallis test with Dunn’s multiple comparison test for all pairs of groups, *p < 0.05, **p < 0.01, ***p < 0.001, ****p < 0.0001.
Figure 7—figure supplement 1
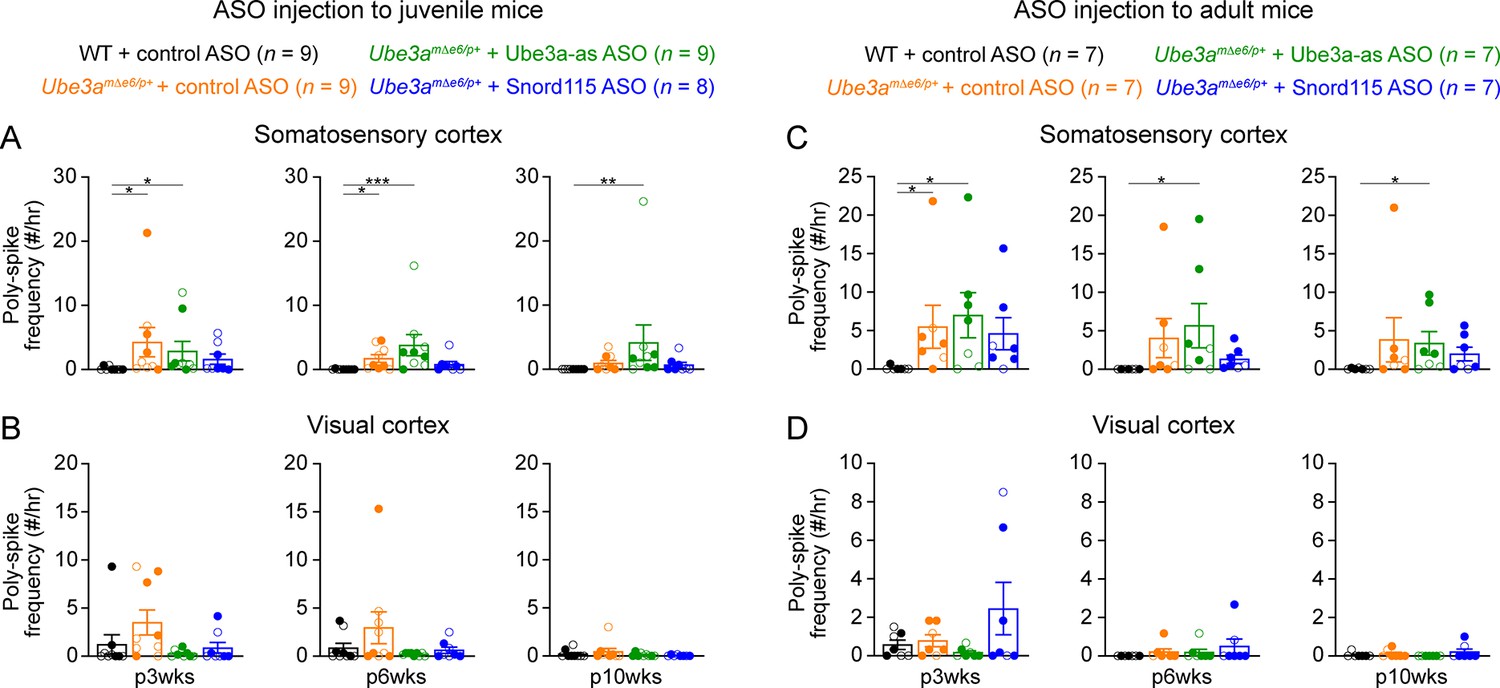
Poly-spikes in the somatosensory and visual cortices of Ube3amΔe6/p+ mice.
(A) Summary data showing the frequencies of poly-spikes from the left somatosensory cortices at 3, 6, and 10 weeks post antisense oligonucleotide (ASO) injection into juvenile mice. Control ASO-treated Ube3amΔe6/p+ mice show more poly-spikes than control ASO-treated wild-type (WT) mice. Snord115 ASO modestly reduces poly-spikes, whereas Ube3a-as ASO does not. (B) Similar to (A), but for the visual cortices. The frequencies of poly-spikes are not significantly increased in control ASO-treated Ube3amΔe6/p+ mice as compared to control ASO-treated WT mice. (C, D) Similar to (A, B), but for ASO injection into adult mice. Neither Ube3a-as nor Snord115 reduces poly-spikes in the somatosensory cortices. The numbers of tested mice are indicated in the figure. Each filled (male) or open (female) circle represents one mouse. Bar graphs are mean ± standard error of the mean (SEM). Kruskal–Wallis test with Dunn’s multiple comparison test for all pairs of groups, *p < 0.05, **p < 0.01, ***p < 0.001.
Figure 8
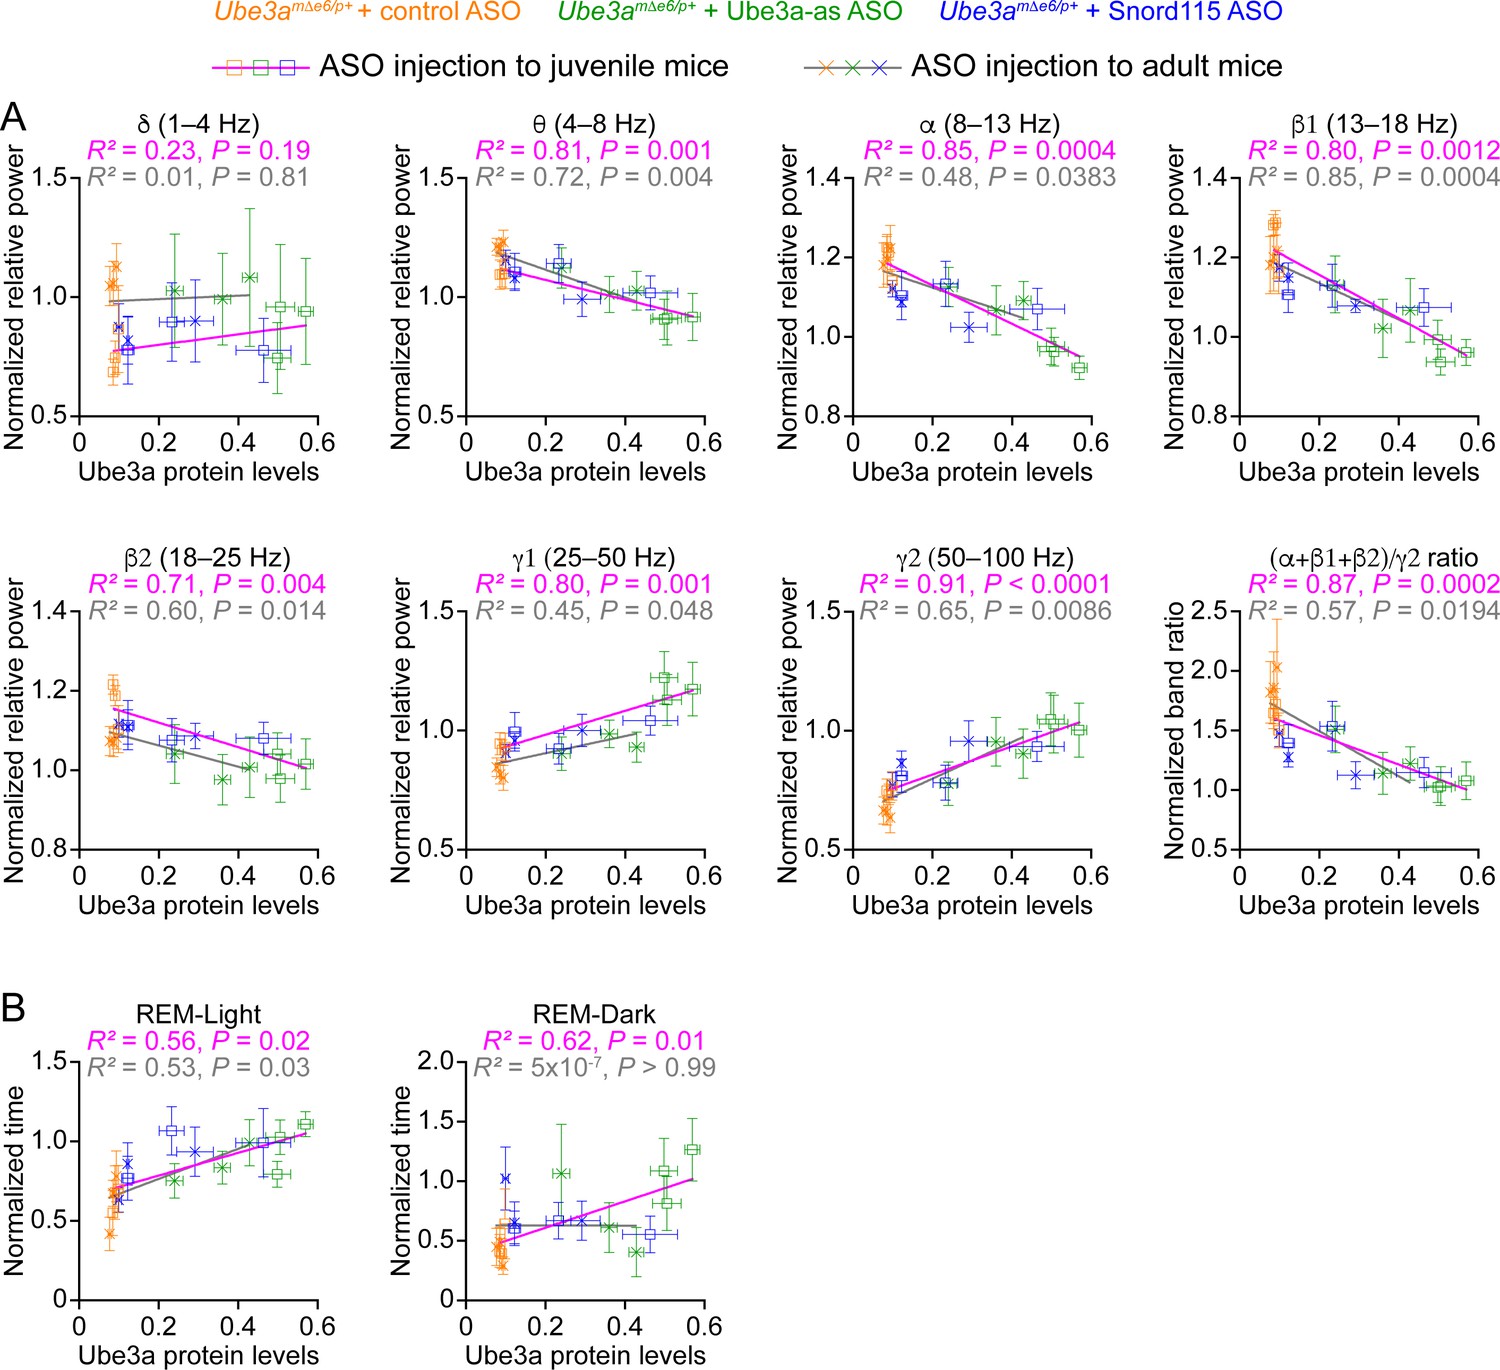
Electroencephalogram (EEG) rhythms and rapid eye movement (REM) sleep correlate with Ube3a protein levels in Ube3amΔe6/p+ mice.
(A) The relationships between the Ube3a protein levels and EEG relative power from the frontal cortices of Ube3amΔe6/p+ mice injected with control, Ube3a-as, or Snord115 antisense oligonucleotide (ASO) across 3, 6, and 10 weeks post ASO injection into juvenile and adult mice. The Ube3a protein levels from all brain regions were averaged for each mouse. The relative EEG power within each frequency band and the power ratio (α + β1 + β2)/γ2 were normalized by the means of those in wild-type (WT) mice injected with control ASO. The relationships were fitted with a linear regression ( X, Ube3a protein levels; Y, normalized EEG relative power or power ratio (α + β1 + β2)/γ2; a, b, constants). (B) Similar to (A), but for the relationships between the Ube3a protein levels and REM sleep time in light and dark phases. Data are mean ± standard error of the mean (SEM). R2 indicates the goodness of fit. p < 0.05 indicates a significant deviation of slope from zero.
Author response image 1

3 weeks post ASO injection to juvenile mice.
Tables
Key resources table
| Reagent type (species) or resource | Designation | Source or reference | Identifiers | Additional information |
|---|---|---|---|---|
| Genetic reagent (Mus musculus) | Ube3aΔe6 | This paper | The new Ube3a KO allele that deletes exon 6 | |
| Genetic reagent (Mus musculus) | B6.129S7-Ube3atm1Alb/J | The Jackson Laboratory | RRID:IMSR_JAX:016590 | The previous Ube3a KO allele that deletes exon 5, Ube3aΔe5 in the paper |
| Genetic reagent (Mus musculus) | B6.129S7-Ube3atm2Alb/J | The Jackson Laboratory | RRID:IMSR_JAX:017765 | Ube3aYFP in the paper |
| Genetic reagent (Mus musculus) | C57BL/6J | The Jackson Laboratory | RRID:IMSR_JAX:000664 | |
| Sequence-based reagent | Control ASO | Ionis Pharmaceuticals, Meng et al., 2015 | 5′-CCToAoToAoGGACTATCCAoGoGAA-3′ | |
| Sequence-based reagent | Ube3a-as ASO | Ionis Pharmaceuticals, Meng et al., 2015 | 5′-CCoAoGoCoCTTGTTGGATAoToCAT-3′ | |
| Sequence-based reagent | Snord115 ASO | Ionis Pharmaceuticals, this paper | 5′-TToGoToAoAGCATCAAAGToAoTGA-3′ | |
| Antibody | Rabbit monoclonal anti-GFP | Invitrogen | Cat. #: G10362 | IF (1:2000) |
| Antibody | Mouse monoclonal anti-E6AP | Sigma-Aldrich | Cat. #: E8655 | WB (1:1000) |
| Antibody | Mouse monoclonal anti-Gapdh | Proteintech | Cat. #: 60004-1-Ig | WB (1:10,000) |
| Antibody | Mouse monoclonal anti-β3 tubulin | Proteintech | Cat. #: 66240-1-Ig | WB (1:50,000) |
| Antibody | Goat polyclonal anti-rabbit secondary antibody conjugated with Alexa Flour 647 | Invitrogen | Cat. #: A21245 | IF (1:1000) |
| Antibody | Goat polyclonal anti-mouse antibody conjugated with IRDye 800CW | LI-COR Bioscience | Cat. #: 925-32210 | WB (1:20,000) |
| Other | NeuroTrace 435/455 blue fluorescent Nissl stain | Invitrogen | Cat. #: N21479 | IF (1:200) |
| Other | Bolt Bis-Tris Plus 10% mini protein gels | Thermo Fisher Scientific | Cat. #: NW00107BOX | SDS–PAGE for total Ube3a |
| Other | Novex Tris-Glycine 4–12% mini protein gels | Thermo Fisher Scientific | Cat. #: XP04120BOX | SDS–PAGE for separation of Ube3a isoforms |
| Software, algorithm | LAS X software | Leica | RRID:SCR_013673 | Version 3.3.0.16799 |
| Software, algorithm | ImageJ | NIH | RRID:SCR_003070 | Version 1.53c |
| Software, algorithm | LABKIT | Arzt et al., 2022 | Version 0.3.9, https://imagej.net/plugins/labkit/ | |
| Software, algorithm | Image Studio Lite | LI-COR Biosciences | RRID:SCR_013715 | Version 5.2 |
| Software, algorithm | Sirenia | Pinnacle Technology | RRID:SCR_016184 | Version 1.8.2 |
| Software, algorithm | SPINDLE | Miladinović et al., 2019 | https://sleeplearning.ethz.ch | |
| Software, algorithm | Prism | GraphPad Software | RRID:SCR_002798 | Version 9 |
| Software, algorithm | Python | Python Software Foundation | RRID:SCR_008394 | Version 3.9.12 |
Additional files
-
Supplementary file 1
Comparison of phenotypic rescue of maternal Ube3a knockout mice by restoring Ube3a expression at different ages.
The table summarizes the outcomes of restoring Ube3a expression in maternal Ube3a knockout mice at different developmental ages from previous studies.
- https://cdn.elifesciences.org/articles/81892/elife-81892-supp1-v3.docx
-
Supplementary file 2
Primers and probes for reverse transcription droplet digital PCR (RT-ddPCR) and reverse transcription quantitative real-time PCR (RT-qPCR).
The sequences of the primers and probes used in the RT-ddPCR or RT-qPCR experiments for detecting Ube3a, Ube3a-ATS, Ipw, and Gapdh are provided.
- https://cdn.elifesciences.org/articles/81892/elife-81892-supp2-v3.xlsx
-
Supplementary file 3
Statistics of experimental results.
The details of all statistical tests, numbers of replicates, and p values are presented for each experiment in the table.
- https://cdn.elifesciences.org/articles/81892/elife-81892-supp3-v3.xlsx
-
MDAR checklist
- https://cdn.elifesciences.org/articles/81892/elife-81892-mdarchecklist1-v3.docx
Download links
A two-part list of links to download the article, or parts of the article, in various formats.
Downloads (link to download the article as PDF)
Open citations (links to open the citations from this article in various online reference manager services)
Cite this article (links to download the citations from this article in formats compatible with various reference manager tools)
Antisense oligonucleotide therapy rescues disturbed brain rhythms and sleep in juvenile and adult mouse models of Angelman syndrome
eLife 12:e81892.
https://doi.org/10.7554/eLife.81892


