Dopamine in the dorsal bed nucleus of stria terminalis signals Pavlovian sign-tracking and reward violations
- Program in Neuroscience, University of Maryland School of Medicine, United States
- Department of Anatomy and Neurobiology, University of Maryland School of Medicine, United States
- State Key Laboratory of Membrane Biology, Peking University School of Life Sciences; PKU-IDG/McGovern Institute for Brain Research; Peking-Tsinghua Center for Life Sciences, China
Figures
Figure 1
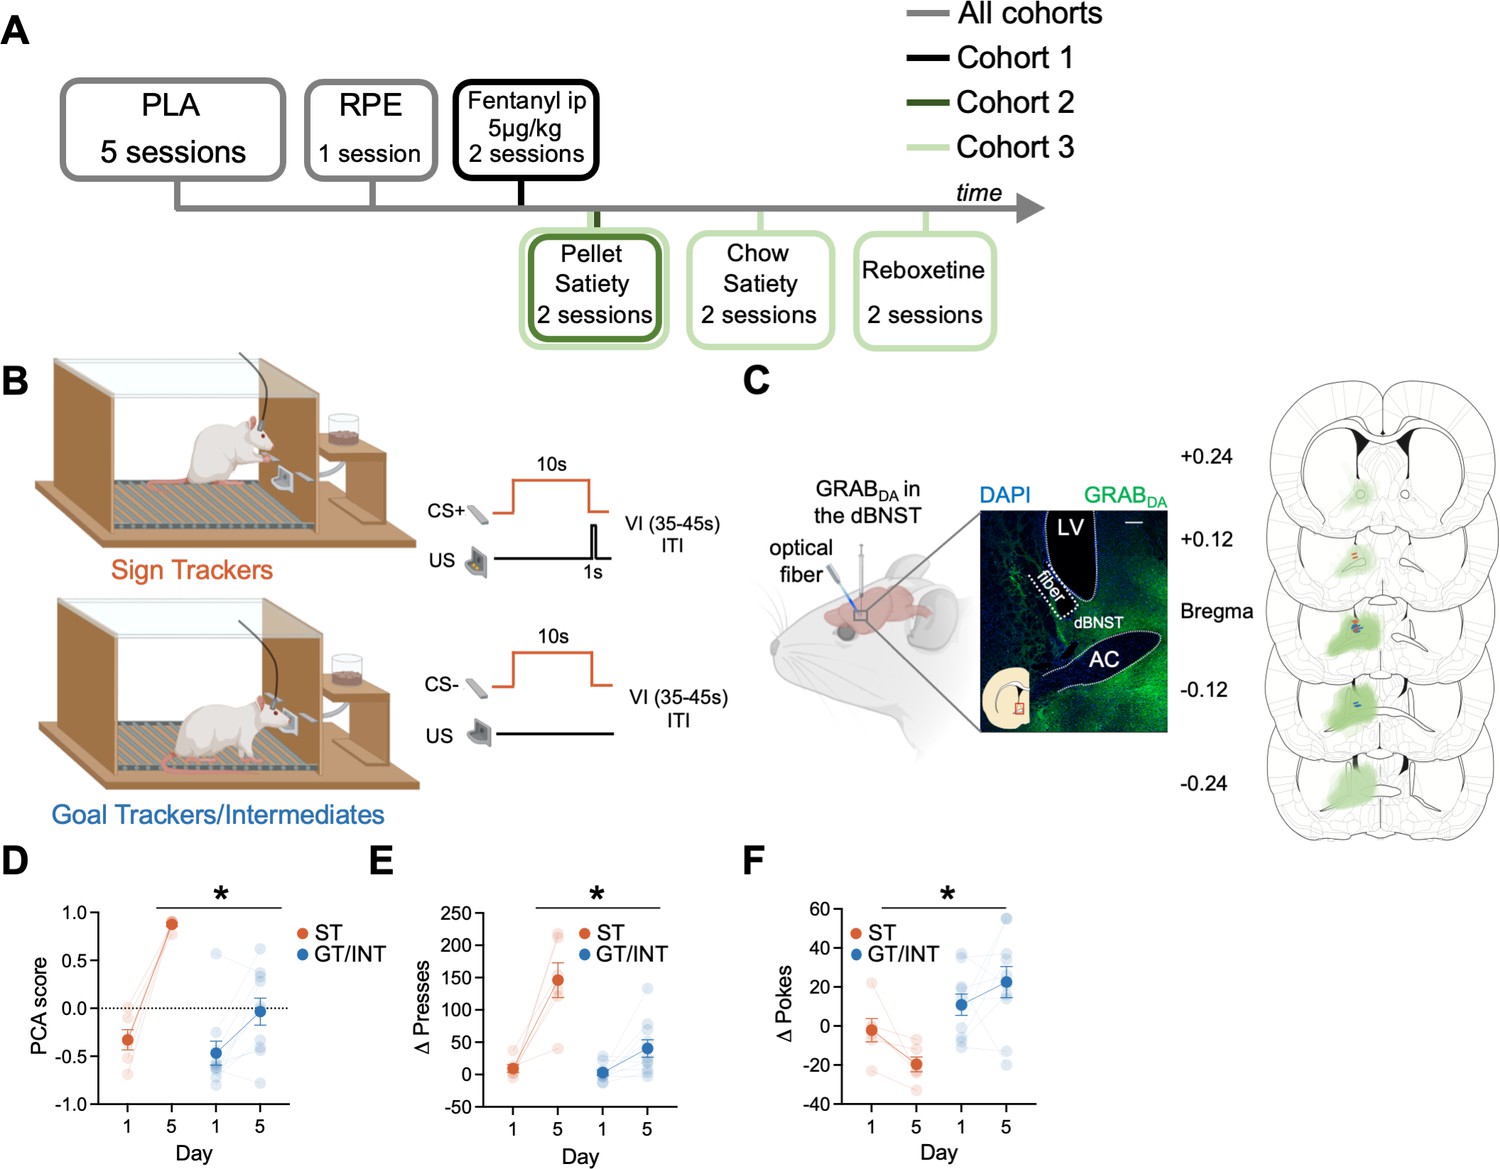
Individual differences emerge during Pavlovian lever autoshaping (PLA).
(A) Experimental timeline. We trained all rats for five daily reinforced PLA sessions to determine their tracking groups followed by a single reward prediction error (RPE) session. We injected the first cohort of rats with i.p fentanyl in PLA and tested the second and the third cohort of rats on two counterbalanced PLA pellet satiety sessions. We tested the third cohort of rats on two counterbalanced PLA chow satiety and with reboxetine i.p. injection sessions. (B) PLA sessions consisted of the presentation of 10 s of cue (either conditioned stimulus, CS + or CS− lever, pseudorandom order with an intertrial interval (ITI) varying (variable interval (VI)) between 35 and 45 s) followed by lever retraction and delivery of two food pellets in the food cup. Some rats (Sign Trackers, STs) engage with the cue while others (Goal trackers, GTs) wait in the food cup during the cue period. Others display both lever and food cup behaviors (Intermediates, INTs) (C) Left: representative expression of GRABDA construct and fiber placement in dorsal bed nucleus of stria terminalis (dBNST). White scale bar: 250 μm. Right: The extent of GRABDA expression and fiber placement across five coronal planes with anterior distance from bregma (millimeters) in the dBNST in STs (orange) and GT/INTs (blue). Drawings were adapted from Figures 31, 32, 33, 34, and 35 from Paxinos and Watson, 2006. (D) Average Pavlovian conditioned approach (PCA) scores for STs and GT/INTs on Day 1 and Day 5 of PLA. (E) Average Δ Presses (CS+) – (CS−) on Day 1 and Day 5. (F) Average Δ Pokes (CS+) – (CS−) on Day 1 and Day 5. Data are mean ± SEM. *p<0.05.
Figure 2 with 4 supplements
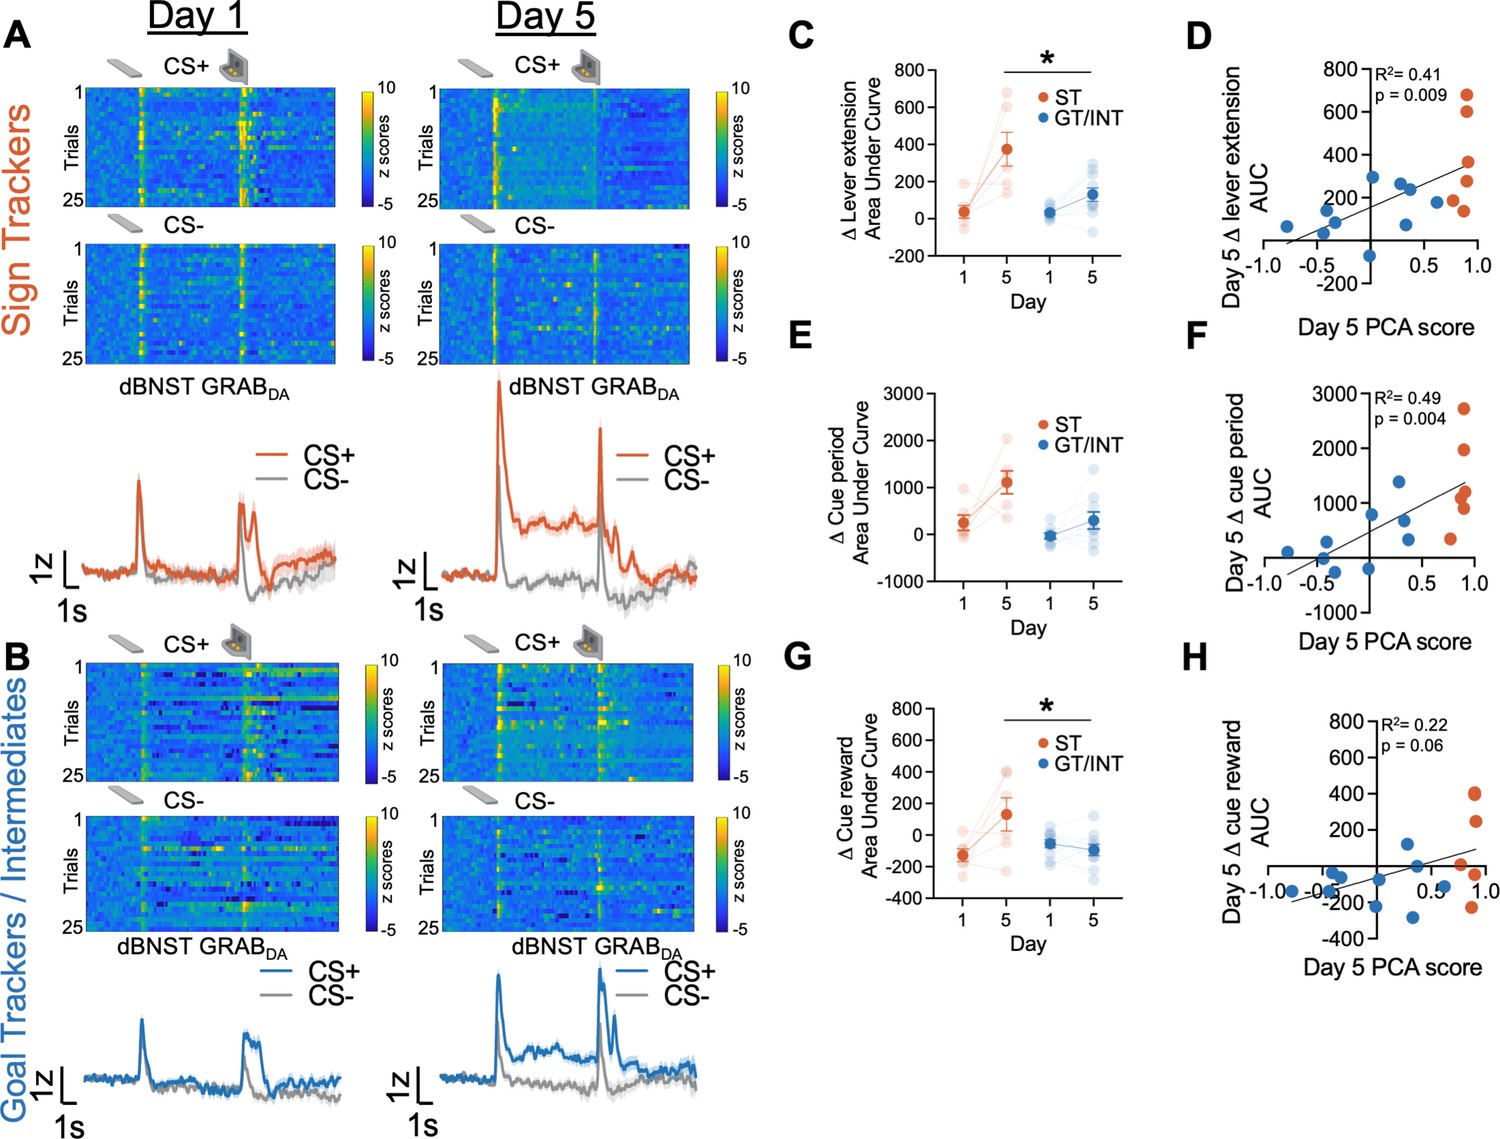
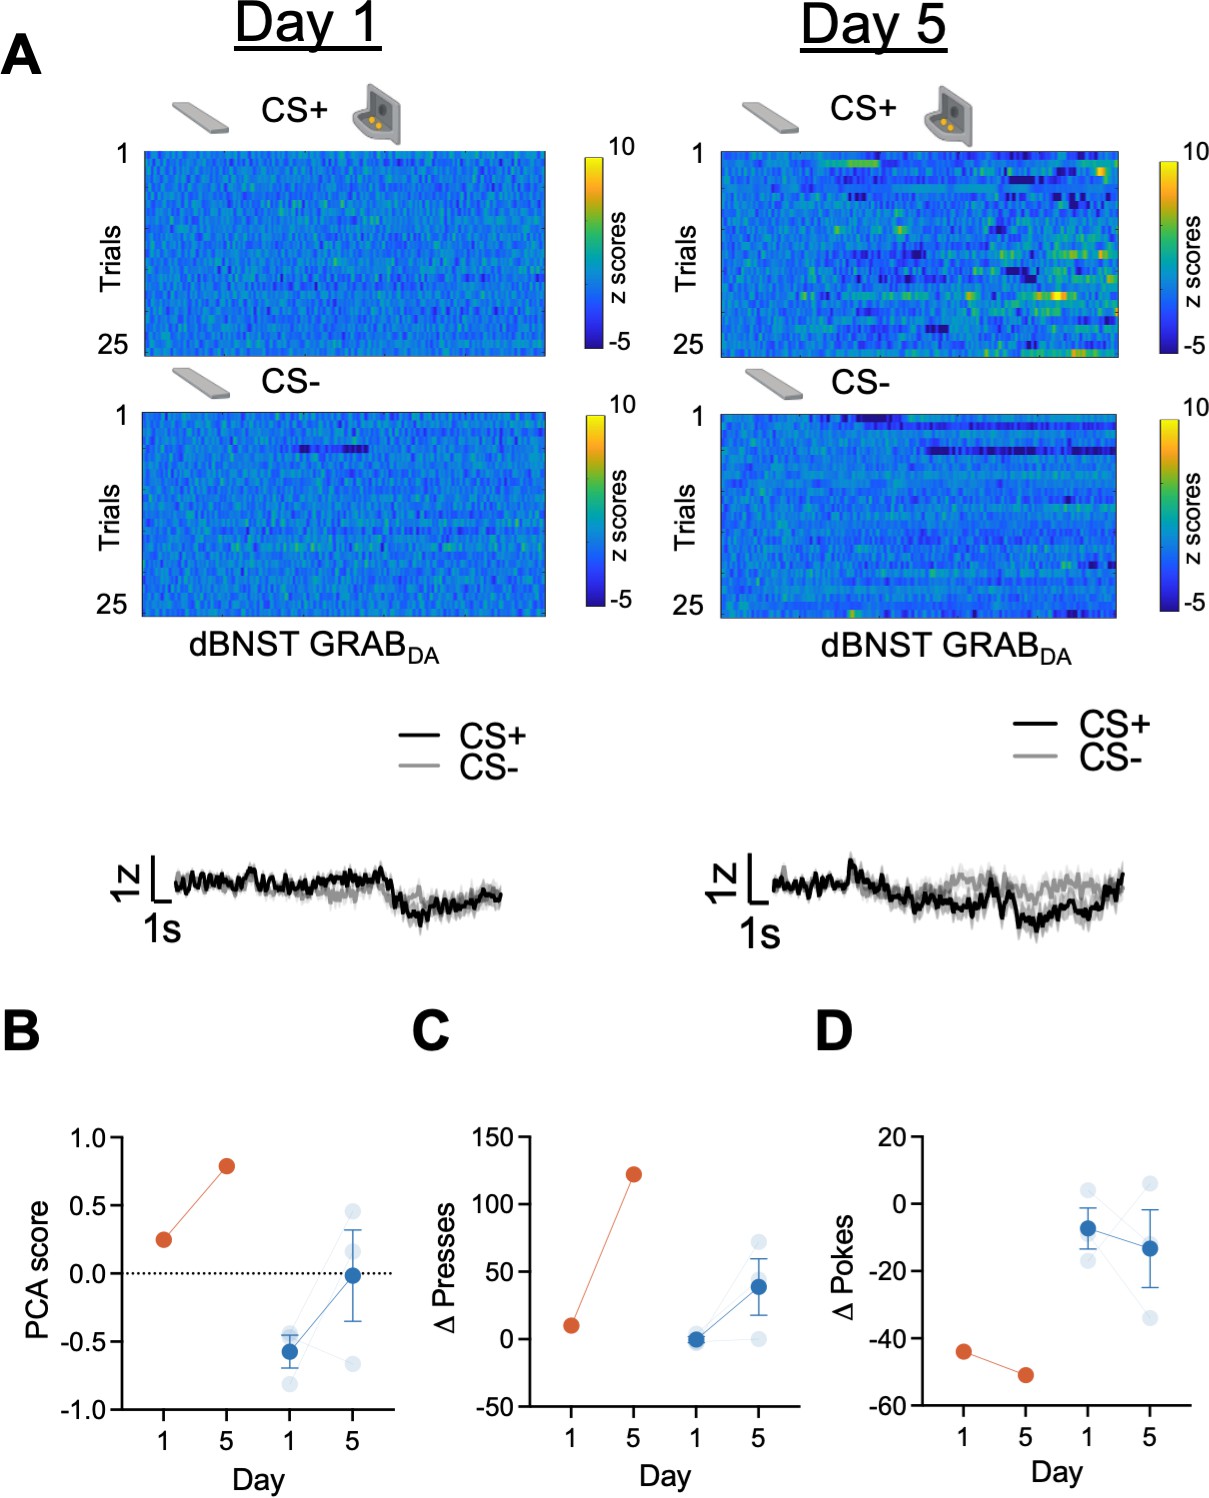
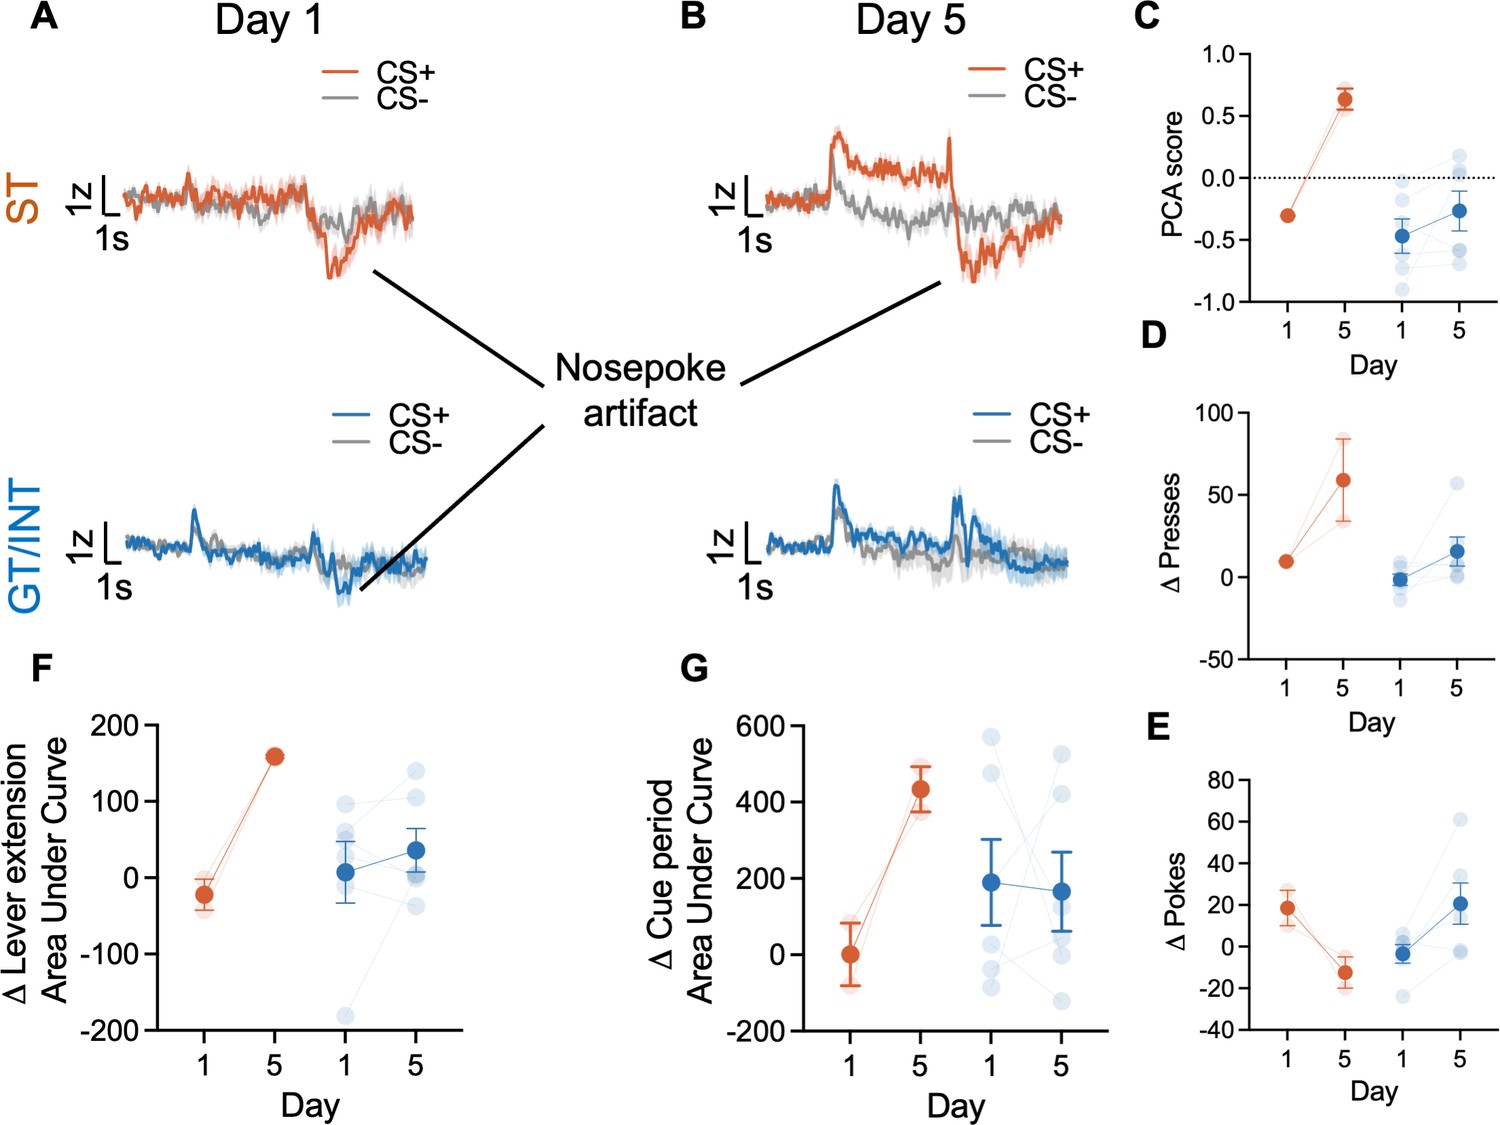
Dorsal bed nucleus of stria terminalis (dBNST) GRABDA signals during Pavlovian lever autoshaping (PLA) between sign-trackers (STs) and goal-trackers/intermediates (GT/INTs).
Representative heat maps illustrating GRABDA signal changes (z-scores) during CS+ and CS− presentations on Day 1 (top left) and Day 5 (top right) and trial-averaged GRABDA signal change (z-scored ∆F/F) during CS+ and CS− presentations on Day 1 (bottom left) and Day 5 (bottom right) in (A) STs and (B) GT/INTs. (C) Trial averaged quantification Δ lever extension ((CS+) – (CS−); 2 s) GRABDA area under curve (AUC) between STs and GT/INTs. (D) Correlation between Day 5 Pavlovian conditioned approach (PCA) scores and Day 5 Δ lever extension AUC. (E) Trial averaged quantification of Δ cue period ((CS+) – (CS−); 10 s) in AUC during cue period between STs and GT/INTs. (F) Correlation between Day 5 PCA scores and Day 5 Δ cue period AUC. (G) Trial averaged quantification of Δ cue-reward ((CS+) – (US), 2 s) in AUC between STs and GT/INTs. (H) Correlation between Day 5 PCA scores and Day 5 change in Δ cue-reward AUC. Data are mean ± SEM. *p<0.05.
Figure 2—figure supplement 1
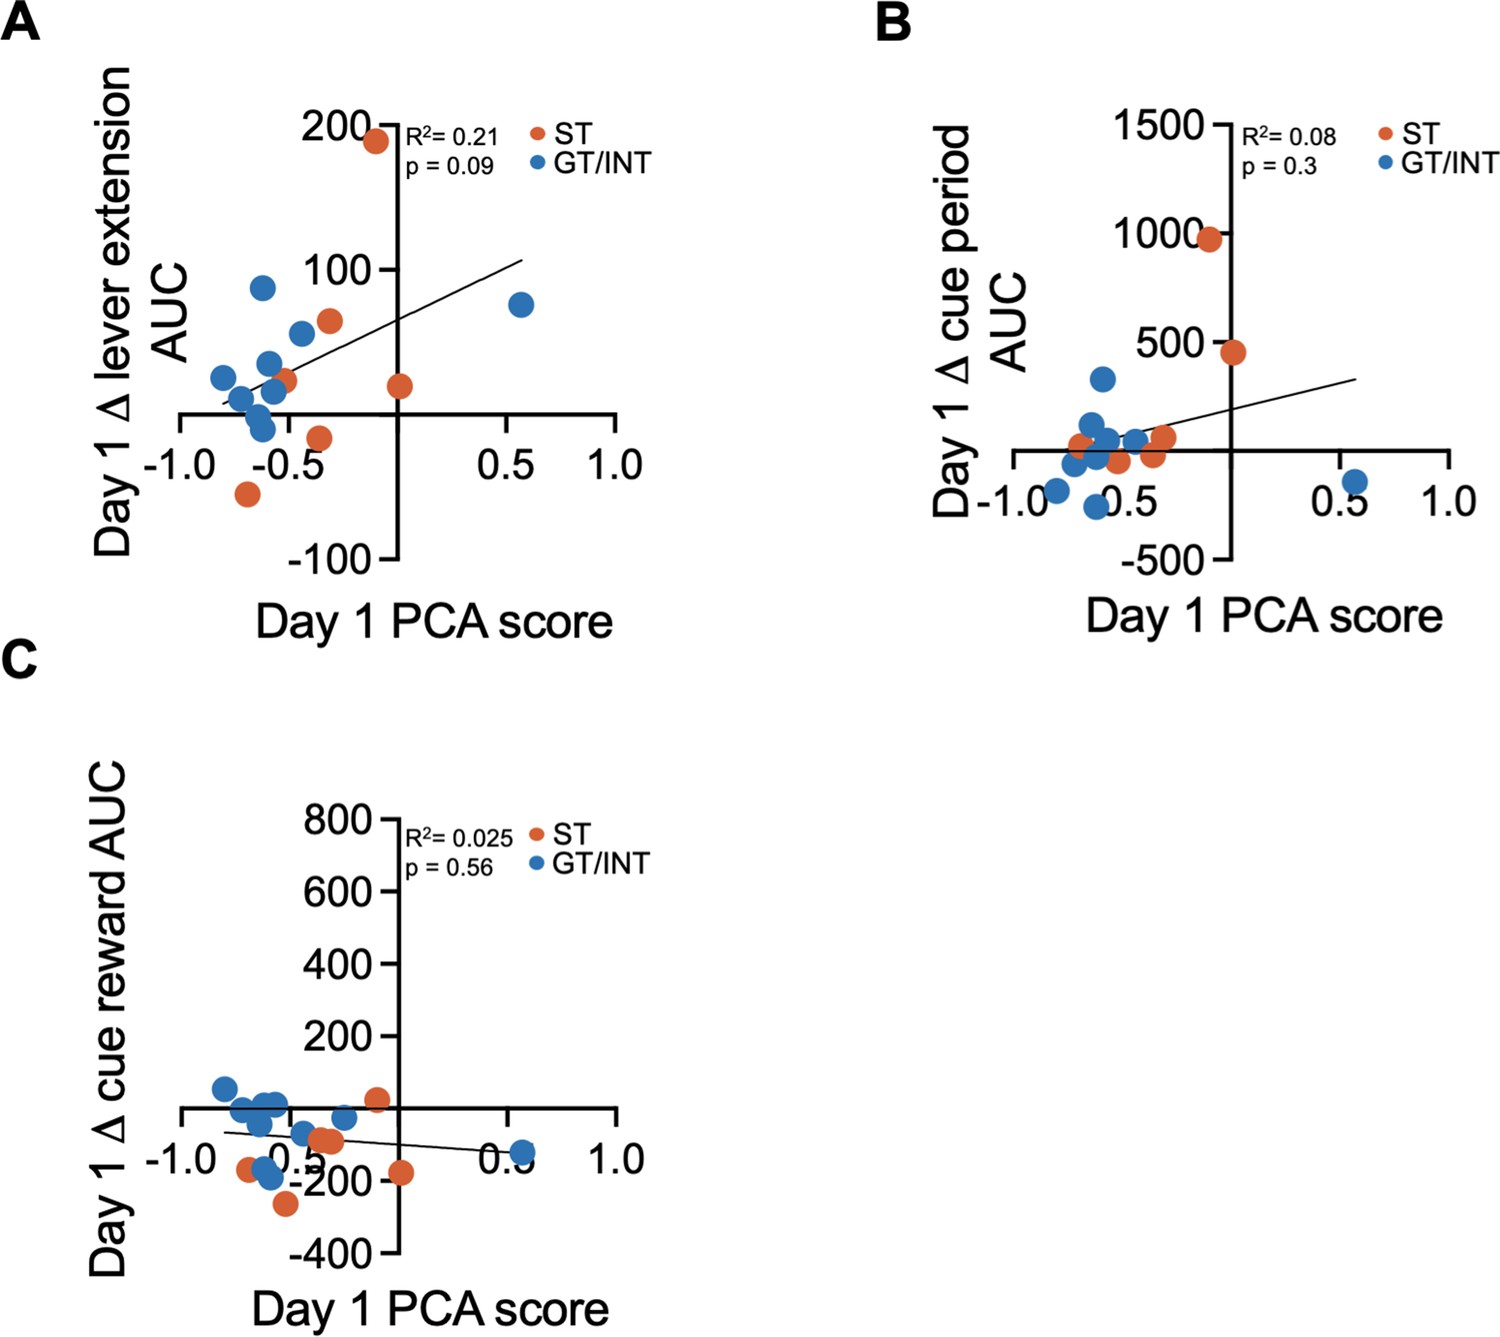
No correlation between Day 1 Pavlovian conditioned approach (PCA) scores and Day 1 bed nucleus of the stria terminalis (BNST) GRABDA signals.
Correlation between (A) Day 1 PCA scores and Day 1 Δ lever extension area under curve (AUC). (B) Day 1 PCA scores and Day 1 Δ cue period AUC and (C) Day 1 PCA scores and Day 1 Δ cue-reward AUC.
Figure 2—figure supplement 2
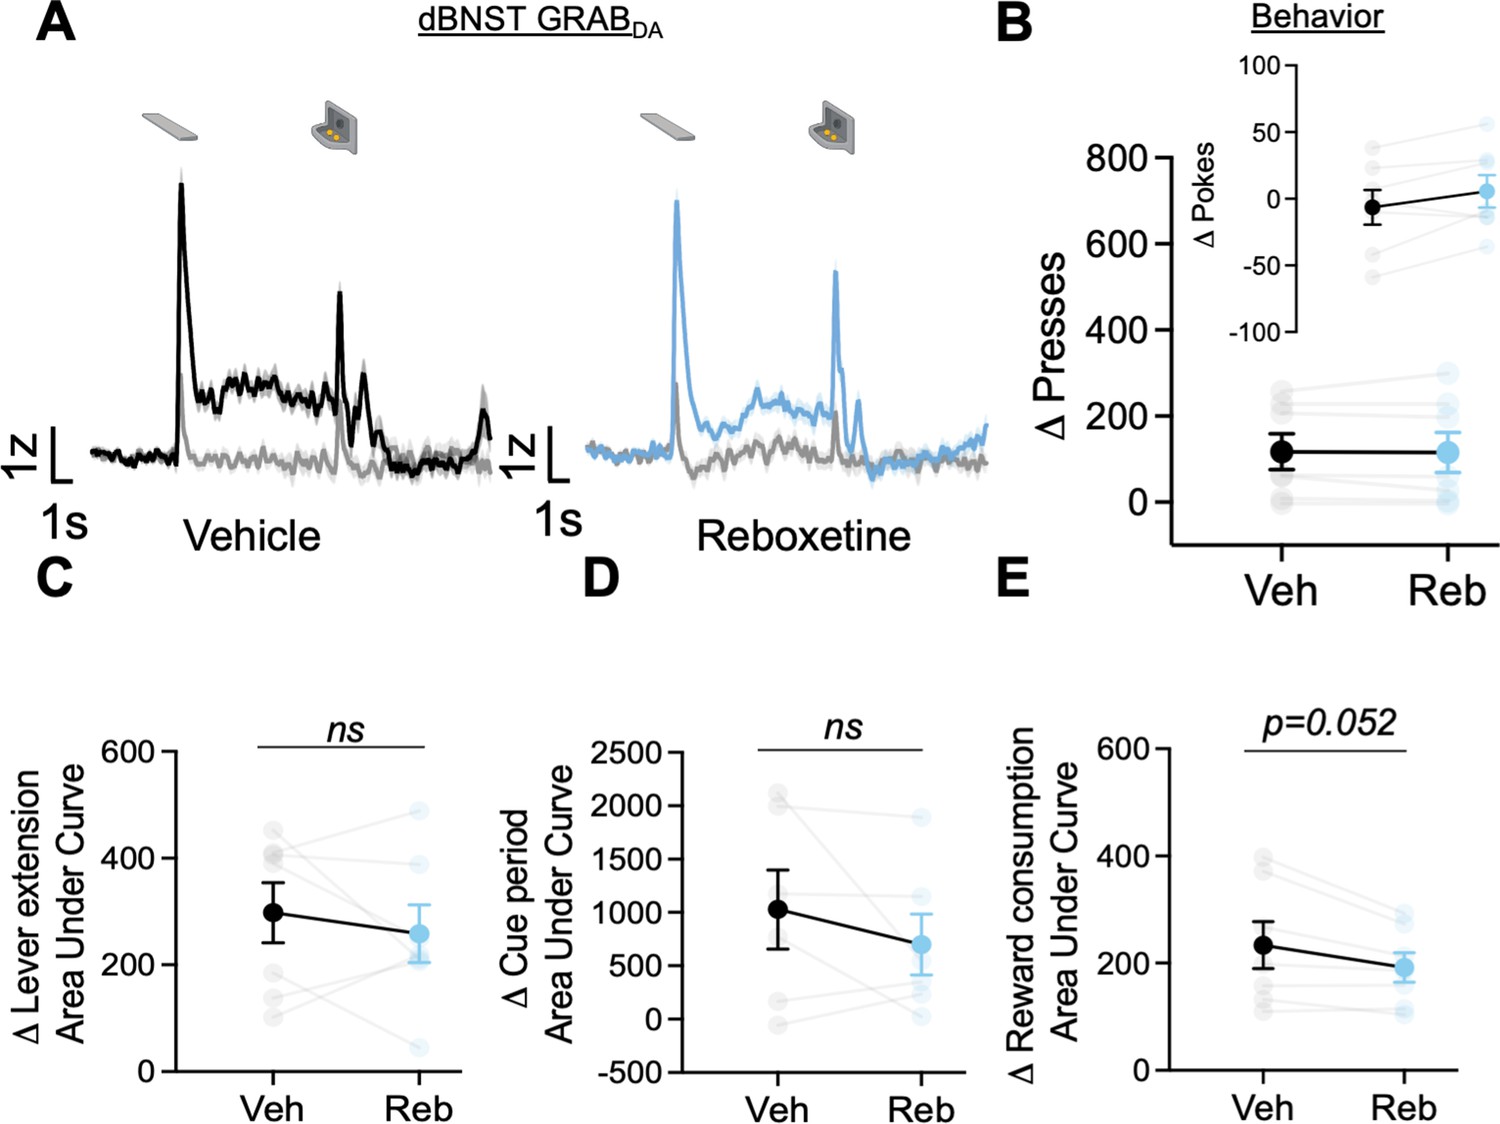
Norepinephrine reuptake blocker, Reboxetine doesn’t alter Pavlovian lever autoshaping (PLA) behavior or GRABDA signals.
(A) Trial-averaged GRABDA signal change (z-scored ∆F/F) and (B) Average Δ Presses (CS+) – (CS−) and average Δ pokes (CS+) – (CS−) (inset) when rats were injected with vehicle or Reboxetine during PLA. Trial average quantification of change (CS+) – (CS−) in area under GRABDA z-scored curve (AUC) during (C) lever extension (2 s), (D) cue period (10 s), and (E) reward consumption between vehicle and reboxetine conditions. Data are mean ± SEM. Veh = Vehicle, Reb = Reboxetine.
Figure 2—figure supplement 3
Representative and population graph of signals along with behavior from rats that had correct fiber placement and viral expression but under 2z peak.
(A) Representative heat maps illustrating GRABDA signal changes (z-scores) during CS+ and CS− presentations on Day 1 (top left) and Day 5 (top right) and trial-averaged GRABDA signal change (z-scored ∆F/F) for n=4 rats during CS+ and CS- presentations on Day 1 (bottom left) and Day 5 (bottom right). (B) Average Pavlovian conditioned approach (PCA) scores for sign-trackers (STs) and goal-tracking/intermediates (GT/INTs) on Day 1 and Day 5 of PLA. (C) Average Δ Presses (CS+) – (CS−) on Day 1 and Day 5. (D) Average Δ Pokes (CS+) – (CS−) on Day 1 and Day 5.
Figure 2—figure supplement 4
Dopamine signals and behavior from rats that were removed from the study due to food cup entry artifact.
Trial-averaged GRABDA signal change (z-scored ∆F/F) for sign-tracking (ST) (top) and goal-tracking/intermediate (GT/INT) rats (bottom) during CS+ and CS− presentations on (A) Day 1 and (B) Day 5 depicting the food cup entry nose poke artifact during pellet retrieval. (C) Average Pavlovian conditioned approach (PCA) scores for STs and GT/INTs on Day 1 and Day 5 of PLA. (D) Average Δ Presses (CS+) – (CS−) on Day 1 and Day 5. (E) Average Δ Pokes (CS+) – (CS−) on Day 1 and Day 5. (F) Trial averaged quantification Δ lever extension ((CS+) – (CS−); 2 s) GRABDA area under curve (AUC) between STs and GT/INTs. (G) Trial averaged quantification of Δ cue period ((CS+) – (CS−); 10 s) in AUC during cue period between STs and GT/INTs.
Figure 3
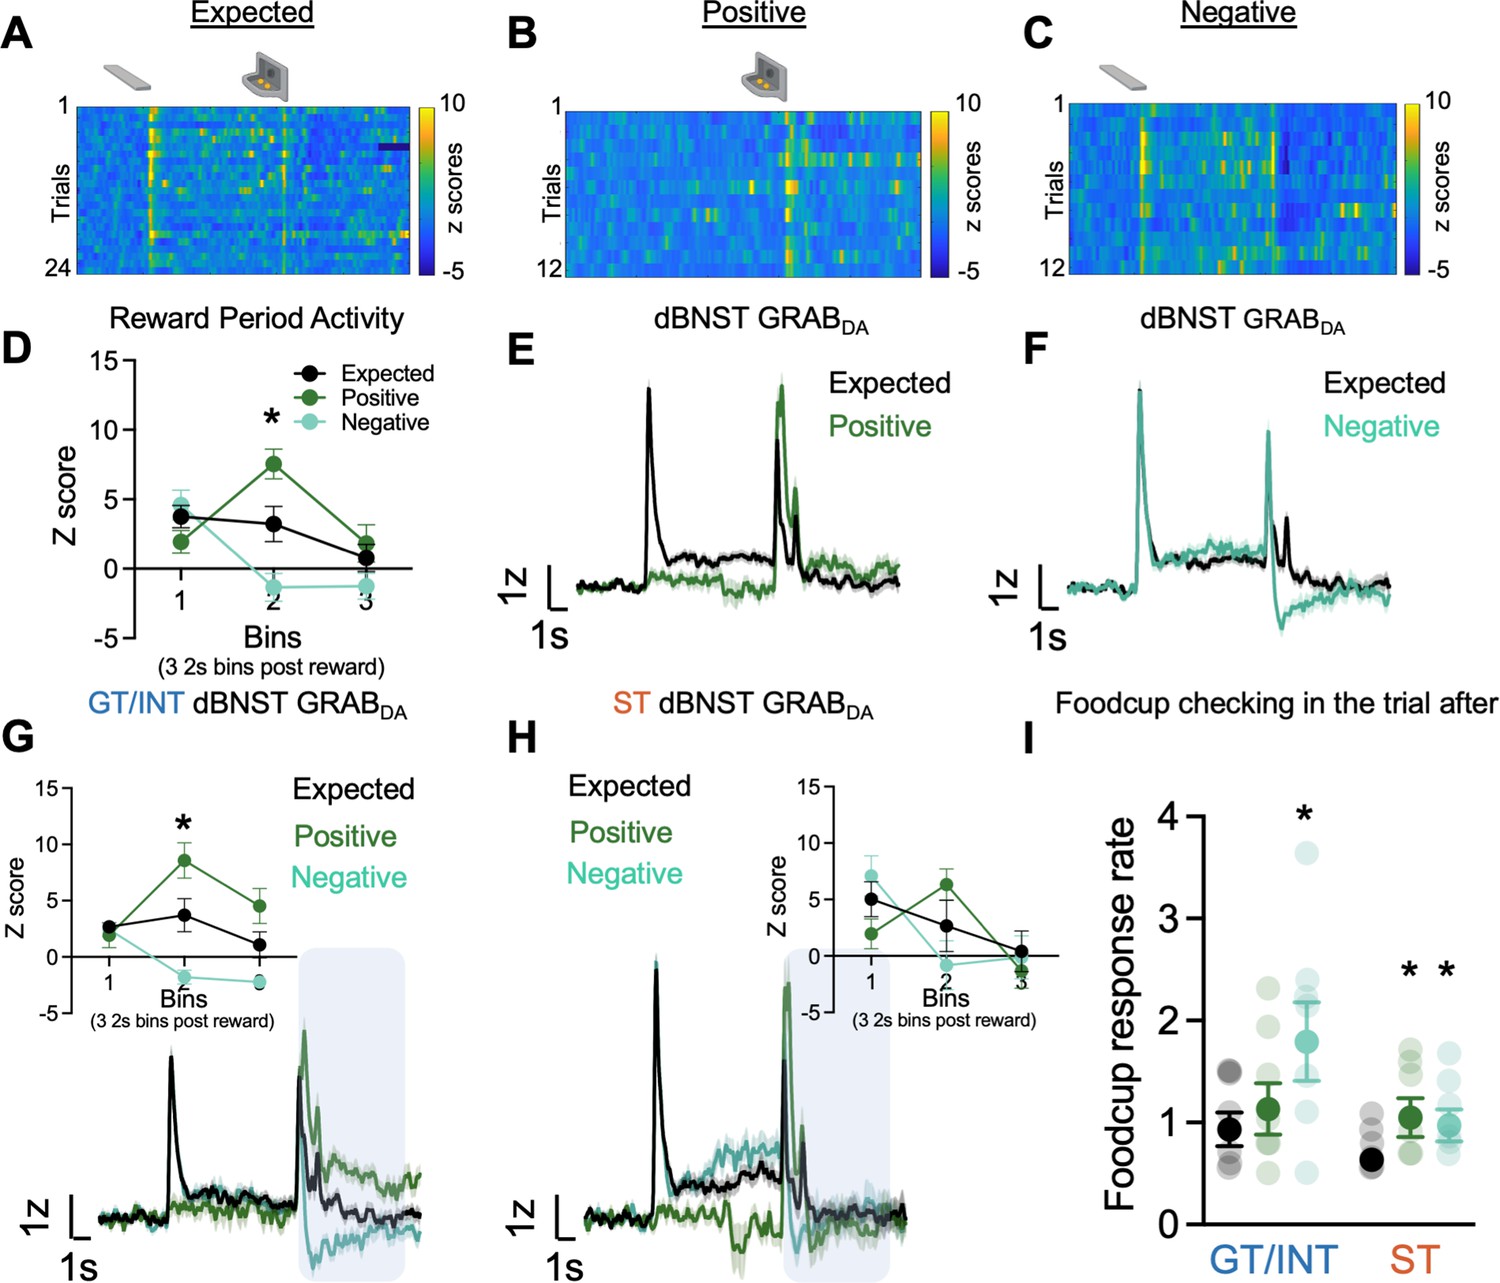
Individual differences in reward prediction error (RPE).
(A–C) Representative heat maps during Expected, Positive (unexpected reward), and Negative (unexpected omission) reward trials. (D) Average binned z-scores (2 s bins) during Expected (N=13), Positive (N=13), and Negative (N=13) trials 6 s post reward delivery (bins 1–3). Trial-averaged GRABDA signal change (z-scored ∆F/F) during (E) Expected vs. Positive trials and (F) Expected vs Negative trials in all rats. Trial-averaged GRABDA signal change (z-scored ∆F/F) during all three trials and average binned z-scores (2 s bins) during Expected, Positive and Negative trials 6 s post reward delivery (bins 1–3) (inset) in (G) goal-trackers/intermediates (GT/INTs) (N=7) and (H) sign-trackers (STs) (N=6). (I) Average food cup checking response rate (responses/10 s) during 10 s pre-trial period on trial after expected, positive, and negative trials in GT/INTs vs. STs. Data are mean ± SEM, *p<0.05.
Figure 4
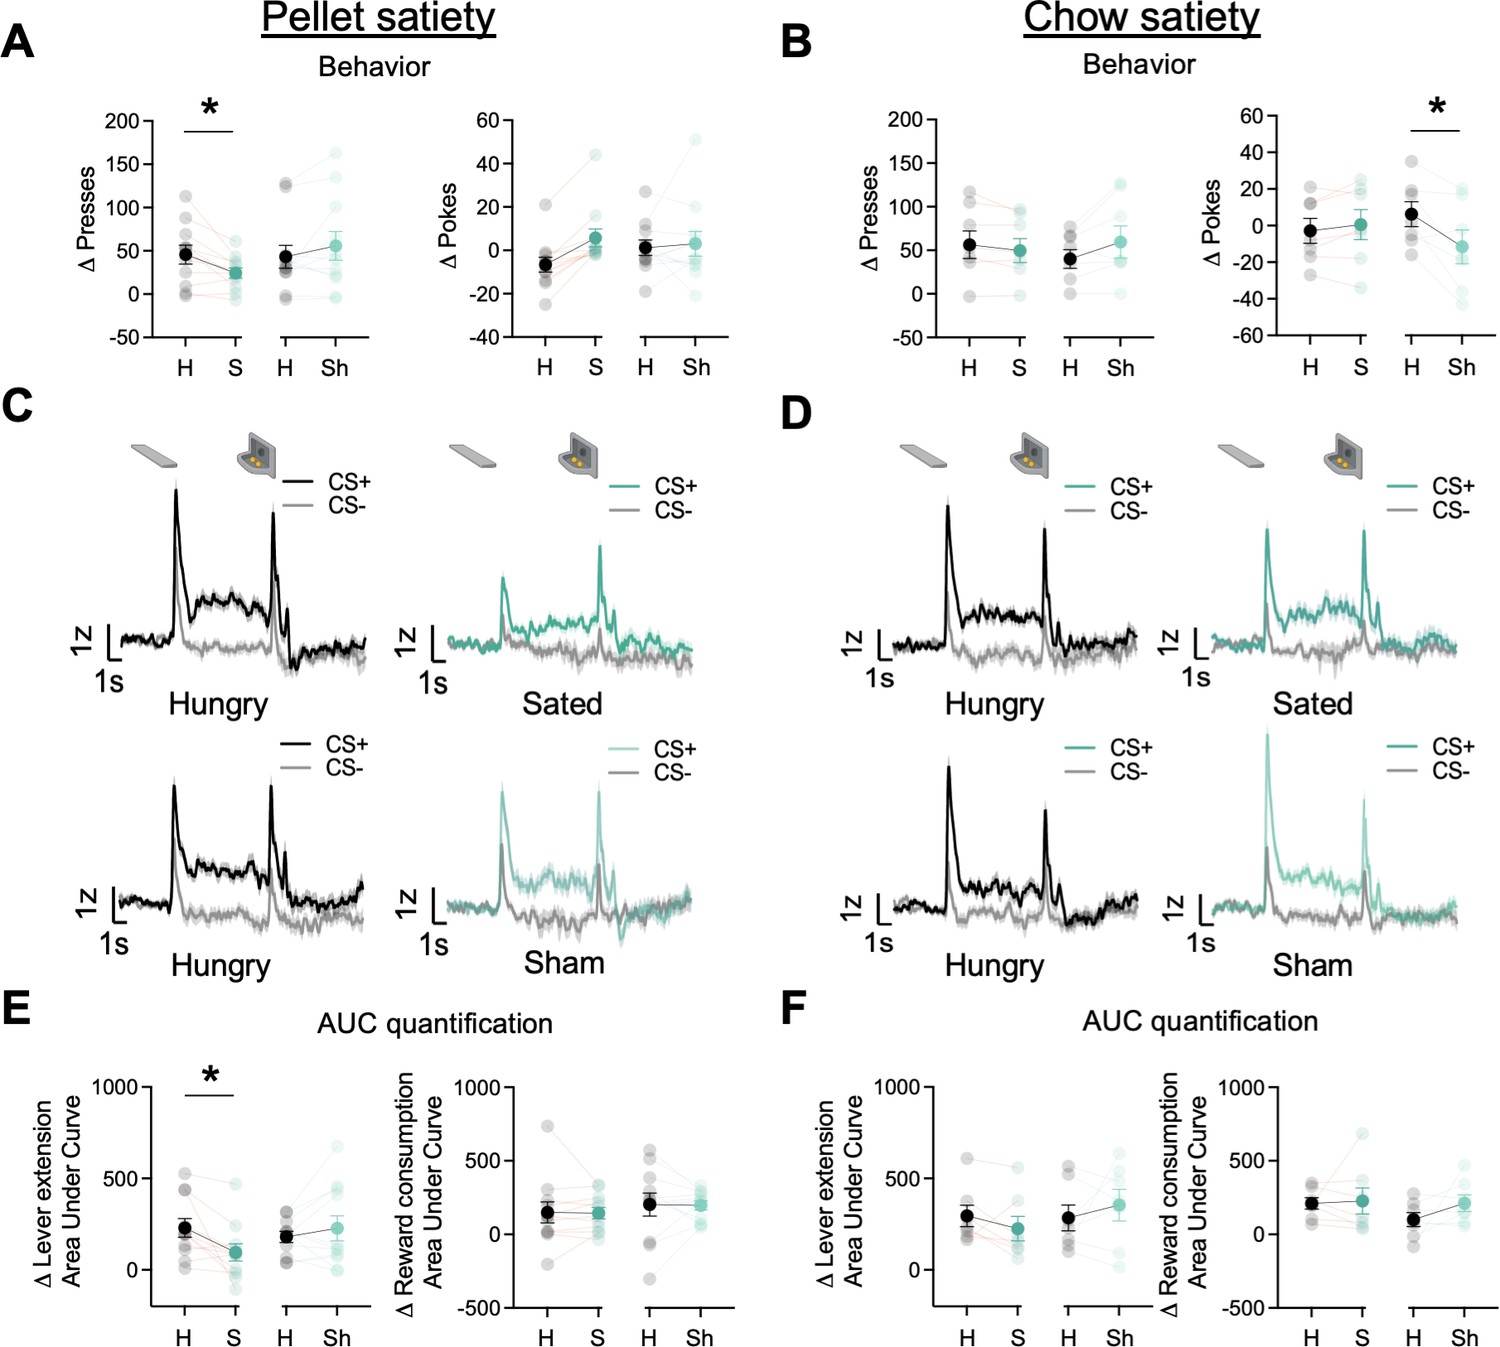
Dorsal bed nucleus of the stria terminalis (dBNST) GRABDA signals attenuate after reinforcer-specific but not general satiety.
(A) Average Δ Presses (CS+) – (CS−) (left) and average Δ pokes (CS+) – (CS−) (right) when rats were either sated on training food pellets in the ramekin or sham-sated (ramekin only). (B) Average Δ Presses (CS+) – (CS−) (left) and average Δ pokes (CS+) – (CS−) (right) when rats were either sated or sham-sated on homecage chow. (C) Trial-averaged GRABDA signal change (z-scored ∆F/F) during CS+ and CS− presentations when rats were hungry versus sated (top) and when rats were hungry versus sham-sated (bottom) on food pellets and (D) on homecage chow. (E) Trial average quantification of change (CS+) – (CS−) in an area under GRABDA z-scored curve (AUC) during lever extension (2 s) (left) and reward consumption (right) between food pellet sated and sham and (F) between homecage chow sated and sham conditions. Data are mean ± SEM, *p<0.05. H=Hungry, S=Sated, Sh = Sham conditions.
Figure 5
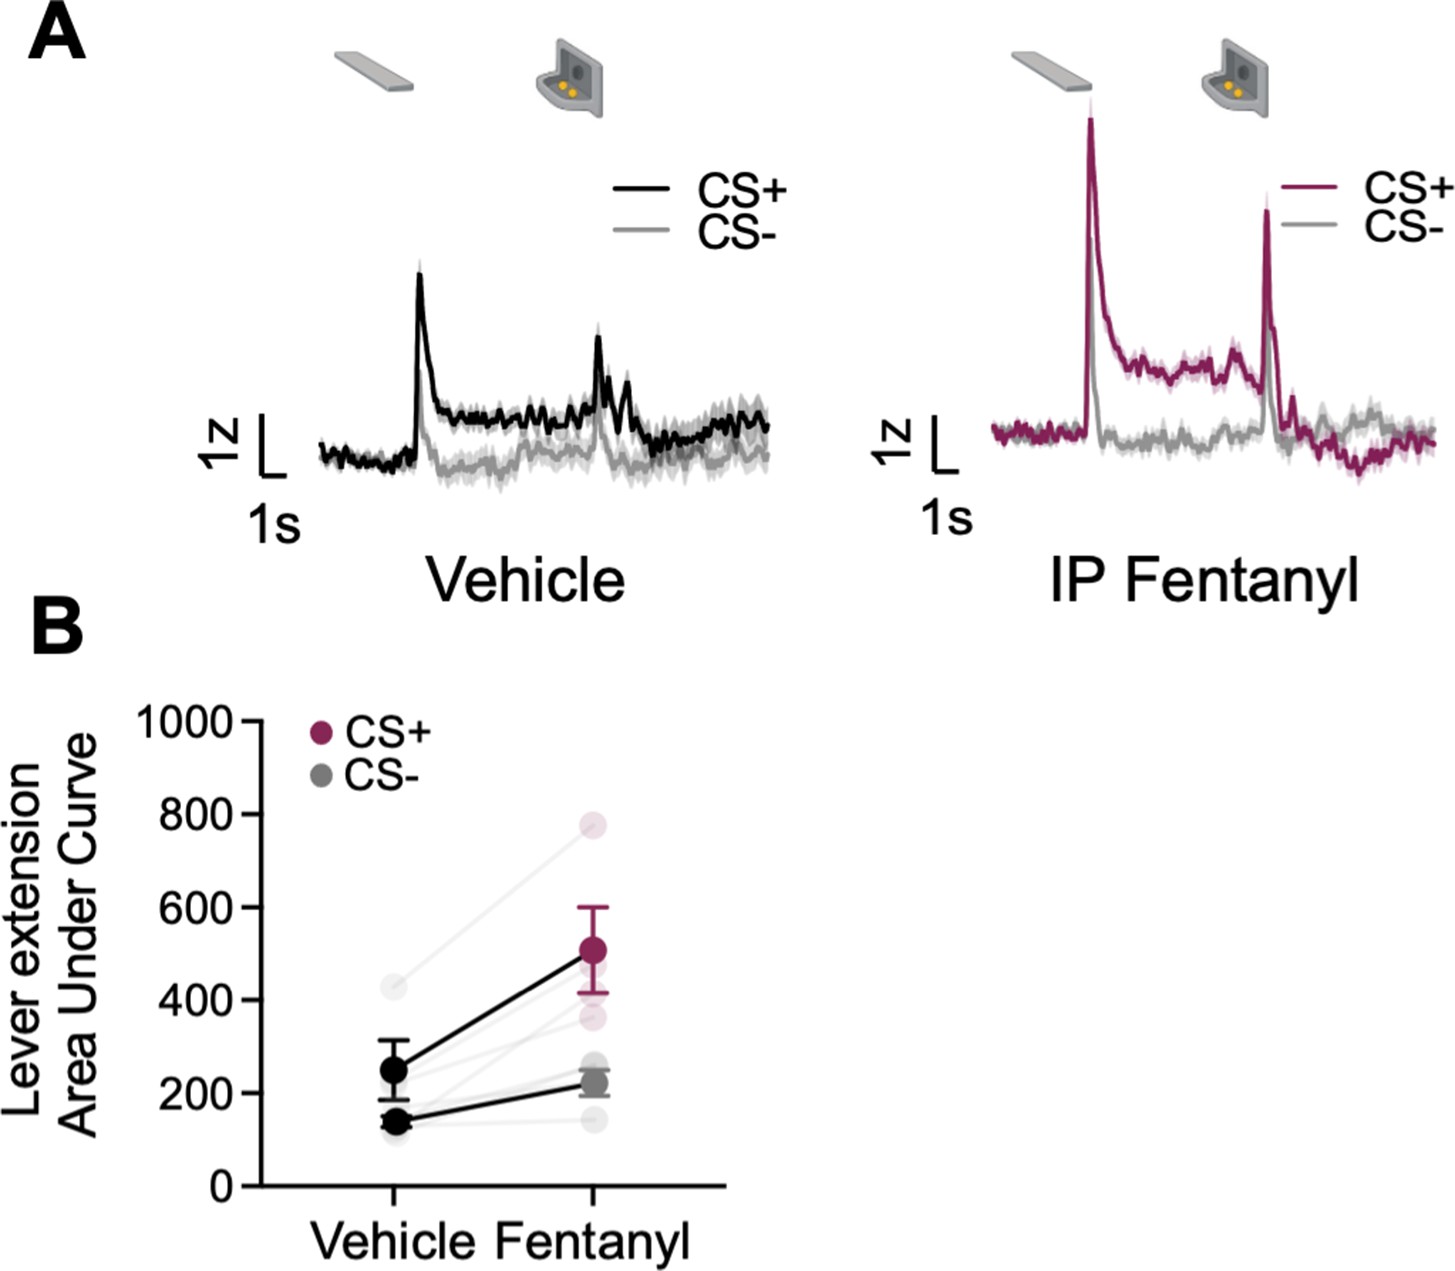
Systemic administration of fentanyl results in the potentiation of dorsal bed nucleus of the stria terminalis (dBNST) dopamine.
(A) Trial-averaged GRABDA signal change (z-scored ∆F/F) when rats were injected with vehicle (left) or fentanyl (right) during Pavlovian lever autoshaping (PLA) (B) Trial average quantification of the area under GRABDA z-scored curve (AUC) during CS+ and CS− lever extension (2 s) between vehicle and fentanyl conditions. Data are mean ± SEM, *p<0.05.
Author response image 1

Tables
Key resources table
| Reagent type (species) or resource | Designation | Source or reference | Identifiers | Additional information |
|---|---|---|---|---|
| Transfected construct (H. sapiens) | AAV9.hsyn.DA4.4.eyfp | WZ Biosciences | h-D03 | Titer >1.0 × 10E13GC/mL |
| Chemical compound, drug | Fentanyl | Cayman Chemicals | Cat: 22659 | |
| Chemical compound, drug | Reboxetine Mesylate | MedChemExpress | Cat: HY-14560C | |
| Chemical compound, drug | TCS | Access Technologies | Cat: TCS-04 | |
| Chemical compound, drug | Paraformaldehyde | Sigma | Cat: P6148 | |
| Software, algorithm | MED-PC IV | Med Associates | RRID: SCR_012156 | Version: IV |
| Software, algorithm | Excel | Microsoft | RRID: SCR_016137 | |
| Software, algorithm | SPSS | IBM | RRID: SCR_019096 | Version: 26 |
| Software, algorithm | Matlab | Mathworks | RRID: SCR_001622 | Version: 2020 a |
| Software, algorithm | Graphpad Prism | Graphpad Software | RRID: SCR_002798 | Version: 9 |
| Software, algorithm | Synapse Software | Tucker-Davis Technologies | RRID: SCR_006495 | |
| Other | LED Driver | ThorLabs | Cat: DC4100 | LED Driver capable of driving high-power four-wavelength LED sources simultaneously with a current range between 0 and 1000 mA |
| Other | Fluorescence Minicube | Doric | Cat: ilFMC4-G2_IE(400-410)_E(460-490)_F(500-550)_S | Fluorescence Mini Cube with 4 ports: one port for the functional fluorescence excitation light, one for the isosbestic excitation, one for the fluorescence detection, and one for the sample |
| Other | Fiber optic patchcord | Doric | D202-4094-3 | MFP_400/430/LWMJ-0.48_3 m_FCM-MF2.5 |
| Other | Fiber optical cannula | ThorLabs | Cat: CFMC54L10 | Ceramic ferrule Ø400 µm core, 0.50 NA fiber that is flat cleaved to a length 10 mm |
| Other | Metabond powder | Parkell | Cat: S396 | See Virus and fiber optic implantation surgery for more details |
| Other | Metabond quick base | Parkell | Cat: S398 | See Virus and fiber optic implantation surgery for more details |
| Other | Metabond catalyst | Parkell | Cat: S371 | See Virus and fiber optic implantation surgery for more details |
| Other | Dental Cement | DenMat | Cat: 034524101 | See Virus and fiber optic implantation surgery for more details |
| Other | Dental Cement Catalyst | DenMat | Cat: 4506 | See Virus and fiber optic implantation surgery for more details |
| Other | Sucrose pellets | Test Diet | 5TUL; Cat: 1811155 | Purified ingredient rodent tablet, protein: 20.6%, fat: 12.7%, carbohydrate: 66.7% |
Additional files
Download links
A two-part list of links to download the article, or parts of the article, in various formats.
Downloads (link to download the article as PDF)
Open citations (links to open the citations from this article in various online reference manager services)
Cite this article (links to download the citations from this article in formats compatible with various reference manager tools)
Dopamine in the dorsal bed nucleus of stria terminalis signals Pavlovian sign-tracking and reward violations
eLife 12:e81980.
https://doi.org/10.7554/eLife.81980


