Circuit mechanisms underlying embryonic retinal waves
- Helen Wills Neuroscience Institute, University of California, Berkeley, United States
- Department of Molecular and Cell Biology, University of California, Berkeley, United States
- School of Optometry, University of California, Berkeley, United States
Figures
Figure 1 with 3 supplements

Spatiotemporal characteristics of embryonic waves.
(A) Schematized cross section of an E16 retina when stage 1 waves begin. Green cells represent post-mitotic retinal ganglion cells (pRGCs). Magenta cells represent post-mitotic amacrine cells (pACs). Gray cells represent progenitor cells (PCs). GCL, ganglion cell layer; IPL, inner plexiform layer; INL, inner nuclear layer; NBCL, neuroblastic cell layer. (B) Top left: macroscope image of the baseline fluorescence of an E17 GCaMP6s retina. For subsequent analysis, the retina was divided into 11,750 10 µm × 10 µm (not drawn to scale) squares. Number of ROIs changed depending on retina size. Top: ∆F/F traces of calcium transients from four example 10 µm × 10 µm ROIs. Middle: rasterized calcium transients for all ROIs raster plot of calcium transients >50% ∆F/F. Bottom: percentage of ROIs active throughout the time course of the recording (1 hr). (C) Histogram showing the distribution of the percent of ROIs with inter-transient-intervals (ITIs) ranging from 0 to 200 s. (D) Left: heatmap showing the temporal progression and spread of four example waves. Scale depicts timescale of propagation; dark gray = start of propagation and white = end of propagation. Right: histogram showing the distribution of waves with an area ranging from 0 to 100% of the retina. (E) Summary plot of wave speeds. Red dot and line = mean and standard deviation, respectively. n = 30 waves, three retinas, three mice.
-
Figure 1—source data 1
Inter-transient-interval, wave area, and wave speed.
- https://cdn.elifesciences.org/articles/81983/elife-81983-fig1-data1-v3.xlsx
Figure 1—figure supplement 1
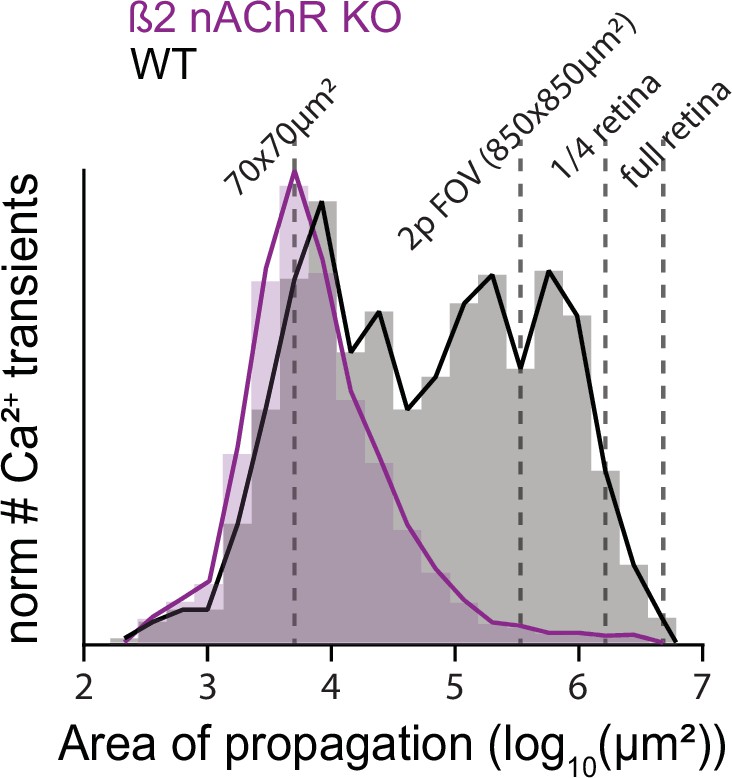
Distribution of stage 1 wave sizes.
Histogram showing the distribution of wave sizes for WT and β2-nAChR-KO mice. This analysis was performed using a novel algorithm that segments any activity on retinas imaged under a microscope. This algorithm can detect calcium activity as small as a few co-active neighboring cells (log10(20 × 20 µm2) = 3) to continuous waves that propagate across the entire embryonic retina (log10(2500 × 2500 µm2) = 6.8).
Figure 1—figure supplement 2
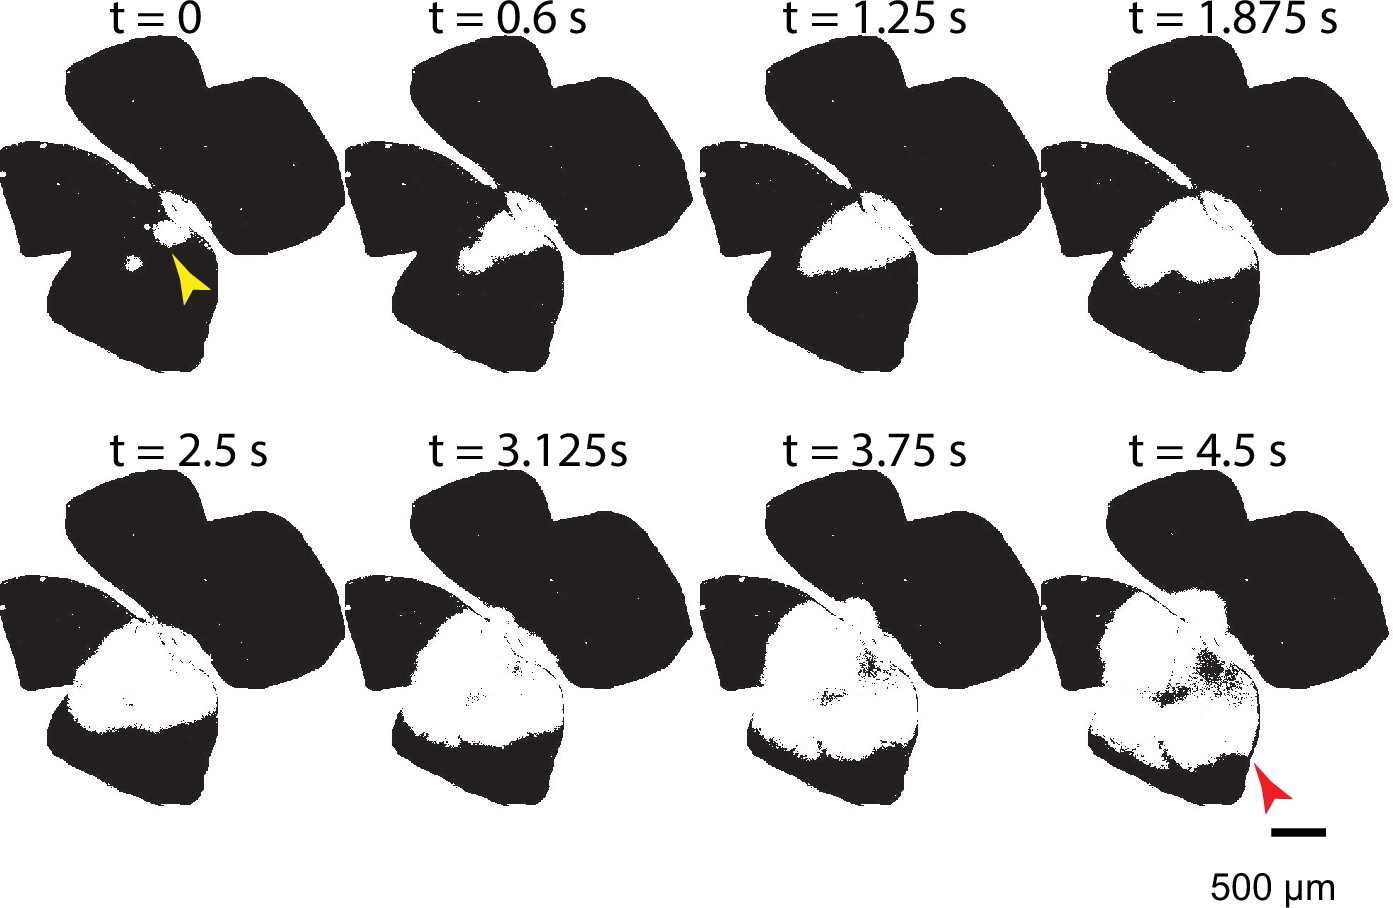
Average wave speed measurement.
Temporal progression of a large stage 1 wave in WT control conditions. The average wave speed was calculated by measuring the distance between two points: the first point was marked at a random location on the edge of area defined early in the wave event (yellow arrowhead; initiation spot); the second point was located at the wave edge that was parallel to the direction of propagation of the wavefront at the yellow arrowhead (red arrowhead). The speed was then calculated by dividing this distance by the propagation time of the wave.
Figure 1—figure supplement 3
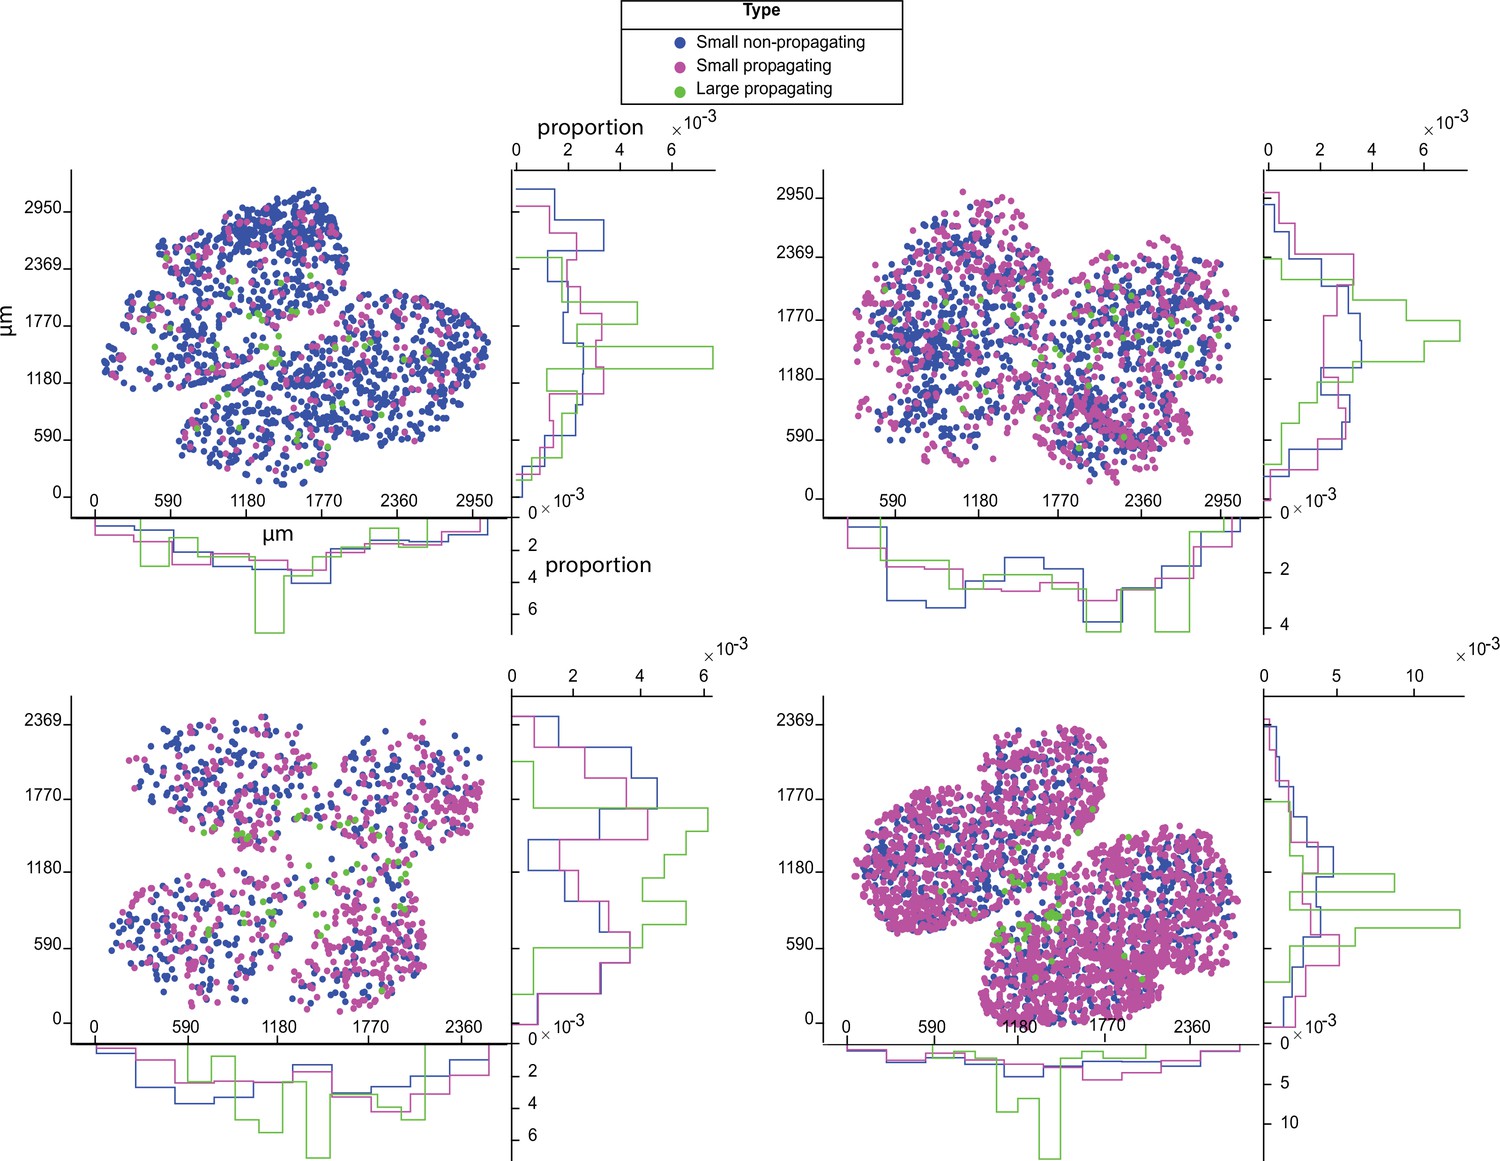
Distribution of stage 1 wave initiation sites.
Scatter plots and histogram showing the distribution of initiation sites for small non-propagating events (blue), small propagating waves (magenta), and large propagating waves (green) across four E18 Vglut2;GCaMP6s retinas. X-axes for the scatter plots and histograms = μm. Each recording was 1 hr. Y-axes for scatter plots = μm. Y-axes for histograms = proportion of initiation sites.
Figure 2 with 1 supplement
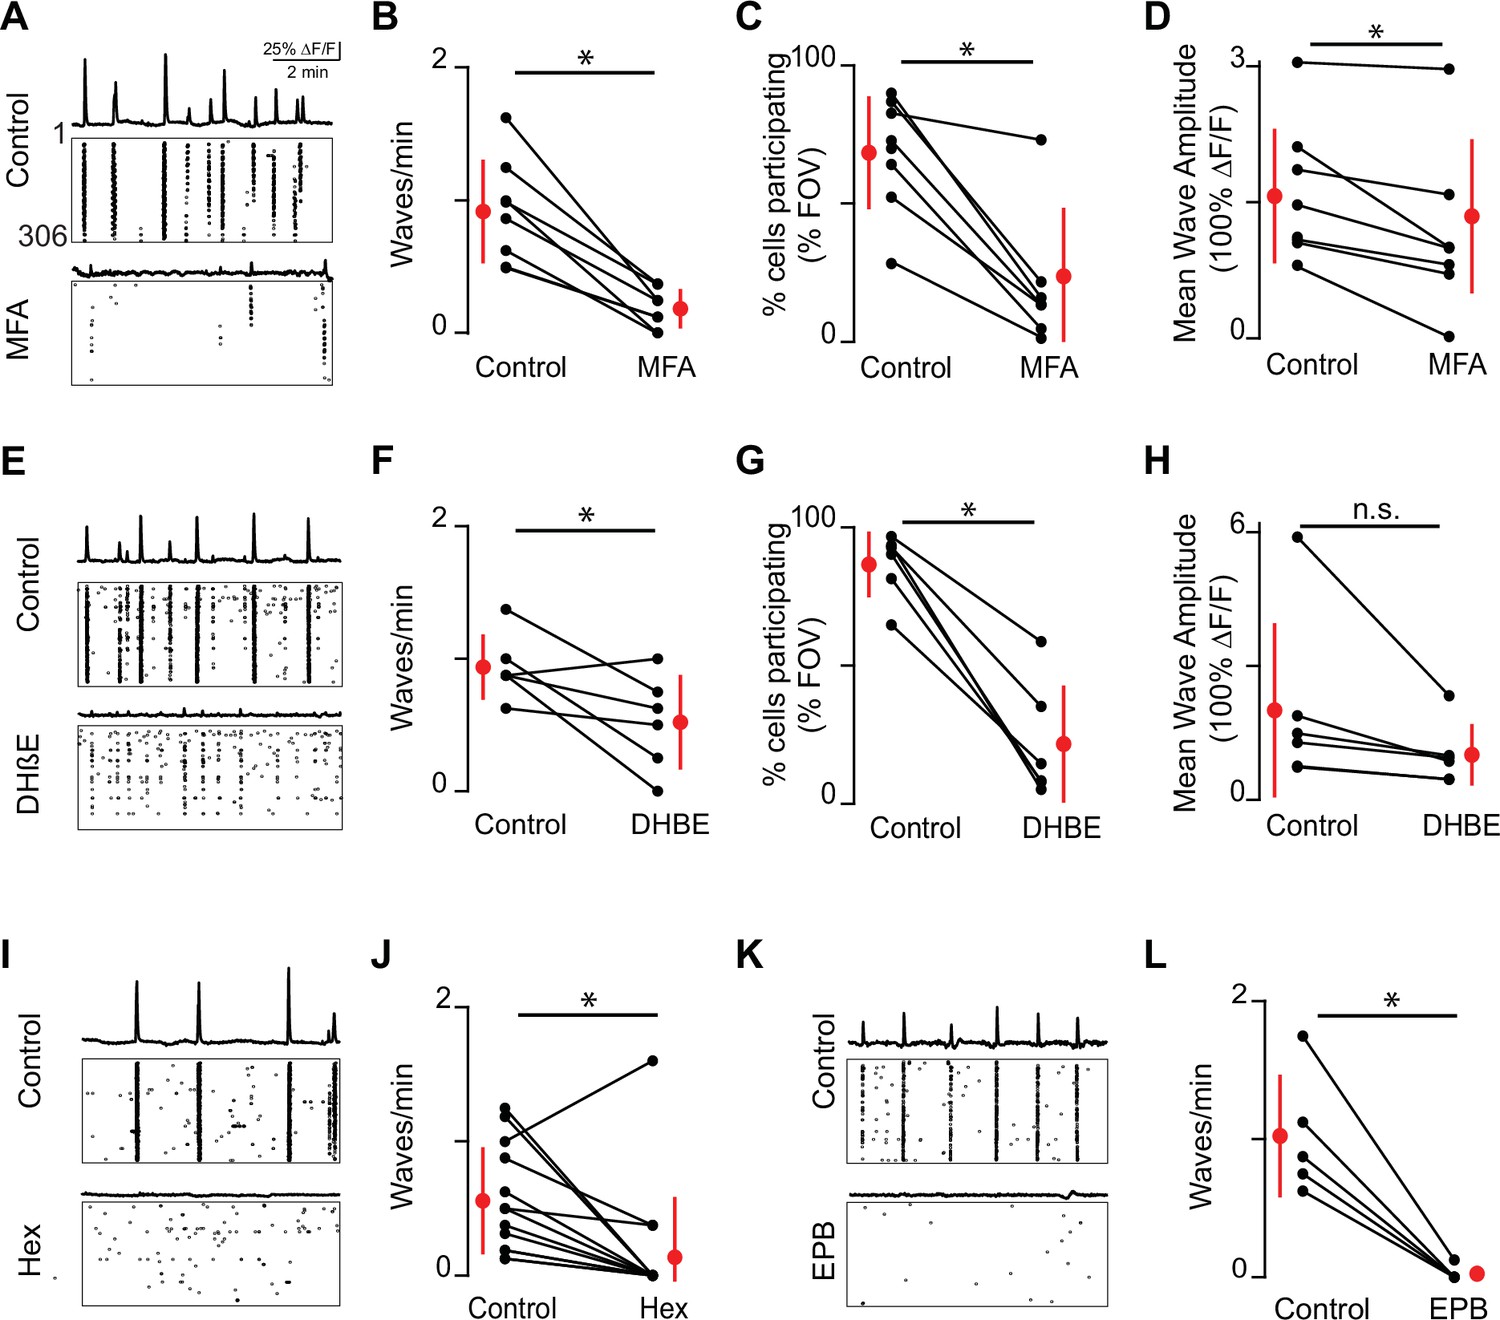
Embryonic waves are mediated by gap junction and cholinergic circuits.
(A) ∆F/F time course of spontaneous activity observed in the field of view (FOV) and raster plot of neuronal calcium transients in ACSF (control condition, top) and in the presence of meclofenamic acid (MFA) (bottom). (B) Summary plot showing frequency of waves in control and MFA. Red dots and lines = mean and standard deviation, respectively. Asterisks represents significant effects. n = 8 retinas (six mice); p=4.81e–4. (C) Percent cells that participate in retinal waves in control and MFA (50 µM) (p=3e–3). (D). Mean calcium response of the neurons that participate in waves in control and MFA (p=0.02). (E–H) Same as (A–D) for dihydro-β-erythroidine (DHβE, 8 μM). (F–H) (n = 6 retinas; six mice); (F) p=0.05; (G) p=4.58e–4; (H) p=0.09. (I, J) Same as (A, B) but with hexamethonium (Hex, 100 µM) following a baseline recording. n = 14 retinas (nine mice); p=1.48–2. (K–L) Same as (A, B) but with epibatidine (EPB, 10 nM) following a baseline recording. n = 5 retinas (five mice); p=4.8e–3. All statistical tests here are paired t-tests.
-
Figure 2—source data 1
Event frequency.
- https://cdn.elifesciences.org/articles/81983/elife-81983-fig2-data1-v3.xlsx
Figure 2—figure supplement 1
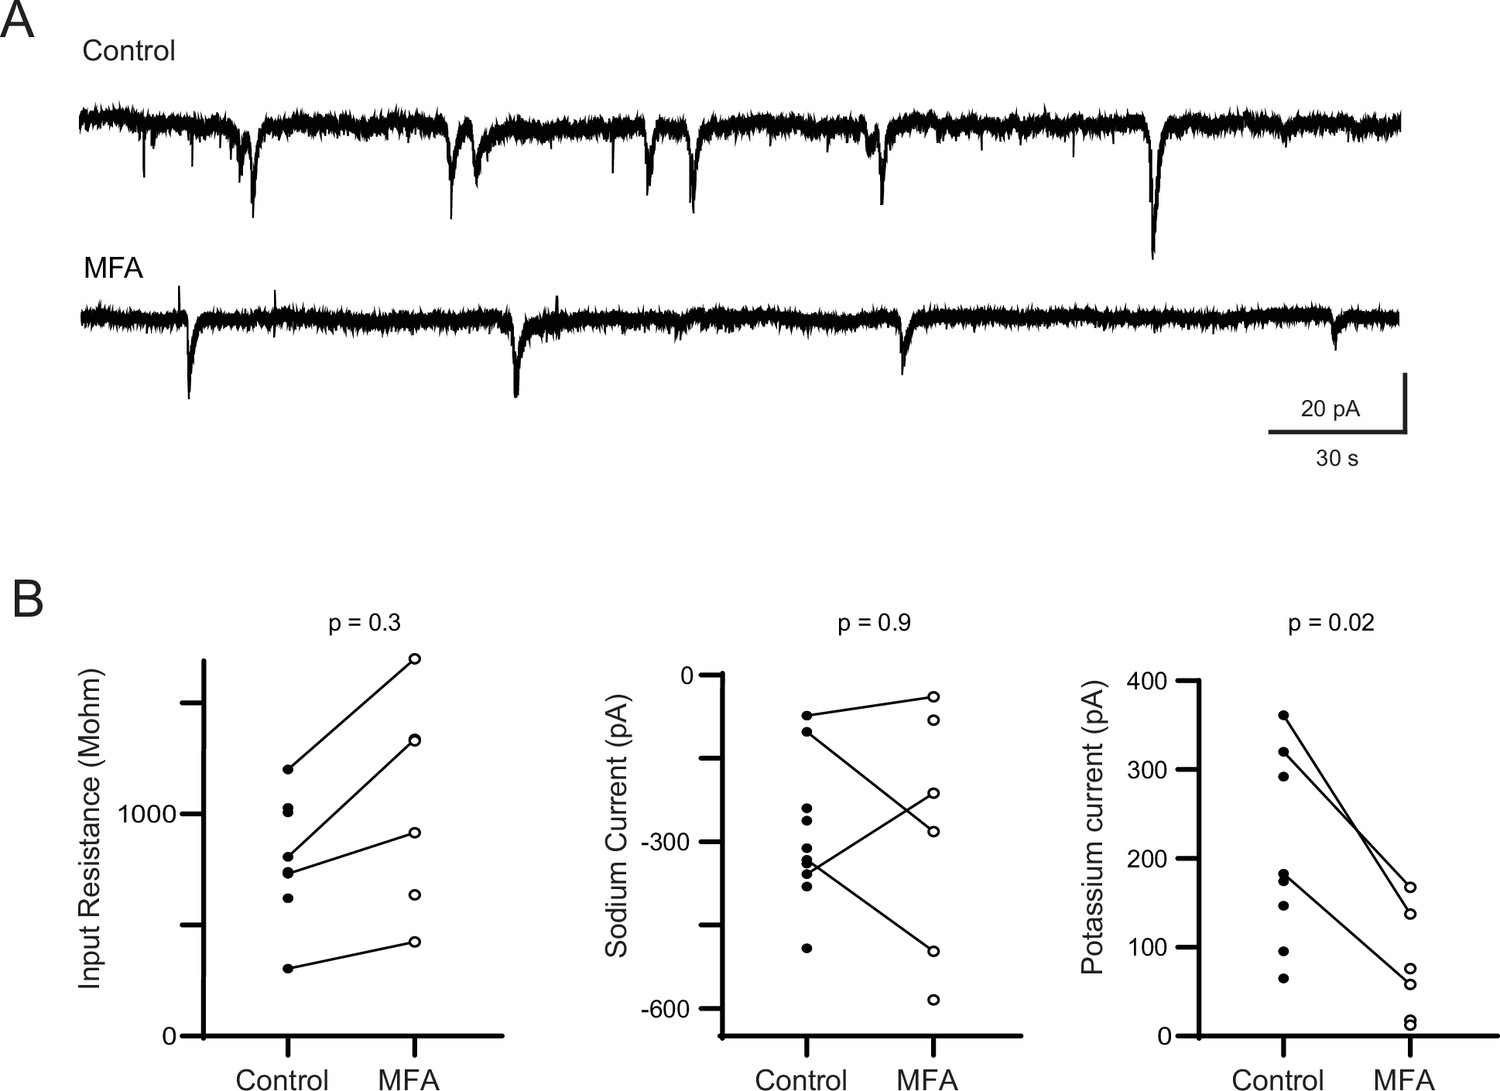
Controls for off-target effects of meclofenamic acid (MFA) on E16–18 retinal ganglion cells (RGCs).
(A) Example voltage-clamp recordings from presumptive retinal ganglion cells held at –70 mV in control solutions and after 10–20 min in 50 µM MFA. We observed periodic compound EPSCs that are likely representative of retinal wave events in both conditions (7/7 cells in control; 5/8 cells in MFA). (B) Summary data showed the impact of bath application of MFA on input resistance (left), voltage-gated sodium channels (middle), and potassium channels (right) activated by abrupt changes in the holding potential. The lines connect recordings that were paired – namely control and MFA application were conducted in the same cell. We observed a small increase in input resistance, consistent with a blockade of gap junctions. The variance in the voltage-gated sodium channel is consistent with the tremendous variability of ability of RGCs to fire action potentials at this young age, when different RGC types are maturing at different rates (Rothe et al., 1999). Statistical significance was assessed based on unpaired t-test. Methods for voltage-clamp recordings: Whole-mount retinas were held in the recording chamber by a harp and visualized using a Kohler illumination system mounted below the objective of the microscope. Presumptive RGCs were identified by their location in the immature ganglion cell layer. A hole was pierced in the inner limiting membrane of the retina using a glass recording pipette to access the RGC layer. RGCs were targeted under control of a micromanipulator (MP-225, Sutter Instruments). Recording pipettes were fabricated using a vertical puller (Narishige PC-10) and had a tip resistance of 6–7 MU. Internal solution for voltage-clamp recordings was, in mM: 116 K+D-gluconate, 6 KCl, 2 NaCl, 20 HEPES, 0.5 EGTA, 4 ATP-Mg2+, 0.3 GTP-Na3, 10 phosphocreatine-Na2. Data were acquired using Clampex 10.2 recording software with a Multiclamp 700A amplifier (Molecular Devices) and a Digidata 1322A digitizer (Axon Instruments). Voltage-clamp recordings were sampled at 10 kHz. Input resistance was computed by measuring the change in holding current in response to a –10 mV voltage change. Voltage-gated sodium currents were measured as the maximum inward current evoked by step depolarizations to between –30 or –20 mV. Potassium currents were measured as the sustained current after step depolarizations to –10 mV (Rothe et al., 1999).
Figure 3 with 1 supplement

β2-nAChR-KO mice have reduced stage 1 wave activity.
(A) Top: area plot summarizing the percentage of ROIs active throughout the time course of the recording; bottom: raster plots of ROI calcium transients across conditions. Black: WT control; magenta: β2-nAChR-KO control; teal: β2-nAChR-KO in Hex; yellow: β2-nAChR-KO in meclofenamic acid (MFA). (B) Heatmap showing the temporal progression of a propagating event observed using epifluorescent calcium imaging on the macroscope across experimental conditions. Scale depicts timescale of propagation; dark colors = start of propagation; white = end of propagation. (C) Histogram showing the distribution of the percent of ROIs with inter-transient-intervals (ITIs) ranging from 0 to 200 s. Bars represent summary data across all retinas. Black bars are same data as Figure 1C. Dots represent distributions for individual retinas. mean IEI/ROI in WT and β2-nAChR-KO retinas in control conditions. (D-E) Violin plots summarizing the distribution of mean IEI/ROI (D) and event area (E) across experimental conditions. n = 4 retinas, four mice (WT), n = 5 retinas, five mice (β2-nAChR-KO). Black bar = mean; red bar = median. **p<0.01, *p<0.05. One-way ANOVA, followed by Tukey–Kramer post hoc test . (F) Summary plot of wave speeds. WT are the same data as Figure 1E. Red dot and line = mean and standard deviation, respectively. n = 30 waves, three retinas, three mice per condition p=1.19e–6. Unpaired t-test.
-
Figure 3—source data 1
Inter-transient-interval, wave area, and wave speed: WT vs. β2-nAChRKO.
- https://cdn.elifesciences.org/articles/81983/elife-81983-fig3-data1-v3.xlsx
Figure 3—figure supplement 1
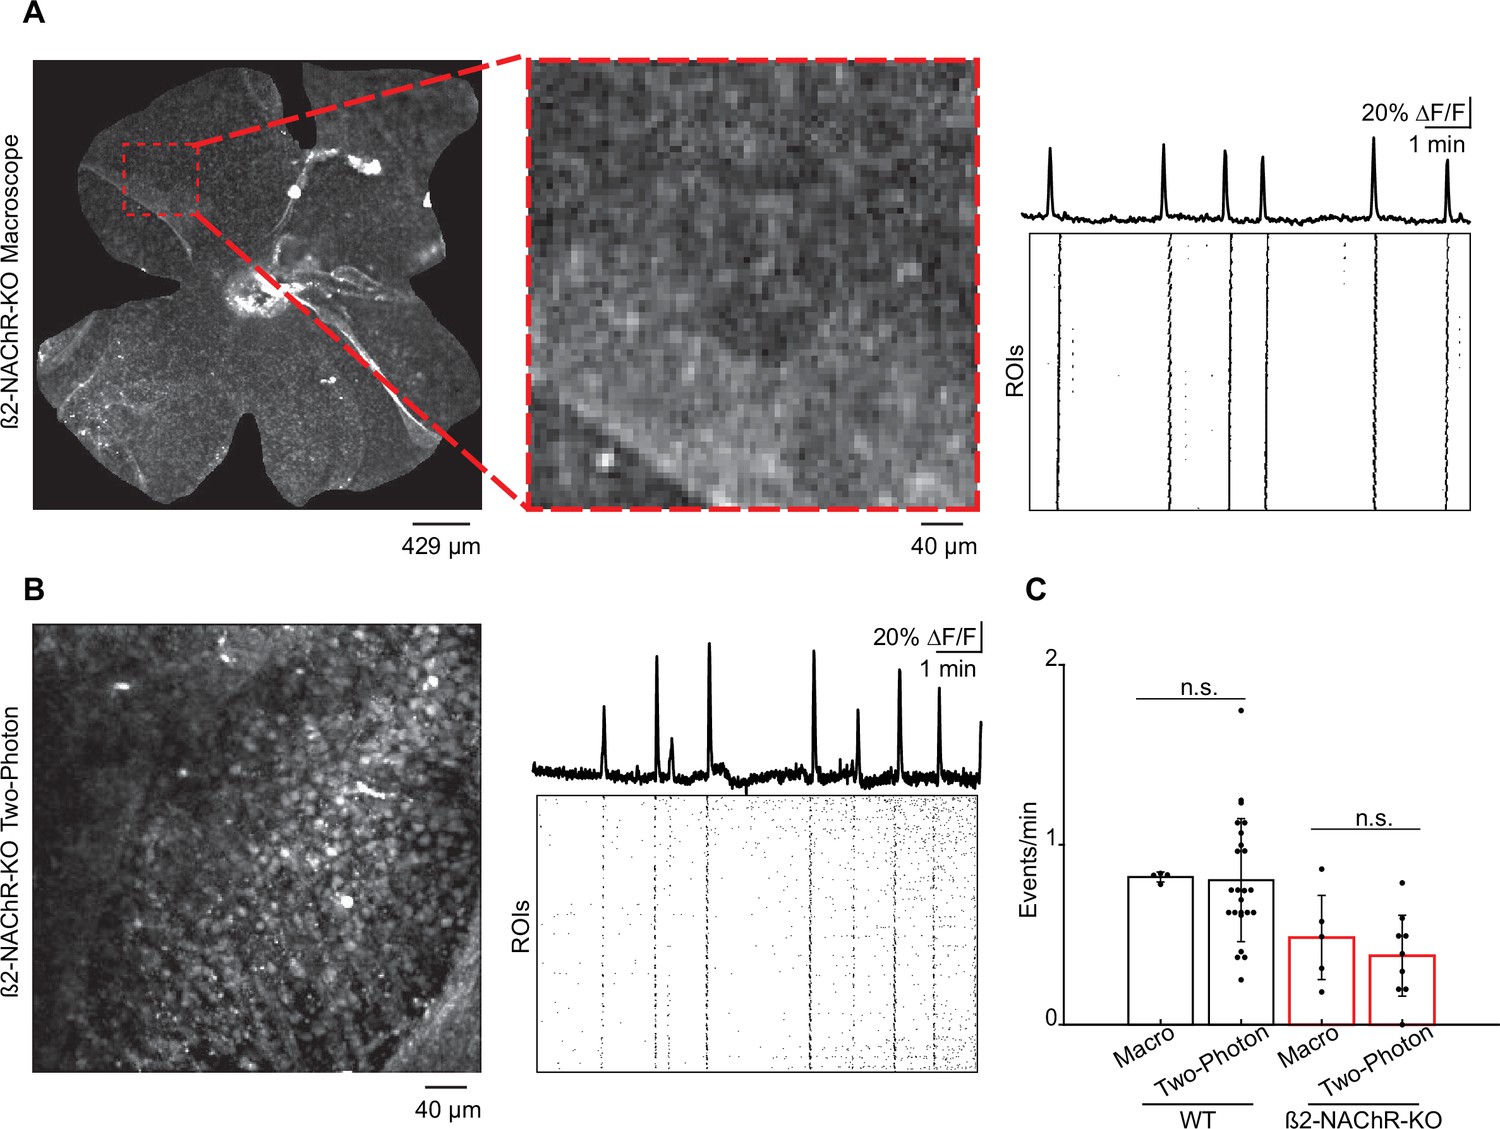
Frequency of stage 1 waves in WT and β2-nAChR-KO retinas recorded on the macroscope vs. the two-photon microscope.
(A) Left: example field of view (FOV), whole-mount β2-nAChR-KO, on the macroscope. Red dashed square = 425 μm2 FOV, equivalent to two-photon FOV. Middle: magnified FOV. Right: normalized fluorescent traces showing Ca2+/wave activity and raster plot summarizing Ca2+/wave activity across 864 square ROIs (10 μm × 10 μm) on the macroscope. (B) Left: example FOV, whole-mount β2-nAChR-KO, on the two-photon microscope. Right: normalized fluorescent traces showing Ca2+/wave activity and raster plot summarizing Ca2+/wave activity across 864 square ROIs (10 μm × 10 μm) on the two-photon microscope. (C) Bar graph showing frequency of events on the macroscope and two-photon microscope in WT and β2-nAChR-KO. WT: n = 4 retinas (macroscope; average ± SD: 0.82 ± 0.03), n = 24 retinas (two-photon; average ± SD: 0.80 ± 0.34), p=0.92. β2-nAChR-KO: n = 5 retinas (macroscope; average ± SD: 0.48 ± 0.23), n = 9 retinas (two-photon; average ± SD: 0.38 ± 0.22), p=0.48.
Figure 4
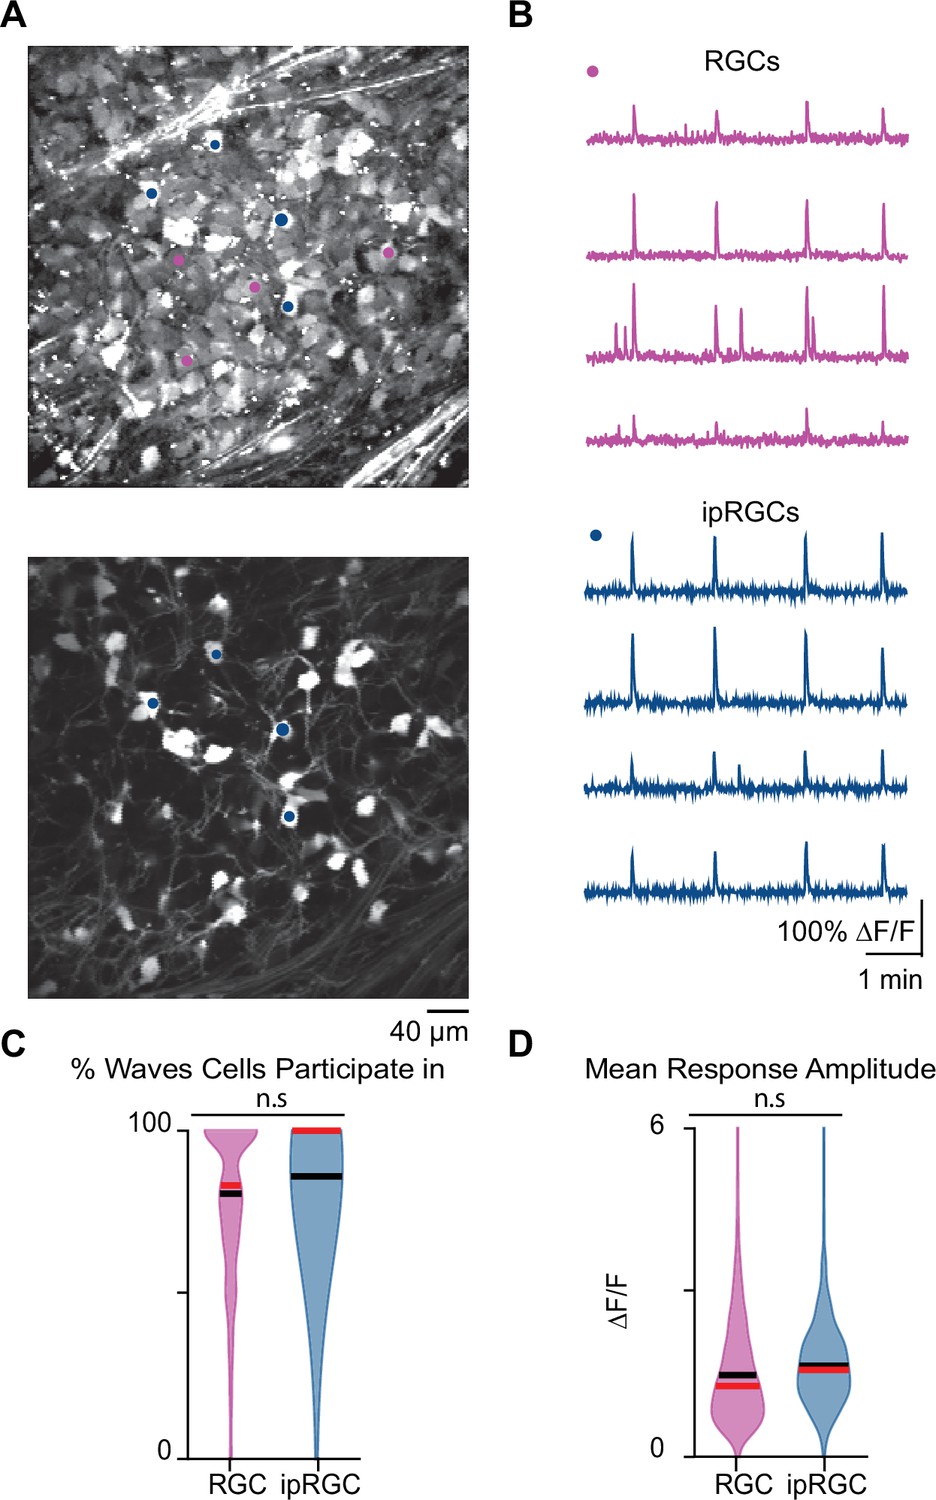
Stage 1 waves robustly recruit intrinsically photosensitive ganglion cells (ipRGCs) and the general retinal ganglion cell (RGC) population.
(A) Top: example field of view (FOV) where pixel intensity was averaged across all frames (712) to get representative image of Cal 520 bath-loaded RGCs. Pink dots correspond to four example RGCs and blue dots correspond to four example ipRGCs Bottom: same example FOV from the top image, with tdTom signal averaged across all frames. Blue dots the same as those in the top image. (B) Top: traces of the four example RGCs marked by the pink circles in (A). Bottom: traces of four example ipRGCs marked by the blue circles in (A). (C) Violin plot of percentage of waves each cell participated in. n = 20 retinas (13 mice); p=0.09. Unpaired t-test. (D) Violin plot of mean event amplitude/cell/FOV. n = 20 retinas (13 mice); p=0.06. Unpaired t-test. Black bar = mean; red bar = median.
-
Figure 4—source data 1
Intrinsically photosensitive ganglion cell (ipRGC) participation and mean response amplitude.
- https://cdn.elifesciences.org/articles/81983/elife-81983-fig4-data1-v3.xlsx
Figure 5
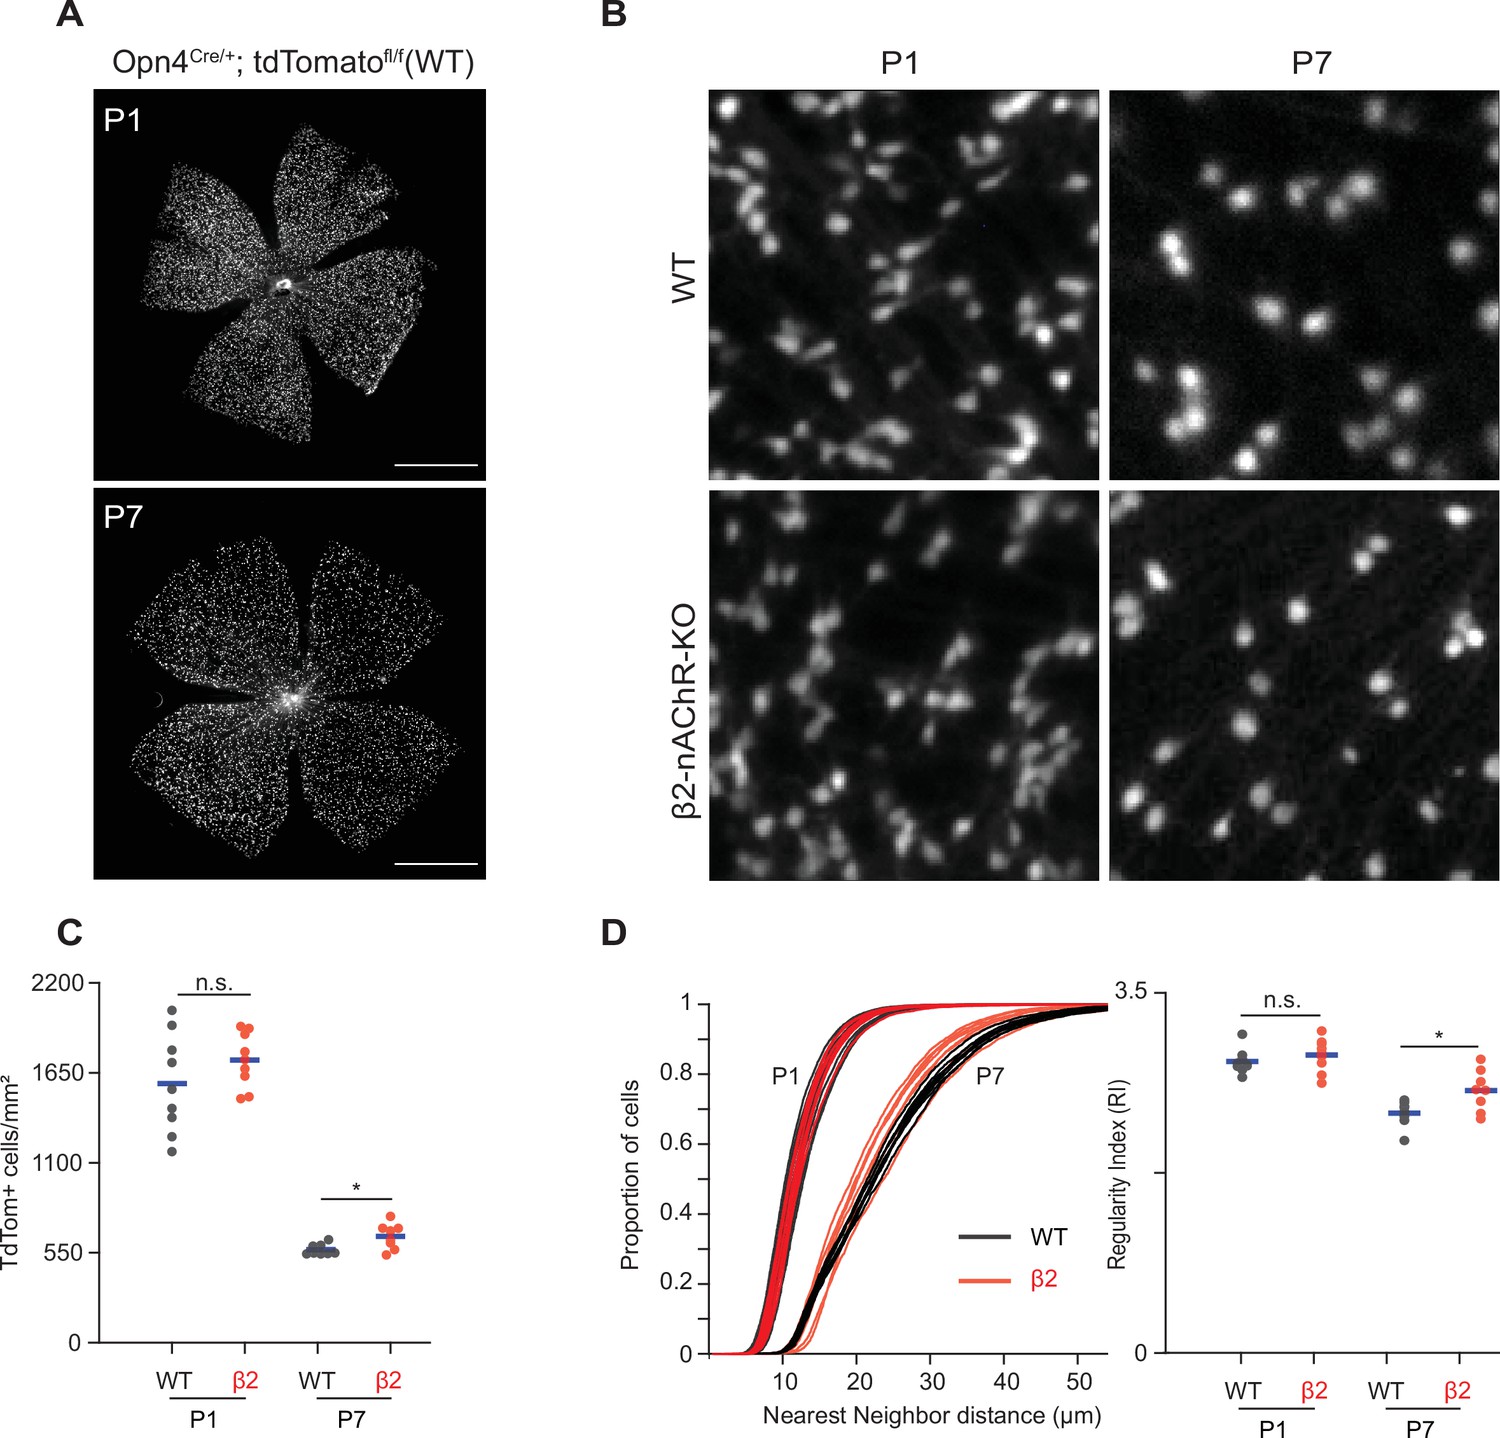
Stage 1 and 2 waves do not contribute to the developmental cell death of intrinsically photosensitive ganglion cells (ipRGCs).
(A) Example epifluorescence images of Opn4Cre/+;Ai9 (WT) retinas at P1 and P7. Scale bars are 500 μm; each field of view is 4.7 × 4.7 mm. (B) Representative 200 × 200 μm2 fields of view for P1 and P7 WT and ß2-nAChR-KO retina. (C) ipRGC densities across different ages and genotypes. P1 WT n = 9 retinas from six mice, P1 ß2-nAChR-KO, 9 retinas, seven mice; P7 WT n = 8 retinas from five mice; P7 ß2-nAChR-KO n = 8 retinas from eight mice. Means represented by blue bars. p=0.012. (D) Cumulative distribution function of nearest-neighbor distances (NND) and regularity index (mean NND/SD) from individual retinas, separated by genotype and age. Means represented by blue bars. p=0.020.
-
Figure 5—source data 1
Cell density analysis and regularity index.
- https://cdn.elifesciences.org/articles/81983/elife-81983-fig5-data1-v3.xlsx
Figure 6
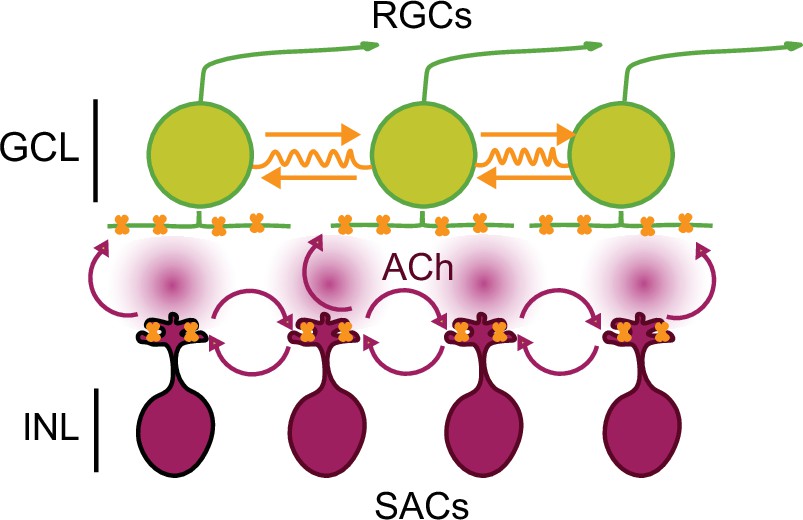
Working model of stage 1 wave initiation and propagation.
Wave initiation set by spontaneously depolarizing cholinergic amacrine cell/SAC, outlined in black, which release ACh and depolarizes neighboring cells, leading to the volumetric release of ACh. Retinal ganglion cells (RGCs) depolarized by nAChR activation (orange) via SAC-induced ACh release. Wave propagation set by RGC depolarization via gap junctional currents (orange) and volumetric ACh release.
Videos
Video 1
Stage 1 waves.
Calcium imaging of stage 1 waves using the macroscope. Total field of view is 4.7 mm × 4.7 mm. Frame rate 10 Hz. Total length of movie represents 1 min of recording.
Video 2
Example of small non-propagating events.
Calcium imaging of stage 1 waves using the macroscope. Total field of view is 4.7 mm × 4.7 mm. Frame rate 10 Hz. Total length of movie represents 15 s of recording. Yellow triangles depict small non-propagating events.
Video 3
Stage 1 waves in β2-nAChR-Kos.
Calcium imaging of stage 1 waves in retinas isolated from β2-nAChR-KO mice using macroscope. Total field of view is 4.7 mm × 4.7 mm. Frame rate 10 Hz. Total length of movie represents 1 min of recording.
Tables
Table 1
Stage 1 wave speeds in WT and β2-nAChR-KO, plus stage 2 wave speeds.
Speeds recorded from individual waves. Summary data (µm/s) reported in Figure 3 with additional data to compare with speeds of stage 2 waves. Each row is an individual wave.
| WT stage 1 waves | B2-nAChR-KO stage 1 waves | Stage 2 waves | |
|---|---|---|---|
| 174.17 | 77.91 | 205.68 | |
| 183.94 | 92.40 | 124.44 | |
| 192.19 | 98.19 | 153.25 | |
| 162.26 | 117.34 | 120.47 | |
| 189.84 | 128.52 | 158.59 | |
| 237.34 | 87.97 | 176.49 | |
| 179.24 | 92.40 | 263.86 | |
| 165.68 | 92.06 | 156.09 | |
| 144.52 | 103.25 | 108.62 | |
| 182.07 | 103.90 | 299.29 | |
| Avg | 181.12 | 99.39 | 176.68 |
| Stdev | 24.39 | 14.72 | 62.62 |
Table 2
Nearest-neighbor distances (NND) and regularity indices for intrinsically photosensitive ganglion cells (ipRGCs) labeled in Opn4Cre/+;Ai9 mice.
Data represented as averages ± SD. This data complements quantification in Figure 5.
| Median nearest-neighbor distance (µm) | Regularity index (NND/SD) | Number of retinas | |
|---|---|---|---|
| WT P1 | 11.59 ± 0.93 | 2.83 ± 0.12 | 9 |
| β2 P1 | 11.51 ± 0.55 | 2.89 ± 0.16 | 9 |
| WT P7 | 22.32 ± 0.58 | 2.33 ± 0.13 | 8 |
| β2 P7 | 20.96 ± 1.40 | 2.55 ± 0.20 | 8 |
Additional files
Download links
A two-part list of links to download the article, or parts of the article, in various formats.
Downloads (link to download the article as PDF)
Open citations (links to open the citations from this article in various online reference manager services)
Cite this article (links to download the citations from this article in formats compatible with various reference manager tools)
Circuit mechanisms underlying embryonic retinal waves
eLife 12:e81983.
https://doi.org/10.7554/eLife.81983


