Motor cortex analogue neurons in songbirds utilize Kv3 channels to generate ultranarrow spikes
- Vollum Institute, Oregon Health and Science University, United States
- Department of Behavioral Neuroscience, Oregon Health and Science University, United States
- Department of Physics, Pennsylvania State University, United States
- Oregon Hearing Research Center, Oregon Health and Science University, United States
Figures
Figure 1 with 1 supplement
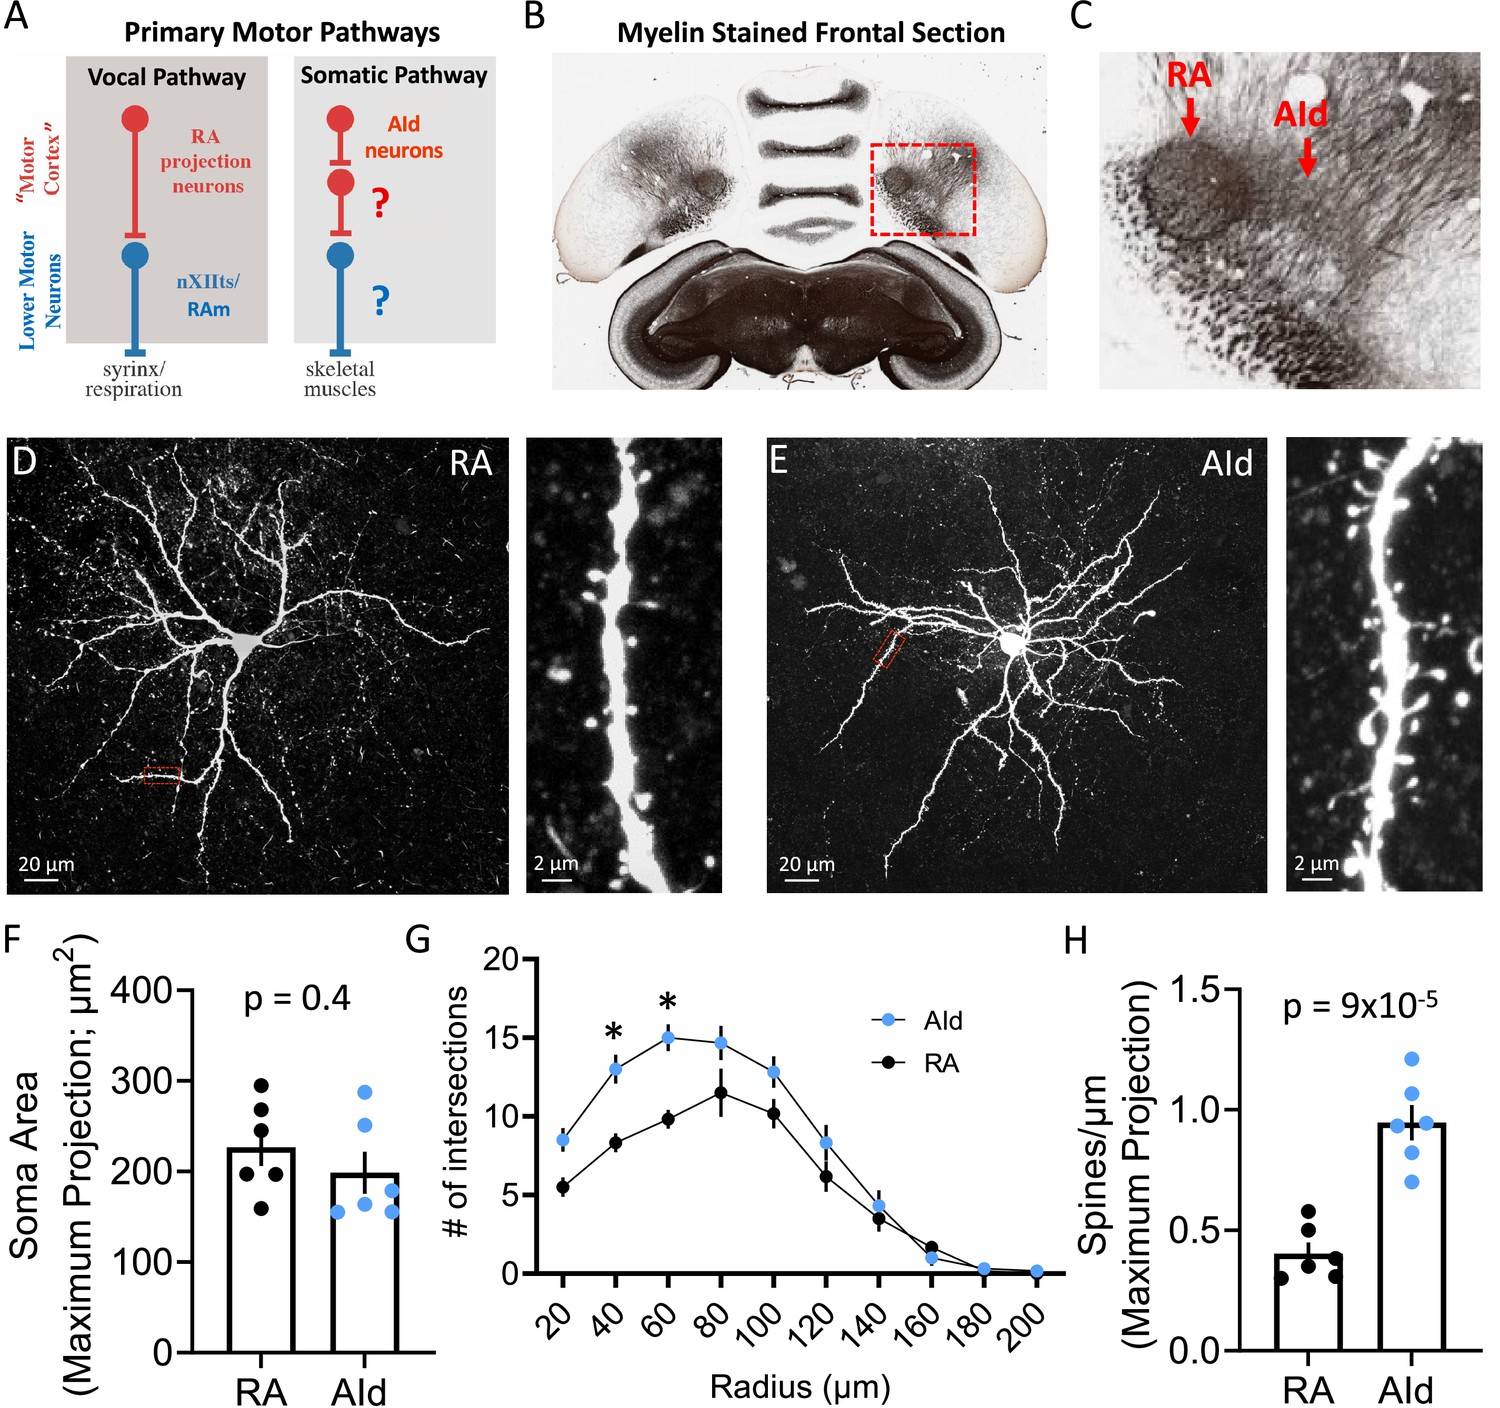
Morphology of robustus arcopallialis projection neurons (RAPNs) and dorsal intermediate arcopallium (AId) neurons.
(A) Diagram of the motor pathways in the zebra finch. RA and AId upper motor neurons in the arcopallium project to downstream targets that innervate syringeal and skeletal muscles respectively. Note that the exact cellular projection targets for AId neurons in the brainstem (Bottjer et al., 2000) and/or spinal cord have yet to be determined. (B) Myelin-stained frontal section of a zebra finch brain, including RA and AId. Red box in (B) indicates the region containing RA and AId. (C) Expanded region shown in (B). Note the clear RA and AId arcopallial regions with inputs from the nidopallium above. Panels B and C are adapted from a myelin-stained frontal section of a zebra finch brain taken from the Brain Architecture Project (http://www.brainarchitecture.org/) Karten et al., 2013, published under CC-BY-SA. (D) Left: Maximum projection of a Z-stack from a biocytin-filled RAPN. Red box indicates dendritic region expanded on the right. Right: Expanded region showing a 30 µm long dendritic section from the neuron to the left. (E) Left: Maximum projection of a Z-stack from a biocytin-filled AId neuron. Red box indicates dendritic region expanded on the right. Right: Expanded region showing a 30 µm long dendritic section from the neuron to the left. (F) Dot plot comparing the soma area of RAPNs and AId neurons. Student’s t-test, two-tailed, tstat = 0.91, N=6 RAPNs and 6 AId neurons. Black bars indicate standard error. (G) Comparison of the dendritic complexity from RAPNs and AId neurons as determined by the number of intersections with concentric circles of increasing radii surrounding the cell body. Two-way ANOVA; p=0.004, F(9, 100)=2.92, N=6 RAPNs and 6 AId neurons. *p<0.05 as determined by Tukey’s post hoc test. Black bars indicate standard error. (H) Dot plot comparing the number of spines per micron of RAPNs and AId neurons. Spines were counted on a 30 µm dendritic segment after the second branch point. Between 2 and 4 segments were measured per cell, averaged and divided by 30 to determine the # spines/µm. Student’s t-test, two-tailed, tstat = 6.29, N=6 RAPNs and 6 AId neurons. Black bars indicate standard error.
© 2008, Karten et al. Panels B and C are adapted from a Myelin-stained frontal section of a zebra finch brain taken from the Brain Architecture Project (http://www.brainarchitecture.org/) Karten et al. (2008), published under CC-BY-SA.
Figure 1—figure supplement 1
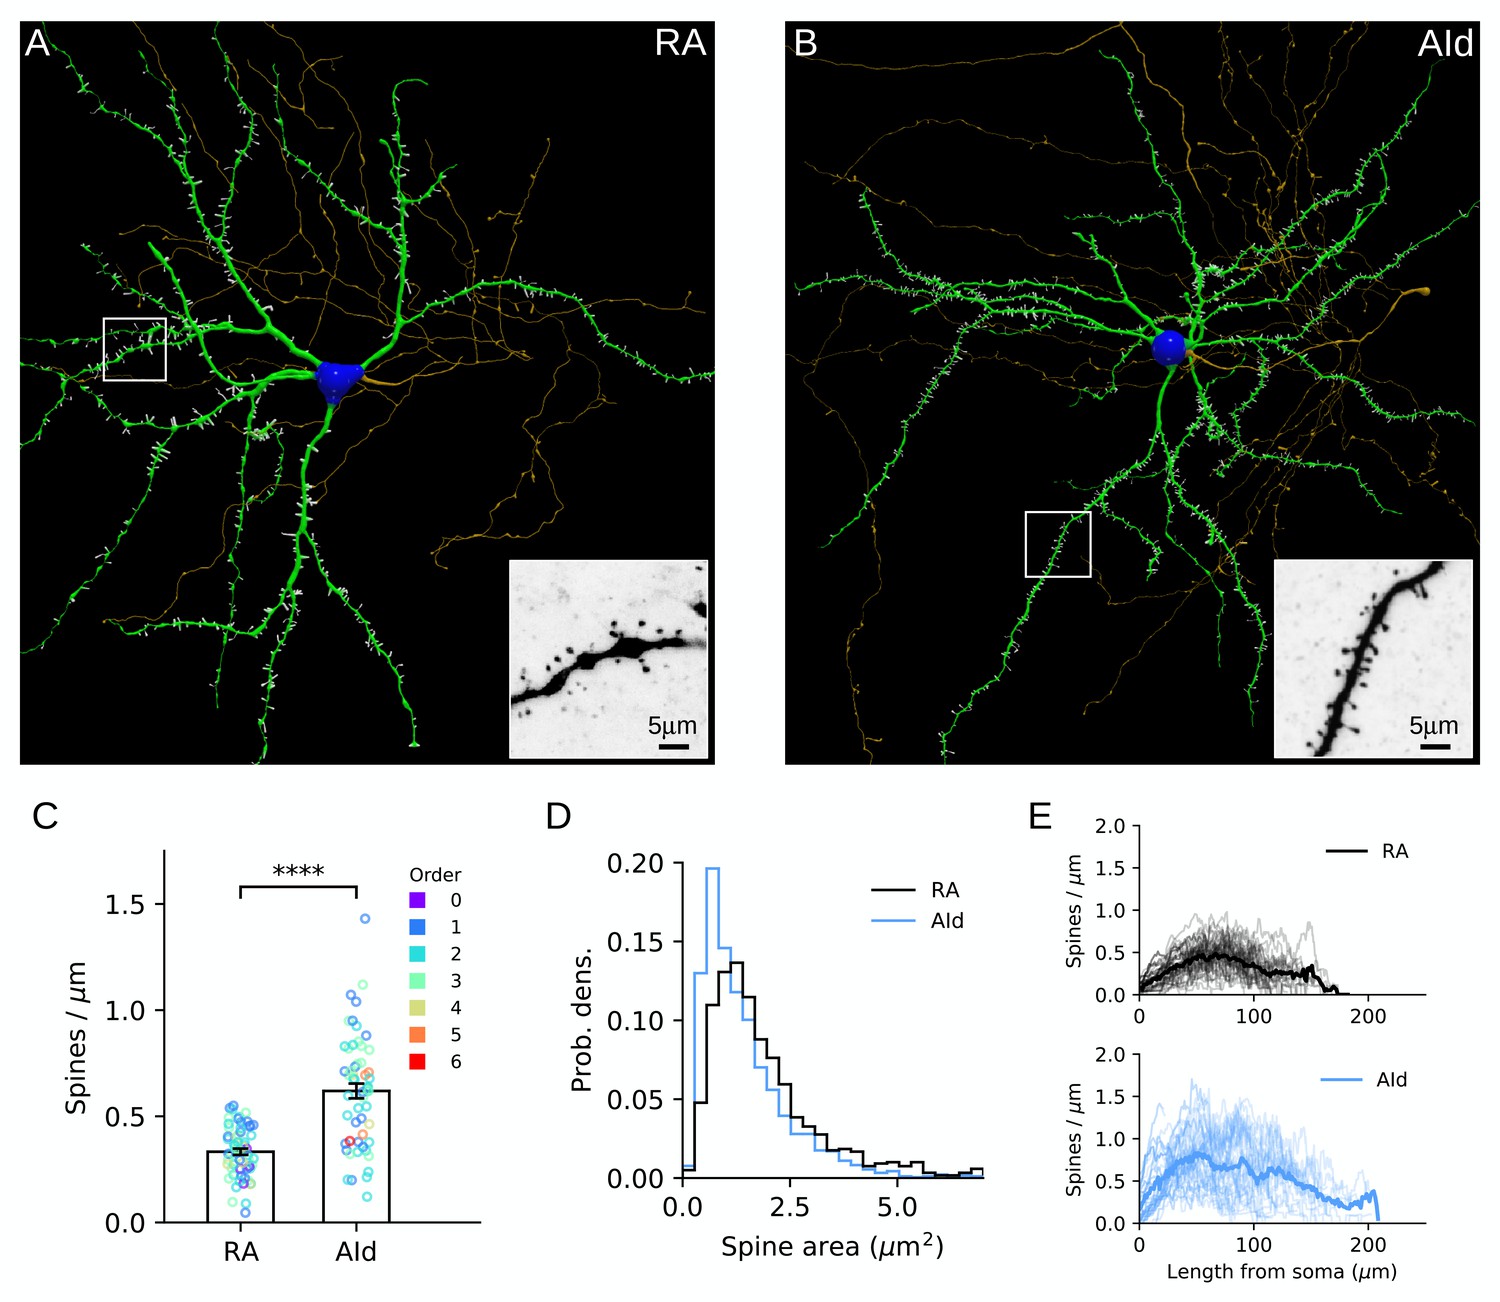
Reconstruction of neuron morphology and estimation of spine density.
(A and B) Top view of the morphology of an RA and an dorsal intermediate arcopallium (AId) neuron (blue, soma; green, dendrite; gold, axon; white, spines). Insets show projections of the raw images of the regions enclosed by white boxes. Note the larger concentration of spines for the AId neuron. (C) Average density of spines over dendritic segments. Circles indicate individual segments. Color indicates branching order (centrifugal ordering). Root segments with fewer than 10 spines were discarded from the analysis. Segments shorter than 20 µm were also discarded (details in Methods). Black bars indicate standard error. Welch’s t-test, tstat = 7.75, p=3.76 × 10⁻¹², N=62 RA and 56 AId segments. (D) Probability density of individual spine areas by neuron type. Note the longer tail of the RA distribution. Kolmogorov-Smirnov two-sample test, D=0.19 p=7.8 × 10⁻¹⁶, N = 1194 RA and 1824 AId spines. (E) Profile of spine density from soma to termini along all dendritic branches of both neuron types. N=96 RA and 95 AId branches. Averages shown in solid lines.
Figure 2 with 1 supplement
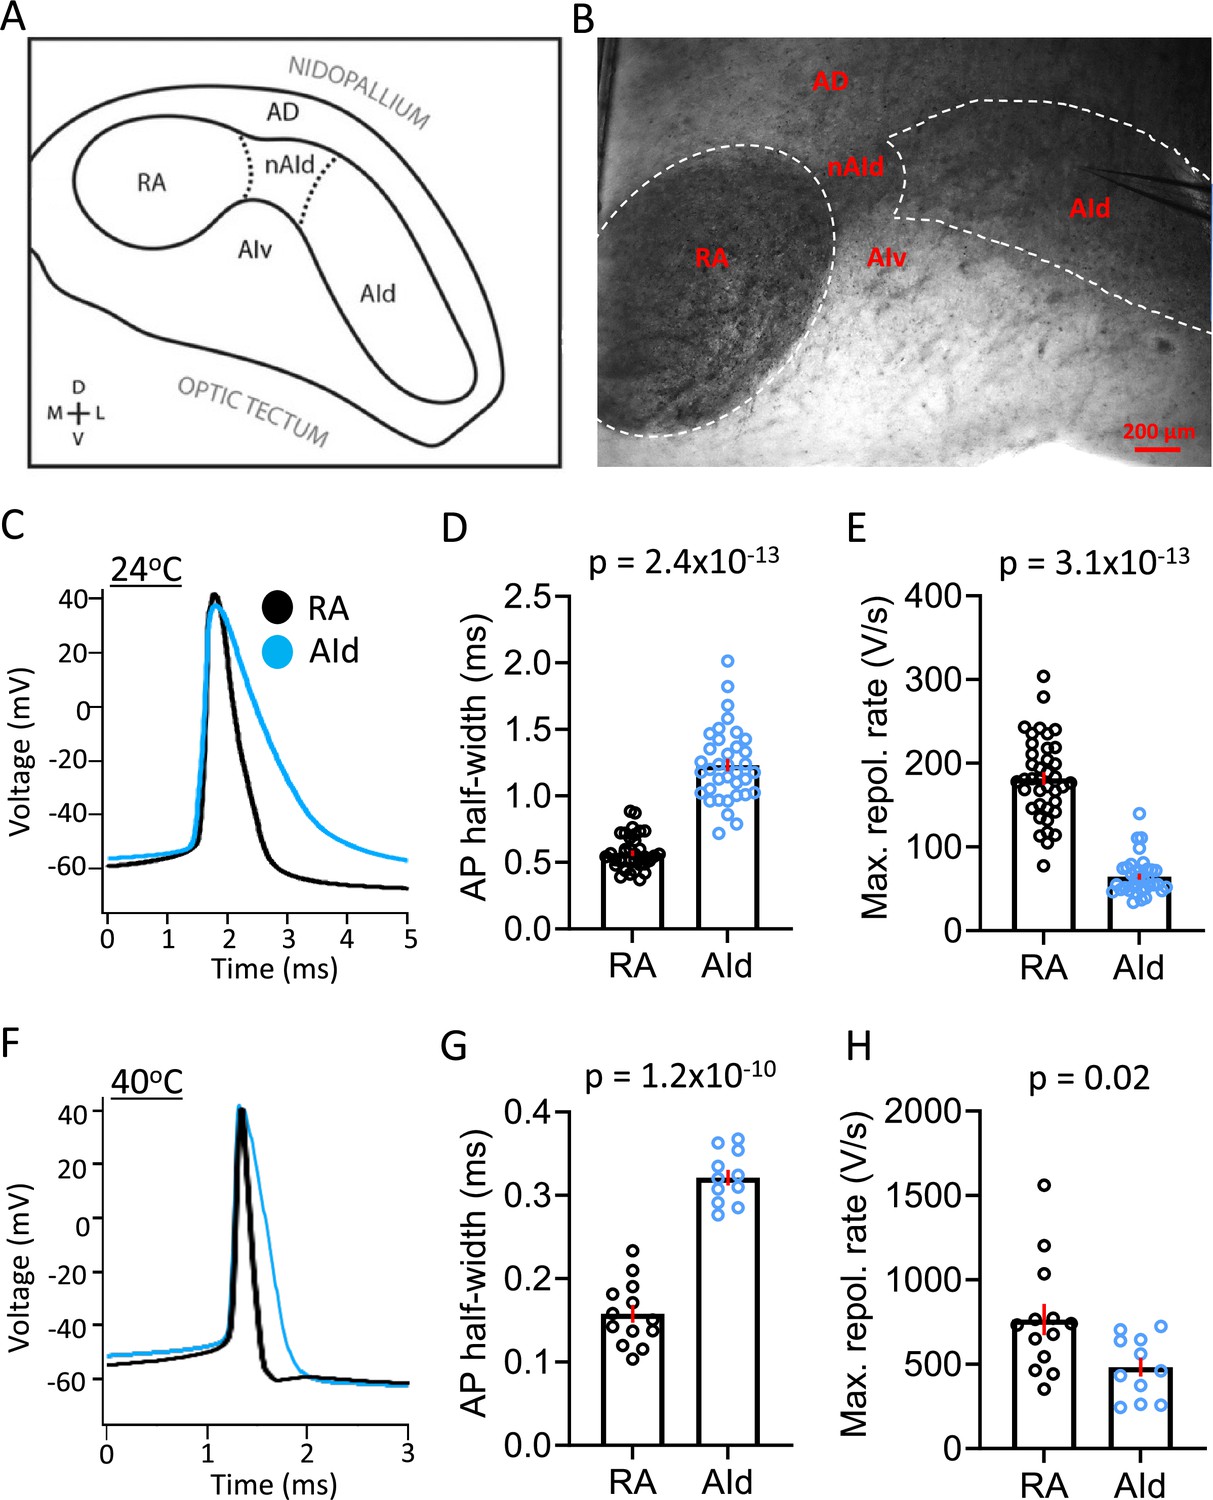
Spontaneous action potential (AP) properties in robustus arcopallialis projection neurons (RAPNs) and AId neurons from adult male zebra finches at room and physiological temperatures.
(A) Drawing of the zebra finch arcopallium in the frontal plane, depicting RA and AId as defined by SCN3B staining in adult males. Labeling of other domains are included as referential landmarks. AD, dorsal arcopallium, AId, dorsal intermediate arcopallium, AIv, ventral intermediate arcopallium, nAId, neck of the dorsal intermediate arcopallium, RA, robust nucleus of the arcopallium. Figure 2A is reproduced from Figure 2 from Nevue et al., 2020. (B) Infra-red differential interference contrast microscopy (IR-DIC) image of a frontal brain slice in which RA and AId are clearly visible, noting that the black elements seen correspond to heavily myelinated fibers. Labels correspond to those depicted in (A). Note the recording electrode in AId. (C) Overlay of averaged spontaneous APs recorded at ~24°C from RAPN (black) and AId neurons (blue). (D) Comparison of the average spontaneous AP half-widths from RAPNs and AId neurons recorded at ~24°C (Mann-Whitney U=11, two-tailed, N=39 RAPNs and 36 AId neurons. Red bars indicate standard error). (E) Comparison of the average spontaneous AP maximum repolarization rate from RAPNs and AId neurons recorded at ~24°C. Mann-Whitney U=14, two-tailed N=39 RAPNs and 36 AId neurons. Red bars indicate standard error. (F) Overlay of averaged spontaneous APs recorded at ~40°C from RAPN (black) and AId neurons (blue) respectively. (G) Comparison of the average spontaneous AP half-widths from RAPNs and AId neurons recorded at ~40°C. Student’s t-test, two-tailed, tstat = 11.33, N=13 RAPNs and 11 AId neurons. Red bars indicate standard error. (H) Comparison of the average spontaneous AP maximum repolarization rate from RAPNs and AId neurons recorded at ~40°C. Student’s t-test, two-tailed, tstat = 2.50, N=13 RAPNs and 11 AId neurons. Red bars indicate standard error. p-Values are included in the graphs.
Figure 2—figure supplement 1
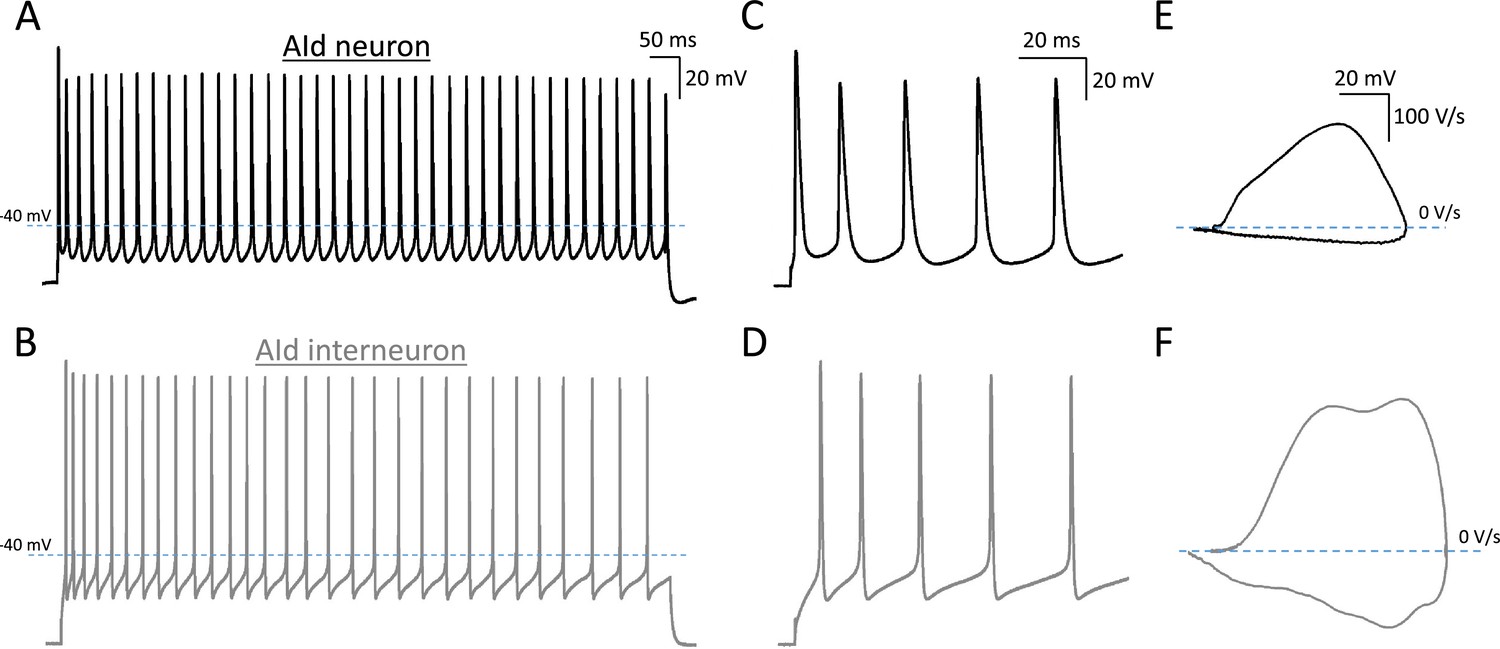
Interneurons vs. projection neurons in dorsal intermediate arcopallium (AId).
(A and B) Action potential (AP) trains elicited in an AId neurons (top) and a putative AId interneuron (bottom) during a 1 s 500 pA current injection at 24°C respectively. Dashed line represents –40 mV. Scales in A. (C–D) First five APs trains from the trains in A and B. Note the narrower APs for interneurons in the example. Scale in C. (E–F) Phase plane plots from averaged APs in A and B. Scale in E. Note the larger rates of depolarization and repolarization for interneurons in the example.
Figure 3
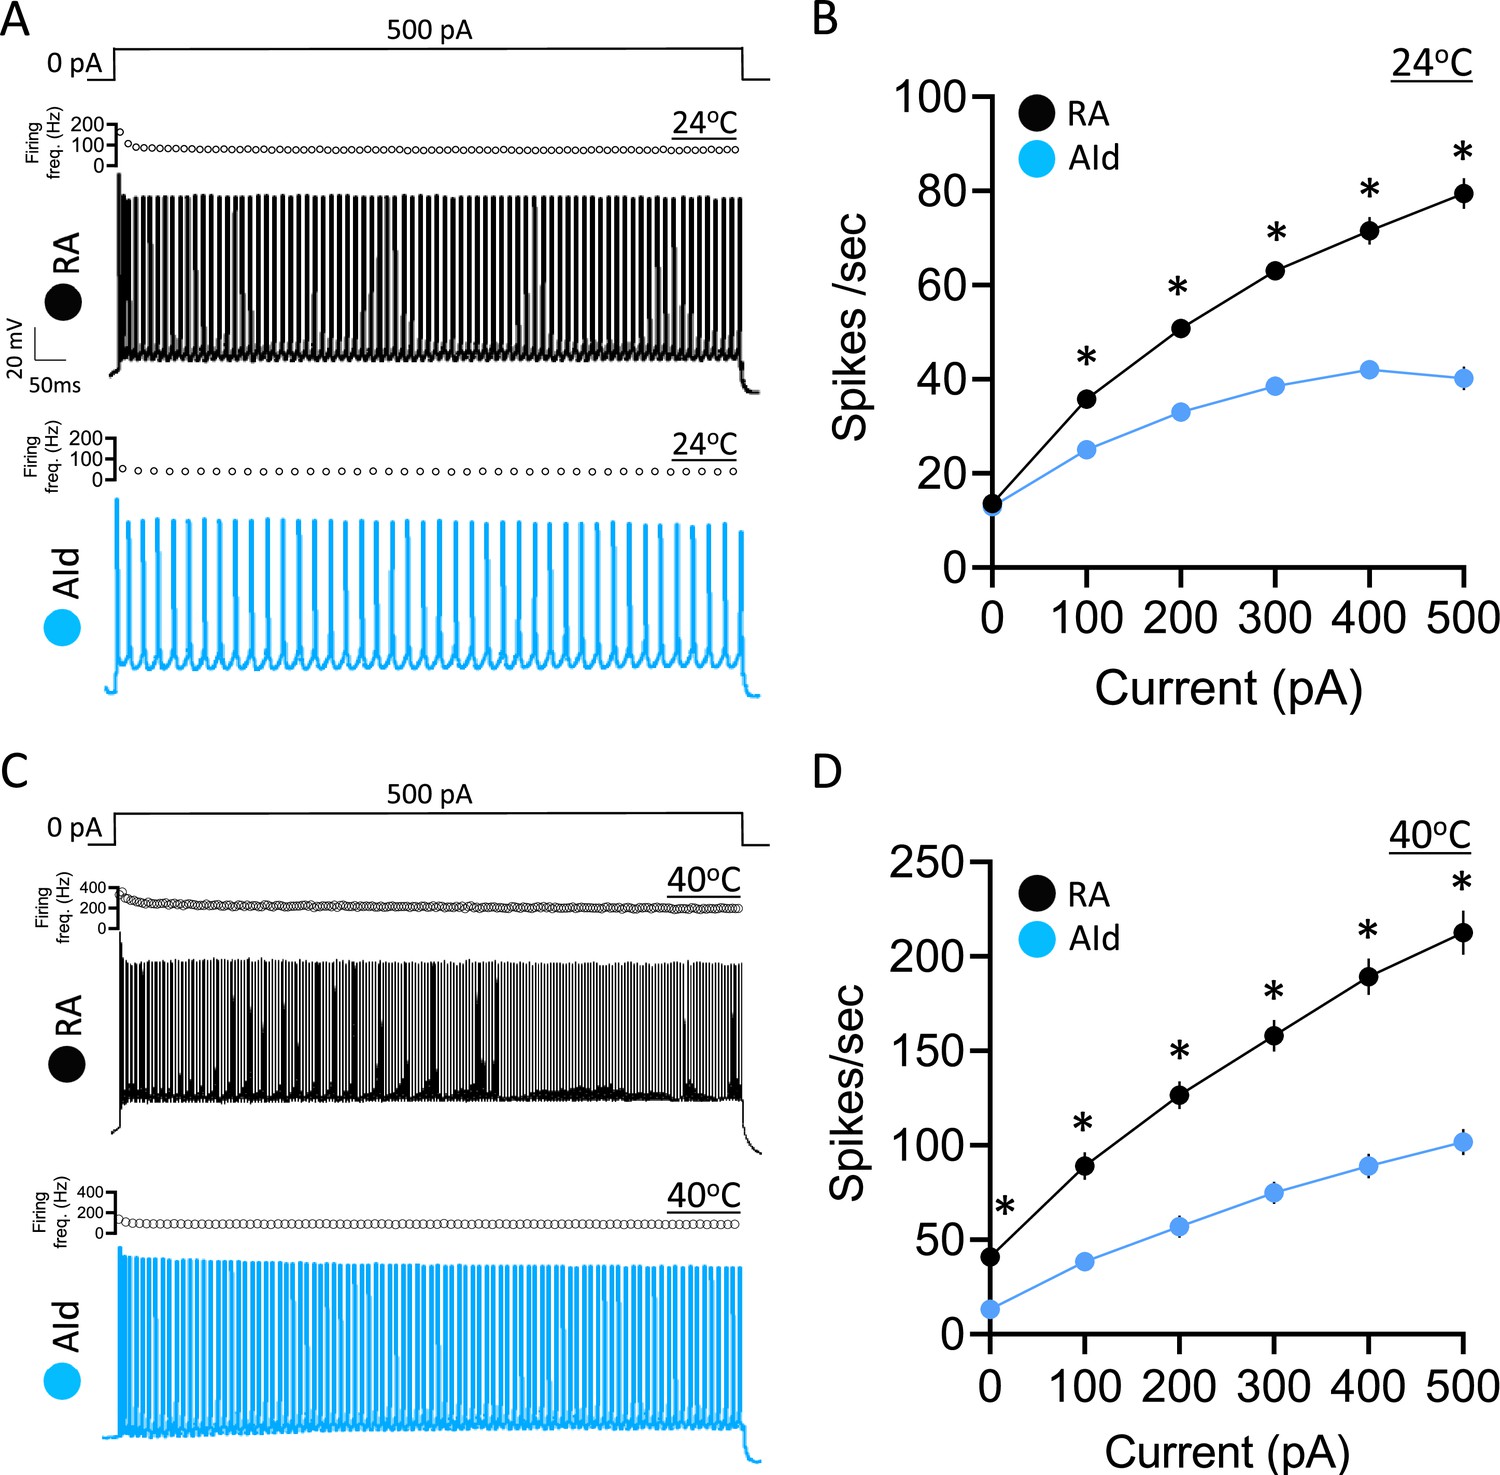
Evoked action potential (AP) properties in robustus arcopallialis projection neurons (RAPNs) and dorsal intermediate arcopallium (AId) neurons from adult male zebra finches at room and physiological temperatures.
(A) Representative AP trains elicited by a 1 s 500 pA current injection at ~24°C in a RAPN (black, top) in an AId neuron (blue, bottom). The corresponding plot of firing frequency as function of time is shown at the top of each AP train. (B) Average elicited firing rate (spikes/s) as a function of injected current at ~24°C. Two-way ANOVA; p=5.5 × 10⁻²², F(5,438)=24.76, N=39 RAPNs and 36 AId neurons. (C) Representative AP trains elicited by a 1 s 500 pA current injection at ~40°C in an RAPN (black, top) and in an AId neuron (blue, bottom). Same scale as in (A). The corresponding plot of firing frequency as function of time is shown at the top of each AP train. (D) Average elicited firing rate (spikes/s) as a function of injected current at ~40°C. Two-way ANOVA; p=3.9 × 10⁻⁷, F(5,138)=8.69, N=13 RAPNs and 12 AId neurons. * in B & D indicates p<0.05; Tukey’s post hoc test.
Figure 4 with 2 supplements
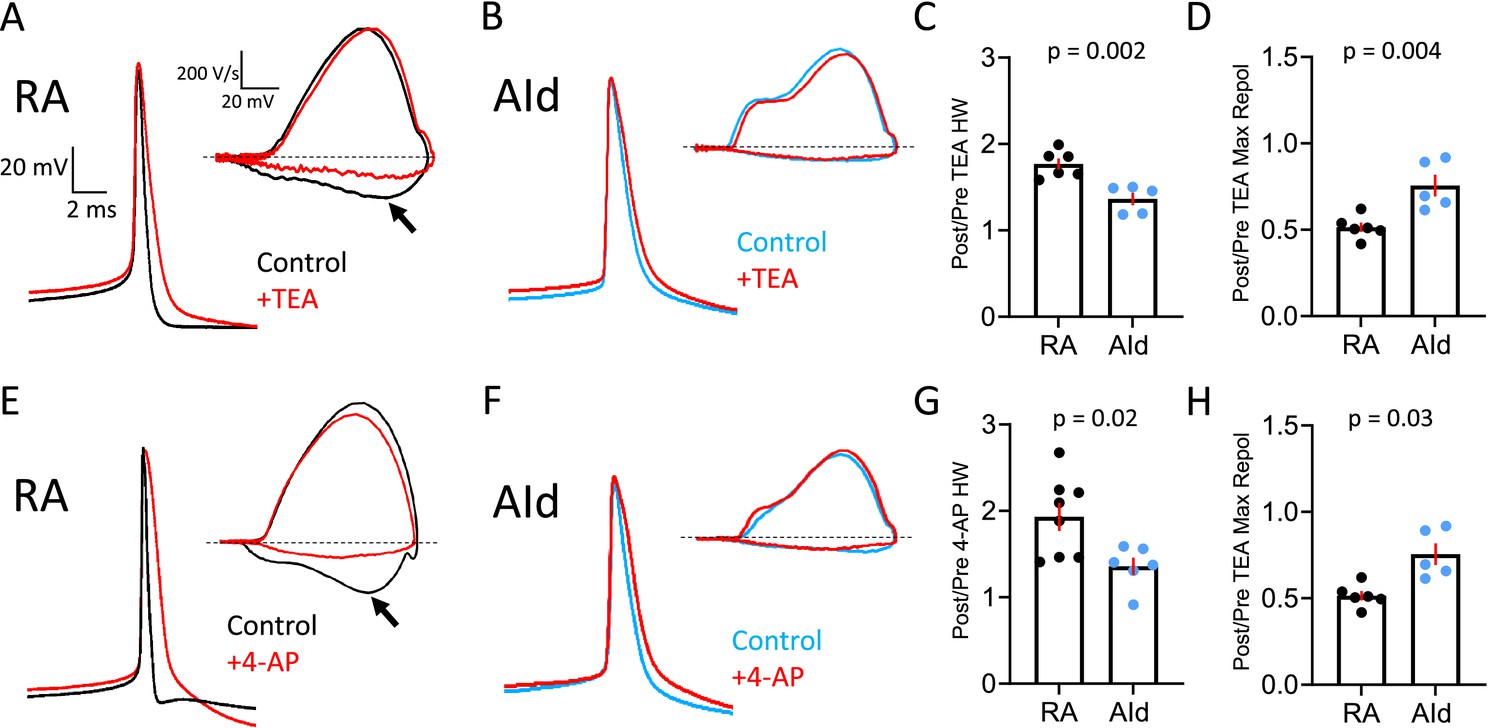
Effect of Kv3 channel inhibitors on spontaneous action potentials (APs) of robustus arcopallialis projection neuron (RAPN) and dorsal intermediate arcopallium (AId) neurons.
(A) Representative averaged spontaneous RAPN AP traces and phase plane plots (inset) before and after 500 µM tetraethylammonium (TEA) administration. (B) Same as in (A) with AId neurons. (C) Fold change in the AP half-width (HW) in RAPNs and AId neurons (or ratio of post/pre TEA treatment). Student’s t-test, two-tailed, tstat = 4.184, N=6 RAPNs and 5 AId neurons. (D) Fold change in the AP maximum repolarization rate in RAPNs and AId neurons. Student’s t-test, two-tailed, tstat = 3.782, N=6 RAPNs and 5 AId neurons. (E) Representative averaged spontaneous RAPN AP traces and phase plane plots (inset) before and after 100 µM 4-aminopyridine (4-AP) administration. (F) Same as in (A) with AId neurons. (G) Fold change in the AP half-width in RAPNs and AId neurons. Student’s t-test, two-tailed, tstat = 2.759, N=7 RAPNs and 6 AId neurons. (H) Fold change in the AP maximum repolarization rate in RAPNs and AId neurons. Student’s t-test, two-tailed, tstat = 2.499, N=7 RAPNs and 6 AId neurons. p-Values are included in the graphs, red bars indicate standard error in C–D and G–H. The black arrows in A and E point to the changes in the maximum rate of repolarization. Dashed lines in A–B and E–F represent 0 V/s.
Figure 4—figure supplement 1
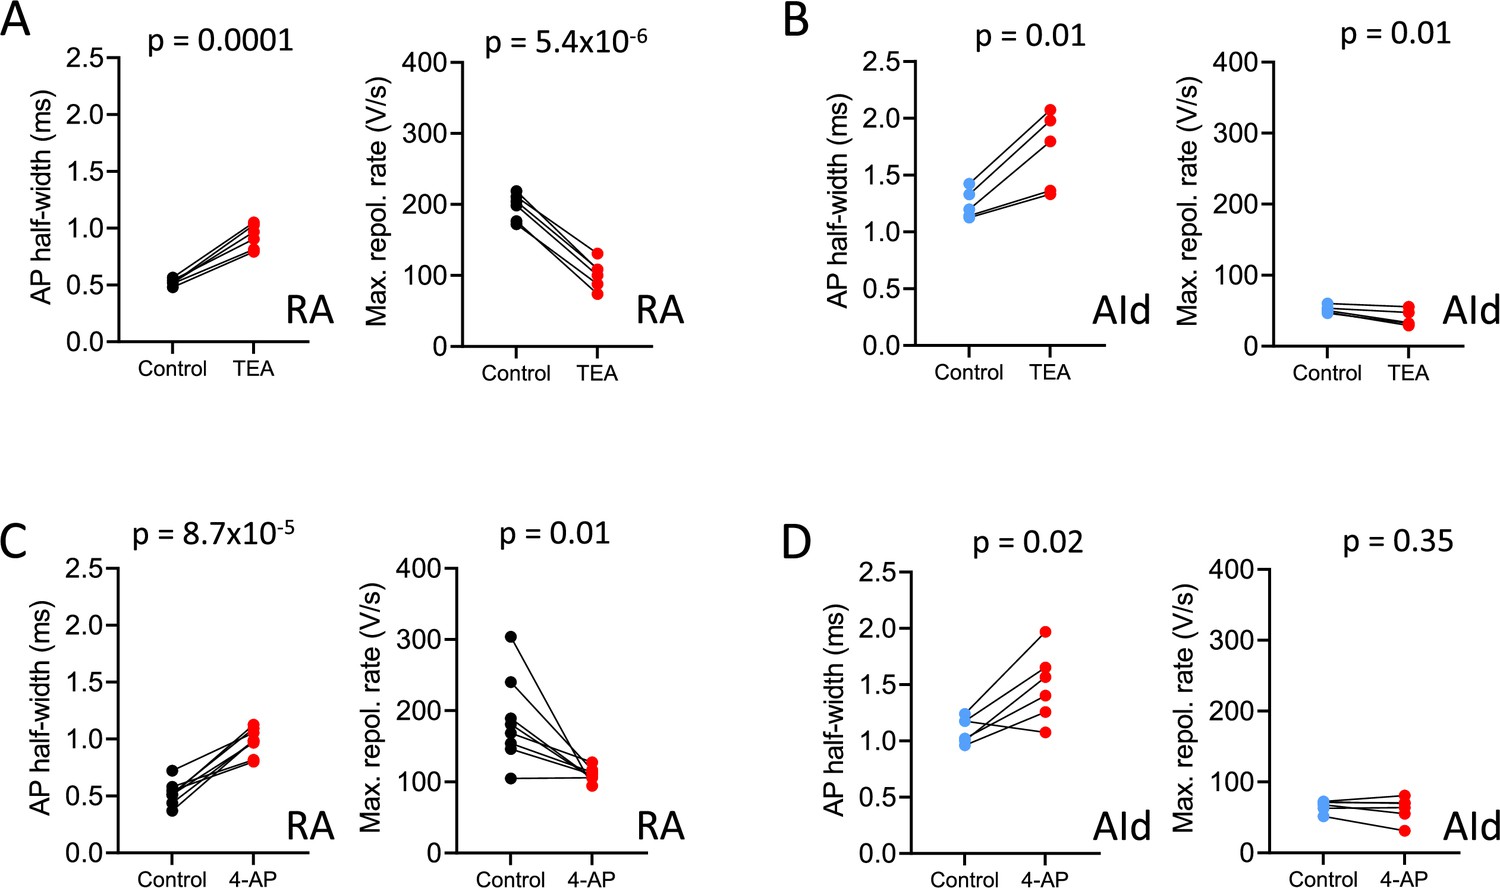
Kv3.1 antagonists broaden the robustus arcopallialis projection neuron (RAPN) and dorsal intermediate arcopallium (AId) neuron spontaneous action potentials (APs).
(A) Changes in AP half-width (left) and maximum repolarization rate (right) before and after exposure to 500 µM tetraethylammonium (TEA). AP half-width: paired Student’s t-test, two-tailed, tstat = 10.90, N=6 RAPNs; maximum repolarization rate: paired Student’s t-test, two-tailed tstat = 20.28, N=6 RAPNs. (B) Same as in (A) except in AId neurons. AP half-width: paired Student’s t-test, two-tailed, tstat = 4.51, N=5 AId neurons; maximum repolarization rate: paired Student’s t-test, two-tailed, tstat = 4.26, N=5 AId neurons. (C) Changes in AP half-width and maximum repolarization rate before and after exposure to 100 µM 4-aminopyridine (4-AP). AP half-width: paired Student’s t-test, two-tailed, tstat = 8.06, N=8 RAPNs; maximum repolarization rate: paired Student’s t-test, two-tailed, tstat = 3.28, N=8 RAPNs. (D) Same as in (C) except in AId neurons. AP half-width: paired Student’s t-test, two-tailed, tstat = 3.38, N=6 AId neurons; maximum repolarization rate: paired Student’s t-test, tstat = 1.03, N=6 AId neurons, two-tailed. p-Values are included in the graphs in A–D.
Figure 4—figure supplement 2
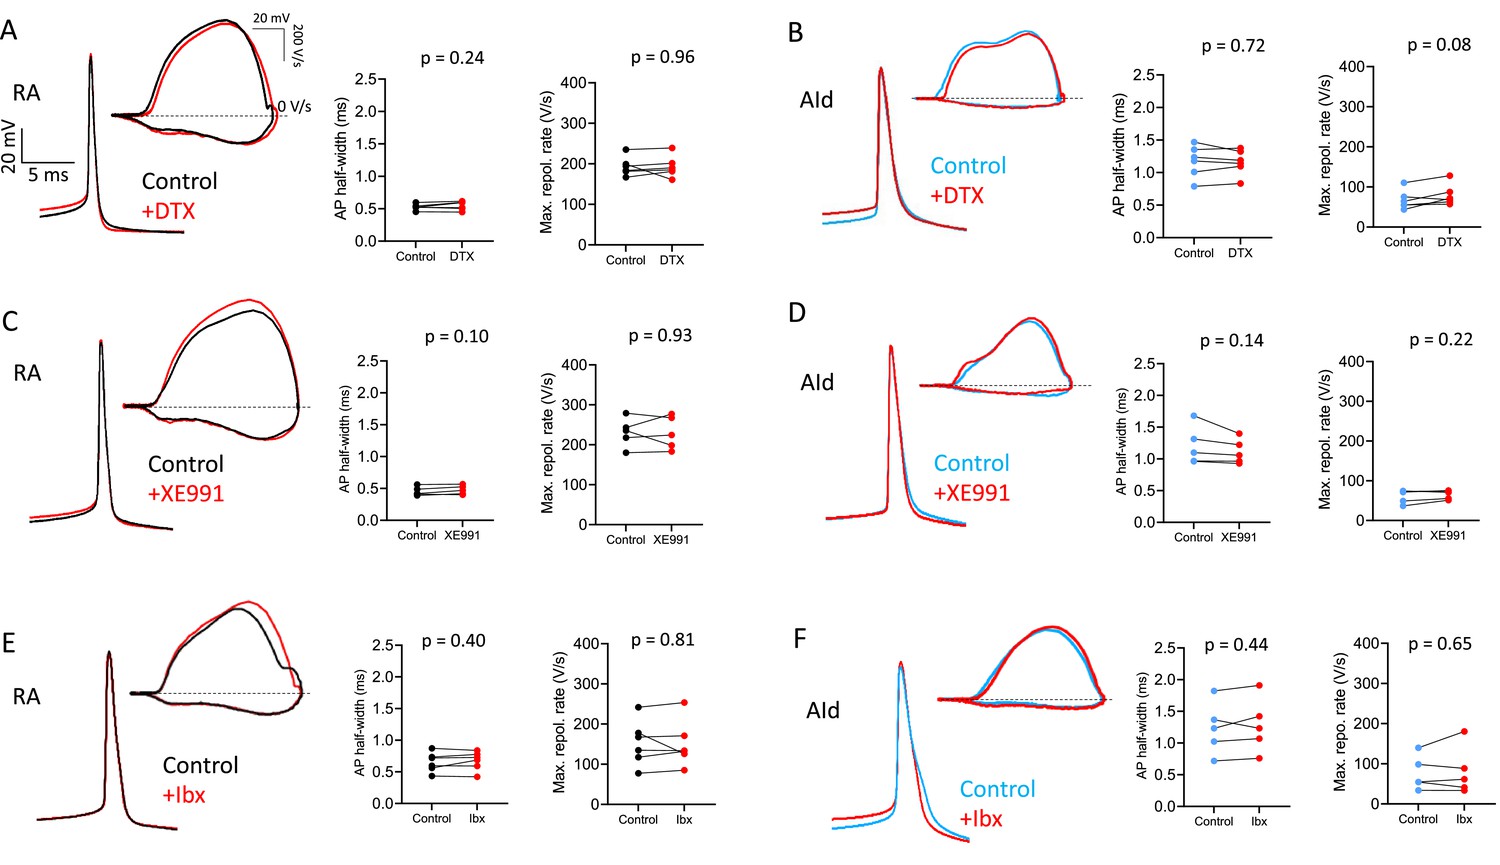
Inhibitors of distinct tetraethylammonium (TEA)-sensitive K+ channels do not differentially affect robustus arcopallialis projection neuron (RAPN) and dorsal intermediate arcopallium (AId) neuron spontaneous action potentials (APs).
(A) Left to right: Representative averaged spontaneous AP traces, phase plane plots (inset), and changes in AP half-width and maximum repolarization rate before and after exposure to 100 nM α-dendrotoxin (DTX) for RAPNs. AP half-width: paired Student’s t-test, two-tailed, tstat = 1.34, N=6 RAPNs, two-tailed; maximum repolarization rate: paired Student’s t-test, tstat = 0.05, N=6 RAPNs. (B) Same as in (A) except in AId neurons. AP half-width: paired Student’s t-test, two-tailed, tstat = 0.38, N=6 AId neurons; maximum repolarization rate: paired Student’s t-test, two-tailed, tstat = 2.17, N=6 AId neurons, two-tailed. (C) Left to right: Representative averaged spontaneous AP traces, phase plane plots (inset), and changes in AP half-width and maximum repolarization rate before and after exposure to 30 µM XE991 for RAPNs. AP half-width: paired Student’s t-test, two-tailed, tstat = 2.16, N=5 RAPNs; maximum repolarization rate: paired Student’s t-test, two-tailed, tstat = 0.09, N=5 RAPNs. (D) Same as in (C) except in AId neurons. AP half-width: paired Student’s t-test, two-tailed, tstat = 0.14, N=5 AId neurons; maximum repolarization rate: paired Student’s t-test, two-tailed, tstat = 0.144, N=5 AId neurons. (E) Left to right: Representative averaged spontaneous AP traces, phase plane plots (inset), and changes in AP half-width and maximum repolarization rate before and after exposure to 100 nM iberiotoxin (Ibx) for RAPNs. AP half-width: paired Student’s t-test, two-tailed, tstat = 0.91, N=6 RAPNs; maximum repolarization rate: paired Student’s t-test, two-tailed, tstat = 0.26, N=6 RAPNs. (F) Same as in (E) except in AId neurons. AP half-width: paired Student’s t-test, two-tailed, tstat = 0.86, N=5 AId neurons; maximum repolarization rate: paired Student’s t-test, two-tailed, tstat = 0.49, N=5 AId neurons. p-Values are included in the graphs. Scales are the same in A–F.
Figure 5 with 2 supplements
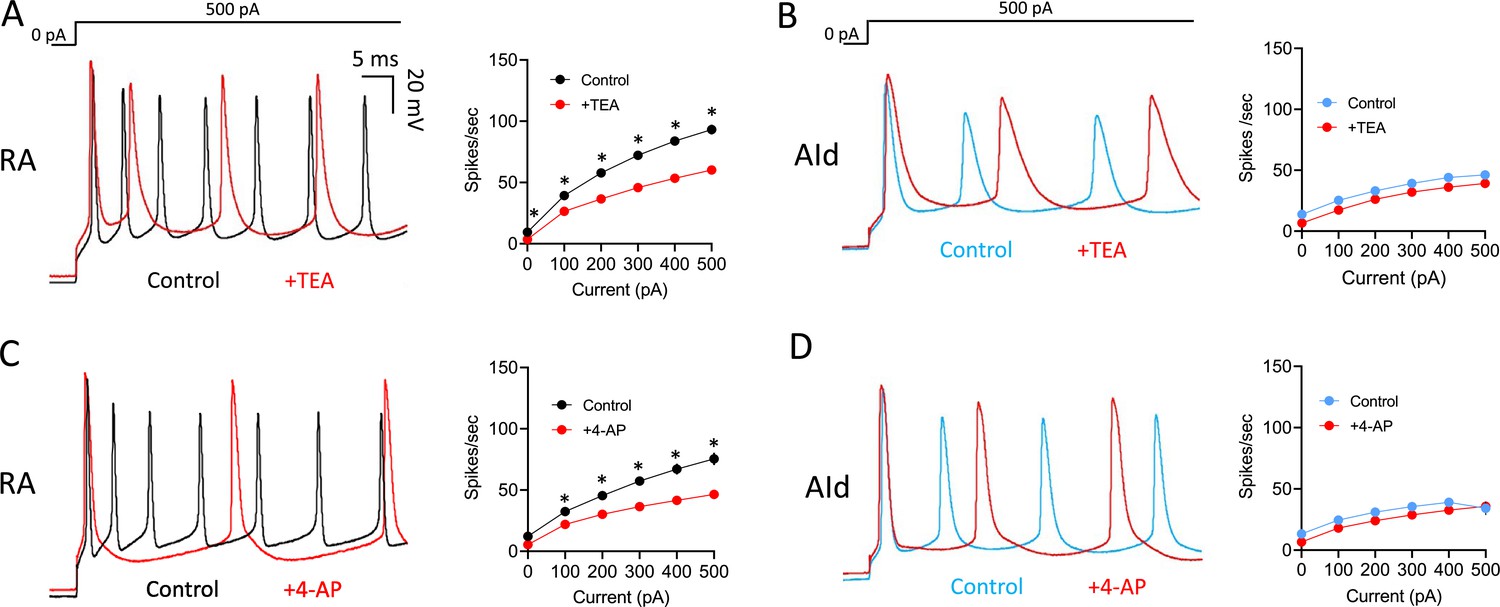
Effects of Kv3 channel inhibitors on evoked action potentials (APs) in robustus arcopallialis projection neurons (RAPNs) and dorsal intermediate arcopallium (AId) neurons.
(A) Left to right: Representative first 50 ms of AP traces elicited by a 1 s 500 pA current injection and average firing rates (spikes/s) before and after exposure of RAPNs to 500 µM tetraethylammonium (TEA). Repeated measures two-way ANOVA; p=6.0 × 10⁻⁴, F(1.279,7.672)=27.69, N=7 RAPNs. (B) Same as in (A) except in AId neurons. Repeated measures two-way ANOVA; p=0.73, F(1.863,11.18)=0.3056, N=7 AId neurons. (C) Left to right: Representative first 50 ms of AP traces elicited by a 1 s 500 pA current injection and average spikes/s before and after exposure of RAPNs to 100 µM 4-aminopyridine (4-AP). Repeated measures two-way ANOVA; p=8.0 × 10⁻⁵, F(1.256,8.794)=41.87, N=8 RAPNs. (D) Same as in (C) except in AId neurons. Repeated measures two-way ANOVA; p=0.26, F(1.133,5.665)=1.575, N=6 AId neurons. Scales are the same in A–D. * in A–D indicates p<0.05; Tukey’s post hoc tests.
Figure 5—figure supplement 1
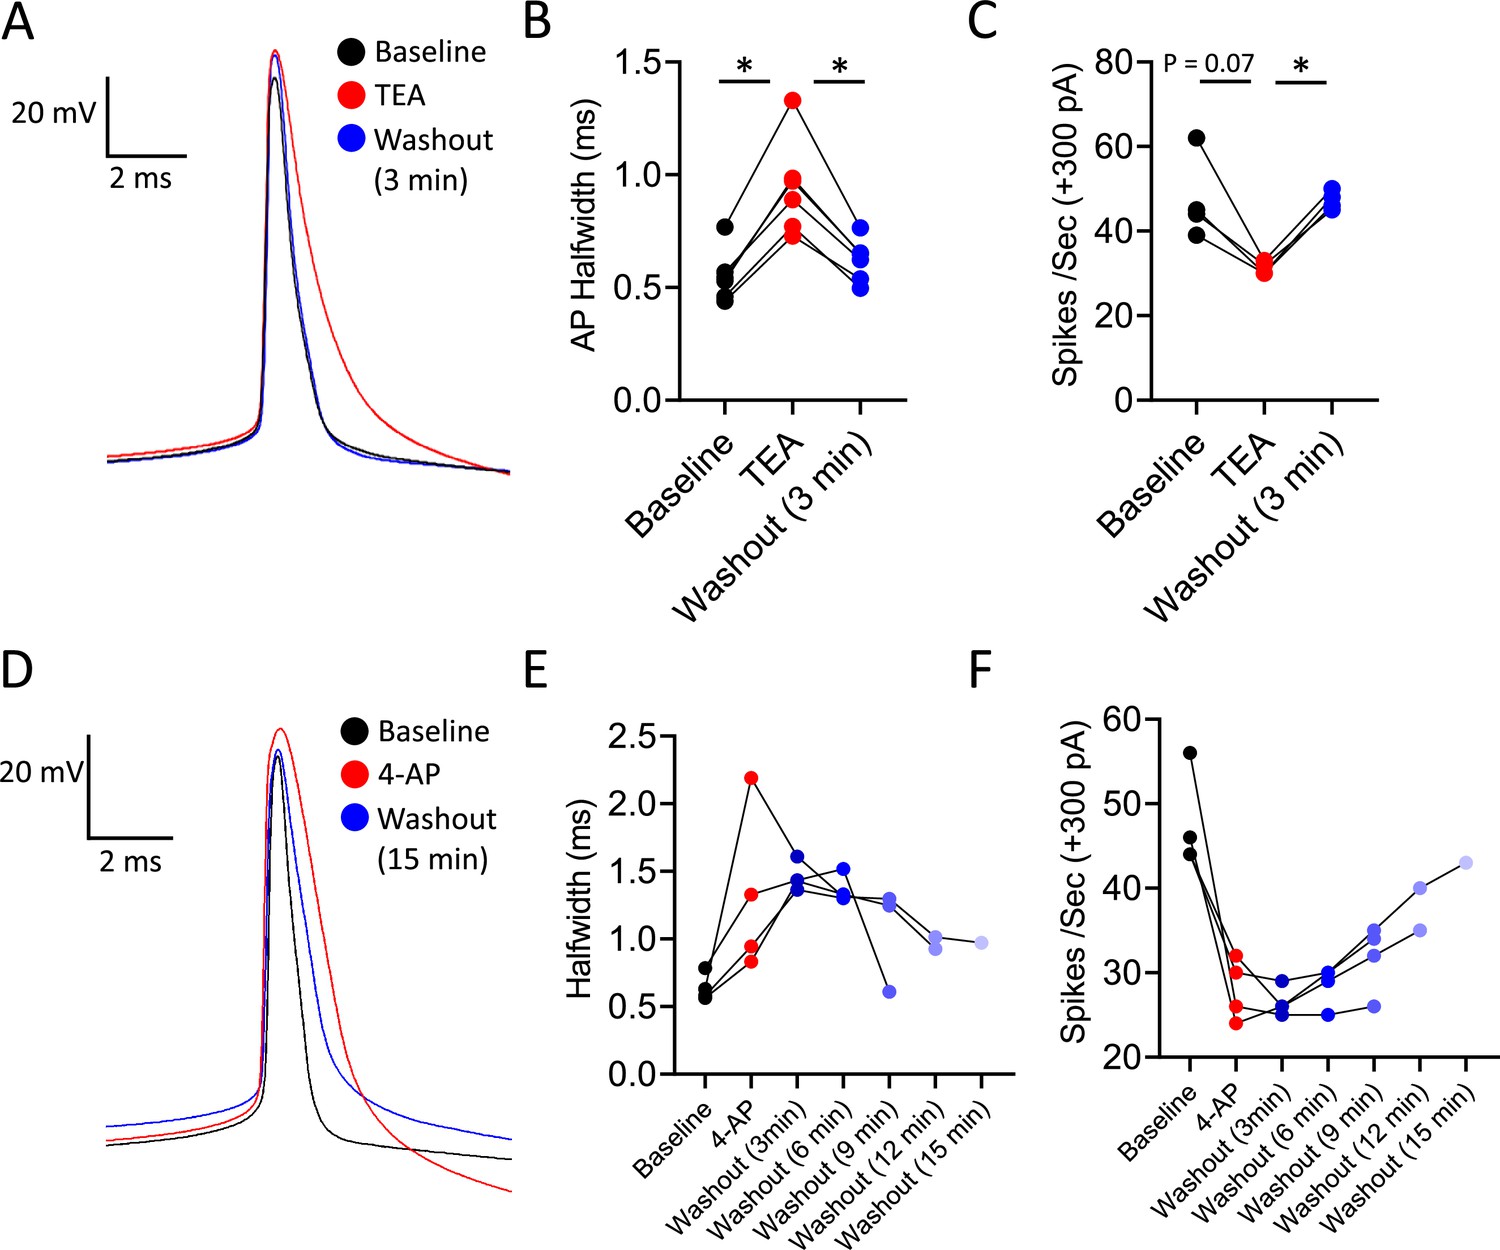
Washout of tetraethylammonium (TEA) and 4-aminopyridine (4-AP) from recordings from robustus arcopallialis projection neurons (RAPNs).
(A) Representative averaged spontaneous action potential (AP) traces from RAPNs at baseline, after a 3 min exposure to 500 µM TEA, and 3 min after washout. (B) Change in AP half-width of RAPNs upon exposure to TEA. Repeated measures one-way ANOVA; p=0.0003, F(1.189,5.946)=53.07. N=6 RAPNs. * indicates p<0.05 as determined by a Tukey’s post hoc test. (C) Change in the number of spikes per second resulting from a +300 pA current injection in RAPNs. Repeated measures one-way ANOVA; p=0.03, F(1.092,3.275)=13.13. N=4 RAPNs. * indicates p<0.05 as determined by a Tukey’s post hoc test. (D) Representative averaged spontaneous AP traces from RAPNs at baseline, after a 3 min exposure to 100 µM 4-AP and 12 min after washout. (E) Change in AP half-width of RAPNs upon exposure to 4-AP. Repeated measures one-way ANOVA; p>0.05. (F) Change in the number of spikes per second resulting from a +300 pA current injection in RAPNs. Repeated measures one-way ANOVA; p>0.05.
Figure 5—figure supplement 2

Inhibitors of tetraethylammonium (TEA)-sensitive channels do not differentially affect robustus arcopallialis projection neuron (RAPN) and dorsal intermediate arcopallium (AId) neuron evoked action potentials (APs).
(A) Left to right: Representative first 50 ms of AP traces elicited by a 1 s 500 pA current injection and average spikes/s before and after exposure to 100 nM DTX for RAPNs. Repeated measures two-way ANOVA; p=1.9 × 10⁻³, F(1.269,6.347)=23.52, N=6 RAPNs. (B) Same as in (A) except in AId neurons. Same scale as in (A). Repeated measures two-way ANOVA; p=0.3, F(1.376,6.878)=1.445, N=6 AId neurons. (C) Left to right: Representative first 50 ms of AP traces elicited by a 1 s 500 pA current injection and average spikes/s before and after exposure to 30 µM XE991 for RAPNs. Same scale as in (A). Repeated measures two-way ANOVA; p=6.7 × 10⁻⁴, F(5,20)=6.922, N=5 RAPNs. * indicates p<0.05 as determined by a Tukey’s post hoc test. (D) Same as in (C) except in AId neurons. Same scale as in (A). Repeated measures two-way ANOVA; p=0.04, F(5,20)=2.933, N=5 AId neurons. (E) Left to right: Representative first 50 ms of AP traces elicited by a 1 s 500 pA current injection and average spikes/s before and after exposure to 100 nM Ibx for RAPNs. Same scale as in (A). Repeated measures two-way ANOVA; p=0.27, F(1.074,5.368)=1.546, N=6 RAPNs. (F) Same as in (E) except in AId neurons. Same scale as in (A). Two-way ANOVA; p=0.18, F(1.686,6.743)=2.298, N=5 AId neurons.
Figure 6 with 1 supplement
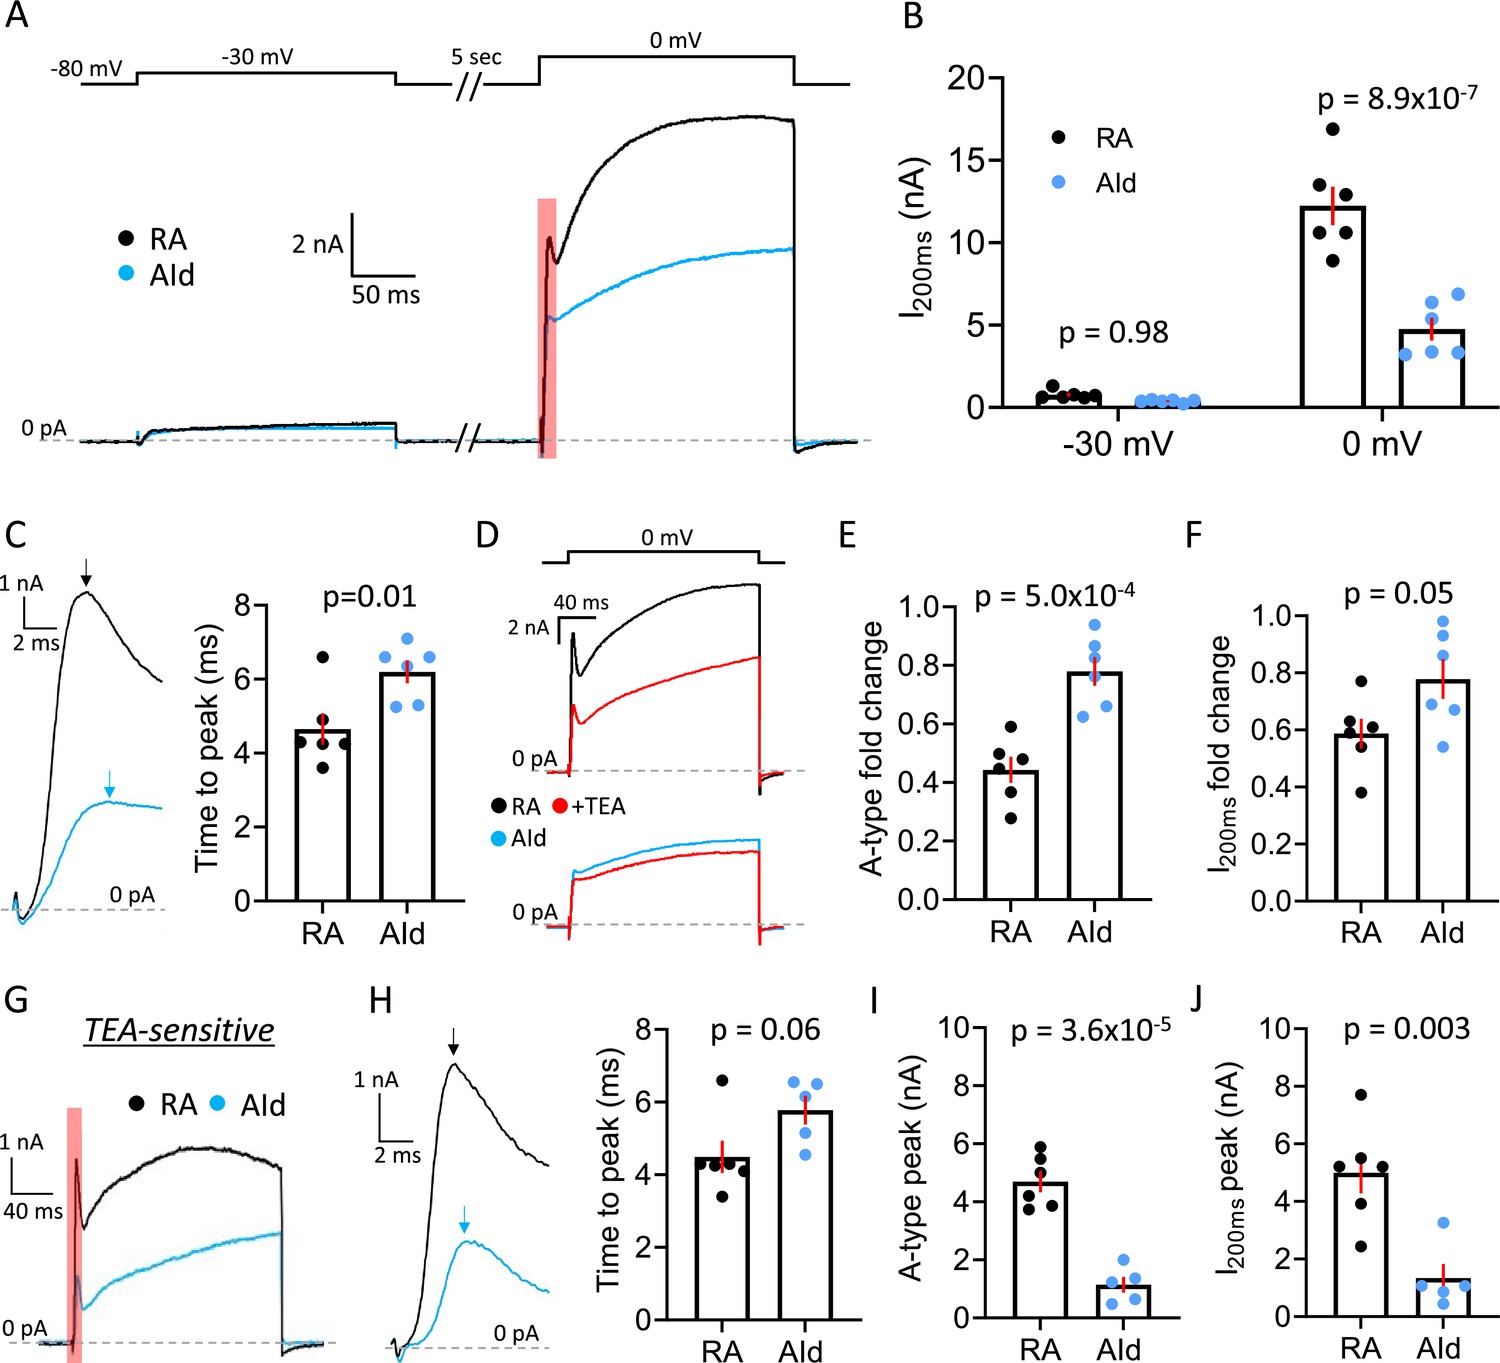
Comparison of IK+ between robustus arcopallialis projection neurons (RAPNs) and dorsal intermediate arcopallium (AId) neurons.
(A) Representative voltage-clamp recordings of IK+ in an RAPN and an AId neuron at –30 mV and 0 mV. Shown at the top are the test pulses separated by 5 s at –80 mV, with a 5 s inter-sweep interval at –80 mV. (B) Comparison of the peak current at 200 ms (I200ms) during both the –30 mV and 0 mV test pulses in RAPNs and AId neurons (two-way ANOVA: p=3.8 × 10⁻⁵, F(1,20)=27.62, N=6 RAPNs and 6 AId neurons). Red bars indicate SEM. Individual p-values determined by Tukey’s post hoc test. (C) Left: Expanded view of the A-type current component highlighted in (A). Arrows point to the peak of the A-type component of the current. Right: Comparison of the time to peak of both currents as measured from the onset of the voltage step to the peak of the A-type current (Student’s t-test, tstat = 2.951, N=6 RAPNs and 6 AId neurons). (D) Representative voltage-clamp recordings of a RAPN (black; top) and AId neurons (blue; bottom) before and during exposure to 500 µM TEA (red) at the 0 mV test pulse. (E) Comparison of the fold change in the initial A-type peak of IK+ elicited at 0 mV between RAPNs and AId neurons (Student’s t-test, two-tailed, tstat = 5.062, N=6 RAPNs and 6 AId neurons). Red bars indicate SEM. (F) Comparison of the fold change in the I200ms of the IK+ elicited at 0 mV between RAPNs and AId neurons (Student’s t-test, two-tailed, tstat = 2.200, N=6 RAPNs and 6 AId neurons). Red bars indicate SEM. (G) Representative TEA-sensitive currents from the 0 mV test pulse in an RAPN (black) and an AId neuron (blue). (H) Left: Expanded view of the A-type current component highlighted in (A). Arrows pointing to the peak of the A-type component of the current highlighted in (G). Right: Comparison of the time to peak of both currents as measured from the onset of the voltage step to the peak of the A-type current (Student’s t-test, tstat = 2.118, N=6 RAPNs and 5 AId neurons). (I) Comparison of the peak of the A-type component of the TEA-sensitive current (Student’s t-test, tstat = 7.528, N=6 RAPNs and 5 AId neurons). Red bars indicate SEM. (J) Comparison of the I200ms peak (Student’s t-test, tstat = 4.028, N=6 RAPNs and 5 AId neurons). Red bars indicate SEM.
Figure 6—figure supplement 1
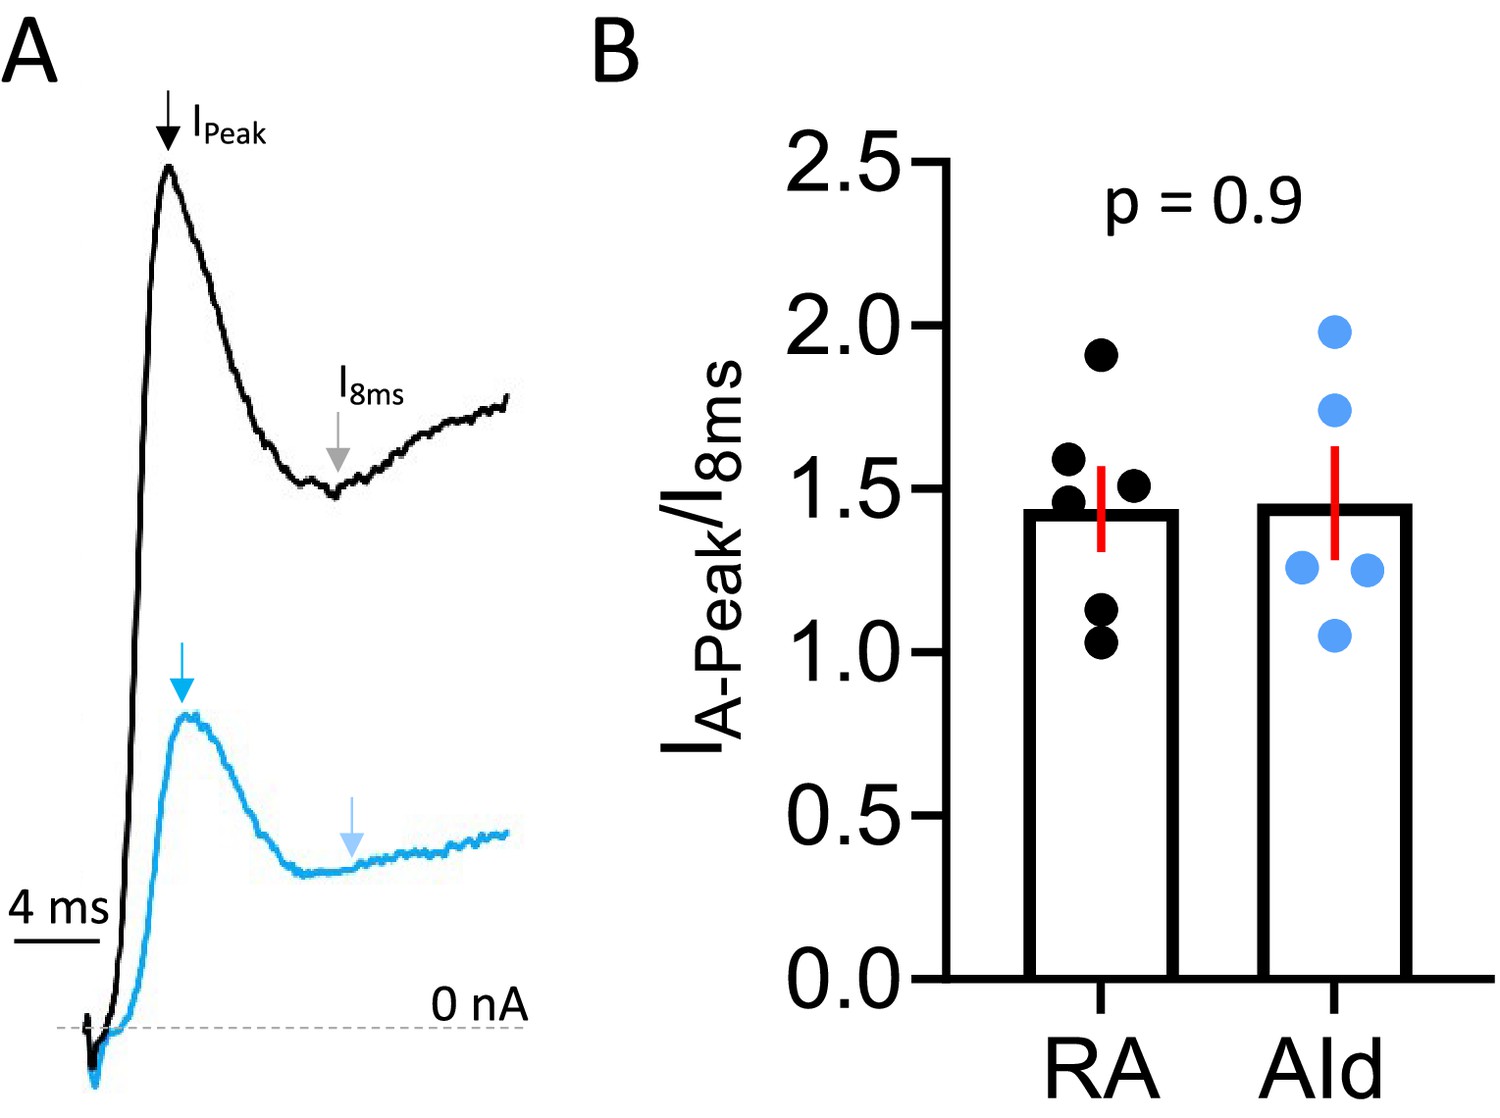
Inactivation of tetraethylammonium (TEA)-sensitive IK+ in robustus arcopallialis projection neurons (RAPNs) and dorsal intermediate arcopallium (AId) neurons.
(A) First 20 ms of an outward TEA-subtracted IK+ during a step from –80 mV to 0 mV highlighting the inactivation of currents from RAPNs and AId neurons. Arrows point to the peak of the A-type component from an RAPN (black), AId neuron (blue) and 8 ms after the peak (gray and light blue arrows, respectively). (B) Comparison of the fold change in current from the peak of the A-type component and the current 8 ms after the peak between RAPNs and AId neurons (Student’s t-test, tstat = 0.08, N=6 RAPNs and 5 AId neurons).
Figure 7 with 3 supplements
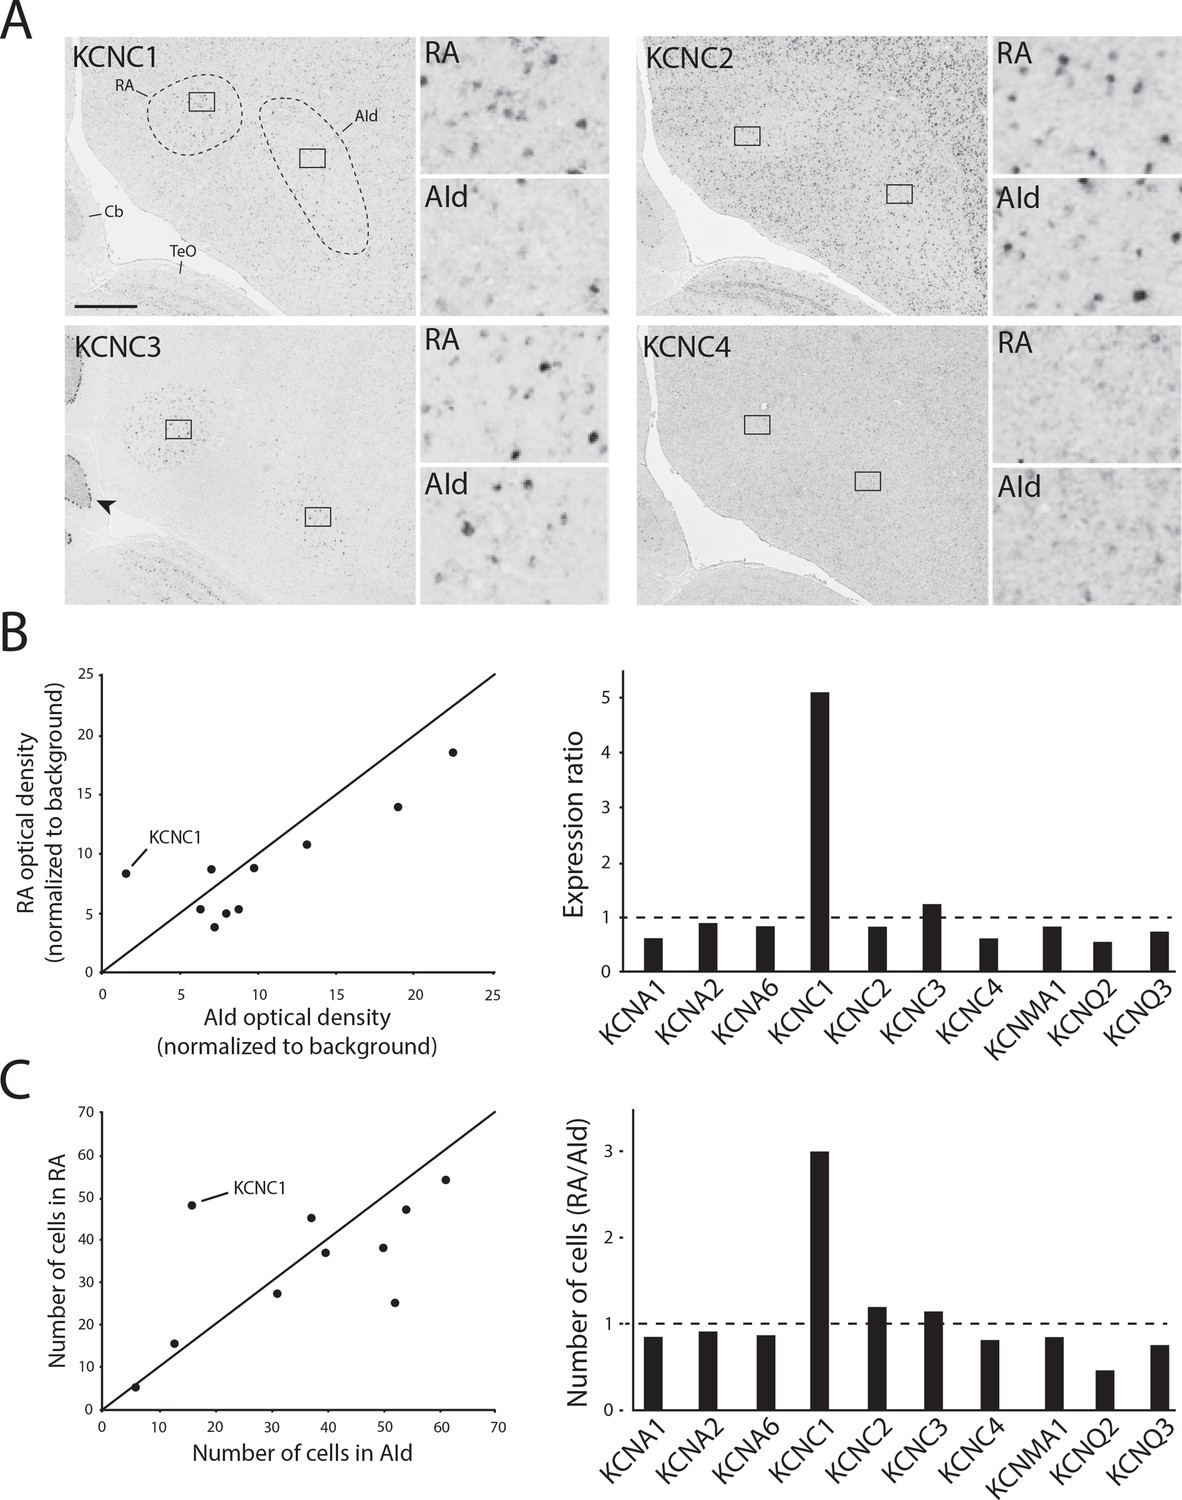
K+ channel diversity in the zebra finch arcopallium: Stronger expression of KCNC1 (Kv3.1 subunit) transcripts in RA than in dorsal intermediate arcopallium (AId).
(A) Representative in situ hybridization images for Kv3 channel family member transcripts in RA (left) and AId (right), from nearly adjacent frontal sections of adult males. Squares in large images depict position of counting windows and of inset images for RA and AId. Arrow points to strong Kv3.3 mRNA staining in the Purkinje cell layer in the cerebellum. Cb - cerebellum, TeO - optic tectum. Scale bar: 500 µm. (B) Optical density measurements (background subtracted) in RA and AId for subunits associated with tetraethylammonium (TEA)-sensitive Kv channel types. Expression ratio (right) was calculated as RAOD/AIdOD. (C) Labeled cell counts in RA and AId for subunits associated with TEA-sensitive Kv channel types. Cell count ratios of RA/AId are shown on right.
Figure 7—figure supplement 1
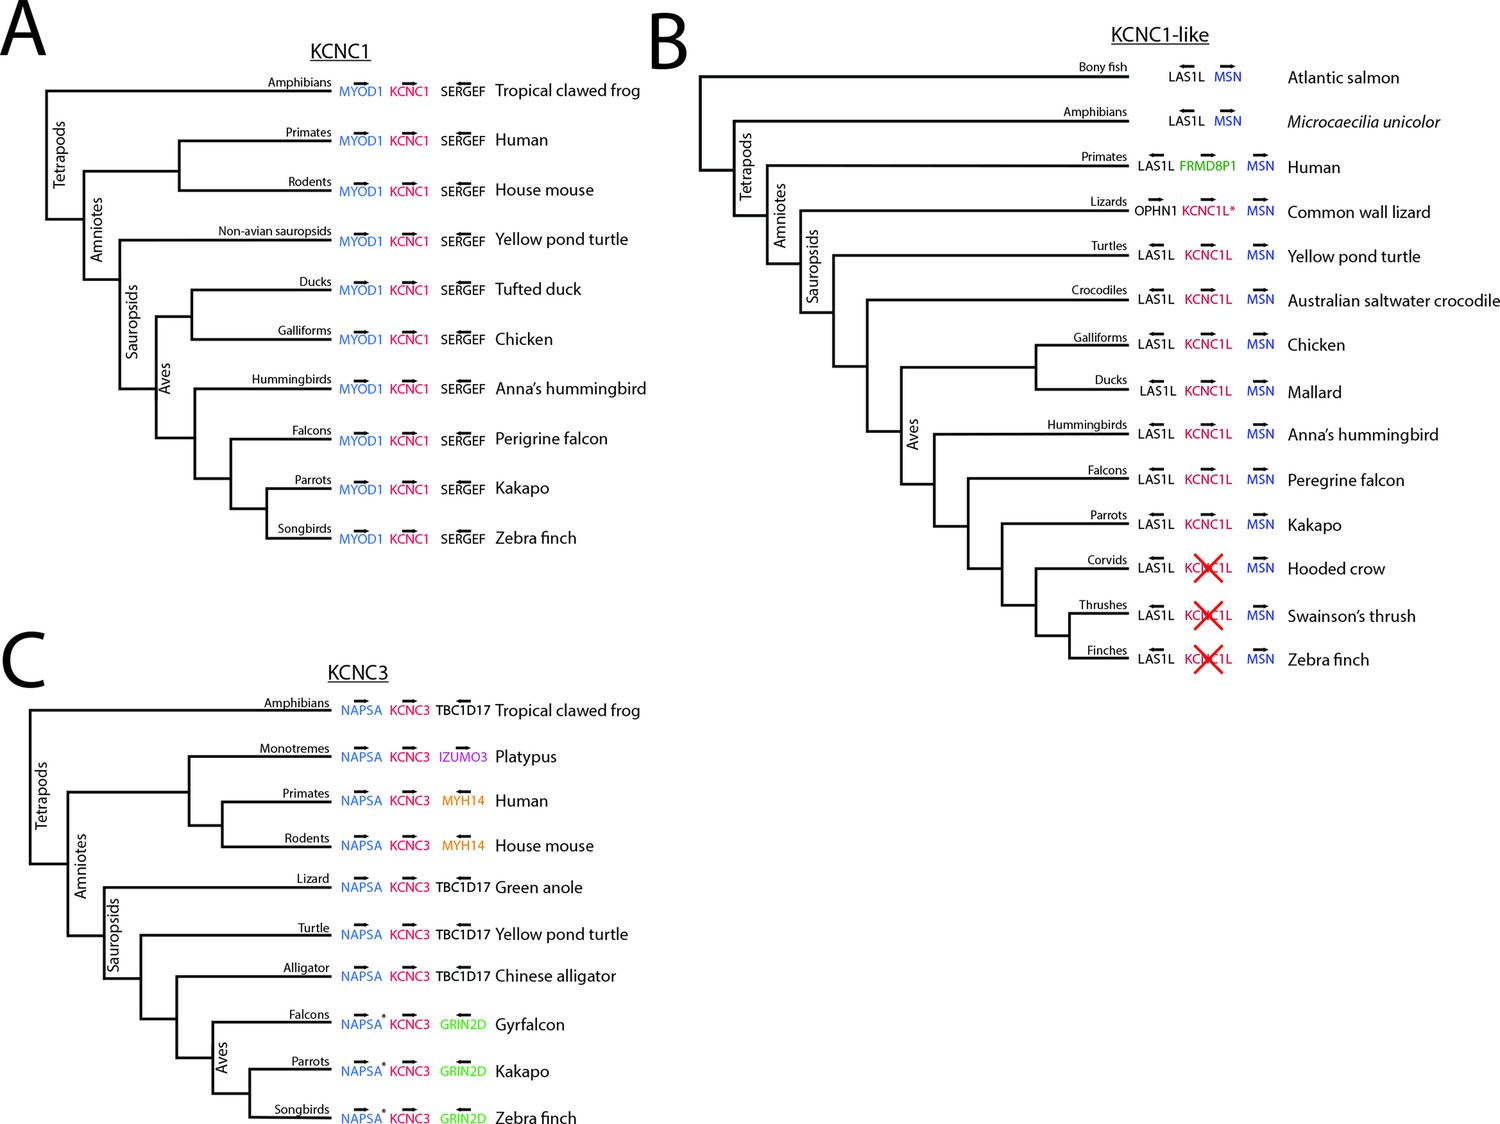
Comparative genomics of KCNC/Kv3 family members.
(A) Simplified cladogram for KCNC1 showing conserved synteny throughout vertebrate groups. (B) Simplified cladogram for a KCNC1-like (KCNC1L) paralog present in non-oscine sauropsids, noting that no gaps in sequence are present in the songbird genome regions shown. Asterisk denotes a possible duplication at the KCNC1L locus in lizards. The avian locus we identify here as KCNC1L is consistently annotated as such in NCBI in the Anna’s hummingbird (LOC103535180), peregrine falcon (LOC101916395), and kakapo (LOC115612452), but unannotated in chicken (LOC121110537) and mallard (LOC119717969). The same avian KCNC1L locus is misannotated as KCNC3-like in NCBI for the swan goose (LOC125184401), downy woodpecker (LOC104306393), little egret (LOC104122410), common cuckoo (LOC104054307), hoatzin (LOC104336283), golden eagle (LOC115333930), bald eagle (LOC104834773), northern goshawk (LOC126050308), saker falcon (LOC102060204), and gyrfalcon (LOC119157422). (C) Simplified cladogram for KCNC3 showing the presence in birds with partial conserved synteny across vertebrate groups. The avian locus we identify here as KCNC3 is misannotated in NCBI as KCNC1 in zebra finch (LOC115491734) and as KCNC1-like in gyrfalcon (LOC119148395) and in kakapo (LOC115602917). For avian species not shown, the same misannotation is in NCBI for the Swainson’s thrush (LOC117009755) and small tree finch (LOC115916662), but the locus is correctly identified as KCNC3-like in the Eurasian tree sparrow (LOC120505231) and the crested ibis (LOC104012499). Asterisk denotes NAPSA annotated as cathepsin D-like in birds. A set of avian loci incorrectly annotated in NCBI as KCNC3-like and identified here as KCNCL1 is listed in C. Note: For all cladograms, branch lengths are arbitrary and not calibrated for time, and only selected extant branches from major vertebrate groups are shown, to illustrate synteny conservation/divergence.
Figure 7—figure supplement 2
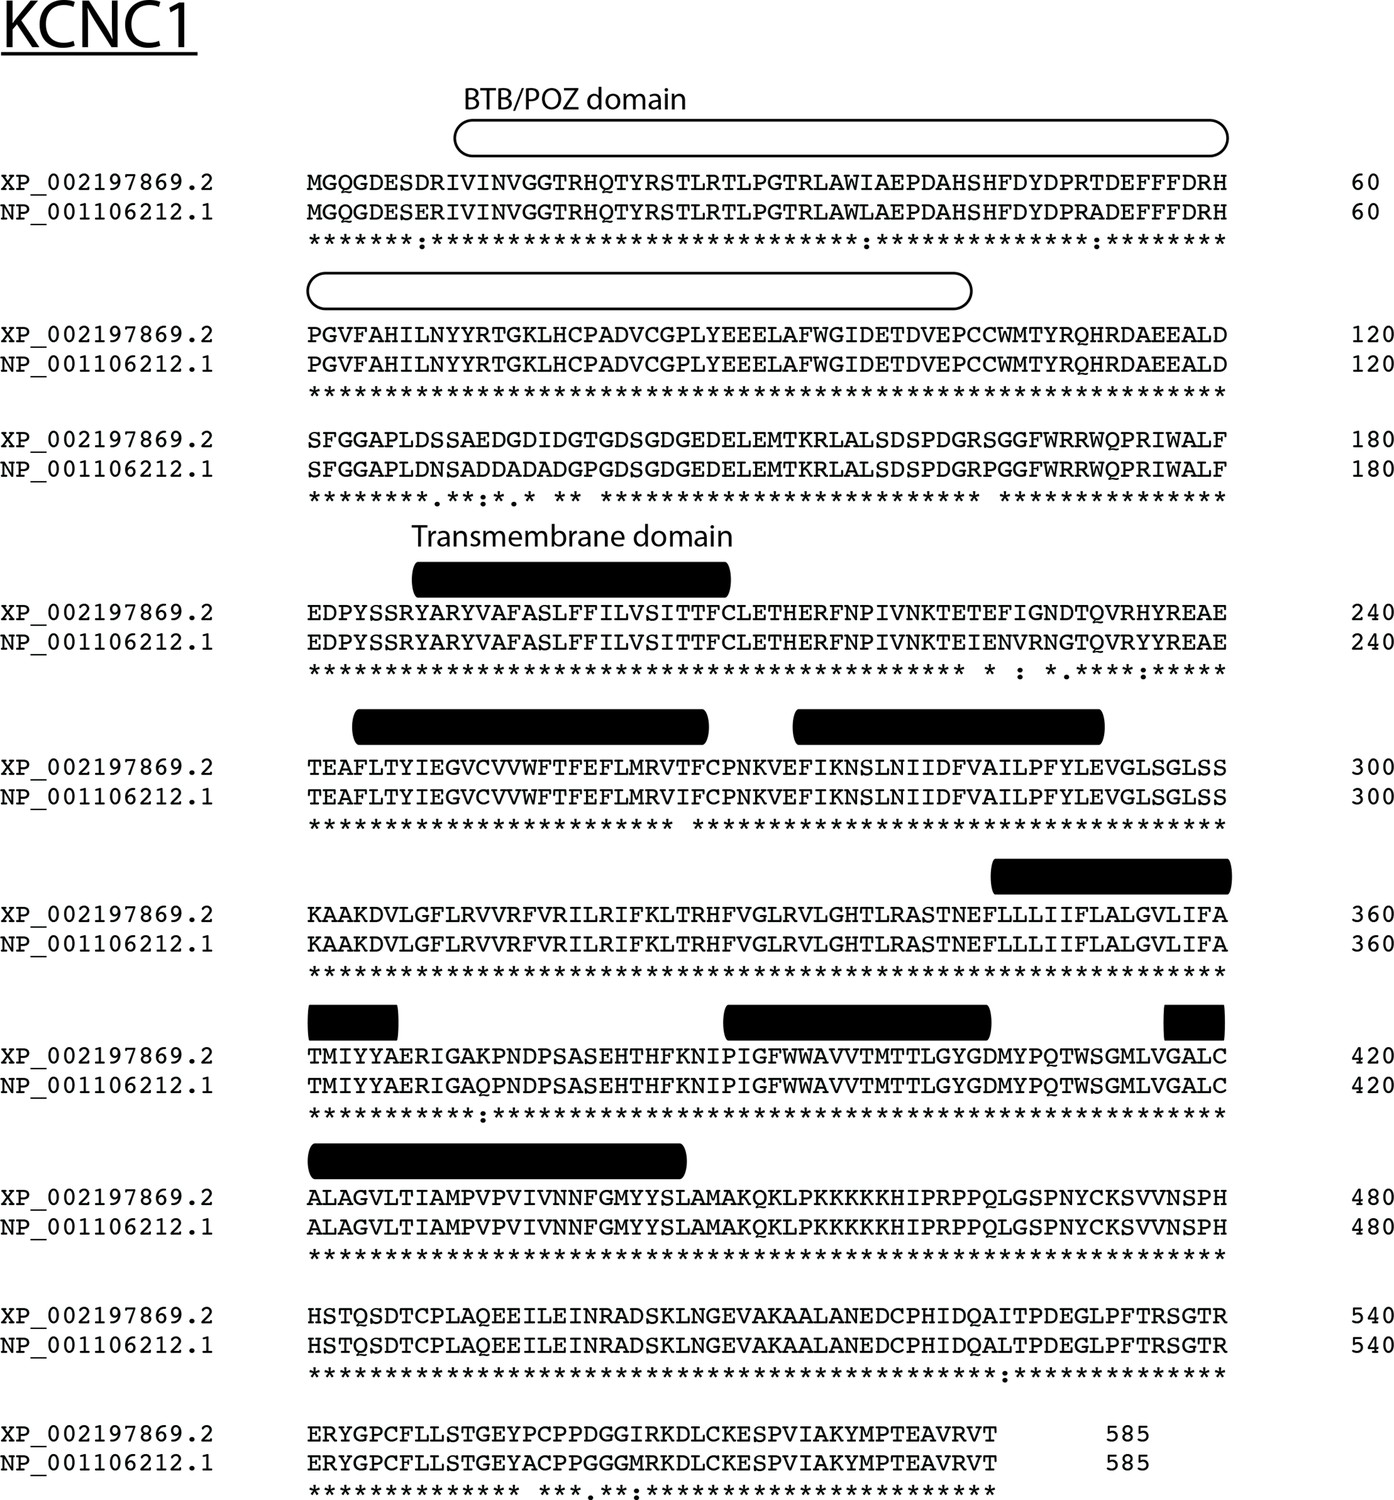
Amino acid alignment between Kv3.1 in human (top) and zebra finch (bottom).
The two orthologs exhibit a high degree of amino acid conservation.
Figure 7—figure supplement 3
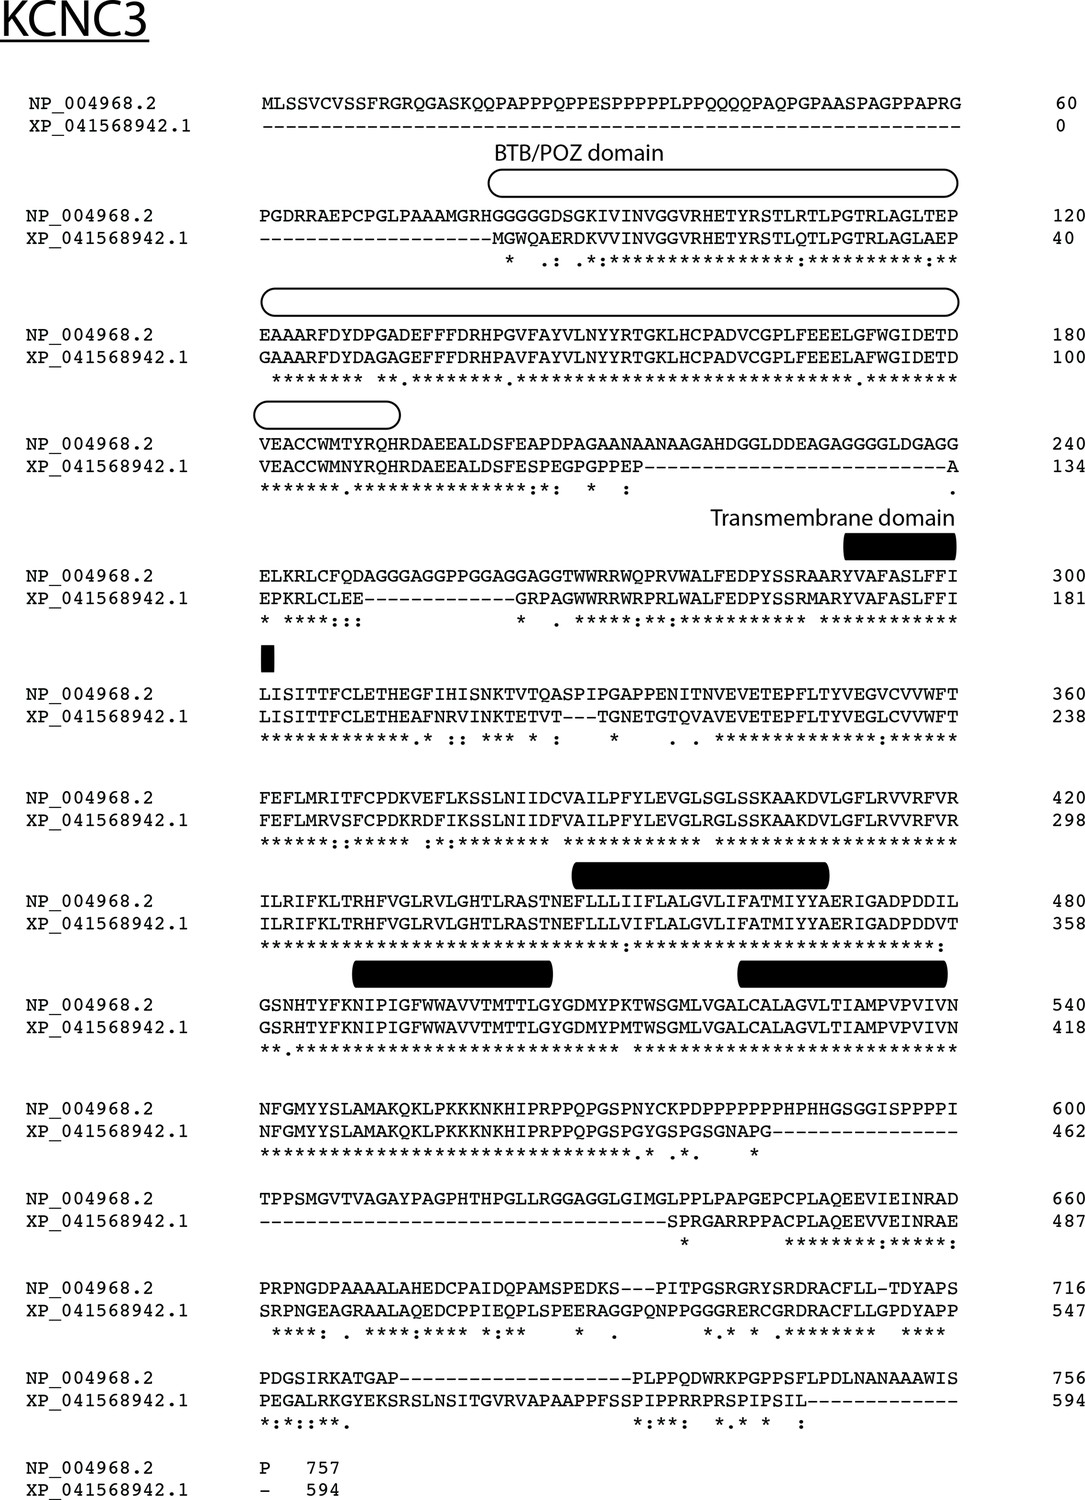
Amino acid alignment between Kv3.3 in human (top) and zebra finch (bottom).
Amino acid conservation moderate and zebra finch appears to lack N-terminal domain present in humans.
Figure 8
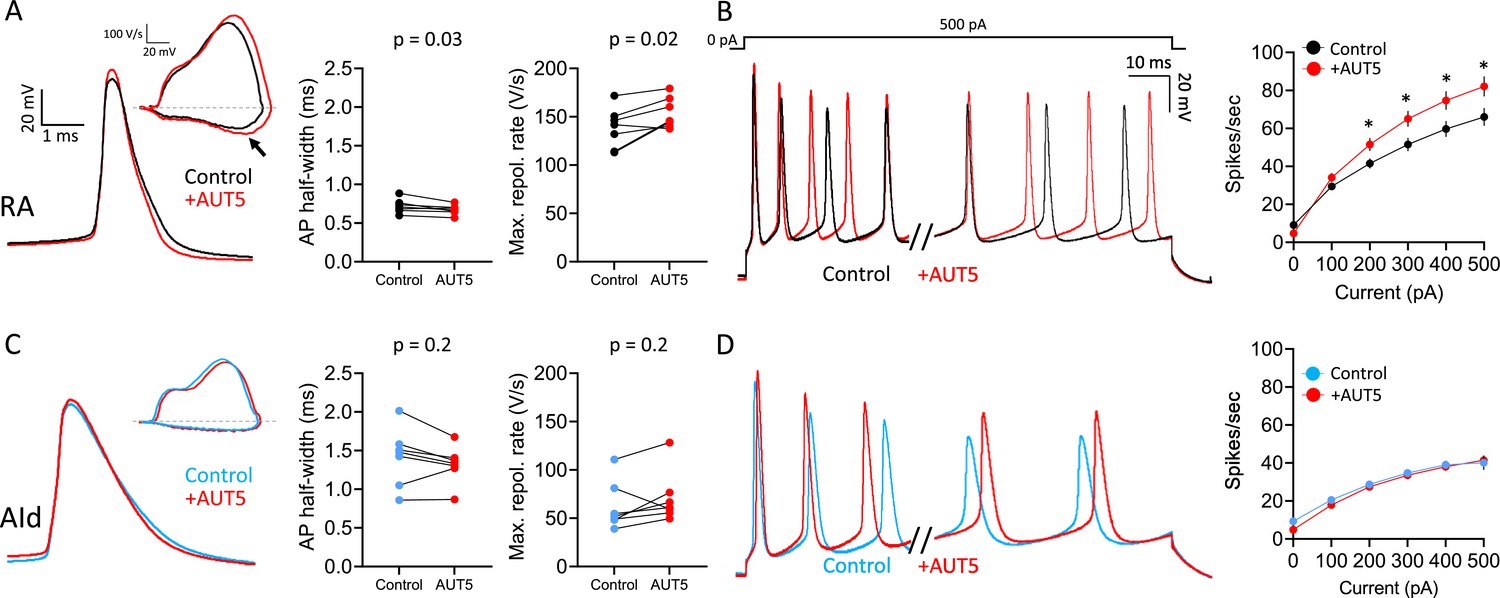
Effects of the Kv3.1/3.2 positive modulator AUT5 on action potentials (APs) of robustus arcopallialis projection neuron (RAPN) and dorsal intermediate arcopallium (AId) neurons.
(A) Left to right: Representative AP traces, phase plane plots (inset), and changes in AP half-width and maximum repolarization rate upon exposure to 1 µM AUT5 for RAPNs. The black arrow points to the change in the maximum rate of repolarization. AP half-width: paired Student’s t-test, two-tailed, tstat = 2.838, N=7 RAPNs; maximum repolarization rate: paired Student’s t-test, two-tailed, tstat = 3.095, N=7 RAPNs. (B) Left to right: First 40 ms and last 65 ms of representative AP traces elicited by a 1 s 500 pA current injection and average evoked firing rates (spikes/s) before and after exposure to 1 µM AUT5 for RAPNs. Repeated measures two-way ANOVA; p=3.1 × 10⁻¹², F(5,30)=32.40, N=7 RAPNs; * indicates p<0.05; Tukey’s post hoc tests. (C) Left to right: Representative AP traces, phase plane plots (inset), and changes in AP half-width and maximum repolarization rate upon exposure to 1 µM AUT5 for AId neurons. AP half-width: paired Student’s t-test, tstat = 1.483, N=7 AId neurons, two-tailed; maximum repolarization rate: paired Student’s t-test, two-tailed, tstat = 1.523, N=7 AId neurons. Same scale as in (A). (D) Left to right: First 40 ms and last 65 ms of representative AP traces elicited by a 1 s 500 pA current injection and average evoked firing rates (spikes/s) before and after exposure to 1 µM AUT5 for AId neurons. Repeated measures two-way ANOVA; p=0.18, F(5,30)=1.658, N=7 AId neurons. Same scale as in (B).
Tables
Table 1
Passive and spontaneously active spike properties of adult male robustus arcopallialis projection neurons (RAPNs) and dorsal intermediate arcopallium (AId) neurons.
Statistical analysis compared RAPN and AId neurons at each temperature respectively. Statistics were performed using unpaired, two-tailed, Student’s t-tests if data was normally distributed with equal variances. Otherwise a Mann-Whitney U test was used. Data shown as mean ± SEM. Room temperature comparisons: Spont. AP frequency - p=0.7, tstat = 0.3825, AP thresh - p=0.09, tstat = 1.696, AP amp - p=0.05, tstat = 1.971, AP half-width - p=2.4 × 10⁻¹³, U=11, Max. depol. rate - p=4.0 × 10⁻⁶, tstat = 4.988, Max. repol. rate - p=3.1 × 10⁻¹³, U=14, AP peak - p=0.2, tstat = 1.255, AHP - p=0.0001, tstat = 4.090, τm - p=0.5, tstat = 0.7259, Cm - p=0.2, tstat = 1.326, Rin - p=0.3, tstat = 1.160. High-temperature comparisons: Spont. AP frequency - p=0.0002, U=14, AP thresh- p=0.7, tstat = 0.3301, AP amp - p=0.2, tstat = 1.302, AP half-width - p=1.2 × 10⁻¹⁰, tstat = 11.33, Max. depol. rate - p=0.6, tstat = 0.4644, Max. repol. rate - p=0.02, tstat = 2.504, AP peak - p=0.1, tstat = 1.568, AHP - p=0.006, tstat = 3.025, τm - p=0.01, tstat = 2.735, Cm - p=0.3, tstat = 1.027, Rin - p=0.004, tstat = 3.280. Statistical significance: *=p < 0.05.
| RA (24°C) | AId (24°C) | RA (40°C) | AId (40°C) | |
|---|---|---|---|---|
| Spont. AP freq. (Hz) | 13.6±1.71 N=39 | 12.9±1.14 N=36 | 41±6.70 N=13 | 13.2±2.47 N=11 |
| AP thresh. (mV) | –55.3±0.66 N=39 | –53.7±0.62 N=36 | –52.0±1.00 N=13 | –52.7±1.71 N=11 |
| AP amp. (mV) | 92.8±1.53 N=39 | 89.0±1.39 N=36 | 96.3±3.57 N=13 | 102.8±3.28 N=11 |
| AP half-width (ms) | 0.57±0.02* N=39 | 1.23±0.05 N=36 | 0.16±0.01* N=13 | 0.32±0.01 N=11 |
| Max. depol. rate (V/s) | 658.4±26.53* N=39 | 477.1±24.59 N=36 | 1288.5±67.11 N=13 | 1339.4±85.34 N=11 |
| Max. repol. rate (V/s) | 181.9±7.75* N=39 | 64.5±3.71 N=36 | 764.7±92.41* N=13 | 482.3±52.83 N=11 |
| AP peak (mV) | 37.4±0.96 N=39 | 35.5±1.19 N=36 | 44.5±2.87 N=13 | 50.3±2.09 N=11 |
| AHP (mV) | –71.9±0.53 N=39 | –68.4±0.67 N=36 | –65.7±0.92 N=13 | –69.2±0.61 N=11 |
| τm (ms) | 17.4±1.9 N=8 | 15.2±2.3 N=6 | 17.2±1.36* N=10 | 13.3±0.60 N=12 |
| Cm (pF) | 115.4±22.77 N=8 | 75.8±15.65 N=6 | 96.1±7.39 N=10 | 106.8±7.44 N=12 |
| Rin (MΩ) | 176.6±22.11 N=8 | 209.2±13.03 N=6 | 185.2±15.02* N=10 | 129.08±8.81 N=12 |
-
Abbreviations - Spont. AP frequency: AP spikes produced per second, AP thresh.: AP threshold, AP amp.: AP amplitude as measured from the peak of the after-hyperpolarization to the AP peak, Max. depol. rate: maximum depolarization rate derived from the AP phase plane plot. Max. repol. rate: maximum repolarization rate derived from the AP phase plane plot, AHP: peak of the AP after-hyperpolarization, tm: membrane time constant, Rin: input resistance, Cm: membrane capacitance.
Additional files
-
Supplementary file 1
Raw data from all figure panels and tables.
Geometrical properties and spine densities measured from the reconstructions of the neuronal morphologies. Values of the axon area include only the visible portions connected to the soma. Axons excluded from volume measurements.
- https://cdn.elifesciences.org/articles/81992/elife-81992-supp1-v2.docx
-
MDAR checklist
- https://cdn.elifesciences.org/articles/81992/elife-81992-mdarchecklist1-v2.pdf
-
Source data 1
Raw data from all figure panels and tables.
- https://cdn.elifesciences.org/articles/81992/elife-81992-data1-v2.xlsx
Download links
A two-part list of links to download the article, or parts of the article, in various formats.
Downloads (link to download the article as PDF)
Open citations (links to open the citations from this article in various online reference manager services)
Cite this article (links to download the citations from this article in formats compatible with various reference manager tools)
Motor cortex analogue neurons in songbirds utilize Kv3 channels to generate ultranarrow spikes
eLife 12:e81992.
https://doi.org/10.7554/eLife.81992


