Tenotomy-induced muscle atrophy is sex-specific and independent of NFκB
- Program in Physical Therapy, Washington University School of Medicine, United States
- Department of Orthopaedic Surgery, Washington University School of Medicine, United States
- Departments of Neurology and Biomedical Engineering, Washington University School of Medicine, United States
- Departments of Orthopaedic Surgery and Biomedical Engineering, Columbia University, United States
- Department of Cell Biology & Physiology, Washington University School of Medicine, United States
- Shriners Hospital for Children, United States
Figures
Figure 1

WT control mice exhibited sex-specific responses to late-stage tenotomy-induced muscle atrophy.
(A) Supraspinatus (SS) and infraspinatus (IS) muscles from male mice lose more mass than female muscles at 8 weeks (W8) post-tenotomy (TEN). Muscle mass is normalized to body mass and the average value from the sham group for each sex. (B) Type 2b fiber cross-sectional area (CSA), assessed in histological sections, is also significantly reduced in males compared with females at W8. (C) The total number of fibers counted per histological section is significantly reduced in the female SS compared with male at W8. (D) Prediction of fiber lengths from measured muscle lengths during physiological testing indicates that female SS muscles lose a greater fraction of their fiber length at both W2 and W8 post-tenotomy. (E) Predictions of the contributions of each morphological change (B–D) to the measured mass deficit (A). Change in (Δ) fiber length (dark gray), fiber number (light gray), and fiber CSA (white) show different trends for males and females at W2 and W8 post-tenotomy. (F) The mass deficit predicted by morphological changes and the mass deficit measured at W2 and W8 are significantly correlated. (A–D) Raw values were normalized to the average of the sham group of the same sex. N = 5–7 per group; *p<0.05, **p<0.01.
-
Figure 1—source data 1
Raw data and statistical analysis results for normalized supraspinatus (SS) mass, normalized infraspinatus (IS) mass, normalized type 2b fiber cross-sectional area (CSA), normalized fiber number, normalized fiber length, % contribution to mass deficit, and predicted vs. measured mass deficit.
- https://cdn.elifesciences.org/articles/82016/elife-82016-fig1-data1-v2.xlsx
Figure 2 with 1 supplement

Muscle-specific inducible deletion and overexpression of IKKβ induced a twofold decrease and increase in IKKβ expression, respectively.
(A) In mice with muscle-specific inducible IKKβ deletion (IKKbMKD), expression of the IKKβ gene (Ikbkb) was reduced 50–60% in male and female sham (SHM) and tenotomized (TEN) supraspinatus (SS) at week 1 (W1) and week 8 (W8) compared with wildtype (WT). (B) In mice with muscle-specific inducible overexpression of constitutively active IKKβ (IKKbMCA), Ikbkb expression was increased two- to threefold in SHM and TEN groups at W8. (C) Protein abundance of IKKβ was 50–60% lower in IKKbMKD compared with WT. (D) Protein abundance of IKKβ was two- to threefold higher in IKKbMCA compared with WT. (E) Protein abundance of NFκB subunits p50 and p65 in the nuclear fraction of SS muscles was reduced 50–60% in IKKbMKD compared with WT. N = 3–6 per group; *p<0.05, **p<0.01, ***p<0.005, ****p<0.001.
-
Figure 2—source data 1
Raw data and statistical analysis results for relative Ikkb expression, IKKβ/actin, and nuclear p50/histone H3.
- https://cdn.elifesciences.org/articles/82016/elife-82016-fig2-data1-v2.xlsx
-
Figure 2—source data 2
Western blot raw and uncropped images.
- https://cdn.elifesciences.org/articles/82016/elife-82016-fig2-data2-v2.zip
Figure 2—figure supplement 1
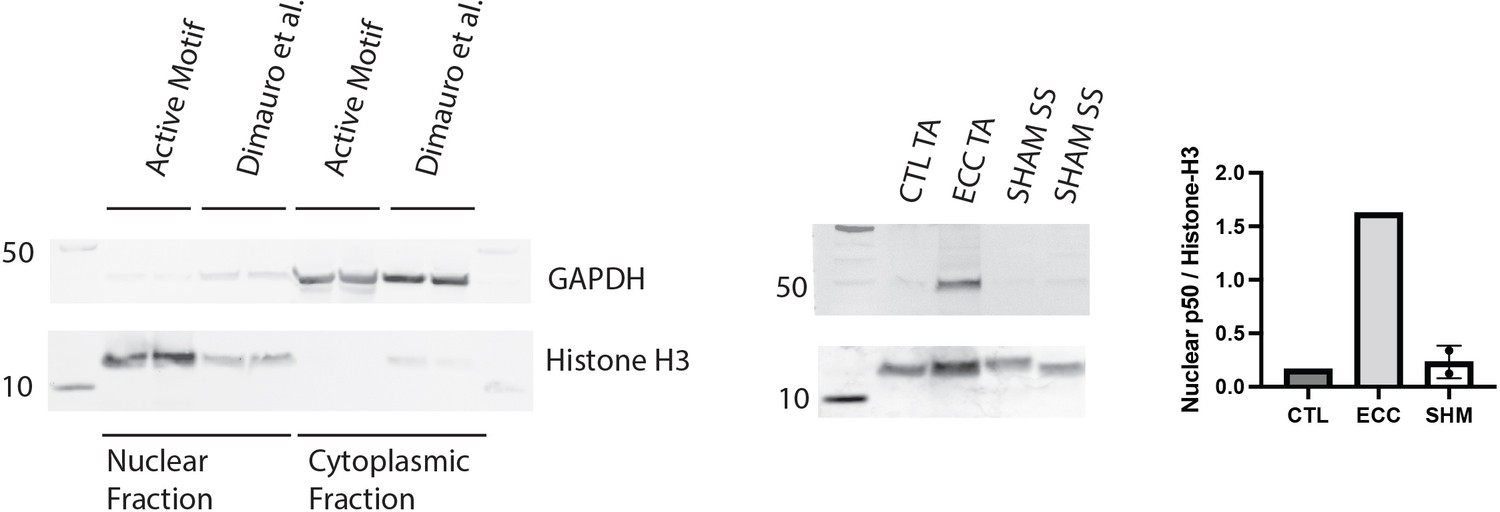
Validation of assays with positive controls.
Validation of the Active Motif nuclear extract kit against a literature-validated protocol designed for skeletal muscle (left). Western blot of nuclear p50 in protein extracts from a tibialis anterior (TA) muscle subjected to 50 eccentric contractions (ECC) 1 hr prior to harvest, the contralateral control TA (CTL), and two samples from the week 1 (W1) WT male sham (SHM) group (right). Nuclear p50 is expected to be elevated following eccentric exercise (Jiménez-Jiménez et al., 2008).
-
Figure 2—figure supplement 1—source data 1
Nuclear p50/histone-H3.
- https://cdn.elifesciences.org/articles/82016/elife-82016-fig2-figsupp1-data1-v2.xlsx
-
Figure 2—figure supplement 1—source data 2
Western blot raw and uncropped images.
- https://cdn.elifesciences.org/articles/82016/elife-82016-fig2-figsupp1-data2-v2.zip
Figure 3

IKKβ deletion and overexpression modestly affected muscle mass in sham (SHM) and tenotomy (TEN) groups without uniquely affecting muscle loss post-tenotomy.
(A) Supraspinatus (SS) muscles from IKKbMKD mice had a minor increase in mass normalized to body mass in both SHM (left) and TEN (right) groups compared with WT. (B) Infraspinatus (IS) muscles from IKKbMKD mice similarly had a minor increase in normalized mass compared with WT. (C) When SS mass was normalized to tibialis anterior (TA) mass, there was no difference between IKKbMKD and WT groups. (D) IS muscles from IKKbMCA mice had a minor decrease in muscle mass in the TEN group at week 8 (W8) compared with WT. (E) IS muscles from IKKbMCA mice similarly had a minor decreased in normalized mass compared with WT in the TEN group only. (F) When SS mass was normalized to TA mass, there was no difference between IKKbMCA and WT groups. (A–F) Dotted lines are the average of all sham values included for reference. *p<0.05 between genotypes within the same sex and timepoint. †p<0.05 compared with week (W1) values within the same sex and genotype. N = 5–7 per group; &p<0.05 compared with sham values within the same sex and genotype.
-
Figure 3—source data 1
Raw data and statistical analysis results for normalized supraspinatus (SS) mass/body mass, infraspinatus (IS) mass/body mass, SS mass/tibialis anterior (TA) mass and IS mass/TA mass.
- https://cdn.elifesciences.org/articles/82016/elife-82016-fig3-data1-v2.xlsx
Figure 4
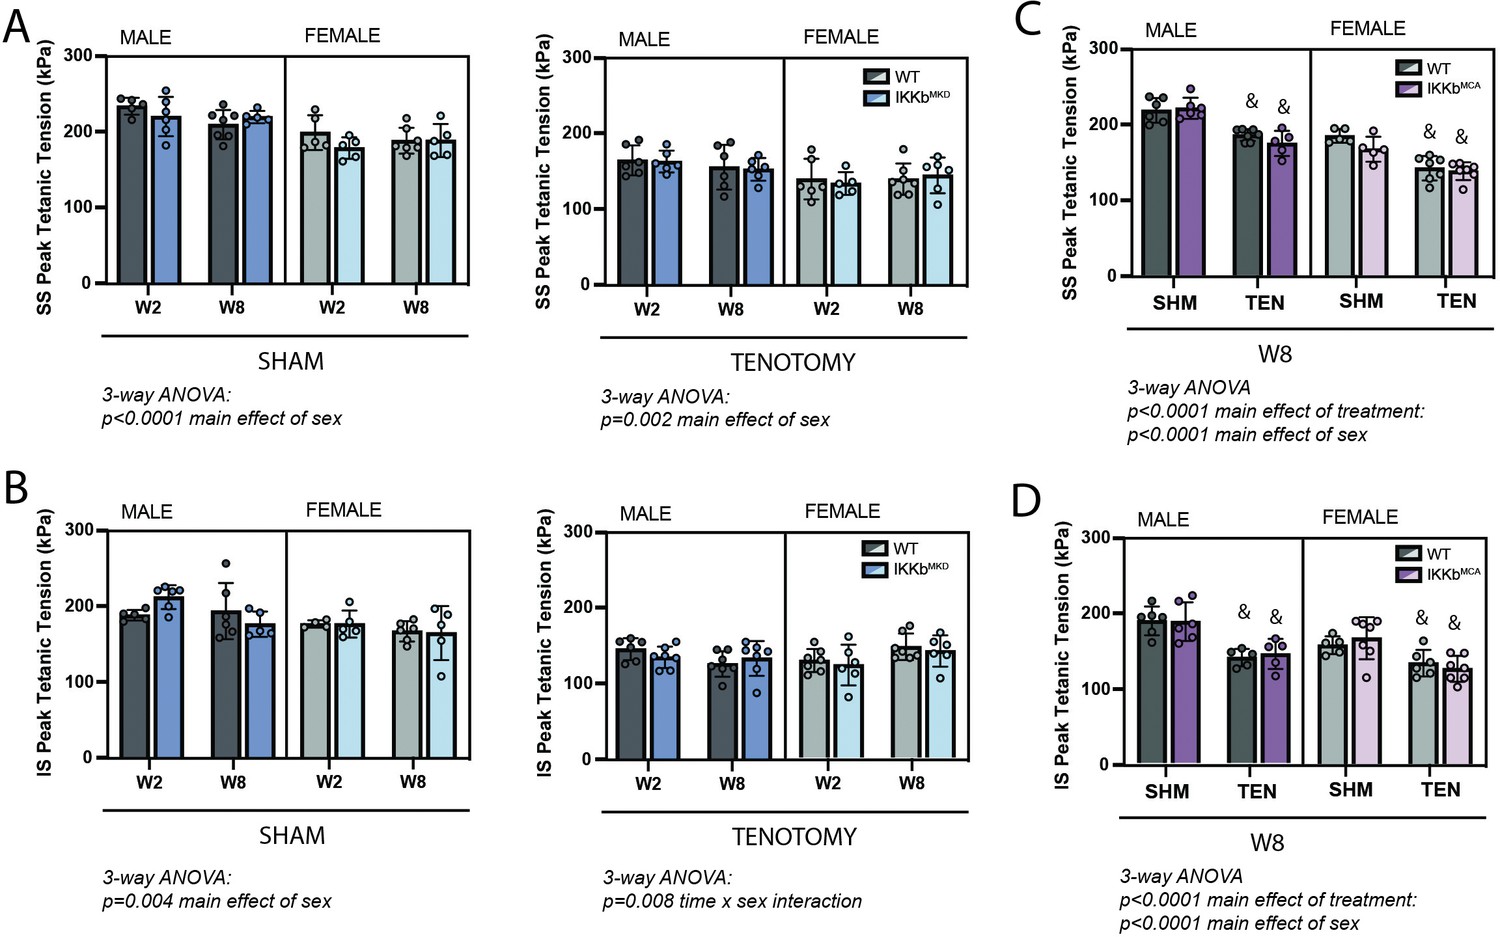
IKKβ deletion and overexpression did not affect the loss of tetanic tension following tenotomy (TEN).
(A) Peak tetanic tension of supraspinatus (SS) muscles normalized to physiological cross-sectional area (PCSA) is not different between WT and IKKbMKD genotypes in sham (SHM) (left) and TEN (right) groups. (B) Peak tetanic tension of infraspinatus (IS) muscles is also not different between WT and IKKbMKD genotypes in SHM (left) and TEN (right) groups. (C) Peak tetanic tension of SS muscles is not different between WT and IKKbMCA genotypes in SHM and TEN groups. (D) Peak tetanic tension of IS muscles is not different between WT and IKKbMCA genotypes in SHM and TEN groups. N = 5–7 per group; &p<0.05 compared with sham values within the same sex and genotype.
-
Figure 4—source data 1
Raw data and statistical analysis results for supraspinatus (SS) and infraspinatus (IS) peak tetanic tension.
- https://cdn.elifesciences.org/articles/82016/elife-82016-fig4-data1-v2.xlsx
Figure 5 with 1 supplement

Muscle morphological changes following tenotomy (TEN) were not affected by IKKβ knockdown and were sex-specific.
(A) Representative fiber-type staining of histological sections from sham (SHM) and TEN WT supraspinatus (SS) muscles at week 8 (W8). Fiber types were identified by immunostaining against isoforms of myosin heavy chain – type 1 (red), type 2a (blue), type 2x (black), and type 2b (green) – and area was quantified by the laminin border (magenta). (B) Distribution of cross-sectional areas (CSA) for type 2a, 2x, and 2b fibers for male and female mice at W8. Histograms of type 2b fiber CSA in male mice are shifted to the left following TEN. (C) Average CSA of type 2a fibers and (D) average CSA of type 2b fibers across genotypes and timepoints within the TEN group. Only type 2b fiber CSA in males decreases following tenotomy. (E) Count of the total number of fibers in the SS cross-section across genotypes and timepoints within the TEN group. (F) Prediction of fiber length from measurements of muscle length during physiological testing at W2 and W8 within the TEN group. No data exist at week 1 because physiological testing was not performed at that timepoint. (C–F) The dotted lines are the average of all sham values included for reference for each sex. N = 5–7 per group; †p<0.05 compared with week (W1) values within the same sex and genotype.
-
Figure 5—source data 1
Raw data and statistical analysis results for fiber cross-sectional area (CSA) histograms, fiber type CSA, fiber number, and predicted fiber length.
- https://cdn.elifesciences.org/articles/82016/elife-82016-fig5-data1-v2.xlsx
Figure 5—figure supplement 1
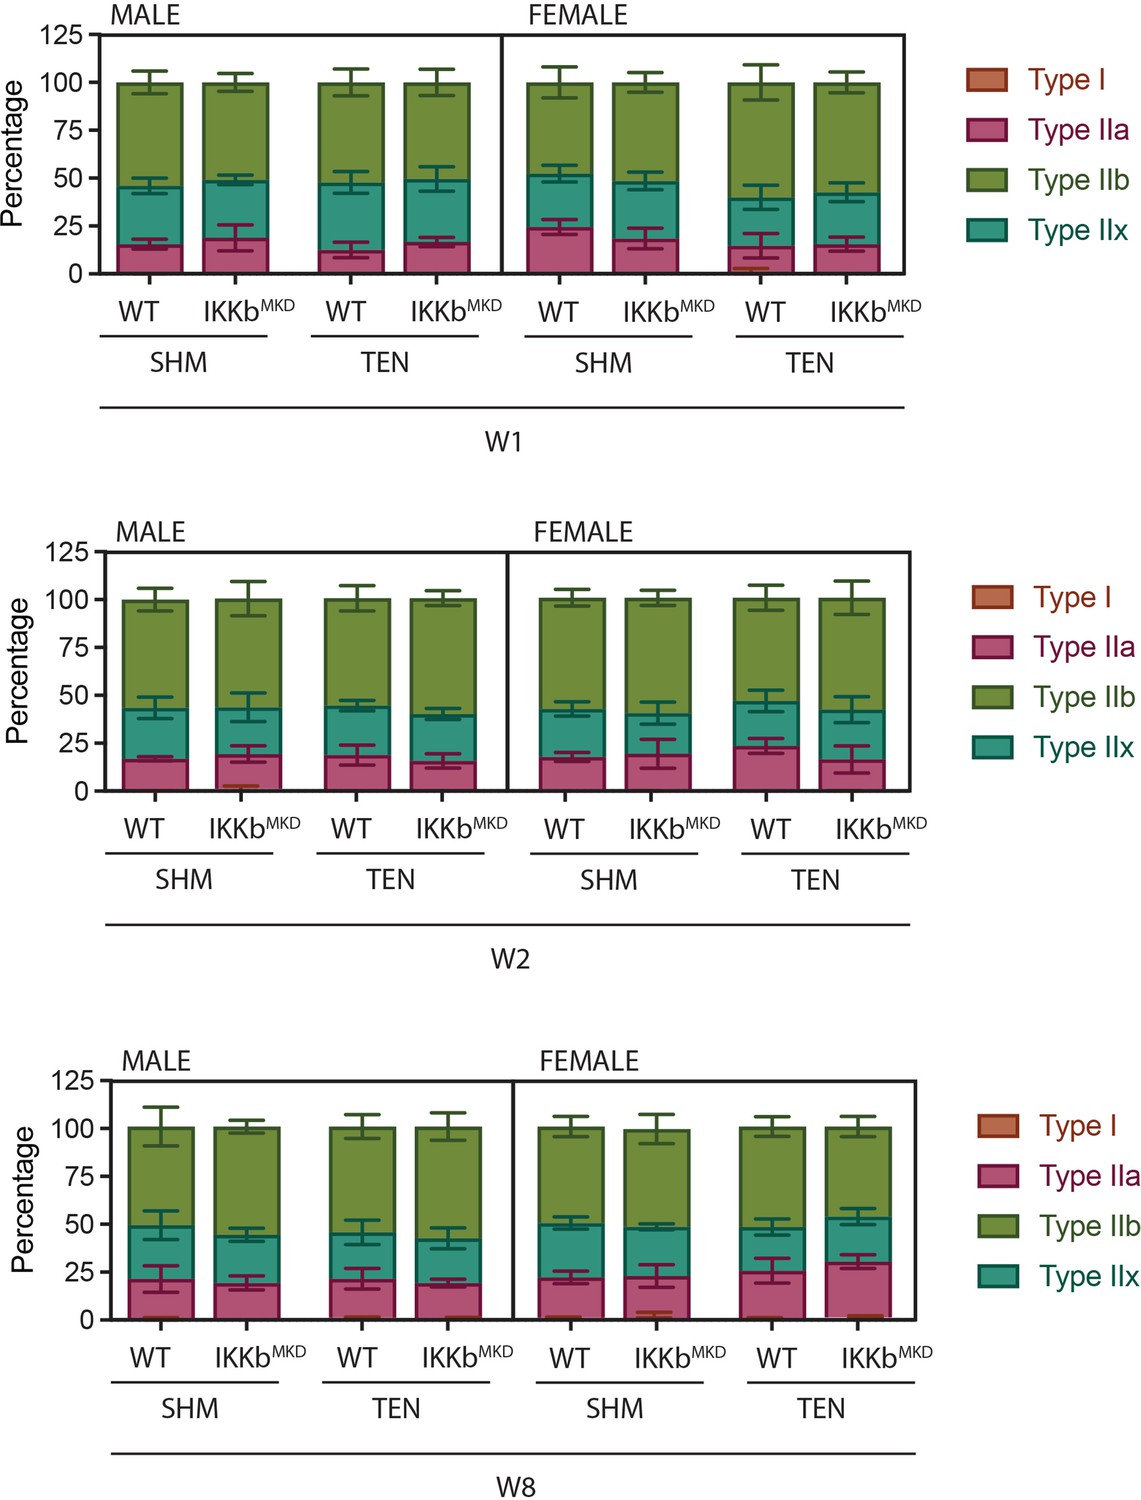
Fiber-type distribution is not altered by tenotomy or IKKβ knockdown.
Distribution of fiber types as quantified by myosin heavy chain isoform immunostaining on histological sections.
-
Figure 5—figure supplement 1—source data 1
Raw data and statistical analysis results for fiber-type distributions.
- https://cdn.elifesciences.org/articles/82016/elife-82016-fig5-figsupp1-data1-v2.xlsx
Figure 6
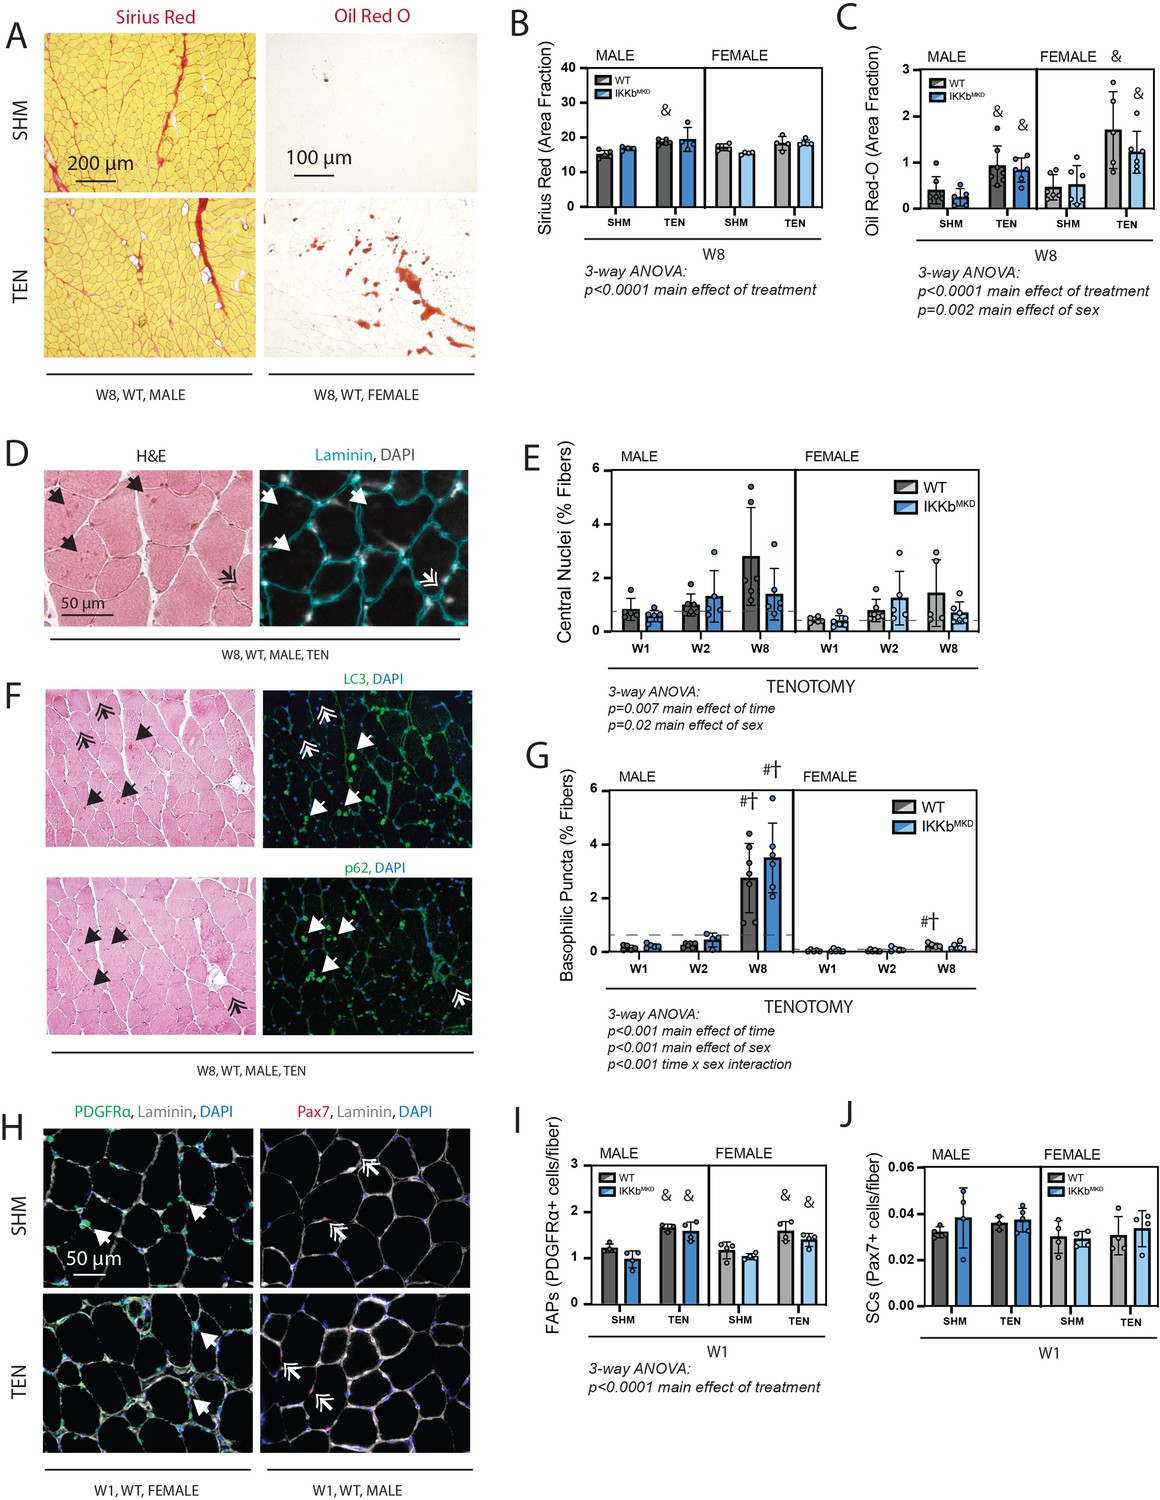
Cellular pathology following tenotomy (TEN) was not affected by IKKβ knockdown and suggests sex specificity in autophagic flux.
(A) Representative Sirius Red and Oil Red-O staining of histological sections from sham (SHM) and TEN WT supraspinatus (SS) muscles at week 8 (W8). The red fraction in Sirius Red indicates concentrations of collagen, while the red fraction in Oil indicates intramuscular adipocytes. (B) Quantification of the fraction of the section area occupied by Sirius Red as a marker of fibrosis for male and female mice at W8 shows moderate increases with TEN in both genotypes. (C) Quantification of the fraction of section area occupied by Oil Red O as a marker of fatty infiltration for male and female mice at W8 shows significant increases with TEN in both genotypes. (D) Representative sections stained with H&E and laminin with DAPI used to identify centralized nuclei (double arrows) as hematoxylin and DAPI-positive structures central within the laminin boundary and other basophilic puncta (arrows) as hematoxylin-positive central structures negative for DAPI. (E) Quantification of fibers with centralized nuclei as a percentage of all fibers as a marker of regeneration across genotypes and timepoints within the TEN group. (F) Representative sections sequentially stained with LC3 or p62 followed by H&E to identify LC3/p62 and hematoxylin positivity in the same section. (G) Quantification of fibers with basophilic puncta as a percentage of all fibers across genotypes and timepoints within the TEN group. Basophilic puncta were more abundant in male SS sections at W8. (D, F) Dotted lines are the average of all sham values included for reference for each sex. N = 5–7 per group. (H) Representative immunostaining for PDGFRα (green) and Pax7 (red) identifying fibro-/adipogenic progenitors (FAPs) and satellite cells (SCs), respectively. (I) Quantification of FAPs shows an increase in tenotomized groups across genotypes and sexes. (J) Quantification of SCs shows no change with TEN. †p<0.05 compared with week (W1), #p<0.05 compared with W2, and &p<0.05 compared with sham values within the same sex and genotype.
-
Figure 6—source data 1
Raw data and statistical analysis results for Sirius Red (area fractions), Oil Red-O (area fractions), central nuclei (%fibers), basophilic puncta (% fibers), fibro-/adipogenic progenitors (FAPs) (PDGFRα + cells/fiber), and satellite cells (SCs) (α7 integrin + cells/fiber).
- https://cdn.elifesciences.org/articles/82016/elife-82016-fig6-data1-v2.xlsx
Figure 7 with 2 supplements
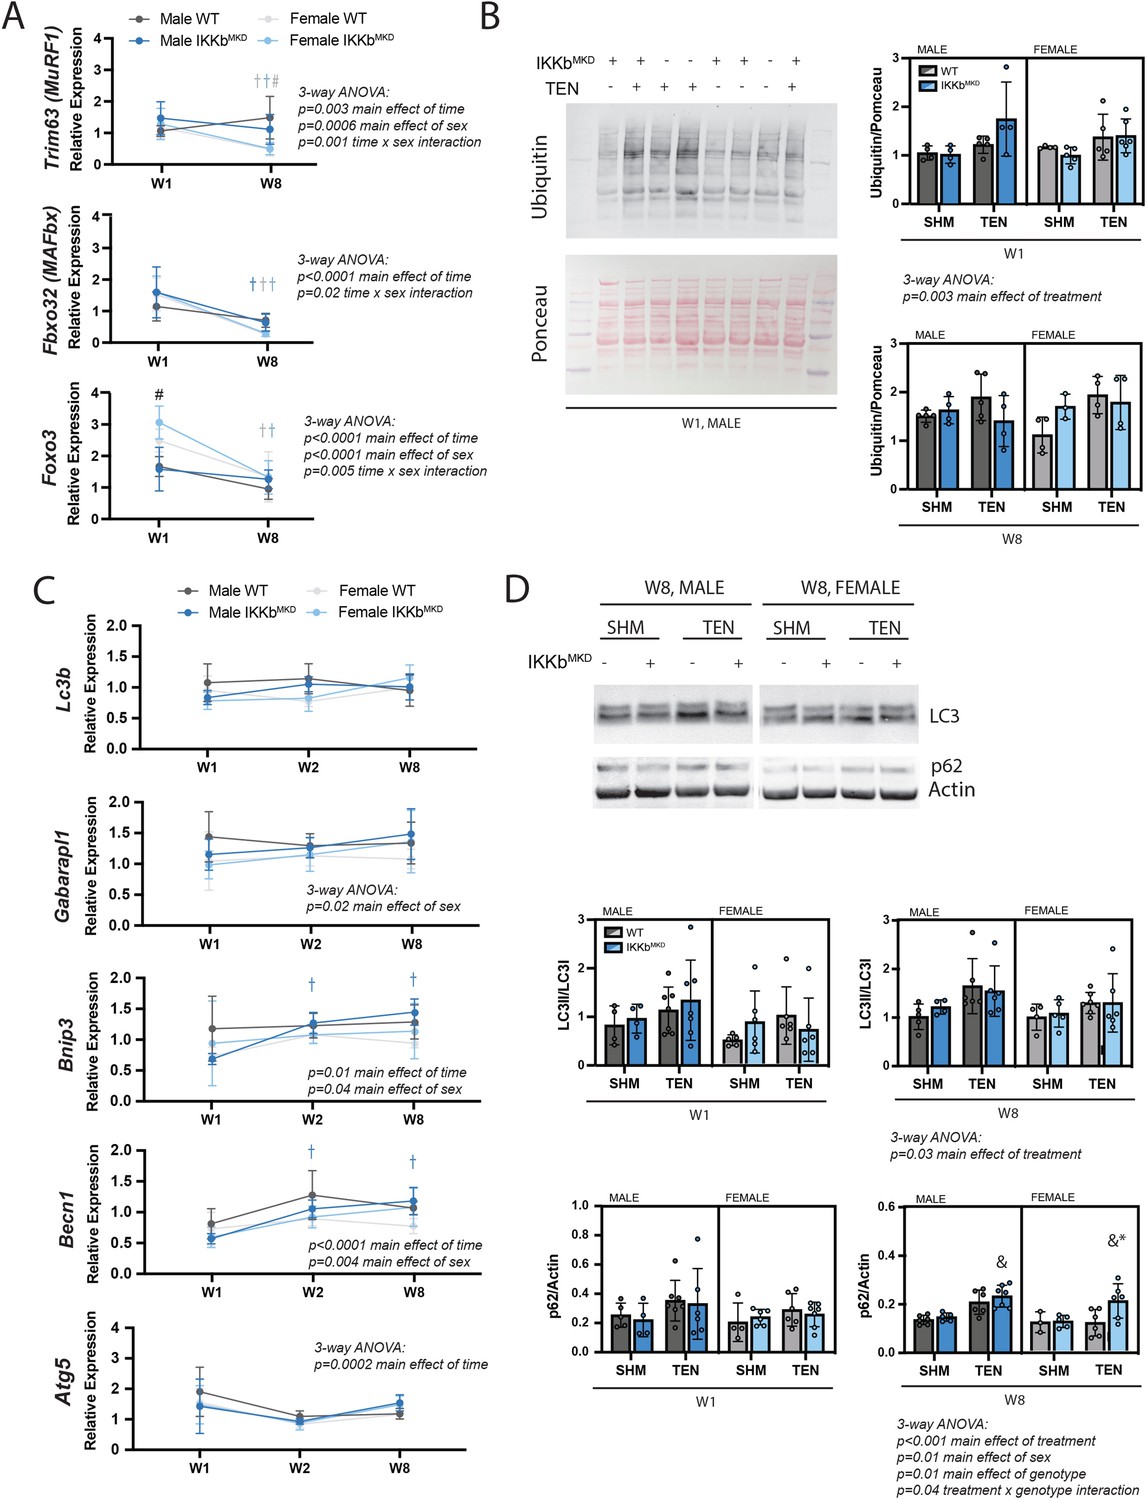
IKKβ knockdown did not impact the major signaling markers of the ubiquitin-proteasome or autophagy-lysosome pathways.
(A) Quantification of MuRF1, MAFbx, and Foxo3 gene expression normalized to GAPDH and week 1 (W1) WT male sham in male and female mice at W1 and week 8 (W8). (B) Quantification of the abundance of ubiquitin protein normalized to total protein stained with Ponceau at W1 and W8. (C) Quantification of Lc3b, Gabarapl1, Bnip3, Becn1, and Atg5 gene expression normalized to GAPDH and W1 WT male sham at W1 and W8. (D) Quantification of the ratio of LC3II to LC3I and p62 protein abundance at W1 and W8. N = 4–6 per group; #p<0.05 compared with male values within the same genotype. †p<0.05 compared with W1. &p<0.05 compared with sham values within the same sex and genotype, *p<0.05 compared with WT values within the same sex and treatment.
-
Figure 7—source data 1
Raw data and statistical analysis results for Trim63, Fbxo32, and Foxo3 gene expression, ubiquitin/Ponceau, Lc3b, Gabarapl1, Bnip3, Becn1, and Atg5 expression, LC3II/LC3I, and p62/actin.
- https://cdn.elifesciences.org/articles/82016/elife-82016-fig7-data1-v2.xlsx
-
Figure 7—source data 2
Western blot raw and uncropped images.
- https://cdn.elifesciences.org/articles/82016/elife-82016-fig7-data2-v2.zip
Figure 7—figure supplement 1
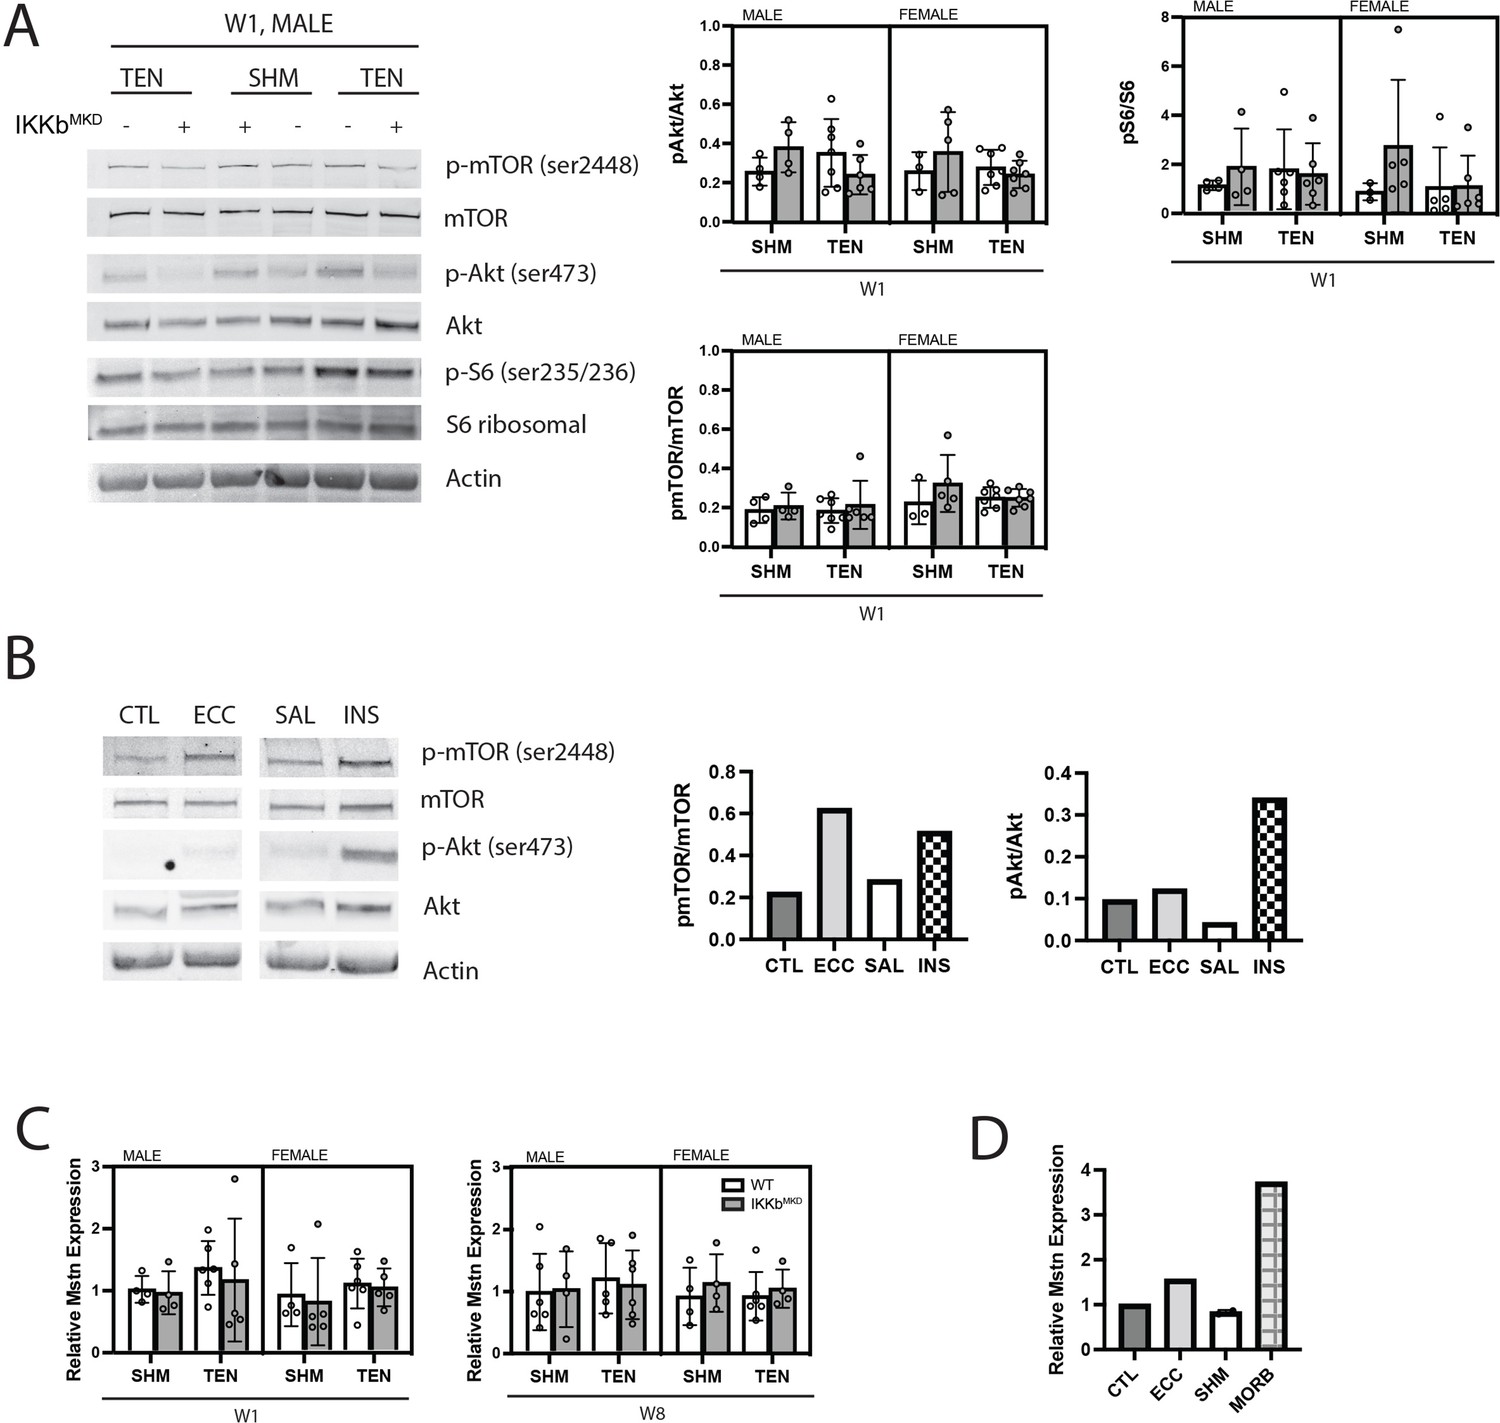
Akt/mTOR/S6 ribosomal phosphorylation is unchanged in response to tenotomy or IKKβ knockdown.
(A) Representative Western blot for signaling proteins p-mTOR (Ser2448), mTOR, p-Akt (Ser473), Akt, pS6 ribosomal (ser235/236), and S6 ribosomal for week 1 (W1) male samples. Quantification of phosphorylated protein abundance relative to total respective protein abundance across treatment, genotype, and sex. (B) Western blot for signaling proteins p-mTOR (Ser2448), mTOR, p-Akt (Ser473), and Akt in muscle extracts from a tibialis anterior (TA) muscle subjected to 50 eccentric contractions (ECC) 1 hr prior to harvest, the contralateral control TA (CTL), a mouse treated with insulin (INS) 1 hr prior to harvest, and a saline (SAL)-treated control. p-mTOR and p-Akt are expected to be elevated relative to total mTOR and Akt with insulin treatment, but only p-mTOR is expected to elevated following eccentric contractions (Parkington et al., 2003). (C) Gene expression of myostatin (Mstn) at W1 and week 8 (W8). (D) Gene expression of Mstn in CTL, ECC, sham (SHM), and a 24-month-old moribund mouse (MORB).
-
Figure 7—figure supplement 1—source data 1
Raw data and statistical analysis results for pAkt/Akt, pmTOR/mTOR, pS6/S6, and relative Mstn gene expression.
- https://cdn.elifesciences.org/articles/82016/elife-82016-fig7-figsupp1-data1-v2.xlsx
-
Figure 7—figure supplement 1—source data 2
Western blot raw and uncropped images.
- https://cdn.elifesciences.org/articles/82016/elife-82016-fig7-figsupp1-data2-v2.zip
Figure 7—figure supplement 2
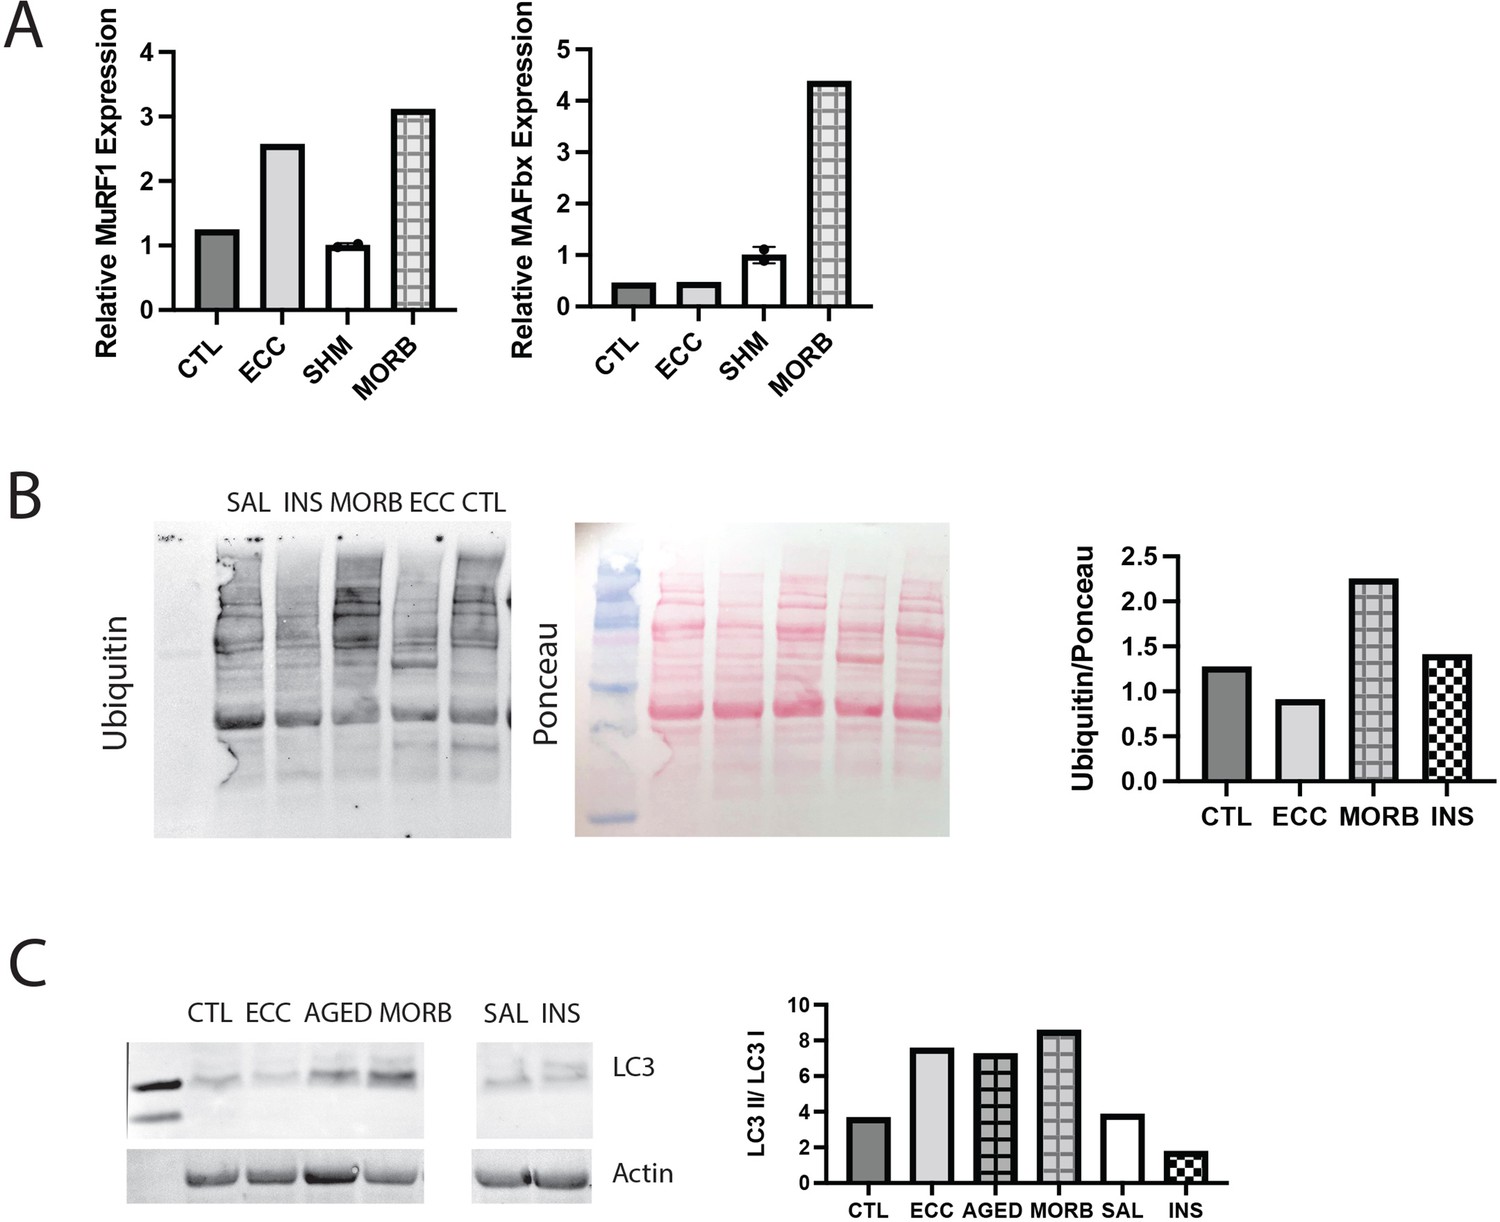
Validation of assays with positive controls.
(A) Expression of MuRF1, MAFbx, and myostatin (Mstn) genes in a tibialis anterior (TA) muscle subjected to 50 eccentric contractions (ECC) 1 hr prior to harvest, the contralateral control TA (CTL), sham (SHM), and the infraspinatus from a 24-month-old moribund mouse (MORB). MuRF1 expression is expected to be elevated following eccentric exercise, while MAFbx remains unchanged and myostatin is decreased (Louis et al., 2007). Both MuRF1 and MAFbx are expected to be elevated in critical illness (Wollersheim et al., 2014). (B) Western blot of ubiquitin in muscle extracts from CTL, ECC, MORB, a mouse treated with insulin (INS) 1 hr prior to harvest, and a saline (SAL)-treated control. Ubiquitin is expected to be elevated with eccentric exercise and critical illness (Murton et al., 2008). (C) Western blot of LC3A/B in muscle extracts from CTL, ECC, MORB (and an age-matched control AGED), SAL, and INS. The ratio of LC3II/LC3I is elevated under increased autophagic flux, which is expected with eccentric exercise and critical illness, but not with insulin treatment (Banduseela et al., 2013; Langer et al., 2021).
-
Figure 7—figure supplement 2—source data 1
Raw data and statistical analysis results for relative MuRF1 and MAFbx gene expression, ubiquitin/Ponceau, and LC3II/LC3I.
- https://cdn.elifesciences.org/articles/82016/elife-82016-fig7-figsupp2-data1-v2.xlsx
-
Figure 7—figure supplement 2—source data 2
Western blot raw and uncropped images.
- https://cdn.elifesciences.org/articles/82016/elife-82016-fig7-figsupp2-data2-v2.zip
Tables
Key resources table
| Reagent type (species) or resource | Designation | Source or reference | Identifiers | Additional information |
|---|---|---|---|---|
| Strain, strain background | C57BL/6J: Ikbkbtm2Cgn (mouse) | This paper | Ikbkbtm2Cgn | Originally generated by Manolis Pasparakis (Pasparakis et al., 2002) |
| Strain, strain background | C57BL/6J: Ikbkbtm2Cgn (mouse) | Jackson Laboratories | RRID:IMSR_JAX:008242 | |
| Strain, strain background | C57BL/6J: Tg(ACTA1-cre/Esr1*)2Kesr/J (mouse) | Jackson Laboratories | RRID:IMSR_JAX:025750 | |
| Antibody | Anti-myosin heavy chain (slow, alpha-, and beta-) (mouse monoclonal) | Developmental Studies Hybridoma Bank | BA-F8 | IF (1:30) |
| Antibody | Anti-myosin heavy chain type IIA (mouse monoclonal) | Developmental Studies Hybridoma Bank | SC-71 | IF (1:30) |
| Antibody | Anti-myosin heavy chain type IIB (mouse monoclonal) | Developmental Studies Hybridoma Bank | BF-F3 | IF (1:30) |
| Antibody | anti-laminin (rabbit polyclonal) | Abcam | 11575 | IF (1:400) |
| Antibody | Anti- SQSTM1/p62 (rabbit polyclonal) | Cell Signaling Technology | 5114 | IF (1:100), WB (1:1000) |
| Antibody | Anti-LC3A/B (rabbit monoclonal) | Cell Signaling Technology | 12741 | IF (1:100), WB (1:1000) |
| Antibody | Anti-PDGFRα (goat polyclonal) | R&D Systems | AF1062 | IF (1:400) |
| Antibody | Anti-Pax7 (mouse monoclonal) | Developmental Studies Hybridoma Bank | Pax7 | IF (1:100) |
| Antibody | Anti-IKKβ (rabbit monoclonal) | Cell Signaling Technology | 8943 | WB (1:1000) |
| Antibody | Anti-mTOR (rabbit monoclonal) | Cell Signaling Technology | 2983 | WB (1:1000) |
| Antibody | Anti-phospho-mTOR (Ser2448) (rabbit monoclonal) | Cell Signaling Technology | 5536 | WB (1:1000) |
| Antibody | Anti-Akt (rabbit polyclonal) | Cell Signaling Technology | 9272 | WB (1:1000) |
| Antibody | Anti-phospho-Akt (Ser473) (rabbit monoclonal) | Cell Signaling Technology | 4060 | WB (1:1000) |
| Antibody | Anti-ubiquitin (rabbit polyclonal) | Dako | Z0458 | WB (1:1000) |
| Antibody | Anti-actin (rabbit polyclonal) | Sigma-Aldrich | A2066 | WB (1:10,000) |
| Antibody | Anti-NF-κB p65 (rabbit monoclonal) | Cell Signaling Technology | 8242 | WB (1:1000) |
| Antibody | Anti-NF-κB1 p105/p50 (rabbit monoclonal) | Cell Signaling Technology | 13586 | WB (1:1000) |
| Antibody | Anti-histone H3 (rabbit monoclonal) | Cell Signaling Technology | 4499 | WB (1:1000) |
| Antibody | Anti-GAPDH (rabbit polyclonal) | Abcam | 9485 | WB (1:10,000) |
| Commercial assay or kit | Nuclear Extract Kit | Active Motif | 40010 | |
| Commercial assay or kit | M.O.M. Mouse-on-moue Kit | Vector Laboratories | BMK-2202 | |
| Commercial assay or kit | MultiScribe reverse transcription kit | Applied Biosystems | 4368814 | |
| Chemical compound, drug | Antigen Retrieval Citra (pH-6.0) | Biogenex | HK086-5K | |
| Software, algorithm | ImageJ | ImageJ | ||
| Software, algorithm | GraphPad Prism | GraphPad Prism | ||
| Software, algorithm | Matlab | MathWorks | ||
| Software, algorithm | Image Studio | LI-COR | ||
| Sequence-based reagent | Fbxo32_F | IDT | qPCR primers | AACCGGGAGGCCAGCTAAAGAACA |
| Sequence-based reagent | Fbxo32_R | IDT | qPCR primers | TGGGCCTACAGAACAGACAGTGC |
| Sequence-based reagent | Trim63_F | IDT | qPCR primers | GAGAACCTGGAGAAGCAGCT |
| Sequence-based reagent | Trim63_R | IDT | qPCR primers | CCGCGGTTGGTCCAGTAG |
| Sequence-based reagent | Mstn_F | IDT | qPCR primers | CAGACCCGTCAAGACTCCTACA |
| Sequence-based reagent | Mstn_R | IDT | qPCR primers | CAGTGCCTGGGCTCATGTCAAG |
| Sequence-based reagent | Foxo3_F | IDT | qPCR primers | ATCGCCTCCTGGCGGGCTTA |
| Sequence-based reagent | Foxo3_R | IDT | qPCR primers | ACGGCGGTGCTAGCCTGAGA |
| Sequence-based reagent | Lc3b_F | IDT | qPCR primers | cactgctctgtcttgtgtaggttg |
| Sequence-based reagent | Lc3b_R | IDT | qPCR primers | tcgttgtgcctttattagtgcatc |
| Sequence-based reagent | Gabarapl1_F | IDT | qPCR primers | catcgtggagaaggctccta |
| Sequence-based reagent | Gabarapl1_R | IDT | qPCR primers | atacagctggcccatggtag |
| Sequence-based reagent | Bnip3_F | IDT | qPCR primers | AGGGCTCCTGGGTAGAACTG |
| Sequence-based reagent | Bnip3_R | IDT | qPCR primers | GCTGGGCATCCAACAGTATT |
| Sequence-based reagent | Becn1_F | IDT | qPCR primers | AGCCTCTGAAACTGGACACG |
| Sequence-based reagent | Becn1_R | IDT | qPCR primers | CCTCTTCCTCCTGGGTCTCT |
| Sequence-based reagent | Atg5_F | IDT | qPCR primers | ggagagaagaggagccaggt |
| Sequence-based reagent | Atg5_R | IDT | qPCR primers | gctgggggacaatgctaata |
| Sequence-based reagent | Gapdh_F | IDT | qPCR primers | TGTGATGGGTGTGAACCACGAGAA |
| Sequence-based reagent | Gapdh_R | IDT | qPCR primers | GAGCCCTTCCACAATGCCAAAGT |
Additional files
Download links
A two-part list of links to download the article, or parts of the article, in various formats.
Downloads (link to download the article as PDF)
Open citations (links to open the citations from this article in various online reference manager services)
Cite this article (links to download the citations from this article in formats compatible with various reference manager tools)
Tenotomy-induced muscle atrophy is sex-specific and independent of NFκB
eLife 11:e82016.
https://doi.org/10.7554/eLife.82016


