Specific targeting of inflammatory osteoclastogenesis by the probiotic yeast S. boulardii CNCM I-745 reduces bone loss in osteoporosis
- Université Côte d’Azur, CNRS, LP2M, France
- LIA ROPSE, Laboratoire International Associé Université Côte d’Azur - Centre Scientifique de Monaco, France
- Department of Pharmacy, Cardenal Herrera-CEU University, Spain
- IRMB, Université Montpellier, France
- Centre Scientifique, Monaco
- Laboratory of Immune Cell Biology, Center for Cancer Research, National Cancer Institute, National Institutes of Health, United States
- Université Paris-Saclay, UVSQ, INSERM, Infection et inflammation, France
- Inserm, Universite de Nantes, France
- Department of Immunology, Ophthalmology and ENT. School of Medicine, Universidad Complutense de Madrid, Spain
- Immunobiology Laboratory, Centro Nacional de Investigaciones Cardiovasculares (CNIC), Spain
- Université de Nantes, Institut de Cancérologie de l’Ouest, France
- Genetics Division, Ambroise Paré Hospital, AP-HP, France
Figures
Figure 1 with 1 supplement
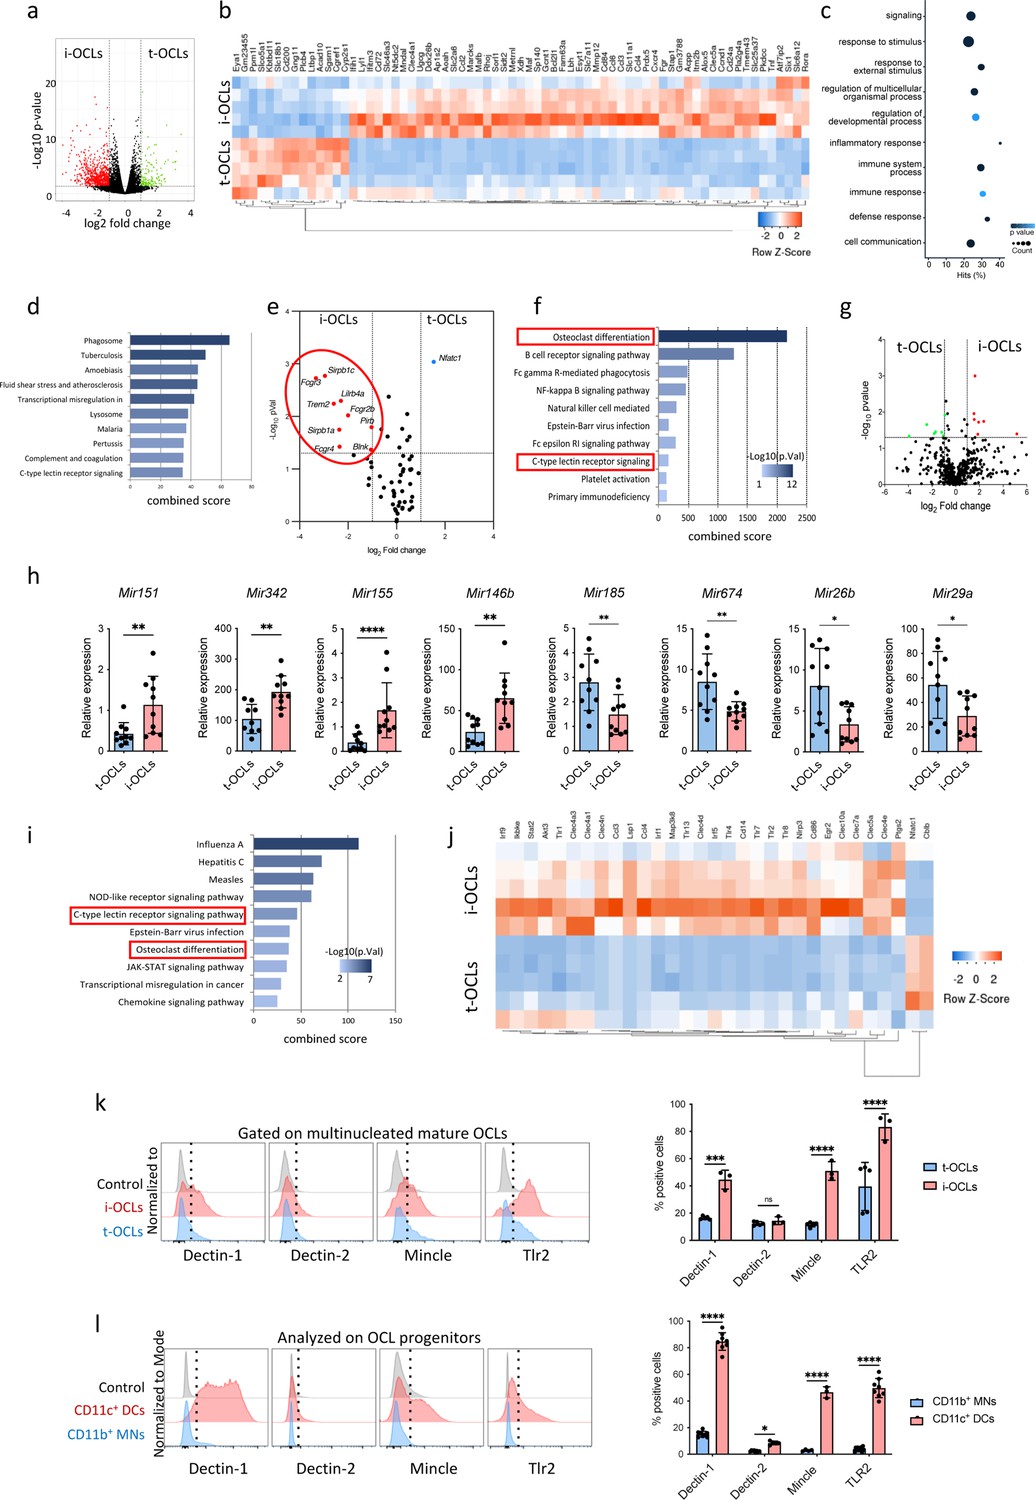
Comparative transcriptomic analysis of inflammatory osteoclasts (i-OCLs) versus tolerogenic OCLs (t-OCLs) reveals two distinct populations of OCLs and differences in their differentiation pathway.
(a) Volcano plot analysis of differentially expressed (DE) genes (p<0.05; FC ≥2) between sorted mature i-OCLs (dendritic cells [DC]-derived OCLs) and t-OCLs (monocytic cells [MN]-derived OCLs) differentiated and sorted (≥ three nuclei) as presented in Figure 1—figure supplement 1. Analysis was performed on n=5 biological replicates for each group. (b) Heatmap visualization of the z-scored expression of the top 70 genes (p<0.05; FC ≥2) that are significantly DE between the two OCL subsets. (c) Gene ontology analysis of biological processes associated with DE genes. (d) EnrichR annotation (Kegg) for the 906 DE genes between MN-OCLs and DC-OCLs. (e) Transcriptomic analysis of selected genes (from Kegg mmu04380, osteoclast differentiation) involved in bone resorption (Acp5, Car2, Clcn7, Ctsk, Mmp9, Ostm1, Tcirg1), the Rank differentiation pathway (Chuk, Ikbkb, Ikbkg, Map2k1, Map2k7, Map3k7, Mapk8, Mapk9, Nfatc1, Nfkb1, Nfkb2, Tab1, Tab2, Tnfrsf11a, Traf2, Traf6), and the co-stimulatory differentiation pathway (Blnk, Fcgr1, Fcgr2b, Fcgr3, Fcgr4, Lilrb4a, Oscar, Plcg2, Sirpb1b, Sirpb1c, Syk, Trem2, Tyrobp) in i-OCLs and t-OCLs on n=5 biological replicates per group. (f) EnrichR annotation (Kegg) for the genes involved in the OCL co-stimulatory differentiation pathway (from d). (g) Volcano plot visualization of the comparative miRNome analysis of i-OCLs and t-OCLs performed on n=5 biological replicates for each group. (h) Quantitative real-time PCR analysis (mean ± standard deviation (SD)) on t-OCLs and i-OCLs (n=10 biological replicates per group). miRNA expression was normalized to the sno202 expression using the 2−(ΔCt) method. (i) EnrichR annotation (Kegg) for the target genes (from Table 2) of the DE miRNAs. (j) Heatmap visualization of the RNAseq data for selected genes involved in the C-type lectin receptor and TLR (Toll Like Receptor) signaling pathway (from Kegg) in i-OCLs and t-OCLs. (k) FACS (Flow Cytometry Cell Sorting) histograms and quantification (mean ± SD) of mature i-OCLs and t-OCLs for the expression of Dectin-1 and 2, Tlr2, and Mincle. Mature OCLs were gated as shown in Figure 1—figure supplement 1b. (l) FACS analysis on BM-derived CD11c+ DCs, and CD11b+ BM cells (used as OCL progenitors) and quantification (mean ± SD) of positive cells for the expression of Dectin-1 and 2, Tlr2, and Mincle each marker. *p<0.05; **p<0.01; ***p<0.001; ****p<0.0001.
Figure 1—figure supplement 1
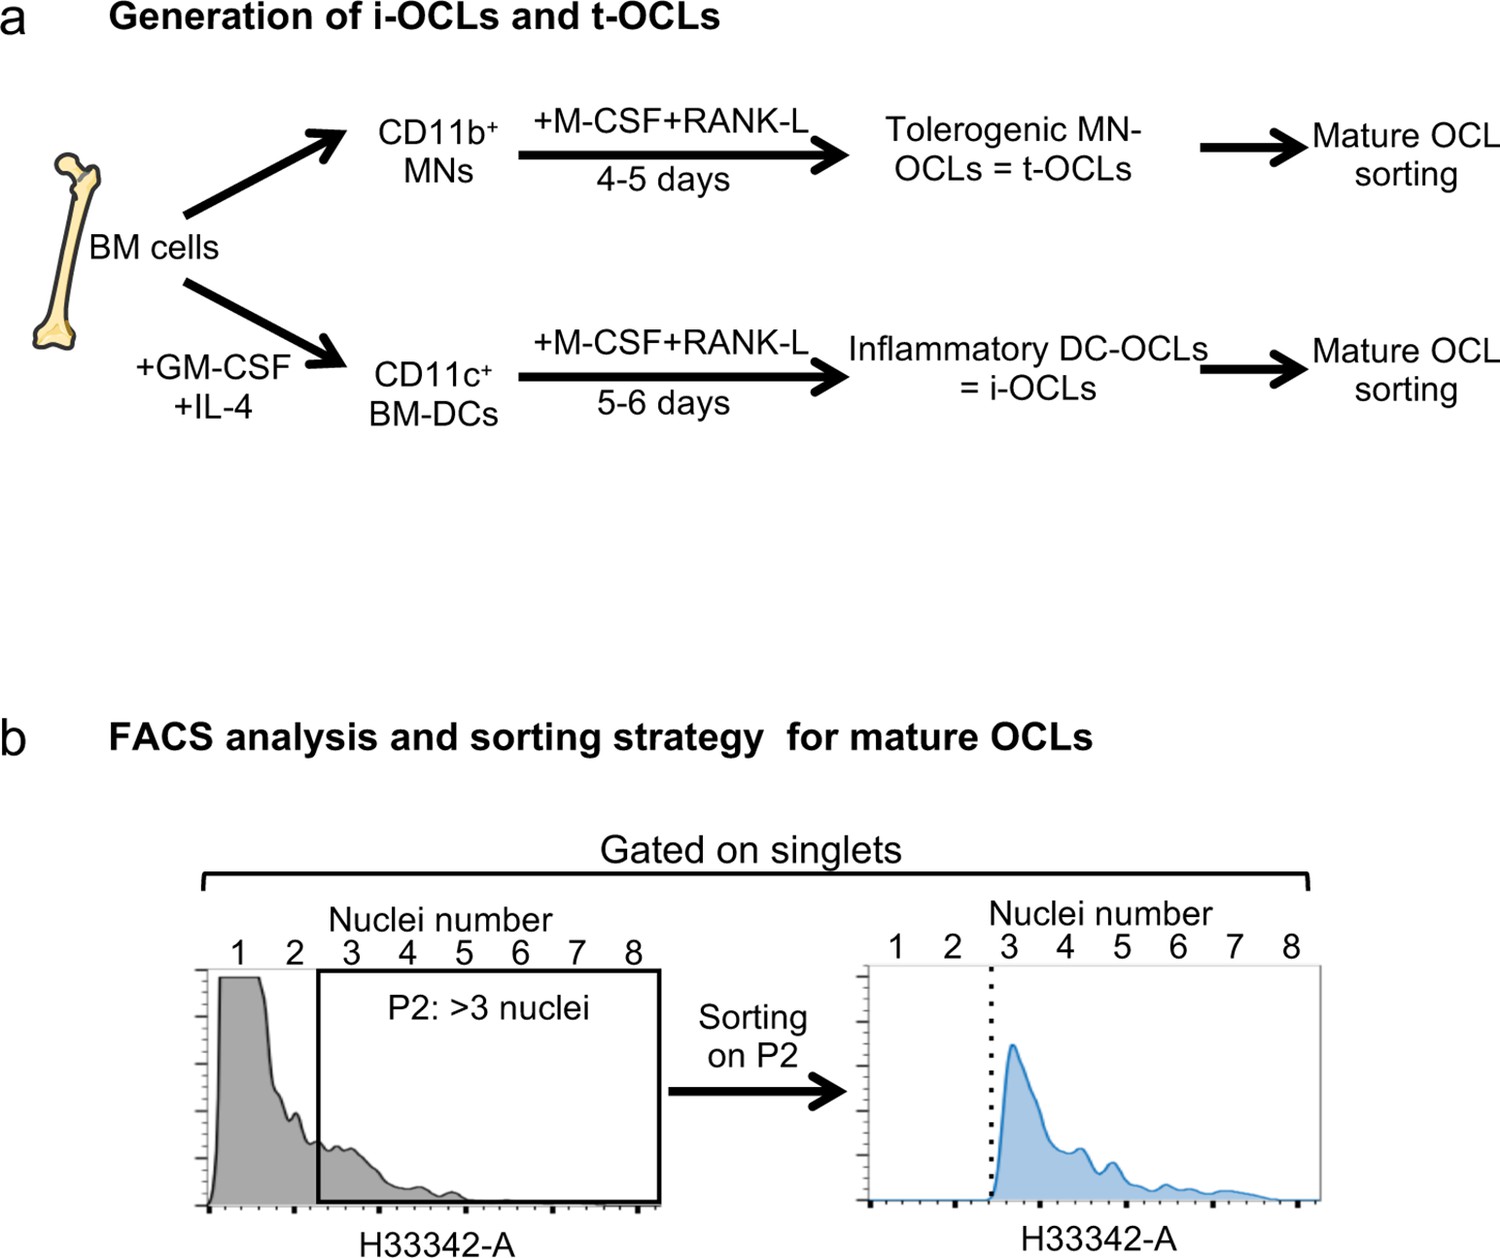
Cell preparation and gating strategies.
(a) Schematic representation of the experimental procedure for the generation of tolerogenic OCLs (t-OCLs) from bone marrow (BM) CD11b+ monocytic cells (MNs) and i-OCLs from BM-derived CD11c+ dendritic cells (BM-DCs), as previously described (Ibáñez et al., 2016; Madel et al., 2020; Madel et al., 2018). (b) Gating strategy for purification by cell sorting or for FACS analysis of mature osteoclasts (with three and more nuclei), after staining of DNA with H33342 and doublet exclusion according to the protocol we previously established (Madel et al., 2018). This strategy was used for gating on multinucleated mature osteoclasts throughout the different analyses.
Figure 2 with 2 supplements
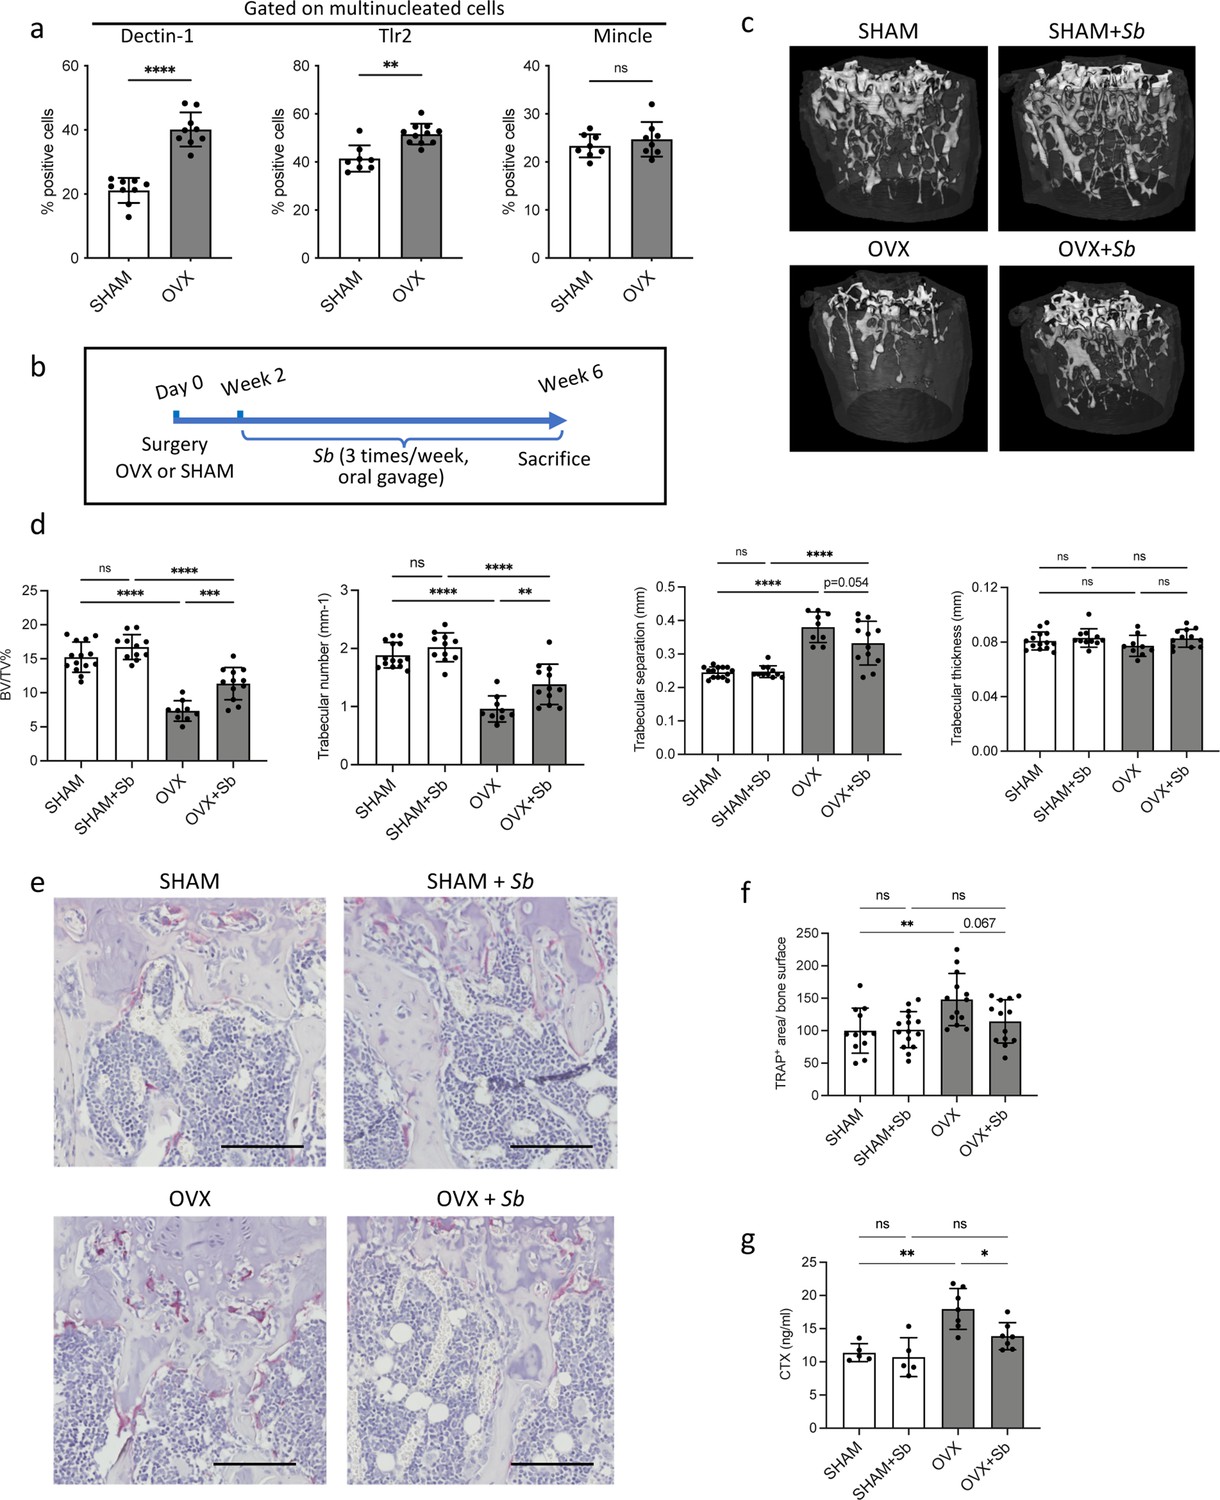
The probiotic yeast Saccharomyces boulardii (Sb) has beneficial effects on bone loss in osteoporosis.
(a) Quantification (mean ± SD) of FACS analysis of Dectin-1+, Tlr2+, and Mincle+ mature osteoclasts (OCLs; ≥three nuclei, gated as shown in Figure 1—figure supplement 1b, differentiated from the bone marrow of SHAM and ovariectomized (OVX)) mice, 6 weeks after surgery. (b) Schematic representation of the experimental procedure. Uterus and body weight were measured to control the quality of ovariectomy (Figure 2—figure supplement 1a–b). (c) Representative microcomputed tomography images of femurs from SHAM and OVX mice ± Sb administration. (d) Histograms indicate mean ± SD of trabecular bone volume fraction, trabecular number, separation, and thickness. Cortical parameters were also measured (Figure 2—figure supplement 1c). (e) Histological analysis of OCLs using TRAcP staining (in purple) on tibias from SHAM and OVX mice treated or not with Sb. Scale bars: 100 µm. (f) Histogram indicates the mean ± SD of TRAcP+ area per bone surface for each condition. Three images of four to five biological replicates were analyzed. Osterix+ and Sost+ cells were also analyzed (Figure 2—figure supplement 2a–d). The mineralization capacity of osteoblasts was also analyzed in vitro in the presence of Sb-conditioned medium (Figure 2—figure supplement 2e). (g) Serum cross-linked C-telopeptides of type I collagen (CTX) were measured by ELISA (n≥5 biological replicates per condition). *p<0.05; **p<0.01; ***p<0.001; ****p<0.0001; ns, non-significant differences.
Figure 2—figure supplement 1
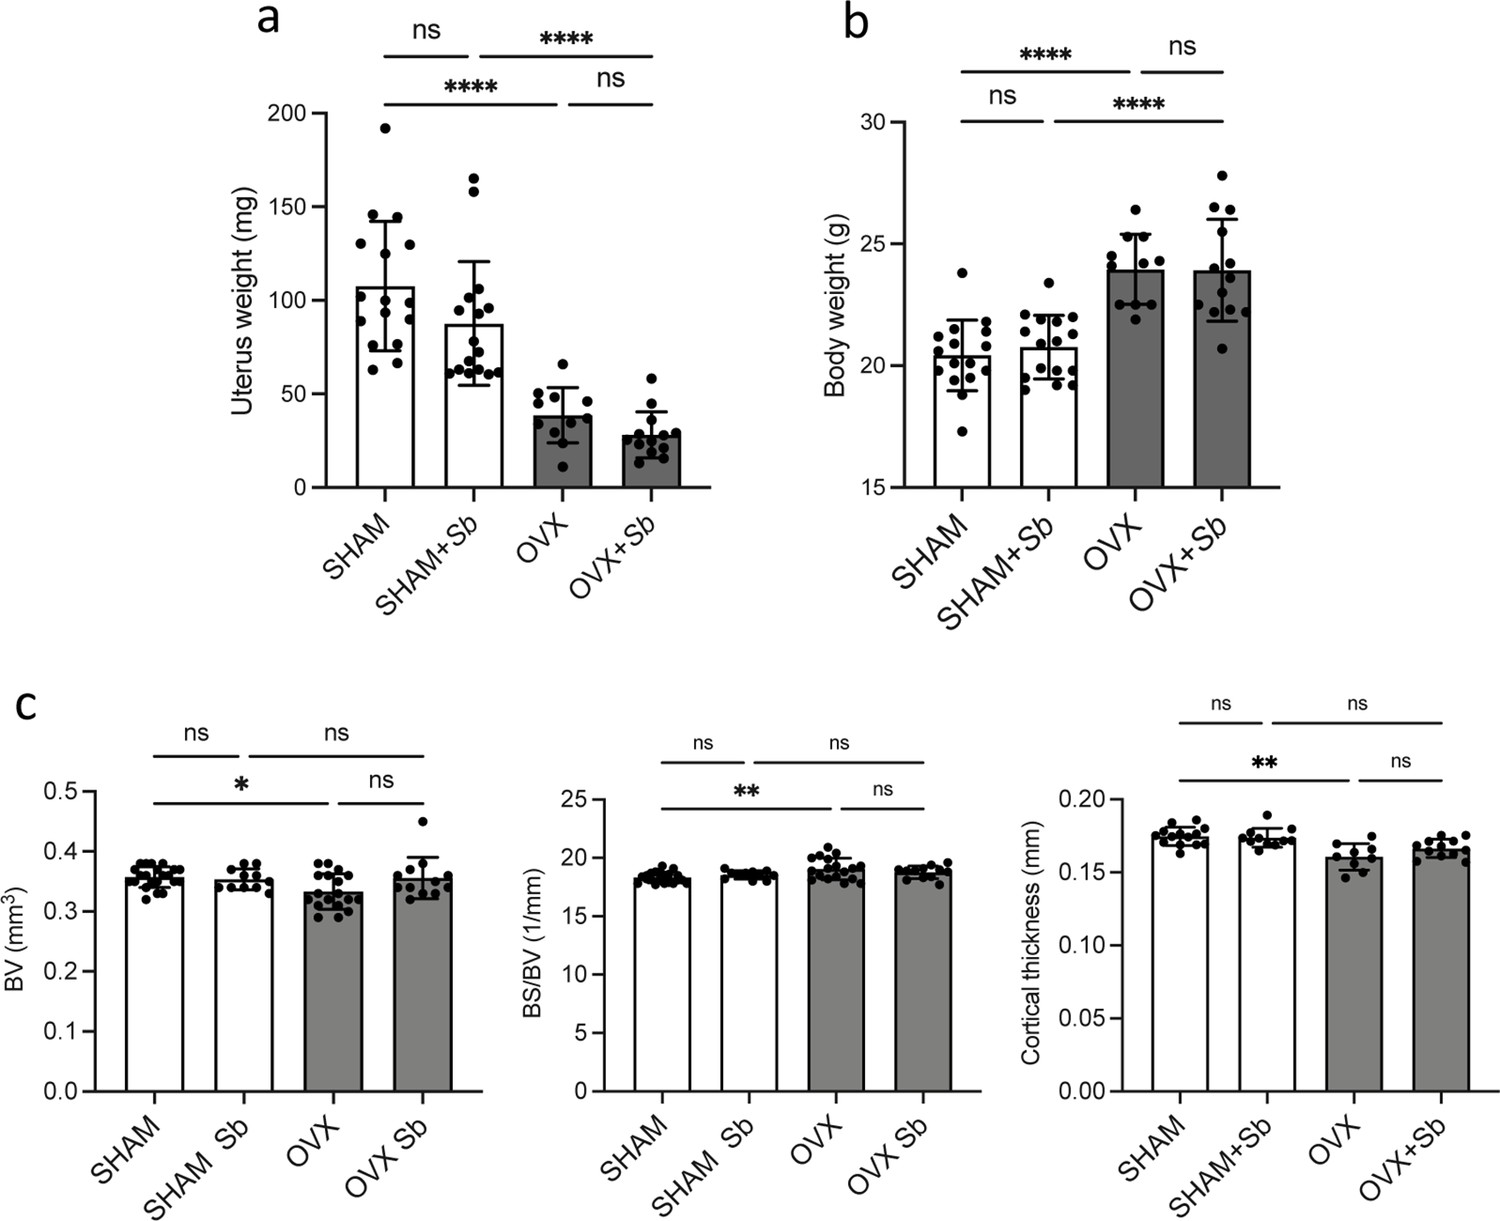
Cortical bone parameters of SHAM and OVX mice.
(a) Weight of the uteri of ovariectomized (OVX) and SHAM mice treated or not with Saccharomyces boulardii (Sb) (mean ± SD). (b) Body weight of the mice in the different groups, measured the day of sacrifice (mean ± SD). Data show no differences between yeast-treated mice and control mice in each group (SHAM and OVX). (c) Histograms indicate mean ± SD of cortical bone volume (BV), cortical bone surface/bone volume (BS/BV), and cortical thickness. **** p<0.0001; ns, non-significant differences.
Figure 2—figure supplement 2
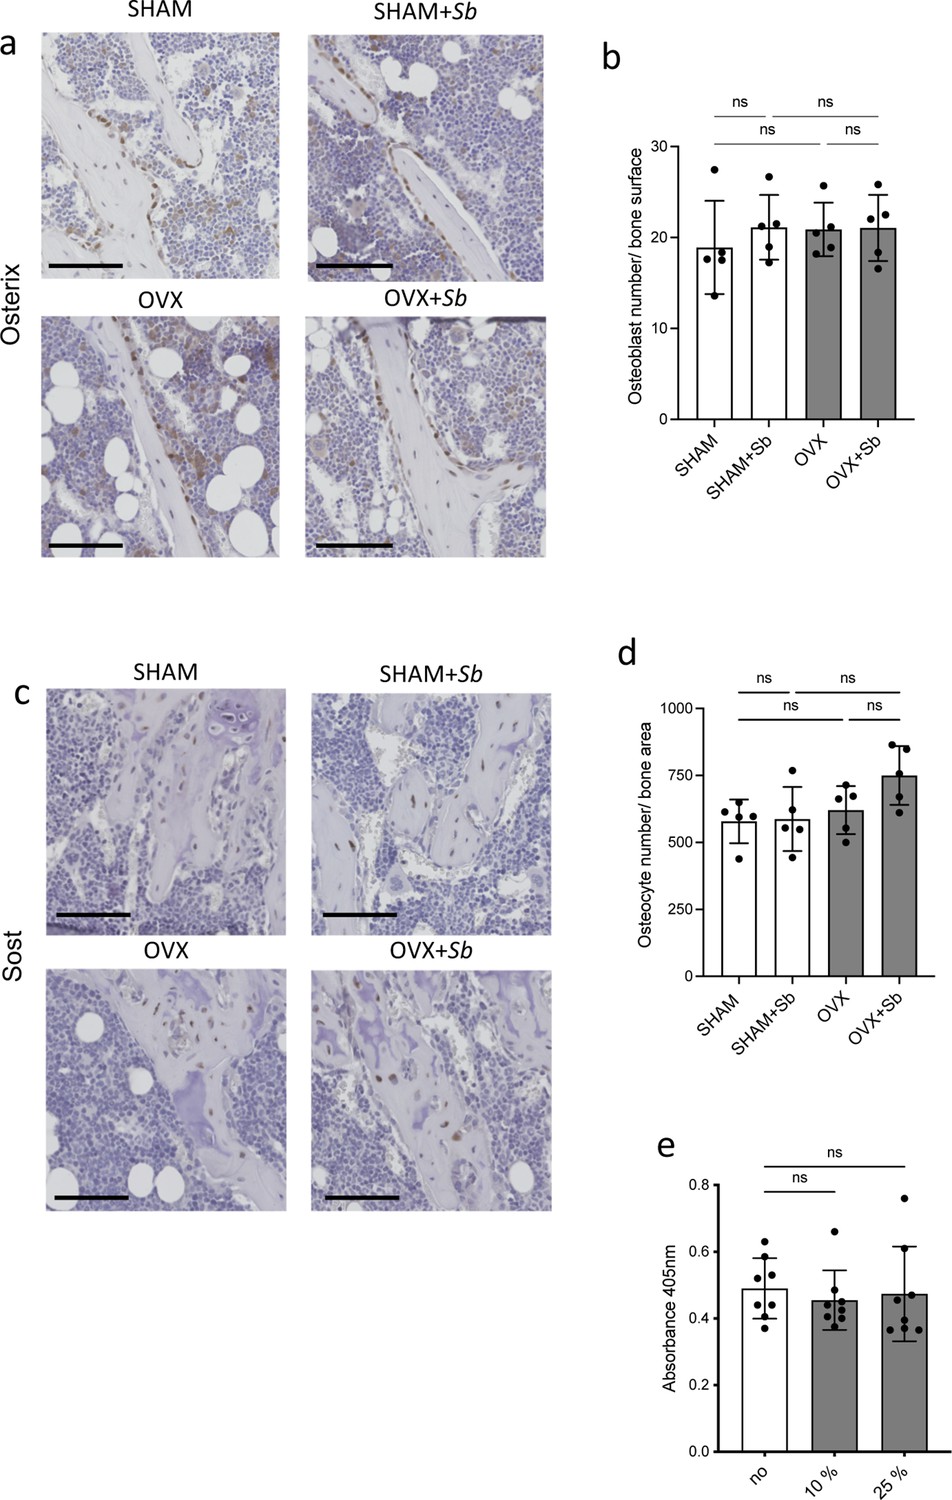
Effect of Sb treatment on osteoblasts and osteocytes.
(a–d) Histological analysis of the tibia of SHAM and ovariectomized (OVX) mice treated or not with Saccharomyces boulardii (Sb). (a–b) Osteoblasts were identified as Osterix-expressing cells attached to the bone surface, and (c–d) osteocytes were identified by their expression of Sost. (b, d) Histograms represent the enumeration (mean ± SD) of the cells for one image per replicate (n=5 mice per group). Scale bars: 100 µm. (e) In vitro mineralization capacity as measured by alizarin coloration of mineralized nodules deposited in vitro by osteoblasts treated or not with the indicated proportion of medium conditioned by Sb (mean ± SD). *p<0.05; **p<0.01; ns, non-significant differences.
Figure 3
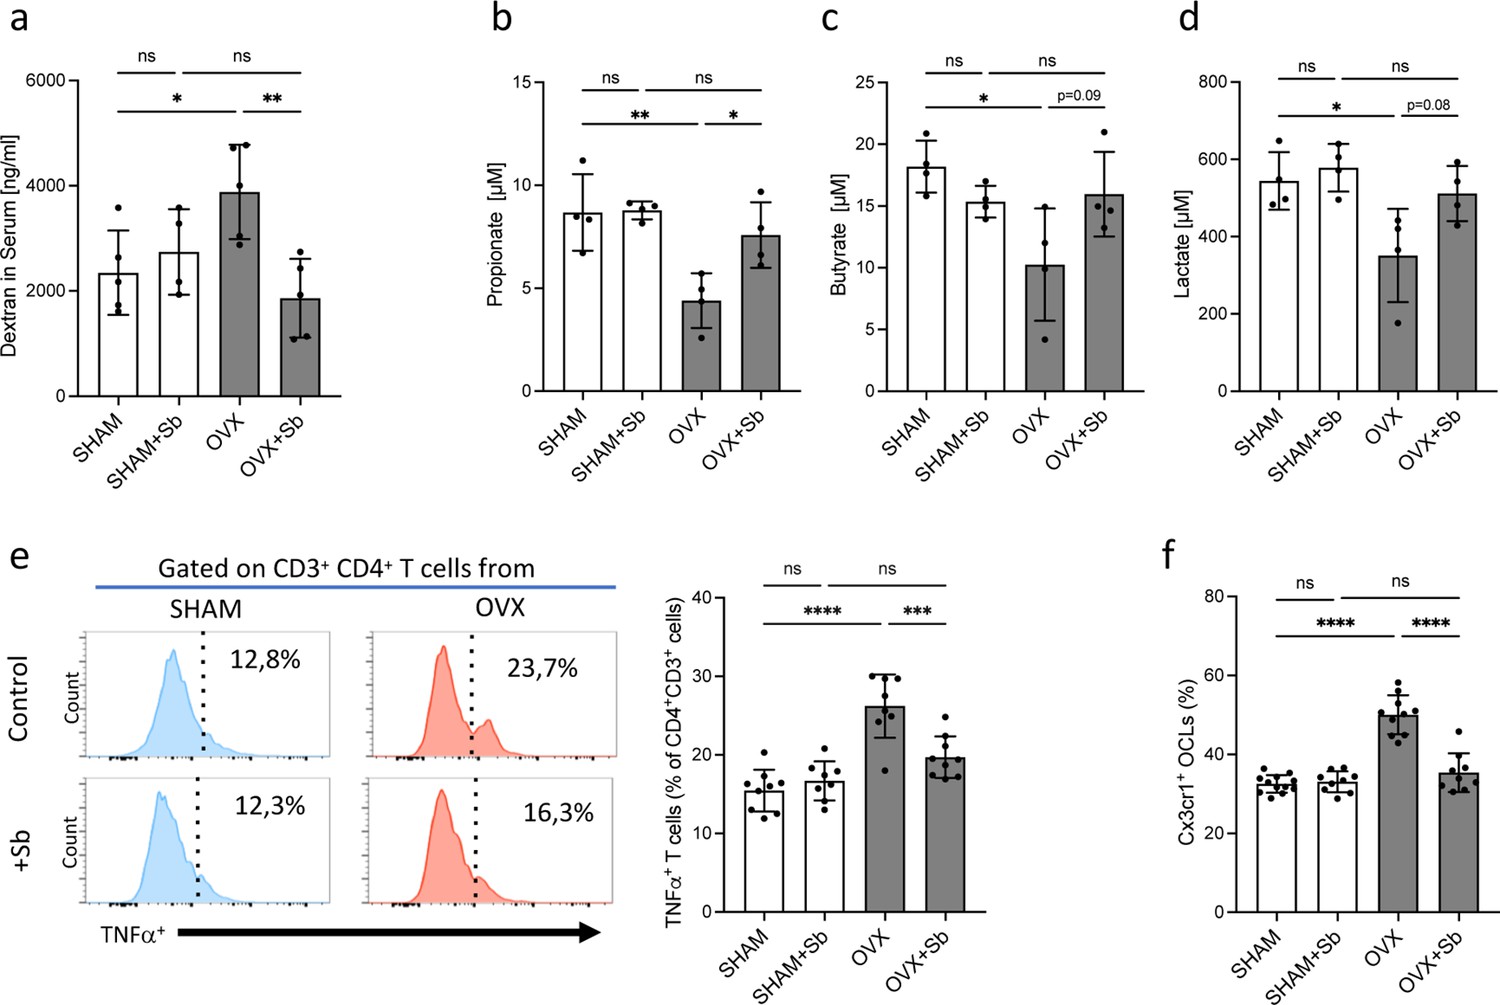
Saccharomyces boulardii (Sb) reduces inflammatory parameters in osteoporosis.
(a) Integrity of the intestinal barrier permeability was analyzed by fluorometry on the serum of mice that received oral gavage of dextran-fluorescein isothiocyanate 1 hr before sacrifice (n=4–5 biological replicates) (mean ± SD). (b–d) Concentrations (mean ± SD) of (b) propionate, (c) butyrate, and (d) lactate were measured by chromatography in the serum of SHAM and ovariectomized (OVX) mice treated or not with Sb (n=4 biological replicate per group). *p<0.05; **p<0.01. (e) FACS analysis of Tnf-α-producing CD4+ T cells in the bone marrow (BM) of OVX and SHAM control mice with or without Sb treatment (n=8–10 biological replicate per group). (f) Proportion of mature Cx3cr1+ BM-derived OCLs (≥three nuclei, gated as shown in Figure 1—figure supplement 1b) from SHAM and OVX mice treated or not with Sb (n=10–14 biological replicate per group) was determined by FACS analysis. *p<0.05; **p<0.01; ***p<0.001; ****p<0.0001; ns, non-significant differences.
Figure 4 with 2 supplements
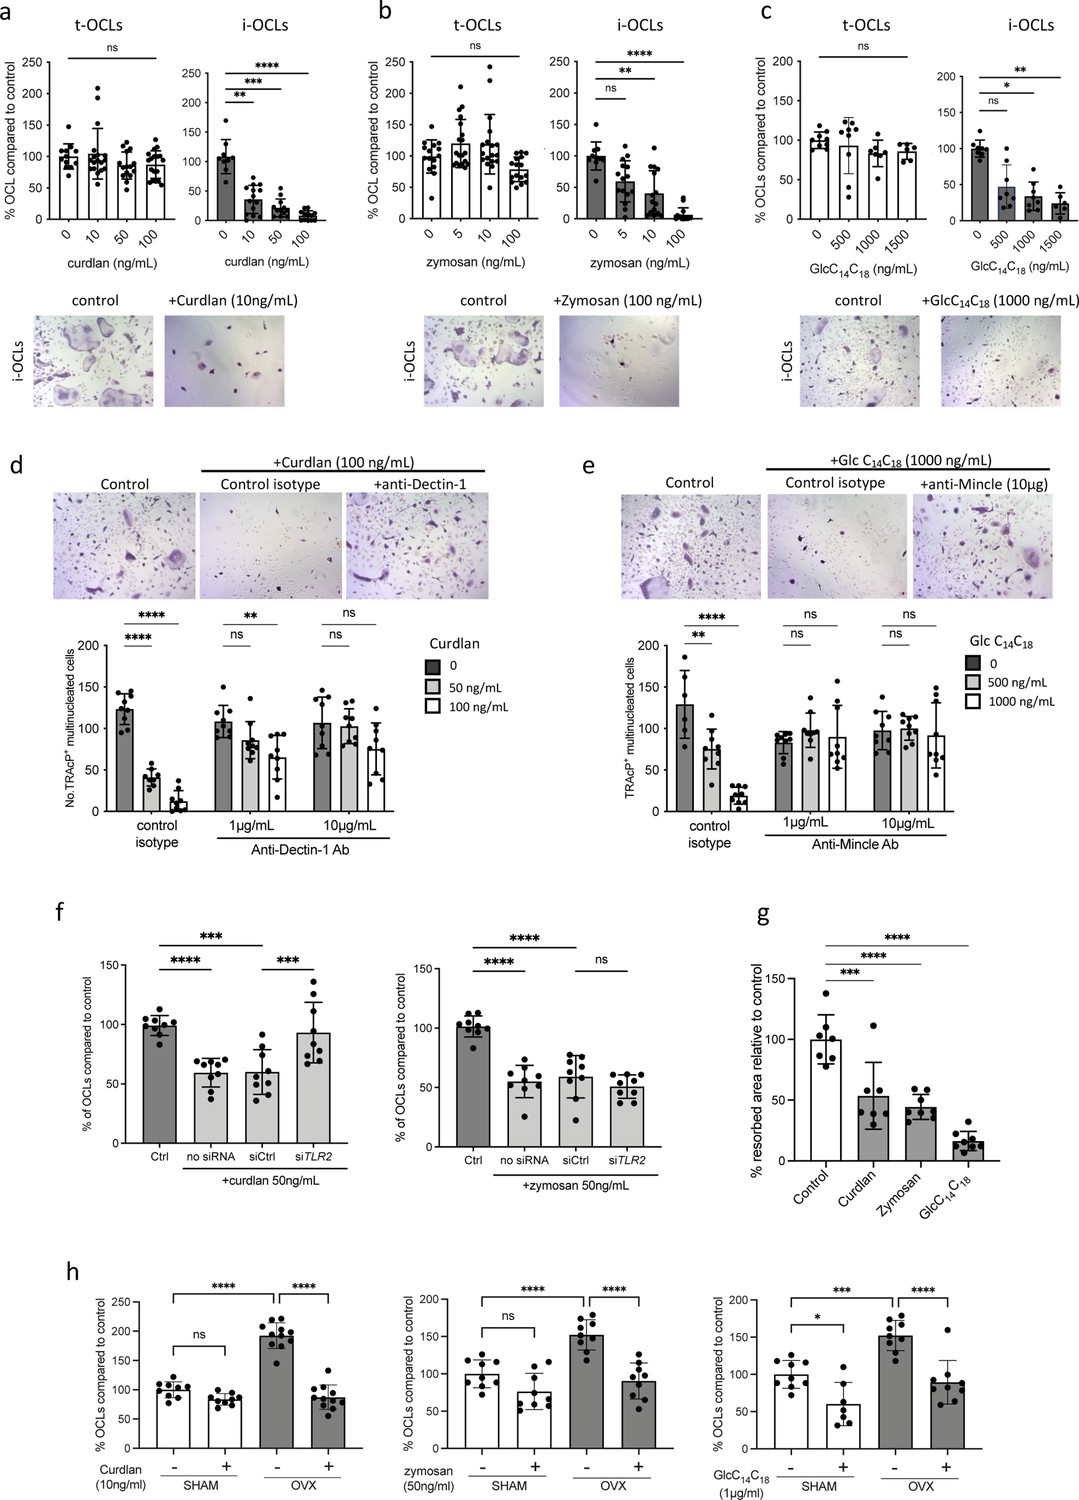
Implication of Tlr2, Dectin-1, and Mincle in the differentiation of inflammatory osteoclasts (i-OCLs).
(a–c) Quantification of the differentiation of tolerogenic OCLs (t-OCLs) and i-OCLs in the presence of indicated concentrations of curdlan, zymosan, and GlcC14C18. Upper panels: TRAcP+ cells with three or more nuclei were counted as OCLs. Histogram indicates the mean ± SD of the OCL normalized to the control condition (0 ng/mL agonist). Bottom panels: representative image of TRAcP staining for the control (without agonist) and agonist-treated i-OCLs at the indicated concentration. Quantification of cells viability in the presence of the agonists was also performed by FACS analysis (Figure 4—figure supplement 1a–d). (d-e) TRAcP staining and quantification of OCLs (TRAcP+ cells ≥three nuclei) differentiated in the presence of control isotypes or blocking antibodies against (d) Dectin-1 and (e) Mincle. (f) Quantification of i-OCLs differentiated in the presence of control siRNA or siRNA targeting Tlr2. Level of Tlr2 expression in the presence and absence of siRNAs was evaluated by FACS (Figure 4—figure supplement 1e). (g) OCL activity was evaluated by seeding bone marrow (BM)-derived dendritic cells on plates coated with resorbable matrix. After i-OCLs started to fuse (day 3 of differentiation), the different agonists were added at the following concentration: curdlan, 50 ng/mL; zymosan, 50 ng/mL, GlcC14C18, 1000 ng/mL. Resorbed area was quantified after 3 days. Evaluation of the effect of the agonists on t-OCL activity was also analyzed (Figure 4—figure supplement 1f). Specific analysis of the effect of Mincle stimulation on OCL formation was assessed using Clec4e-KO mice (Figure 4—figure supplement 2). (h) Enumeration of in vitro differentiated OCLs from BM cells of OVX and SHAM mice in the presence of indicated concentrations of curdlan, zymosan, and GlcC14C18 (Glc). TRAcP+ cells with three or more nuclei were counted as OCLs (n=8–11). *p<0.05; **p<0.01; ***p<0.001; ****p<0.0001; ns, non-significant differences.
Figure 4—figure supplement 1
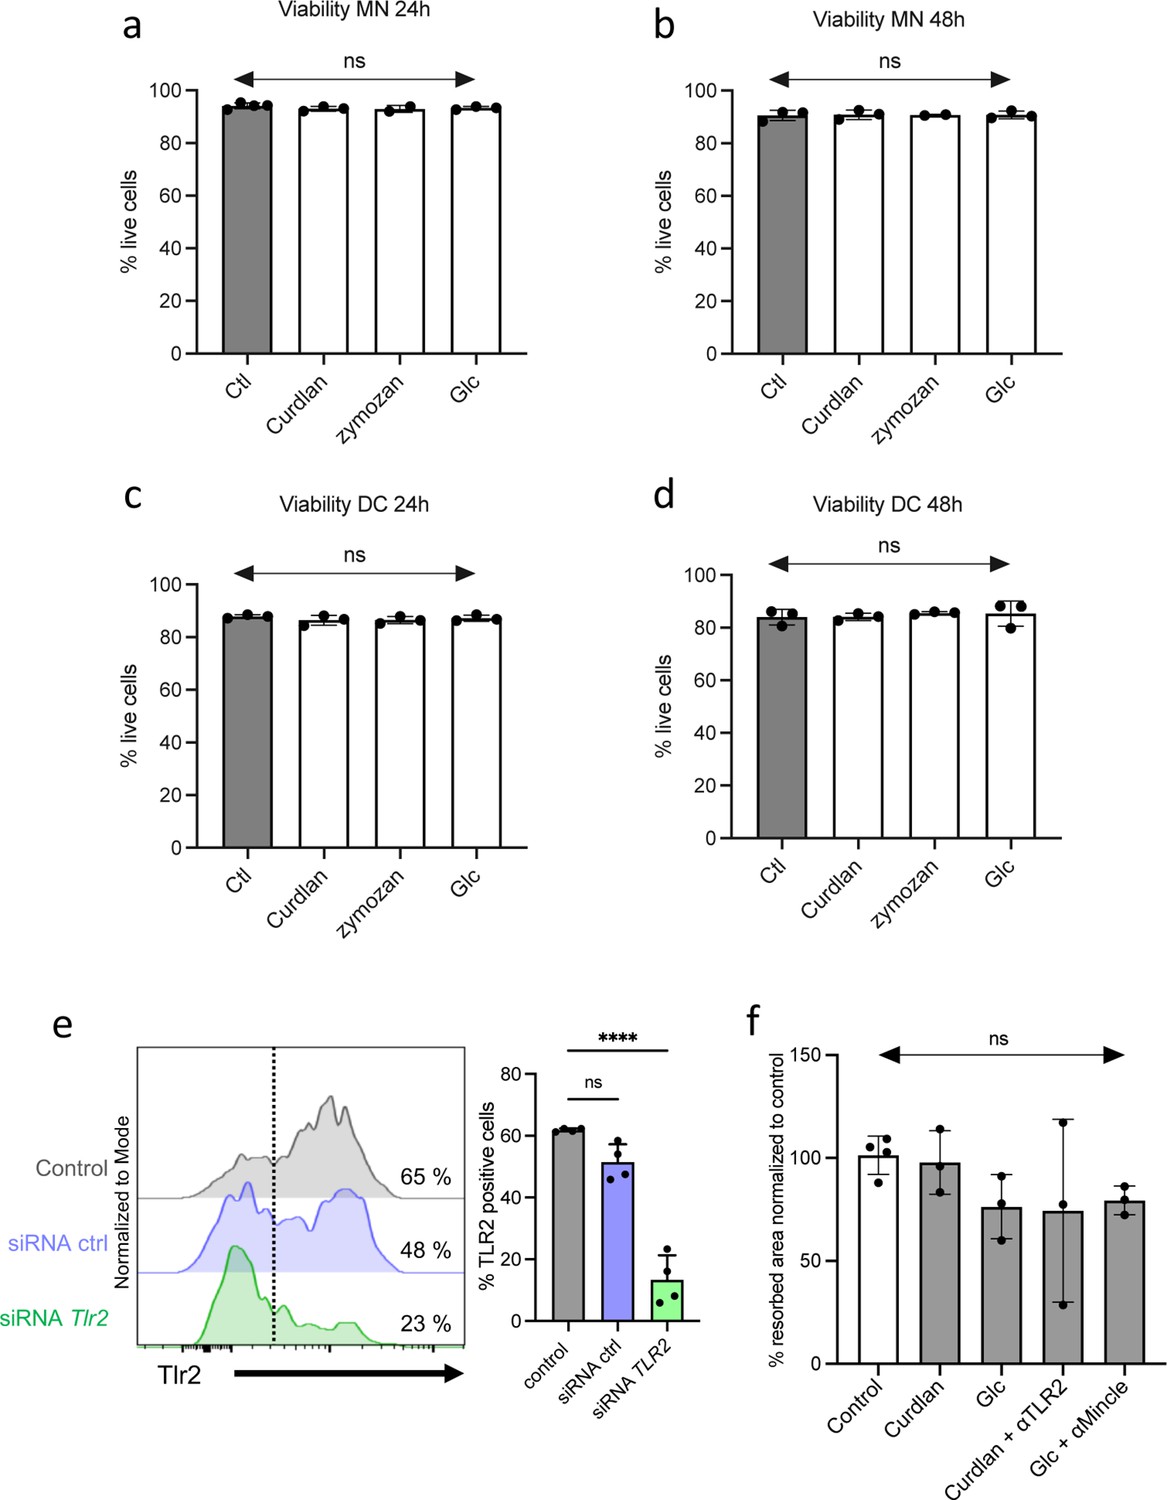
Effects of agonists on cell viability and t-OCL activity.
(a–d) Monocytes (MN) or dendritic cells (DC) were cultured in osteoclast differentiation medium in the absence (Ctl) or presence of curdlan (50 ng/mL), zymosan (50 ng/mL), GlcC14C18 (1000 ng/mL), or Saccharomyces boulardii (-conditioned medium 25%). Histograms indicate mean ± SD of live cells (annexin-Vneg propidium iodideneg) mesured by FACS in (a–b) MN and (c–d) DC after (a–c) 24 hr and (b–d) 48 hr of incubation with the agonists. (e) FACS analysis of the level of expression of Tlr2 in inflammatory osteoclast (OCL) progenitors in the presence of control siRNA or siRNA targeting Tlr2. (f) Activity of MN-OCL /tolerogenic OCLs was evaluated on plates coated with resorbable matrix. After OCLs started to fuse (day 3 of differentiation), the different agonists were added at the following concentration: curdlan, 50 ng/mL; GlcC14C18, 1000 ng/mL. When indicated, anti-TLR2 (aTLR2) or anti-Mincle (aMincle) antibodies (10 µg/mL) were also added. Resorbed area was quantified after 3 days. ns, non-significant differences.
Figure 4—figure supplement 2
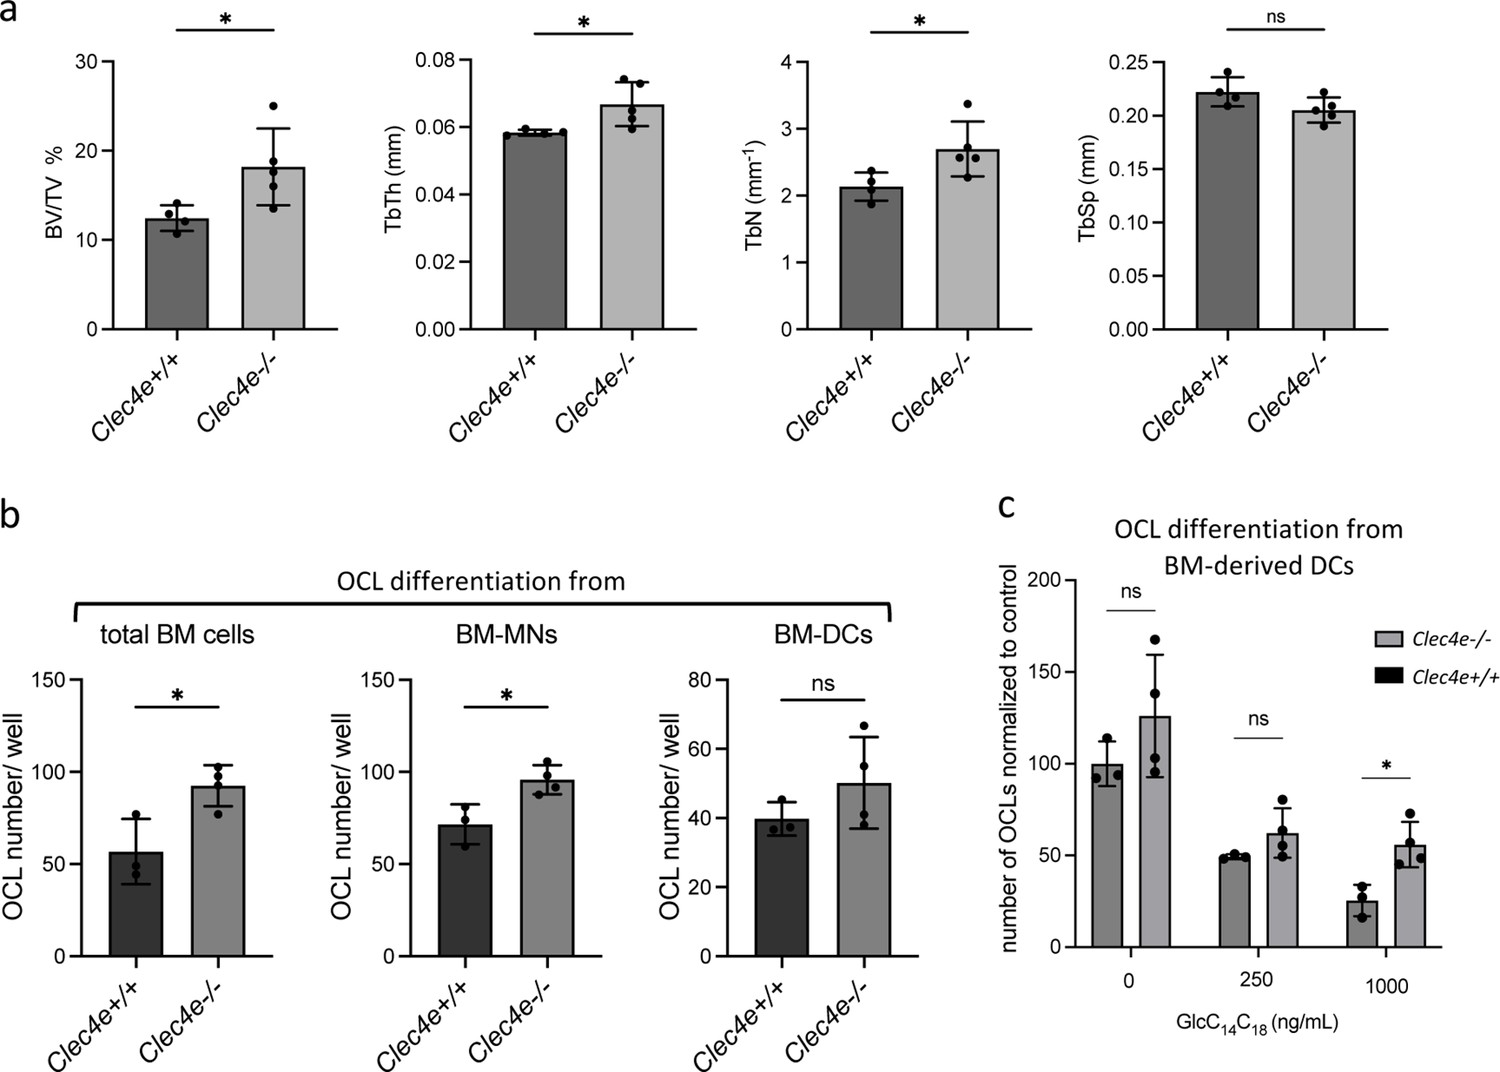
Bone phenotype and OCL differentiation in Clec4e deficient mice.
(a) Microcomputed tomography analysis on distal femurs Clec4e−/− and Clec4e +/+ mice. Histograms indicate mean ± SD of bone volume fraction (BV/TV), trabecular thickness (TbTh), trabecular number (TbN), and trabecular separation (TbSp). (b) Quantification of the differentiation of osteoclasts (OCLs) from total bone marrow (BM) cells, BM-monocyte cells (MNs) and BM-derived dendritic cells (DCs) from Clec4e−/− and Clec4e+/+ mice. TRAcP+ cells with three or more nuclei were counted as OCLs. (c) Quantification of the differentiation of inflammatory OCLs (DC-derived OCLs) from Clec4e−/− and Clec4e +/+ mice in the presence of the indicated concentration of GlcC14C18. TRAcP+ cells with three or more nuclei were counted as OCLs. *p<0.05; ns, non-significant differences.
Figure 5

Curdlan alters the capacity of dendritic cells (DCs) to differentiate into inflammatory osteoclasts (OCLs).
(a) Quantification of differentiation of inflammatory OCLs from CD11cΔSyk and control mice (n=9 and 6 biological replicates, respectively). (b) Flow cytometry analysis of spleen tyrosine kinase (Syk) phosphorylation after 15 min of stimulation with 100 ng/mL of curdlan on bone marrow (BM)-derived DCs cultured. The right panel shows the increase in the mean fluorescence intensity revealing increased Syk phophorylation (n=4 biological replicates). (c–d) FACS plots and quantification (mean ± SD) of the expression of (c) MHC-II, CD80, and CD86; and (d) CD115 (Csfr1), Rank, and CD16/32 (FcgrII/III) on BM-DCs (n=4 biological replicates per group) cultured in osteoclast differentiation medium and stimulated or not for 24 hr with the indicated curdlan concentrations (e) Quantitative real-time PCR analysis of the expression of Syk, Nfatc1, and Ctsk on BM-DCs cultured in osteoclast differentiation medium and stimulated or not for 72 hr with the indicated curdlan concentrations. *p<0.05; **p<0.01; ***p<0.001; ****p<0.0001; ns, non-significant differences.
Figure 6

The probiotic yeast Saccharomyces boulardii (Sb) modulates the differentiation of inflammatory osteoclasts (i-OCLs).
(a) Quantification of differentiated tolerogenic OCLs (t-OCLs) and i-OCLs in the presence of indicated concentrations of Sb-conditioned medium (Sb-CM). (b) Apotosis of OCL progenitors (monocyte cells [MNs] and dendritic cells [DCs]) cultured in OCL differentiation medium in the absence (Control) or presence of Sb-CM (25%) was measured by FACS. Histograms indicate mean ± SD of live cells (annexin-Vneg propidium iodideneg) after 24 hr and 48 hr. (c) OCL activity was evaluated by on plates coated with resorbable matrix by adding Sb-CM (25%) when OCL fusion is starting (day 3 of differentiation). Resorbed area was quantified 3 days after addition of Sb-CM. Control panels are the same as in Figure 4g because the experiments were performed together. (d) Differentiation of i-OCLs was performed in the presence of control siRNA or siRNA, targeting Tlr2 in the absence or presence of Sb-CM. (e) Differentiation of i-OCLs was performed in the presence of blocking antibodies for Dectin-1 and Mincle in the absence or presence of Sb-CM. For all experiments, TRAcP+ multinucleated cells with ≥three nuclei were considered as OCLs and enumerated after 6 days of culture. (f–g) FACS plots and quantification (mean ± SD) of the expression of (f) MHC-II, CD80, and CD86; and (g) CD115 (Csfr1), Rank, and CD16/32 (FcgrII/III) on BM-DCs (n=4 biological replicates) cultured in osteoclast differentiation medium and stimulated or not for 24 hr with the indicated % of Sb-CM. The control panels (without Sb) are identical to those of Figure 5c–d as the experiments were performed together. *p<0.05; **p<0.01; ***p<0.001; ****p<0.0001; ns, non-significant differences.
Author response image 1
Tables
Table 1
List of the miRNAs differentially expressed between t-OCLs and i-OCLs.
| Official symbol | Official name | CT value | Log 2 (FC) | p-Value |
|---|---|---|---|---|
| Mir151 | mmu-miR-151–3 p | 28.3 | –5.06 | 0.04 |
| Mir342 | mmu-miR-342–3 p | 23.1 | –2.40 | 0.018 |
| Mir351 | rno-miR-351 | 29.1 | –1.94 | 0.019 |
| Mir125a | mmu-miR-125a-3p | 30.2 | –1.84 | 0.041 |
| Mir146b | mmu-miR-146b | 21.3 | –1.64 | 0.001 |
| Mir155 | mmu-miR-155 | 26.5 | –1.56 | 0.011 |
| Mir30e | mmu-miR-30e | 21.4 | 0.59 | 0.03 |
| Mir106a | mmu-miR-106a | 17.8 | 0.70 | 0.011 |
| Mir26b | mmu-miR-26b | 20.9 | 0.70 | 0.024 |
| Mir17 | mmu-miR-17 | 17.0 | 0.82 | 0.005 |
| Snord65 | snoRNA135 | 18.4 | 0.90 | 0.029 |
| Mir29a | mmu-miR-29a | 19.1 | 0.93 | 0.012 |
| Mir674 | mmu-miR-674 | 20.6 | 1.06 | 0.045 |
| Mir185 | mmu-miR-185 | 23.8 | 1.20 | 0.036 |
| Mir18a | mmu-miR-18a | 22.7 | 1.71 | 0.035 |
| Mir148a | mmu-miR-148a | 23.7 | 1.82 | 0.039 |
| Mir32 | mmu-miR-32 | 28.6 | 2.45 | 0.022 |
| Mir130a | mmu-miR-130a | 25.2 | 3.94 | 0.046 |
Table 2
Putative targeting of the differentially expressed genes by the eight validated miRNAs (in Figure 1h).
This table lists the 174 differentially expressed genes putatively targeted by one or more discriminant miRNAs according to the in silico prediction analysis using four algorithms (TargetScan, Miranda, RNA22, and miRWalk). Crosses indicate a putative target predicted by three or four algorithms (score 3–4). i-OCLs: inflammatory osteoclasts; t-OCLs: tolerogenic osteoclasts.
| Gene symbol | -log(p-value) | Fold change (log2) | i-OCLs miRNAs (score 3–4) | t-OCLs miRNAs (score 3–4) | ||||||
|---|---|---|---|---|---|---|---|---|---|---|
| Mir155 | Mir146b | Mir342 | Mir151 | Mir185 | Mir674 | Mir26b | Mir29a | |||
| 1810011H11Rik | 2,78 | –3,4 | X | X | X | |||||
| 5430427O19Rik | 2,56 | –4,0 | X | X | ||||||
| 9930111J21Rik1 | 3,31 | –3,5 | X | |||||||
| A530064D06Rik | 3,67 | –4,2 | X | |||||||
| Abcc3 | 2,41 | –3,0 | X | |||||||
| Acpp | 2,81 | –2,4 | X | X | X | |||||
| Acvrl1 | 2,48 | –2,8 | X | X | X | |||||
| Adap2 | 3,93 | –3,2 | X | |||||||
| Ahrr | 2,37 | –2,7 | X | X | X | |||||
| Akt3 | 3,24 | –2,5 | X | X | X | X | X | X | ||
| Alox5 | 2,86 | –2,5 | X | |||||||
| Als2cl | 3,45 | –4,5 | X | X | X | X | X | |||
| Aoah | 4,41 | –4,6 | X | |||||||
| Apobec1 | 3,21 | –2,9 | X | X | ||||||
| Arhgap15 | 3,01 | –3,7 | X | X | X | |||||
| Arhgap19 | 2,35 | –2,6 | X | X | ||||||
| Arhgef10l | 2,80 | –2,8 | X | |||||||
| Arl4c | 3,00 | –2,6 | X | X | ||||||
| Atf3 | 2,61 | –3,6 | X | |||||||
| Atp1a3 | 3,36 | –2,6 | X | X | ||||||
| B430306N03Rik | 3,14 | –3,4 | X | X | X | X | X | |||
| B4galt6 | 2,90 | –3,4 | X | X | X | X | X | X | ||
| Bhlhe41 | 3,45 | –3,8 | X | X | X | X | X | X | ||
| Bst1 | 2,49 | –3,5 | X | |||||||
| Btg2 | 2,67 | –3,5 | X | X | X | X | ||||
| C3ar1 | 2,90 | –3,0 | X | X | X | |||||
| C5ar1 | 3,30 | –3,9 | X | X | ||||||
| Camk1d | 2,47 | –3,1 | X | X | X | X | X | X | X | |
| Ccl6 | 5,25 | –5,6 | X | |||||||
| Cd28 | 2,56 | –1,9 | X | X | X | |||||
| Cd300lb | 3,16 | –3,6 | X | X | ||||||
| Cd300ld | 4,11 | –4,8 | X | X | ||||||
| Cd36 | 4,26 | –4,0 | X | X | ||||||
| Cd5l | 3,43 | 3,4 | X | |||||||
| Cd93 | 3,69 | –4,0 | X | X | X | X | X | X | X | |
| Cdc42ep3 | 3,01 | –3,1 | X | |||||||
| Cebpa | 2,99 | –2,7 | X | |||||||
| Chst12 | 2,72 | –2,6 | X | |||||||
| Clec4a1 | 3,89 | –2,7 | X | |||||||
| Clec4n | 3,02 | –3,8 | X | |||||||
| Cmpk2 | 3,05 | –2,8 | X | |||||||
| Cnr2 | 2,91 | –3,9 | X | X | ||||||
| Cybb | 4,24 | –4,0 | X | |||||||
| Dab2 | 3,30 | –4,0 | X | X | X | X | ||||
| Dapk1 | 2,44 | –1,8 | X | X | ||||||
| Ddx58 | 3,39 | –3,1 | X | |||||||
| Dhrs3 | 3,35 | –3,2 | X | |||||||
| Dock1 | 2,35 | –1,8 | X | X | ||||||
| Dock2 | 2,65 | –2,7 | X | |||||||
| Dram1 | 2,98 | –2,6 | X | X | X | X | X | X | ||
| Dtx3l | 3,00 | –2,4 | X | X | ||||||
| Ednrb | 3,79 | –3,7 | X | X | X | |||||
| Elmsan1 | 2,86 | –2,4 | X | X | X | |||||
| Entpd1 | 2,84 | –2,5 | X | X | ||||||
| Eps8 | 3,85 | –4,9 | X | |||||||
| Fabp5 | 3,23 | –2,3 | X | |||||||
| Fads1 | 4,20 | –3,3 | X | |||||||
| Fcgr4 | 3,58 | –3,2 | X | |||||||
| Frmd4b | 2,92 | –2,2 | X | |||||||
| Gas7 | 2,43 | –2,5 | X | X | X | X | ||||
| Gbp2 | 3,70 | –3,3 | X | |||||||
| Gcnt1 | 2,37 | –2,8 | X | |||||||
| Ggta1 | 3,34 | –3,1 | X | X | ||||||
| Gna15 | 2,86 | –3,1 | X | |||||||
| Gng2 | 2,98 | –3,4 | X | |||||||
| Gpr162 | 4,13 | –4,3 | X | |||||||
| H2-M3 | 2,70 | –3,2 | X | |||||||
| Hfe | 5,45 | –3,5 | X | |||||||
| Hip1 | 2,71 | –2,5 | X | X | X | |||||
| Hvcn1 | 3,48 | –3,4 | X | |||||||
| Id3 | 3,61 | –3,4 | X | |||||||
| Ifi203 | 2,64 | –3,0 | X | X | X | X | ||||
| Ifi204 | 3,08 | –2,3 | ||||||||
| Ifih1 | 4,04 | –2,6 | X | |||||||
| Ifit3 | 2,82 | –2,9 | X | X | ||||||
| Ifngr1 | 2,38 | –2,1 | X | |||||||
| Igf1 | 3,78 | –4,5 | X | X | X | X | X | X | X | |
| Igfbp4 | 3,21 | –4,8 | X | X | ||||||
| Ikbke | 3,62 | –3,9 | X | X | X | |||||
| Ikzf1 | 3,18 | –3,0 | X | X | X | |||||
| Il7r | 3,05 | –3,8 | X | |||||||
| Irf9 | 2,46 | –2,4 | X | |||||||
| Itgal | 2,94 | –3,9 | X | X | ||||||
| Kctd12 | 2,63 | –2,3 | X | X | ||||||
| Kif3a | 2,71 | –1,9 | X | X | X | |||||
| Klf2 | 2,62 | –2,7 | X | |||||||
| Lamp2 | 2,45 | –2,4 | X | |||||||
| Ldlrad3 | 2,71 | –3,8 | X | X | X | |||||
| Limd2 | 3,05 | –2,9 | X | X | ||||||
| Lipa | 2,53 | –2,4 | X | X | ||||||
| Lpar6 | 3,10 | –2,7 | X | |||||||
| Lpcat2 | 2,57 | –3,7 | X | |||||||
| Ltbp2 | 2,53 | –3,3 | X | X | ||||||
| Ly6e | 3,96 | –3,0 | X | |||||||
| Ly9 | 2,34 | –1,9 | X | |||||||
| Lyl1 | 3,48 | –3,9 | X | |||||||
| Lyz2 | 3,62 | –4,0 | X | X | ||||||
| Maf | 3,59 | –4,0 | X | |||||||
| Mafb | 2,41 | –3,4 | X | |||||||
| Man2a2 | 3,96 | –2,9 | X | |||||||
| Map3k1 | 2,42 | –2,0 | X | |||||||
| Marcks | 2,80 | –2,2 | X | X | X | |||||
| Mef2c | 2,75 | –2,5 | X | X | X | |||||
| Mertk | 2,70 | –2,7 | X | |||||||
| Mgll | 2,44 | –2,3 | X | |||||||
| Mmp12 | 4,16 | –4,8 | X | X | ||||||
| Mpeg1 | 3,07 | –3,4 | X | X | ||||||
| Ms4a6b | 7,62 | –4,1 | X | |||||||
| N4bp2l1 | 3,02 | –2,4 | X | X | ||||||
| Ncapg2 | 3,05 | –2,5 | X | X | X | X | X | |||
| Ncf1 | 4,43 | –4,6 | X | X | ||||||
| Nek6 | 2,46 | –4,3 | X | |||||||
| Neurl3 | 4,51 | –3,3 | X | |||||||
| Nlrp3 | 3,29 | –4,2 | X | |||||||
| Nrp1 | 2,36 | –2,5 | X | |||||||
| Oas1a | 2,52 | –2,3 | X | |||||||
| Osm | 3,07 | –3,2 | X | |||||||
| P2rx7 | 3,53 | –3,1 | X | X | ||||||
| Pacs1 | 4,16 | –2,6 | X | |||||||
| Parp14 | 2,93 | –2,4 | X | X | X | |||||
| Peli2 | 4,98 | –2,9 | X | X | ||||||
| Pgap1 | 3,22 | –2,5 | X | X | X | X | X | X | ||
| Pim1 | 2,93 | –2,7 | X | |||||||
| Pld4 | 5,19 | –4,5 | X | |||||||
| Plxnc1 | 4,24 | –4,1 | X | |||||||
| Pmp22 | 2,98 | –3,0 | X | |||||||
| Ppbp | 2,90 | 5,4 | X | |||||||
| Ptgir | 3,30 | –3,2 | X | |||||||
| Ptgs1 | 3,71 | –4,1 | X | |||||||
| Rab3il1 | 3,19 | –3,5 | X | |||||||
| Rab8b | 2,85 | –3,0 | X | |||||||
| Rcsd1 | 3,74 | –3,7 | X | |||||||
| Rnasel | 2,62 | –2,5 | X | X | X | |||||
| Rnf150 | 4,58 | –2,8 | X | X | X | X | X | X | ||
| Rsad2 | 2,53 | –3,0 | X | X | X | X | ||||
| Rxra | 2,59 | –1,9 | X | X | ||||||
| S1pr1 | 3,26 | –3,6 | X | X | ||||||
| Sash1 | 3,01 | –2,6 | X | |||||||
| Sash3 | 3,21 | –3,2 | X | |||||||
| Sdc3 | 2,38 | –2,2 | X | X | X | X | ||||
| Sepp1 | 3,53 | –4,2 | X | |||||||
| Sgpp1 | 2,38 | –2,1 | X | X | ||||||
| Sidt2 | 2,64 | –2,1 | X | X | X | |||||
| Six1 | 3,60 | –5,0 | X | X | X | |||||
| Slamf7 | 4,94 | –4,2 | X | |||||||
| Slamf8 | 3,05 | –2,2 | X | |||||||
| Slc7a11 | 3,08 | –3,2 | X | X | X | X | X | |||
| Slc9a3r1 | 2,94 | –2,6 | X | |||||||
| Slfn5 | 4,24 | –2,7 | X | |||||||
| Slfn8 | 2,76 | –3,5 | X | |||||||
| Snx24 | 2,99 | –3,2 | X | X | X | X | ||||
| Snx30 | 2,79 | –3,2 | X | X | ||||||
| Stat2 | 2,76 | –1,8 | X | |||||||
| Stom | 2,60 | –2,5 | X | X | ||||||
| Susd3 | 2,76 | –3,1 | ||||||||
| Tanc2 | 2,65 | –3,1 | X | X | X | X | X | X | ||
| Tifa | 2,53 | –2,5 | X | |||||||
| Tle3 | 4,70 | –3,7 | X | X | X | |||||
| Tlr13 | 4,27 | –4,1 | X | |||||||
| Tmem154 | 3,16 | –5,6 | X | X | X | X | ||||
| Tmem176a | 4,09 | –5,2 | X | |||||||
| Tmem176b | 4,13 | –4,1 | X | |||||||
| Tmem229b | 2,75 | –1,9 | X | X | X | |||||
| Tmem71 | 4,32 | –4,7 | X | |||||||
| Tnfaip8l2 | 2,54 | –3,0 | X | |||||||
| Tnfrsf26 | 3,50 | –4,4 | X | X | X | |||||
| Trim30a | 2,41 | –1,9 | X | X | ||||||
| Trim30d | 3,73 | –4,1 | X | X | ||||||
| Ugcg | 2,90 | –2,4 | X | |||||||
| Usp18 | 4,07 | –3,0 | X | |||||||
| Wls | 2,43 | –2,4 | X | |||||||
| Ypel3 | 2,39 | –1,6 | X | |||||||
| Zcchc24 | 3,30 | –3,2 | X | X | X | |||||
| Zfhx3 | 3,46 | –2,4 | X | X | X | |||||
| Zfp36l1 | 2,36 | –2,1 | X | X | ||||||
| Zfp608 | 2,38 | –2,6 | X | X | ||||||
Key resources table
| Reagent type (species) or resource | Designation | Source or reference | Identifiers | Additional information |
|---|---|---|---|---|
| Strain, strain background (Mus musculus) | CD11cΔSyk and CD11c-Cre | Iborra et al., 2012 | ||
| Strain, strain background (M. musculus) | B6.Cg-Clec4etm1.1Cfg | Wells et al., 2008 | Clec4e−/− | |
| Strain, strain background (yeast) | Saccharomyces boulardii (Ultralevure) | Biocodex | ||
| Antibody | CD11b | ThermoFisher Scientific | clone M1/70 | 1:100 |
| Antibody | CD11c | BD Biosciences | clone HL3 | 1:200, for cell isolation |
| Antibody | CD11c | eBioscience | clone N418 | 1:200 |
| Antibody | Dectin-1 | ThermoFisher Scientific | clone bg1fpj | 1:100 |
| Antibody | Dectin-1 | ThermoFisher Scientific | clone bg1fpj | 1:100 |
| Antibody | Dectin-2 | R&D Systems | clone 17611 | 1:100 |
| Antibody | TLR2 | BD Biosciences | clone 6C2 | 1:200 |
| Antibody | Mincle | Invivogen | clone 6G5 | 1:50 |
| Antibody | mαr IgG2b secondary | Invitrogen | ref SA5-10184 | 1:50 |
| Antibody | MHC-II/Iab | BD Bioscience | clone AF6-120.1 | 1:200 |
| Antibody | CD80 | eBioscience | clone 16–10 A1 | 1:100 |
| Antibody | CD86 | BD Bioscience | clone GL1 | 1:100 |
| Antibody | CD115 | eBioscience | clone AFS98 | 1:100 |
| Antibody | RANK/CD265 | eBioscience | clone R12-31 | 1:100 |
| Antibody | TNF | ThermoFisher Scientific | clone MP6-XT22 | 1:400 |
| Antibody | Cx3cr1 | ThermoFisher Scientific | clone 2A9-1 | 1:100 |
| Antibody | CD16/32 | eBioscience | clone 93 | 1:100 |
| Antibody | CD4 | BD Biosciences | clone RM4-5 | 1:1000 |
| Antibody | Phospho-Syk (Tyr348) | eBioscience | clone moch1ct | |
| Antibody | anti-Osterix | Abcam | ab22552 | dilution 1:800 |
| Antibody | anti-sclerostin | R&D System | AF1589 | dilution 1:200 |
| Sequence-based reagent | 36B4 | PCR primers | TCCAGGCTTTGGGCATCA and CTTTATCAGCTGCACATCACTCAGA | |
| Sequence-based reagent | Syk | PCR primers | AACGTGCTTCTGGTCACACA and AGAACGCTTCCCACATCAGG | |
| Sequence-based reagent | Ctsk | PCR primers | CAGCAGAGGTGTGTACTATG and GCGTTGTTCTTATTCCGAGC | |
| Sequence-based reagent | Nfatc1 | PCR primers | TGAGGCTGGTCTTCCGAGTT and CGCTGGGAACACTCGATAGG | |
| Sequence-based reagent | siTlr2 | Horizon Discovery LTD | L-062838–02- 0005 | |
| Chemical compound, drug | Curdlan | Sigma-Aldrich | C7821 | |
| Chemical compound, drug | Zymosan | Sigma-Aldrich | Z4250 | |
| Chemical compound, drug | GlcC14C18 | InvivoGen | tlrl-gcc | |
| Chemical compound, drug | FITC dextran | Sigma-Aldrich | FD4 | |
| Chemical compound, drug | H33342 | Sigma-Aldrich | B2261 | 5 µg/mL |
| Commercial assay or kit | RatLaps (CTX-I) EIA | Immunodiagnostic Systems Limited | NC9787201 | |
| Commercial assay or kit | Annexin V Apoptosis detection kit | BD Biosciences | 556547 | |
| Commercial assay or kit | Acid Phosphatase Leucocyte kit | Sigma-Aldrich | 387 A | |
| peptide, recombinant protein | rmRANKL | R&D System | 462-TEC | 30 ng/mL |
| peptide, recombinant protein | rmM-CSF | R&D System | 416 ML | 25 ng/mL |
| peptide, recombinant protein | rmIL4 | Peprotech | 214–14 | 10 ng/mL |
| peptide, recombinant protein | rmGM-CSF | Peprotech | 315–03 | 10 ng/mL |
| Software, algorithm | ImageJ software version 1.53 | NIH, Bethesda, MD | ||
| Software, algorithm | FlowJo 10.8.1 | FlowJo | ||
| Software, algorithm | NRecon software | Bruker µCT, Belgium | ||
| Software, algorithm | Graph Pad Prism 9.4 software | Graph Pad Prism |
Author response table 1
| Gene Set Name | # Genes in Gene Set (K) | # Genes in Overlap (k) | k/K | p-value | FDR q-value |
|---|---|---|---|---|---|
| DEFENSE_RESPONSE | 1816 | 109 | 0.0600 | 3.16E-47 | 3.88E-43 |
| REGULATION_OF_IMMUNE_SYSTEM_PROCESS | 1642 | 101 | 0.0615 | 1.54E-44 | 9.45E-41 |
| INFLAMMATORY_RESPONSE | 770 | 69 | 0.0896 | 2.09E-40 | 8.58E-37 |
| CELL_ADHESION | 1480 | 84 | 0.0568 | 2.77E-34 | 8.53E-31 |
| IMMUNE_RESPONSE | 1920 | 94 | 0.0490 | 2.27E-33 | 5.57E-30 |
| CELL_ACTIVATION | 1273 | 77 | 0.0605 | 3.16E-33 | 6.48E-30 |
| BIOLOGICAL_PROCESS_INVOLVED_IN_INTERSPECIES_INTERACTION_BETWEEN_ORGANISMS | 1835 | 91 | 0.0496 | 1.07E-32 | 1.89E-29 |
| REGULATION_OF_CELL_ADHESION | 811 | 60 | 0.0740 | 1.46E-30 | 2.24E-27 |
| POSITIVE_REGULATION_OF_MULTICELLULAR_ORGANISMAL_PROCESS | 1722 | 85 | 0.0494 | 2.39E-30 | 3.26E-27 |
| REGULATION_OF_RESPONSE_TO_EXTERNAL_STIMULUS | 992 | 65 | 0.0655 | 5.04E-30 | 6.19E-27 |
Additional files
Download links
A two-part list of links to download the article, or parts of the article, in various formats.
Downloads (link to download the article as PDF)
Open citations (links to open the citations from this article in various online reference manager services)
Cite this article (links to download the citations from this article in formats compatible with various reference manager tools)
Specific targeting of inflammatory osteoclastogenesis by the probiotic yeast S. boulardii CNCM I-745 reduces bone loss in osteoporosis
eLife 12:e82037.
https://doi.org/10.7554/eLife.82037


