Double NPY motifs at the N-terminus of the yeast t-SNARE Sso2 synergistically bind Sec3 to promote membrane fusion
- Max Perutz Labs, Vienna Biocenter, Medical University of Vienna, Austria
- Department of Cellular and Molecular Medicine, University of California, San Diego, United States
Figures
Figure 1 with 1 supplement
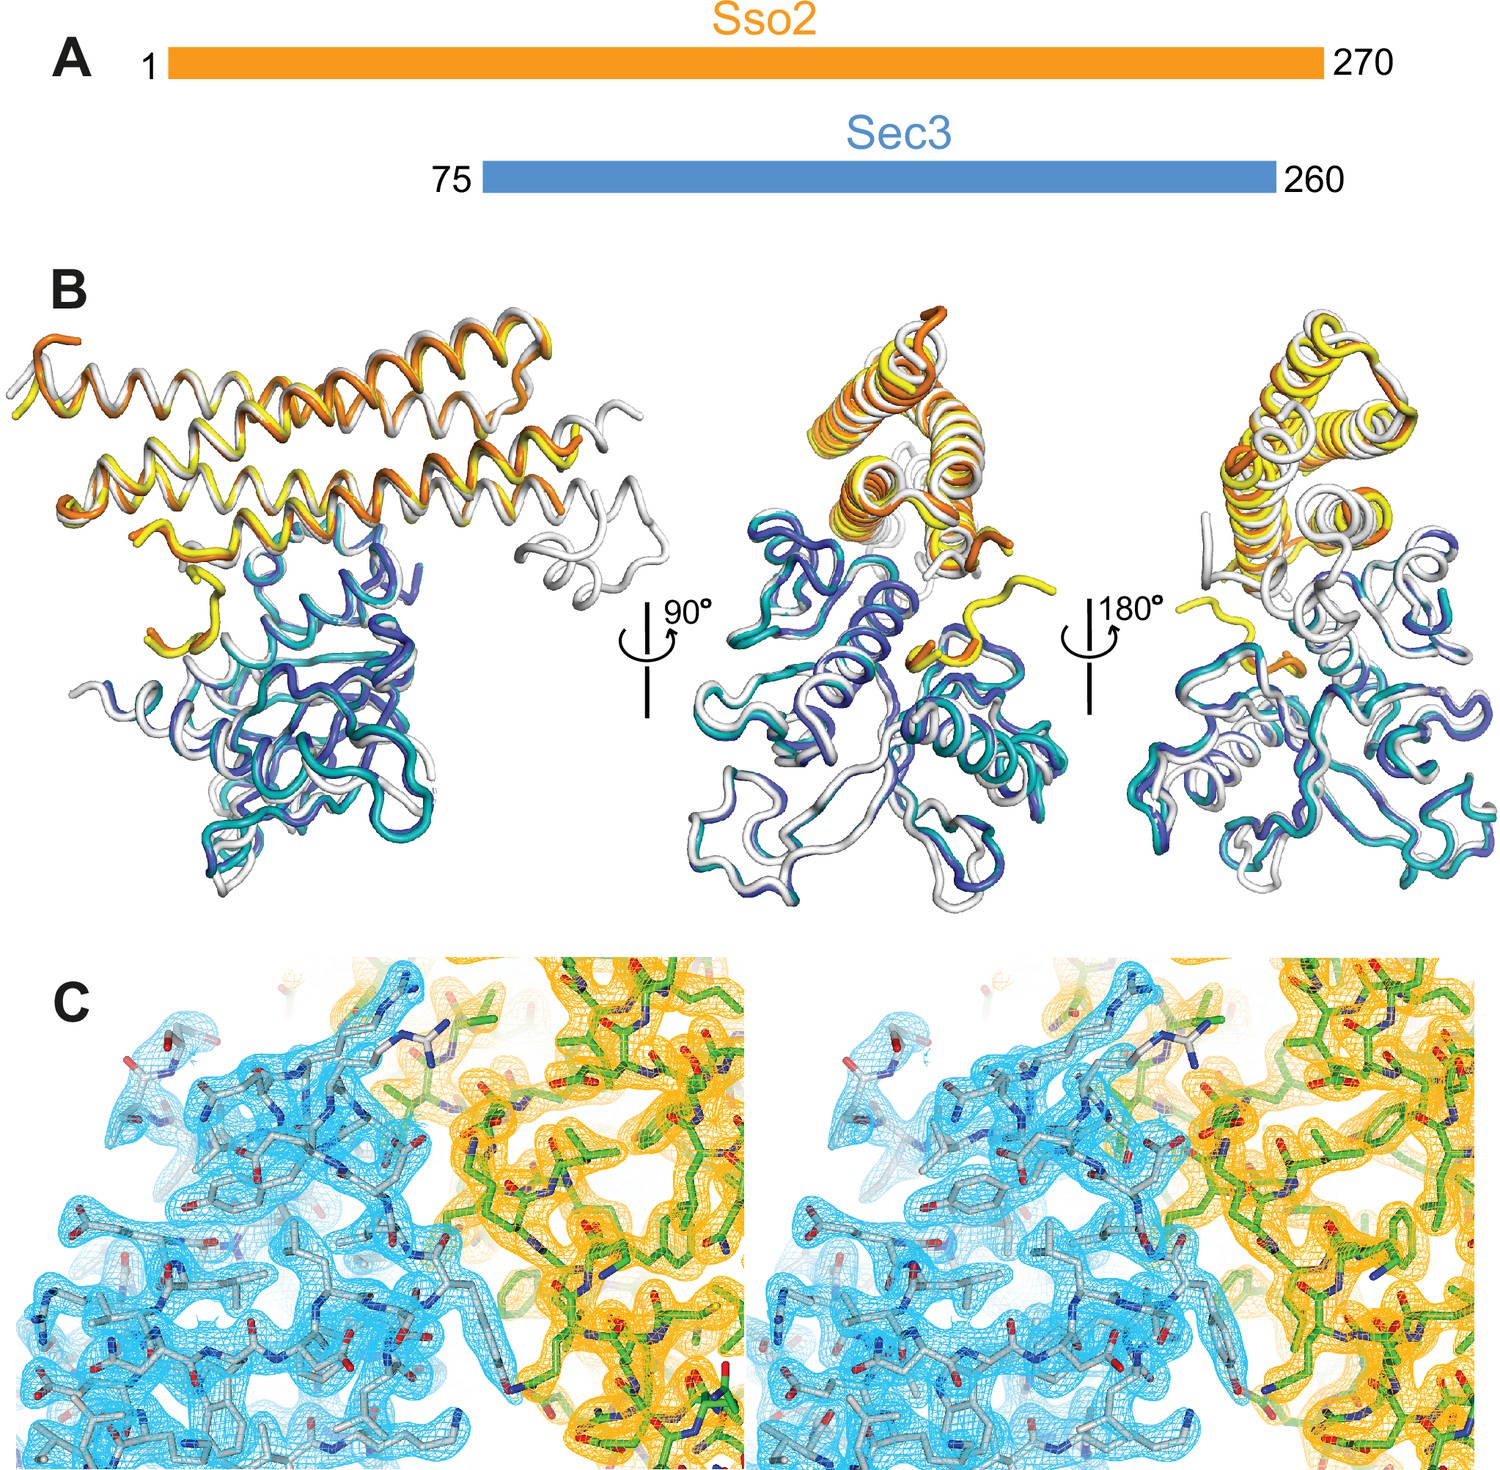
Crystal structure of the Sso2/Sec3 complex.
(A) Schematics of the constructs of Sso2 (aa1–270) and Sec3 (aa75–260) used in our structural studies. (B) Superposition of the two Sso2/Sec3 complexes in the asymmetric unit of the crystal structure, together with the one reported previously (light gray, pdb code: 5M4Y). (C) Stereo view of the 2Fo−Fc electron density map contoured at 1.8σ level around the binding interface. Maps for Sec3 and Sso2 are colored in cyan and orange, respectively.
Figure 1—figure supplement 1
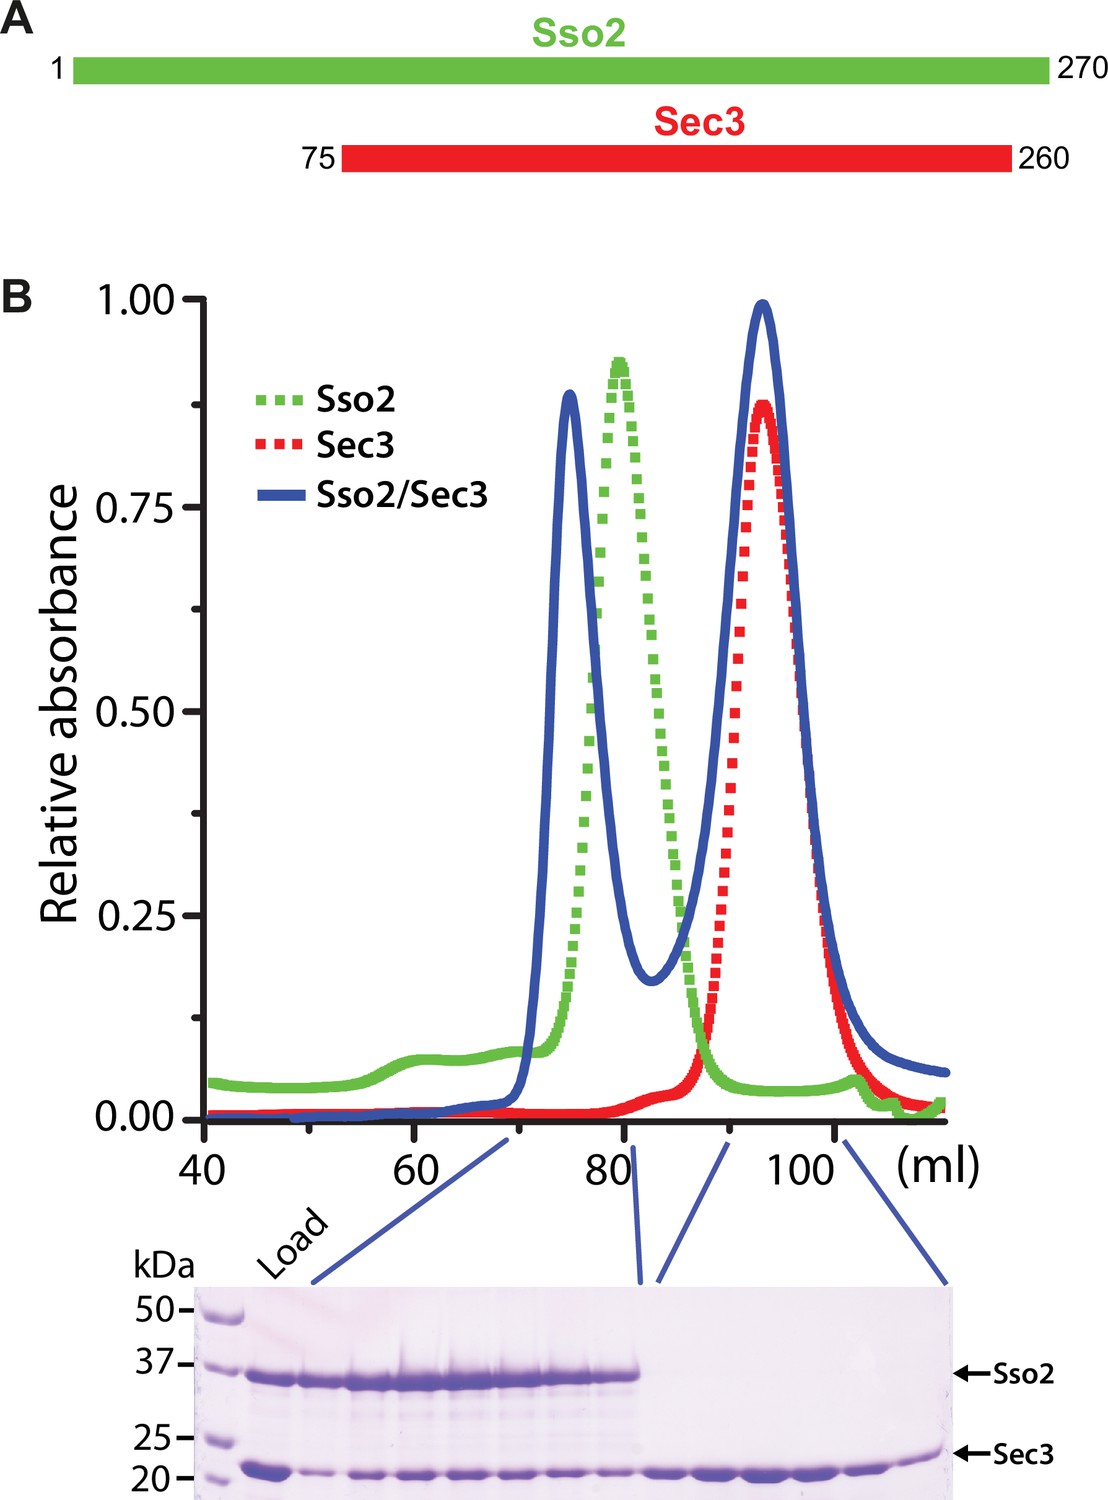
Constructs and purification of the Sso2/Sec3 complex.
(A) Schematics of the constructs of Sso2 (aa1–270) and Sec3 (aa75–260) used in our studies. (B) Size-exclusion chromatography elution profiles of Sso2, Sec3, and a mixture of Sso2 and Sec3 (molar ratio 1:3). The SDS PAGE gel shows proteins in the mixture (“Load”) and fractions from the two elution peaks of the mixture. The first peak contains the Sso2/Sec3 complex with both proteins; the second one contains only excessive Sec3 alone.
Figure 2 with 2 supplements
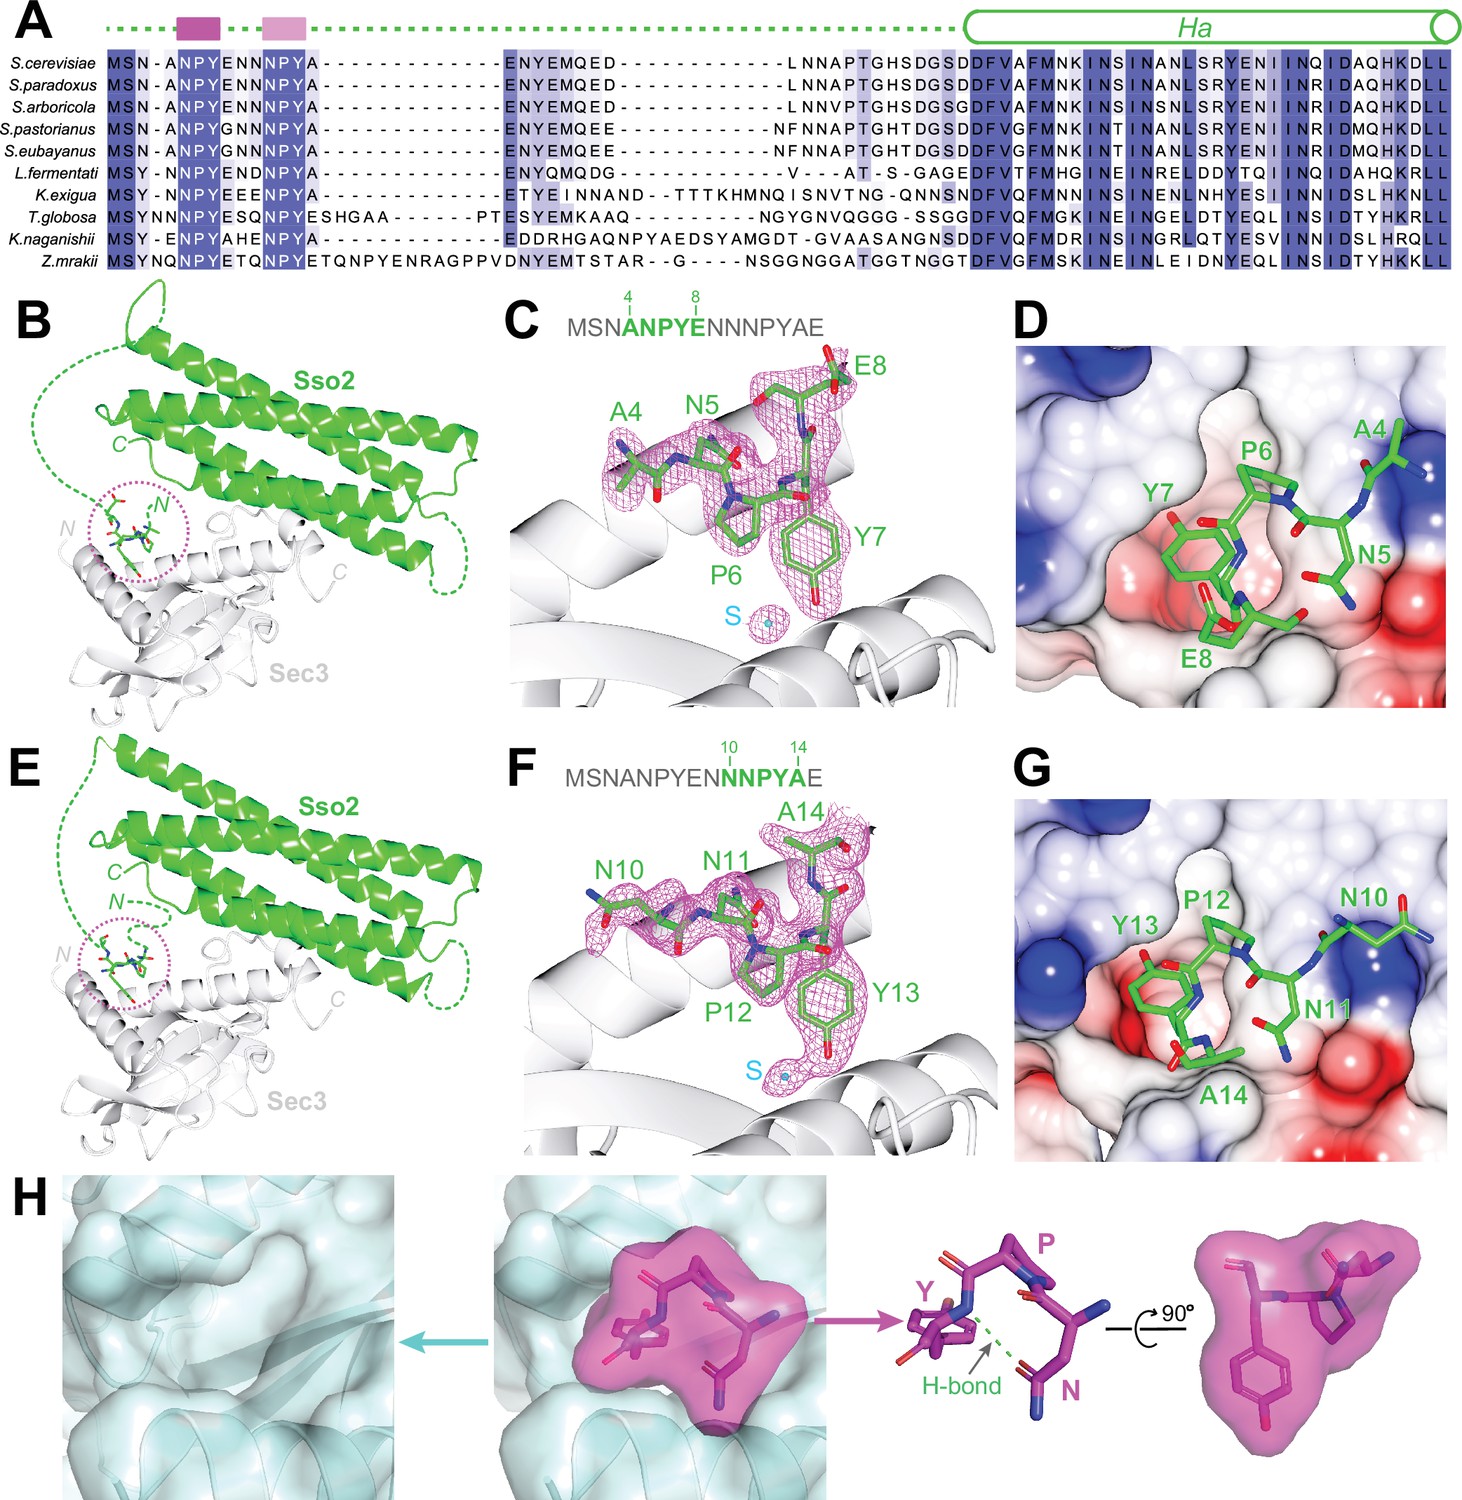
Structural analyses of the interaction between the NPY motifs of Sso2 and Sec3.
(A) Sequence alignments of Sso2 homologs. Conserved residues are shaded in dark (highly conserved) or light blue (partially conserved). The two NPY motifs are marked as magenta blocks above the aligned sequences, which are connected to helix Ha via a variable linker. (B) Ribbon diagram of the crystal structure of the Sso2/Sec3 complex with first NPY motif (shown as sticks) of Sso2 bound to Sec3. (C) An enlarged view of the NPY motif in (B) together with the 2Fo–Fc map contoured at 1.5σ. (D) Sticks of the NPY motif on top of an electrostatic surface plot of Sec3. (E–G) Crystal structure shows how the second NPY motif of Sso2 interacts with Sec3. (H) Separate views of the binding site show the cork-like NPY motif (magenta) and the complementary cradle-like pocket on Sec3 (light blue). The structure is shown as semitransparent surface together with ribbon diagrams (Sec3) or sticks (Sso2). The broad top part of the ‘cork’ of Sso2 is stabilized by a hydrogen bond between the carboxyl group of the Asn (N) sidechain and the amide proton of Tyr (Y).
Figure 2—figure supplement 1
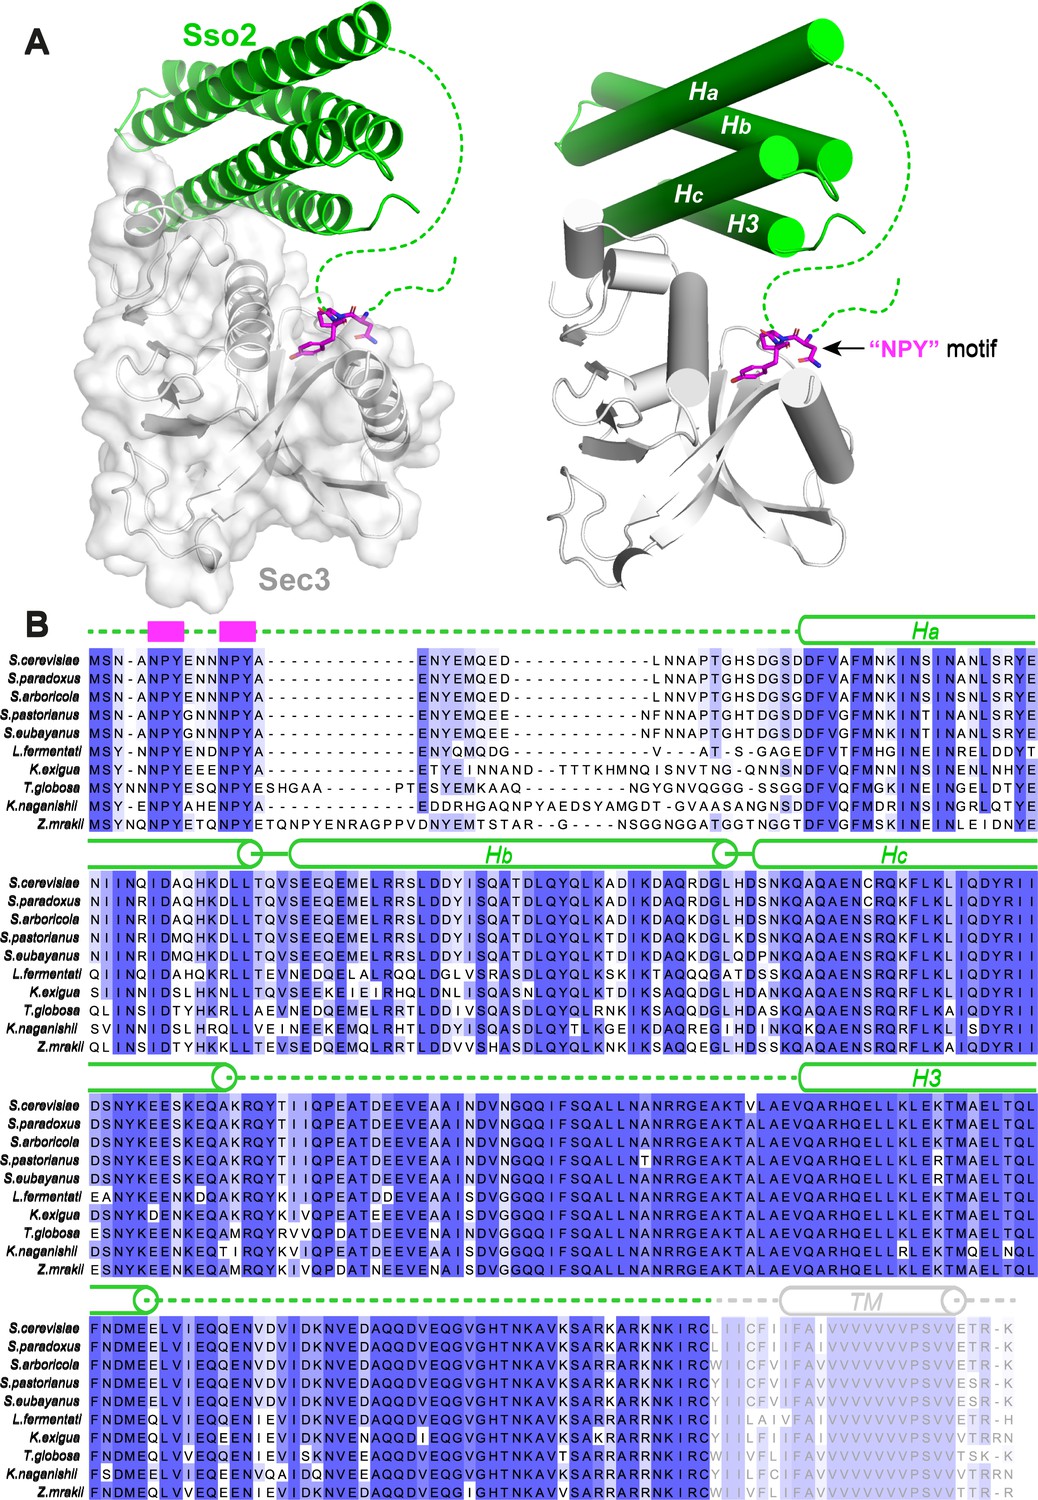
Structure of the Sso2/Sec3 complex and conservation analysis.
(A) Two different representations of the Sso2/Sec3 complex structure show the two separate interaction sites between the two proteins. The NPY motif of Sso2 is shown as magenta sticks. Dash lines depict the regions that are invisible in the crystal structure. (B) Sequence alignment of multiple Sso2 homologs. Highly and relatively conserved residues are shaded in dark and light blue, respectively. Secondary structures are shown above the aligned sequences. The two highly conserved NPY motifs at the N terminus of Sso2 are depicted as magenta blocks. Dash lines represent the unstructured loops that are invisible in the crystal structure. The C-terminal twenty-five residues of Sso2, including the hydrophobic transmembrane helix, is colored grey and was excluded from our protein expression construct.
Figure 2—figure supplement 2
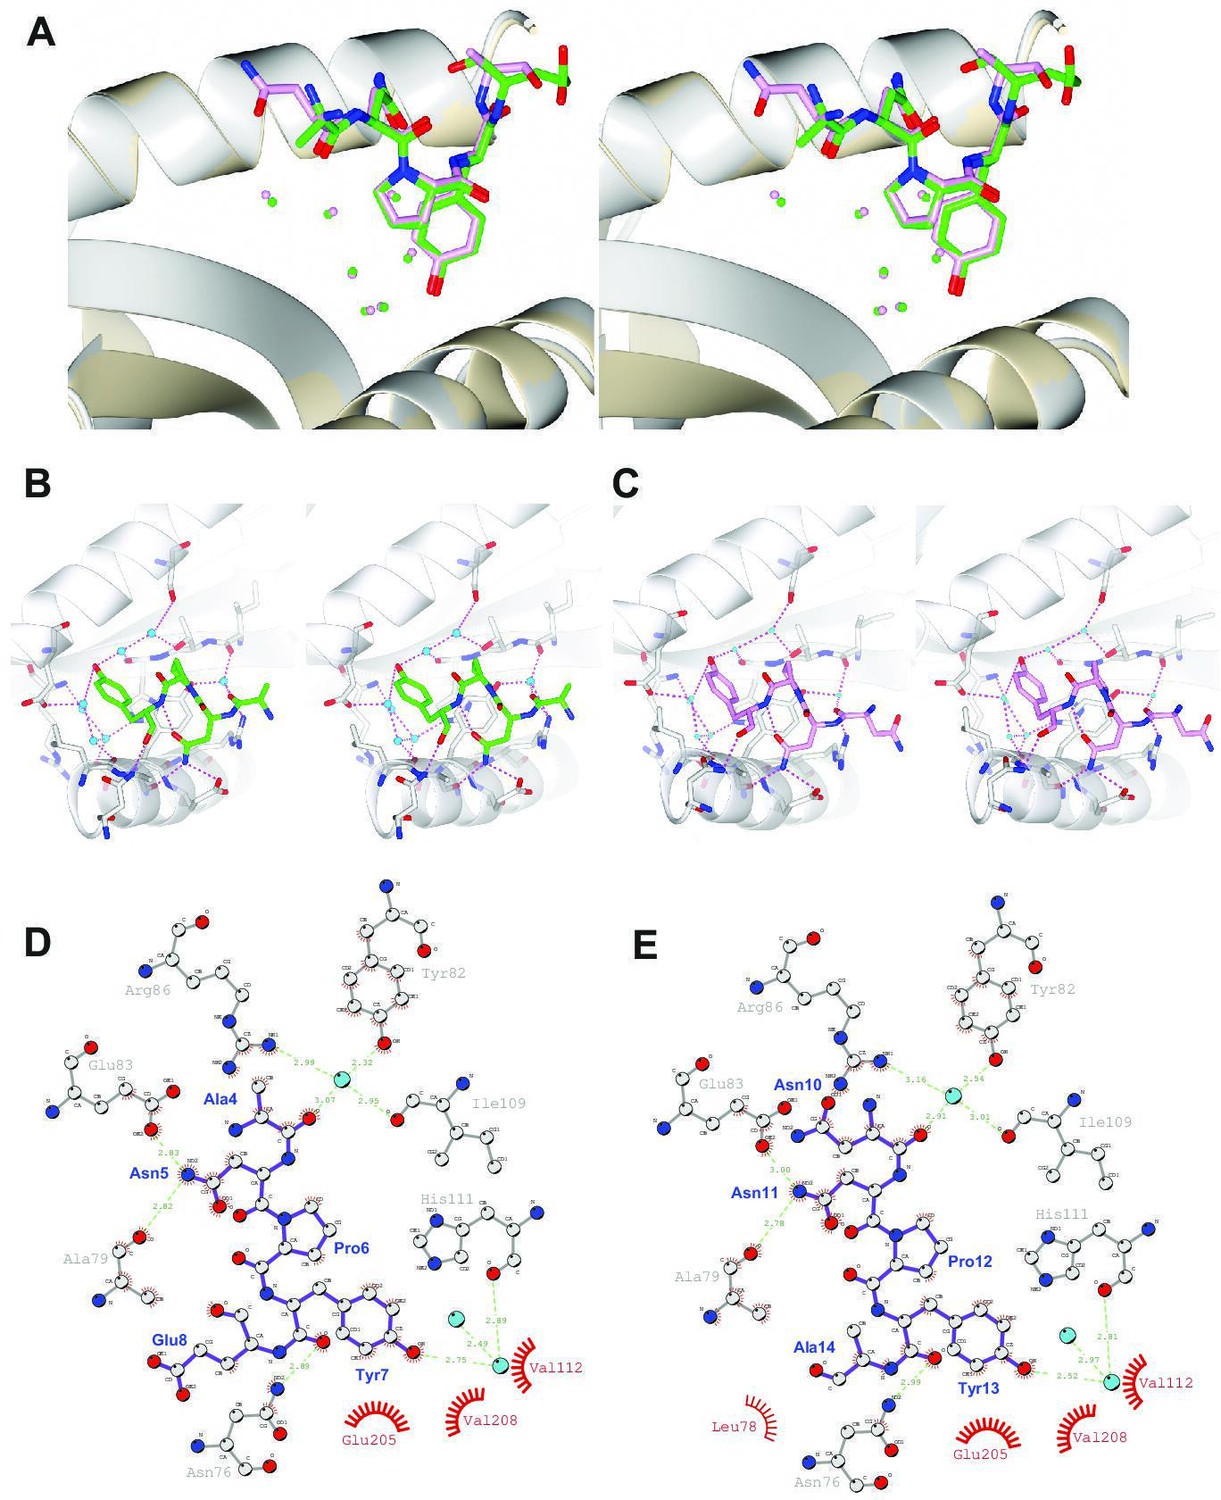
Local chemical environment around the NPY motifs in the Sso2/Sec3 complex structure.
(A) Stereo view of the enlarged NPY binding sites of the two superimposed structures. Sec3 and the NPY motifs of Sso2 are shown as ribbons and sticks, respectively. Water molecules bound to the NPY motifs (directly or indirectly) are depicted as spheres with the same colors as the corresponding NPY motifs. (B, C) Separate stereo views of the two NPY binding sites. Sec3 molecules are shown as ribbons, with those residues hydrogen bonded to Sso2 or Sso2-bound water molecules additionally shown as sticks. The NPY motifs and waters are shown as sticks and spheres, respectively. All hydrogen bonds are depicted as dash lines. (D, E) Details of interactions between the NPY motifs of Sso2 (purple) and Sec3 (gray). The plots were generated using DIMPLOT in the LigPlot plus suite. Residues involved in hydrogen bond formation are shown as ball-and-stick, with oxygen, nitrogen, and carbon atoms colored in red, blue, and gray, respectively. Water molecules mediating intermolecular hydrogen bond formation are shown as cyan-colored spheres. Green dash lines indicate hydrogen bonds. Non-bonded residues involved in hydrophobic interactions are shown as spoked arcs. For clarity, only three of the seven bound water molecules are shown.
Figure 3
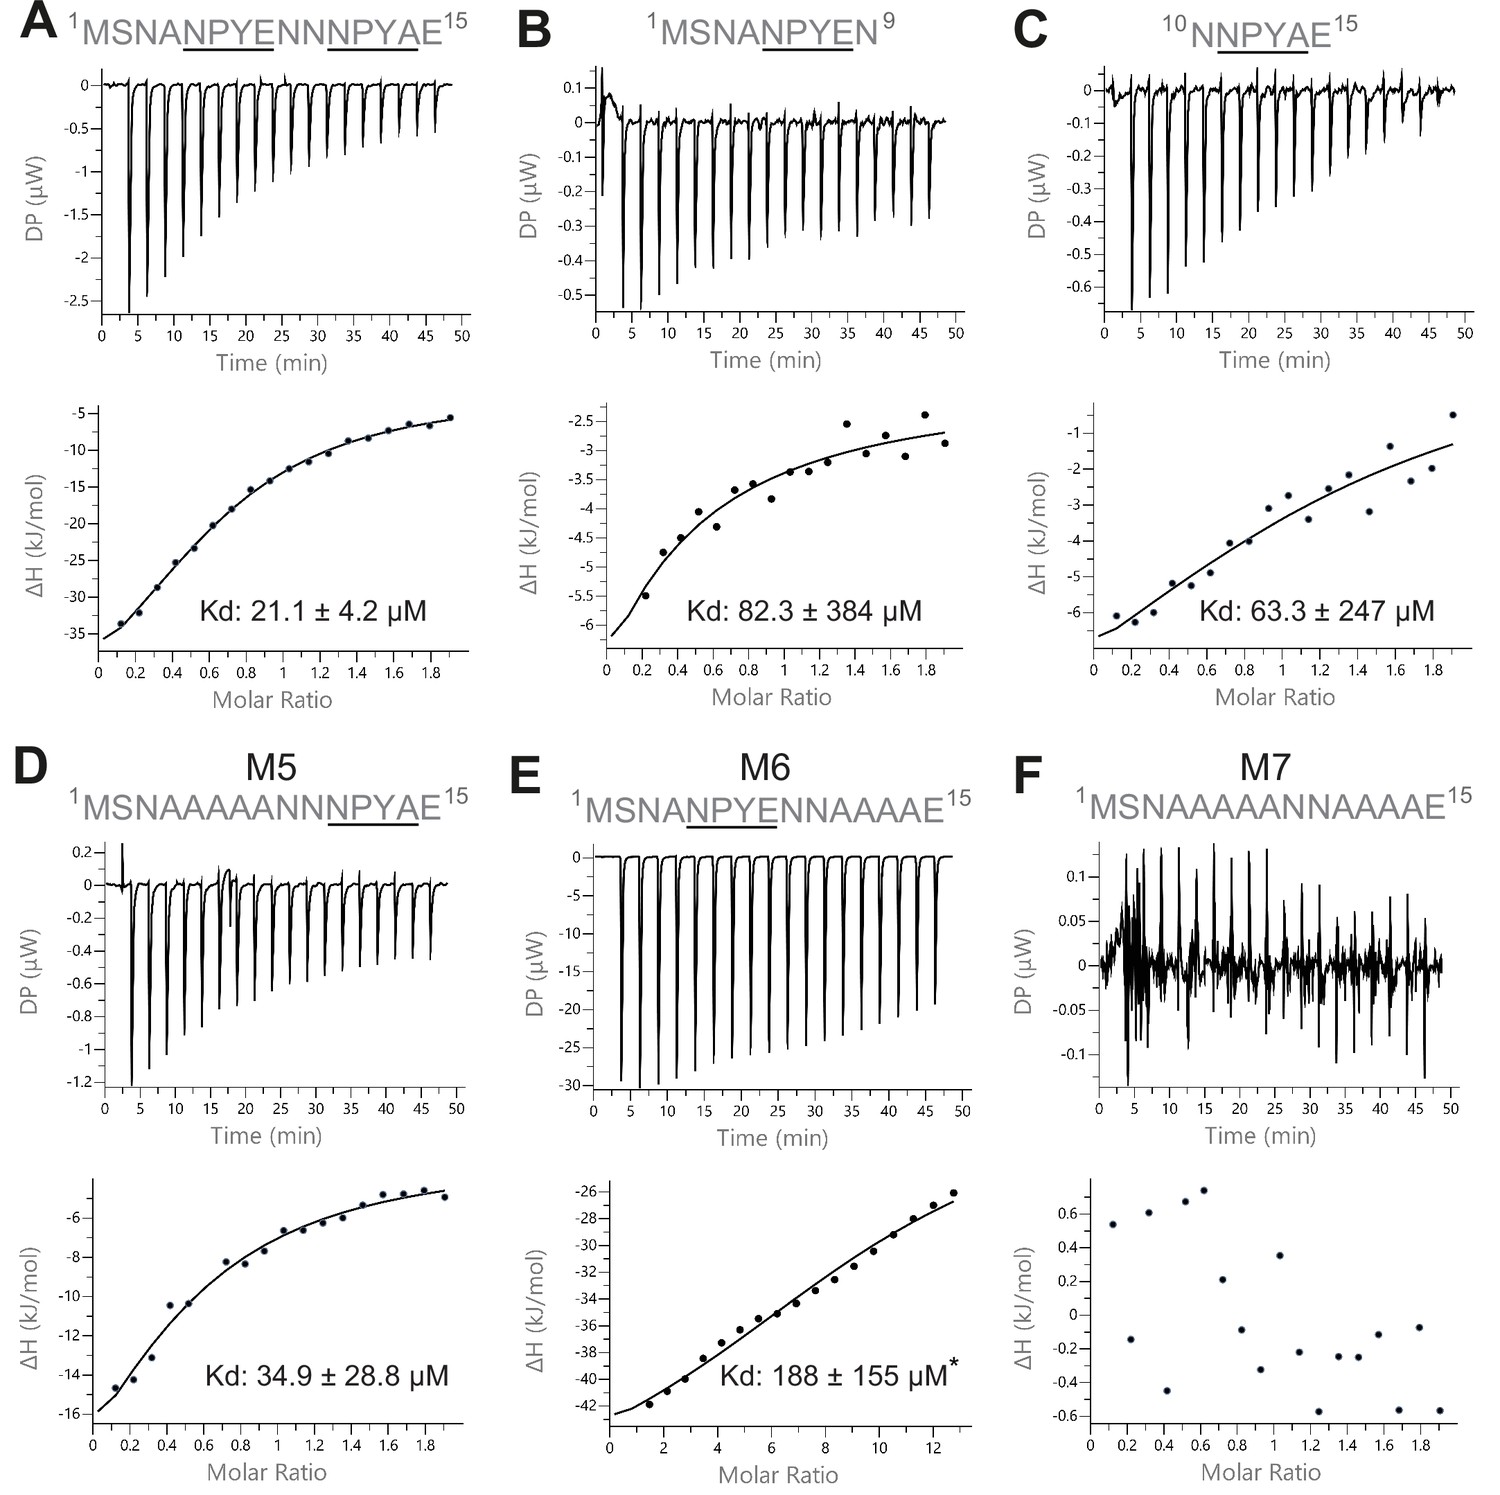
Isothermal titration calorimetry (ITC) measurements of the interaction between Sec3 and variant versions of the NPY motifs of Sso2.
(A) Wild type double NPY motifs of Sso2 bound Sec3 with a dissociation constant (Kd) of approximately 21 µM. (B and C) Either of the two NPY motifs alone bound Sec3 much more weakly than the two together, with Kd values increased by three- to fourfold. (D and E) Mutation of either NPY motif (i.e. M5 and M6) also substantially reduced the binding affinity of Sso2 to Sec3. (F) Double mutation (M7) of both NPY motifs completely abolished the interaction between Sso2 and Sec3. For M6 in (E), the peptide concentration had to be increased by sixfold to detect its very weak interaction with Sec3.
Figure 4 with 1 supplement
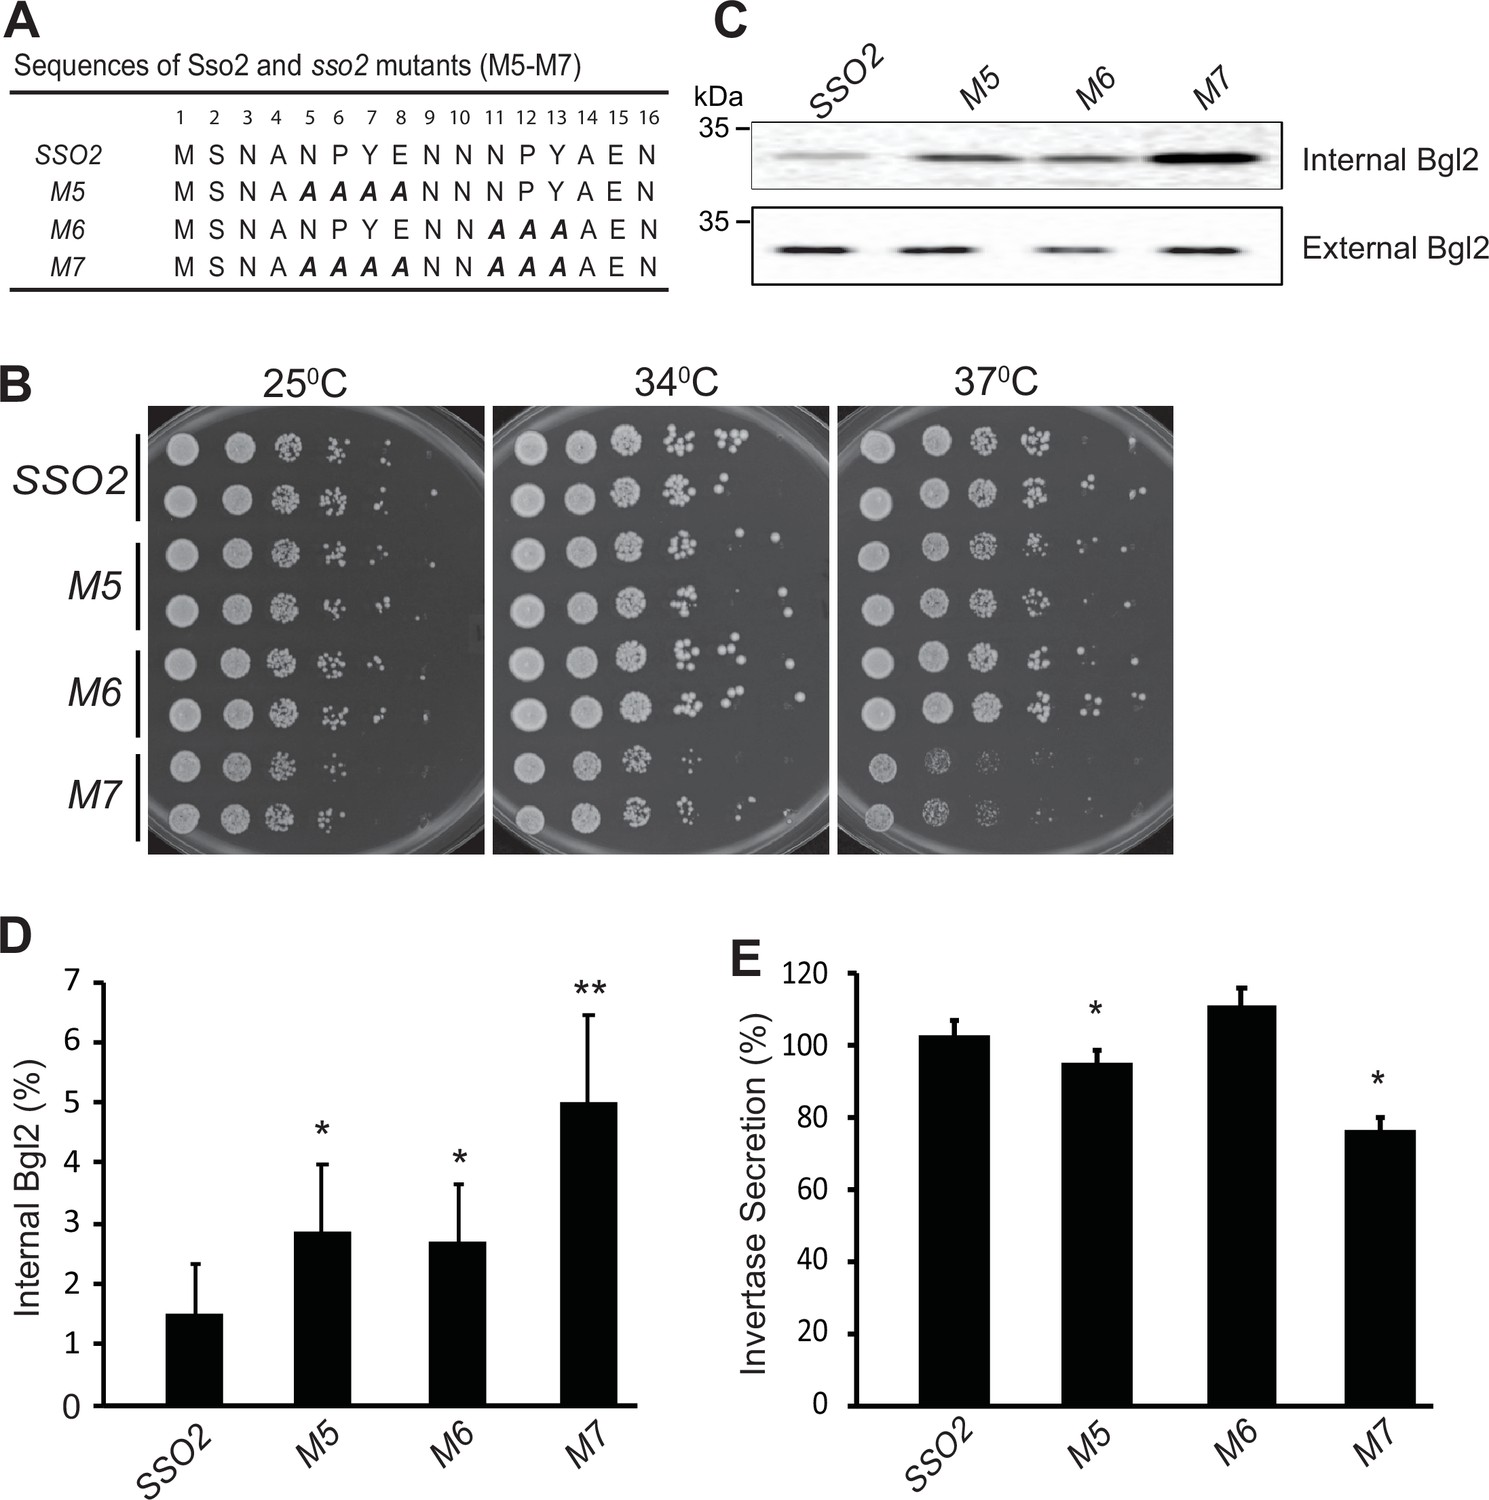
Mutations in sso2 inhibit cell growth and secretion of Bgl2 and invertase.
(A) Sequences of three sso2 mutants generated by site-directed mutagenesis. Residues in the first and/or the second NPY motif that were mutated to Ala (A) are shown in bold italics. (B) Sso2 mutants in an sso1Δ background partially inhibit cells growth at 37°C. Control sso1⊗ SSO2 or sso1Δ sso2 mutant cells were grown overnight in YPD medium. An aliquot (0.2 OD600 units) of cells from each strain was collected, serially diluted by fivefold and spotted onto YPD plates. Plates were incubated at 25oC, 34oC, or 37oC for 2 days. (C–D) The sso1Δ sso2 mutants were grown at 25oC in YPD medium overnight to early log phase and shifted to 37oC for 90 min. The internal and external fractions were prepared as described in Materials and methods. (C) The internal or external pools of Bgl2 were detected by western blotting. Several mutations in SSO2 caused inhibition of Bgl2 secretion. (D) Quantitation of internal Bgl2 was determined by ImageJ. Results were analyzed based on seven independent experiments. Error bar represents SD, n=7. *p<0.005, **p<2e5. (E) Strains were grown at 25°C in YP containing 5% (v/v) glucose medium overnight to early log phase. 1 OD600 unit of cells was collected from each strain and shifted to YP containing 0.1% (v/v) glucose medium, and incubated at 37oC for 45 min. Four independent experiments were performed. Error bars represent SD, n=4. *p<0.005.
Figure 4—figure supplement 1
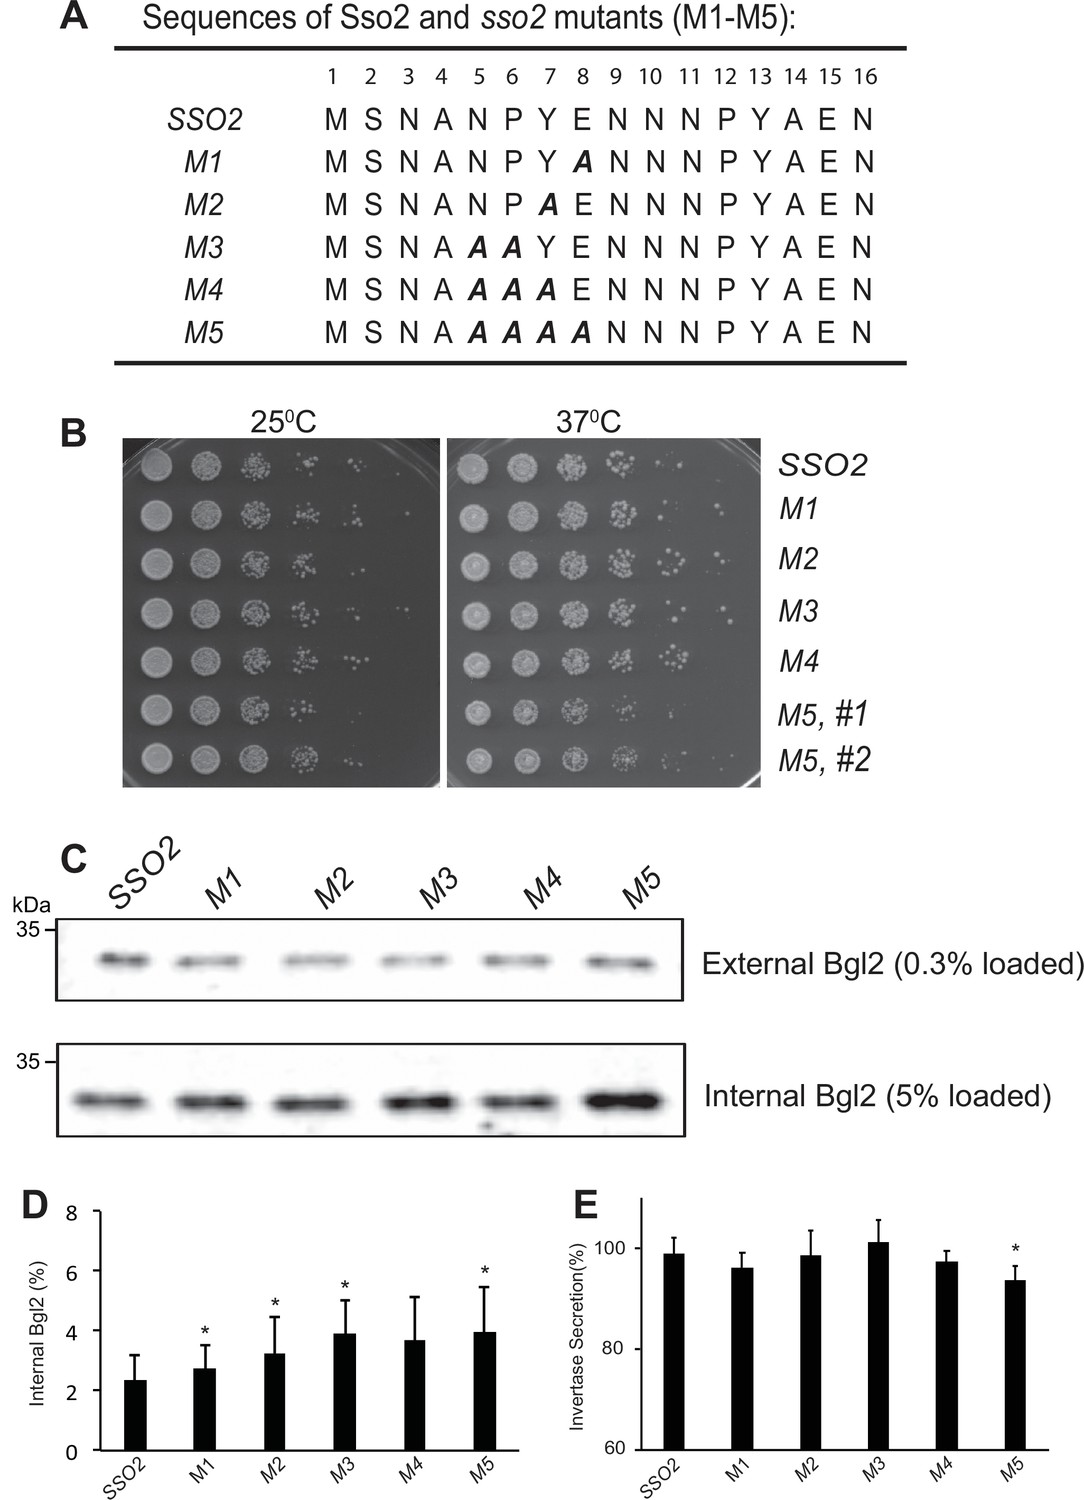
Growth effect and influence on Bgl2 and invertase secretion of sso2 mutants of its first NPY motif.
(A) The sequence of sso2 mutants generated by site-directed mutagenesis. Residues in the first NPY motif that were mutated to Ala (A) in all mutants (i.e. M1-M5) are shown in bold italics. (B) The sso2 mutations in an sso1Δ background partially inhibit cells growth at 37oC. Control sso1Δ SSO2 or sso1Δ sso2 mutant cells were grown overnight in YPD medium. An aliquot (0.2 OD600 units) of cells from each strain was collected, serially diluted by 5 fold and spotted onto YPD plates. Plates were incubated at 25oC, 34 oC or 37oC for 2 days. (C) Control sso1Δ SSO2 strain and sso1Δ sso2 mutants were grown as described in Figure 3. The external and internal Bgl2 pools were detected by western blotting. Several mutations in SSO2 caused inhibition of Bgl2 secretion. (D) Quantitation of internal Bgl2. Results were analyzed based on four independent experiments. Error bar represents SD, n=5. *p<0.05. (E) Invertase secretion was determined in sso2 mutants. Strains were grown as in Figure 3. Samples were processed and quantified as described in Materials and Methods. Three independent experiments were performed. Error bar represents SD, n=3. *p < 0.05. Invertase accumulation was calculated by the formula of .
Figure 5
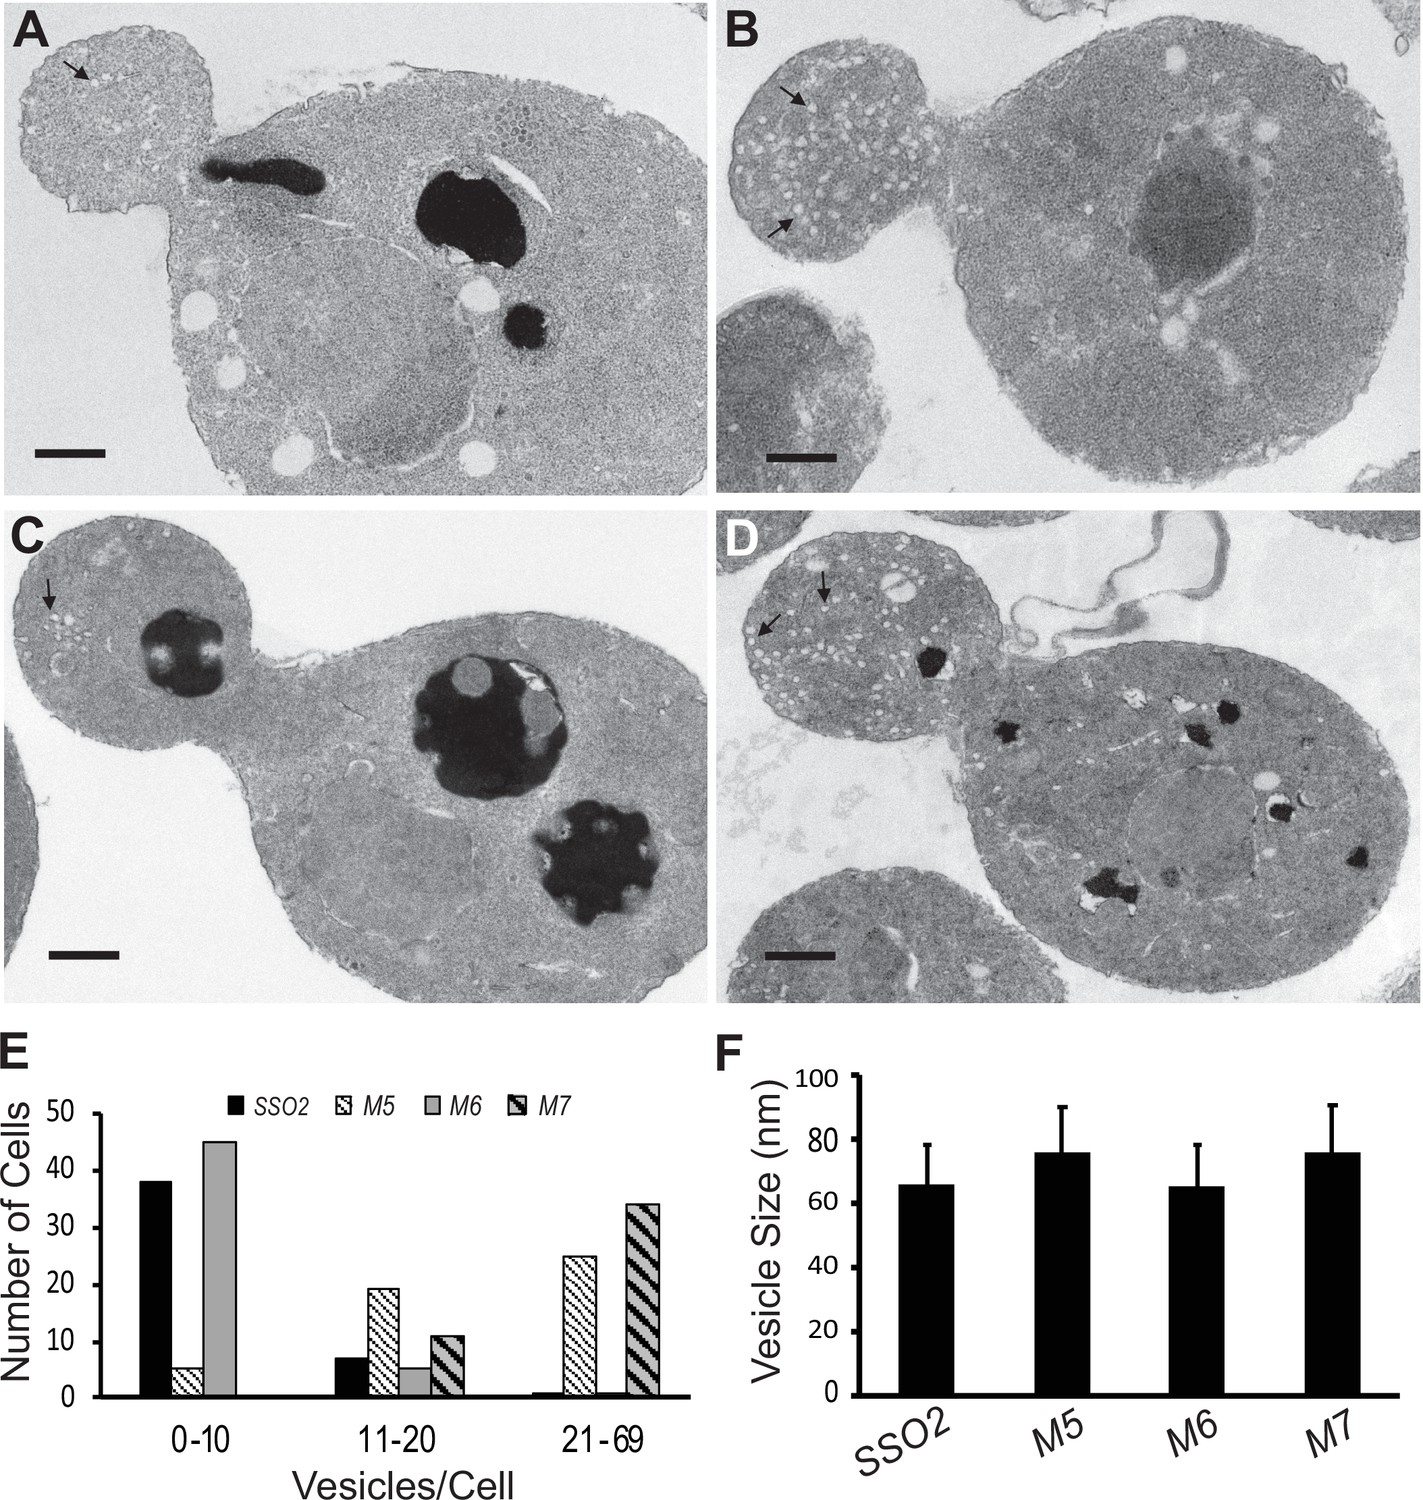
Thin section electron microscopy (EM) analysis shows polarized accumulation of secretory vesicles in the sso2M5 and sso2M7 strains.
A control sso1Δ SSO2 strain and sso1Δ sso2 mutants were grown in YPD medium at 25°C to an OD600 of 0.5, then 10 OD600 units of cells were collected and processed for EM analysis: (A) sso1Δ SSO2, (B) sso1Δ sso2M5, (C) sso1Δ sso2M6, and (D) sso1Δ sso2M7. Scale bar, 0.5 µm. sso2M5 and sso2M7 cells contain more secretory vesicles in the bud compared to SSO2 and sso2M6 cells. (E) Quantitation of secretory vesicles. The number of vesicles/cell was scored in 46 control cells, 49 sso2M5 cells, 51 sso2M6 cells, and 45 sso2M7 cells. (F) Measurement of vesicle size. The measurement was analyzed using ImageJ; 23–91 vesicles were measured.
Figure 6
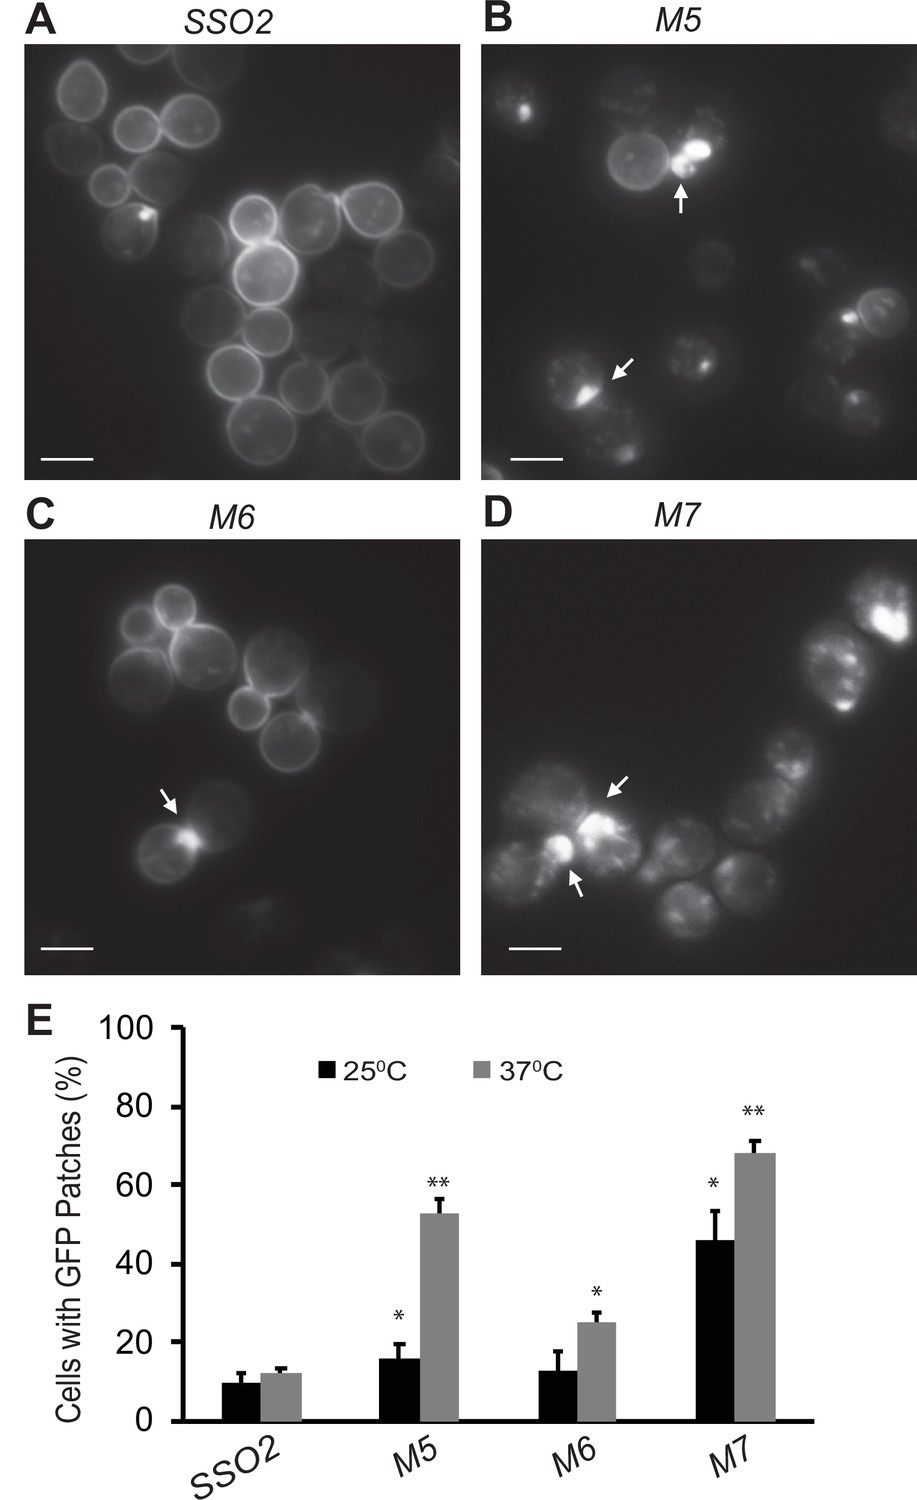
Snc1 recycling is affected in sso2 mutants.
(A–D) Representative images of sso1Δ SSO2 control, sso1Δ sso2M5 sso1Δ sso2M6, and sso1Δ sso2M7 mutant cells. Strains harboring a CEN plasmid expressing GFP-Snc1 were grown in SC-Ura medium overnight at 25°C reaching an OD600 around 0.5. Cells were further diluted and shifted to 37°C for 90 min prior to imaging. GFP-Snc1 localized predominantly to the PM in SSO2 control cells and sso2M6 cells yet formed GFP patches (indicated by arrows) near small buds or bud necks in sso2M5 and sso2M7 mutant cells. Scale bar, 5 µm. (E) Quantitation of cells with GFP-Snc1 patches. GFP-Snc1 patches near bud tips or necks were scored. Error bar represents SD, n=3. *p<0.05, **p<0.005.
Figure 7

The sso2 mutations have little effect on the actin-independent localization of Sec3.
(A) A control sso1Δ SSO2 strain or sso1Δ sso2 mutants expressing Sec4-GFP were grown to early log phase in YPD at 25°C, then 1 OD600 unit cells was collected and resuspended in 50 µl SC medium and incubated with 200 µM Latrunculin A (LatA) or DMSO at 25°C for 15 min prior to imaging. Images were captured by fluorescence microscopy. Sec4 is normally localized near the tip of small buds (arrow) and the neck of large buds (arrowhead) in DMSO-treated cells. Sec4 localization was disrupted in LatA-treated cells. Scale bar, 5 µm (for all images). (B) Quantitation of polarized Sec4-GFP. (C) A control sso1Δ SSO2 strain and the sso1Δ sso2 mutant strains expressing Sec3−3×GFP were grown and treated with LatA or DMSO under the conditions as described in A. Sec3 localization remains polarized after LatA treatment, either at the tips of small bus (arrow) or the necks of large buds (arrow head). Scale bar, 5 µm. (D) Quantitation of polarized Sec3−3×GFP. Error bars represent SDs based on three independent experiments in each case.
Figure 8 with 2 supplements
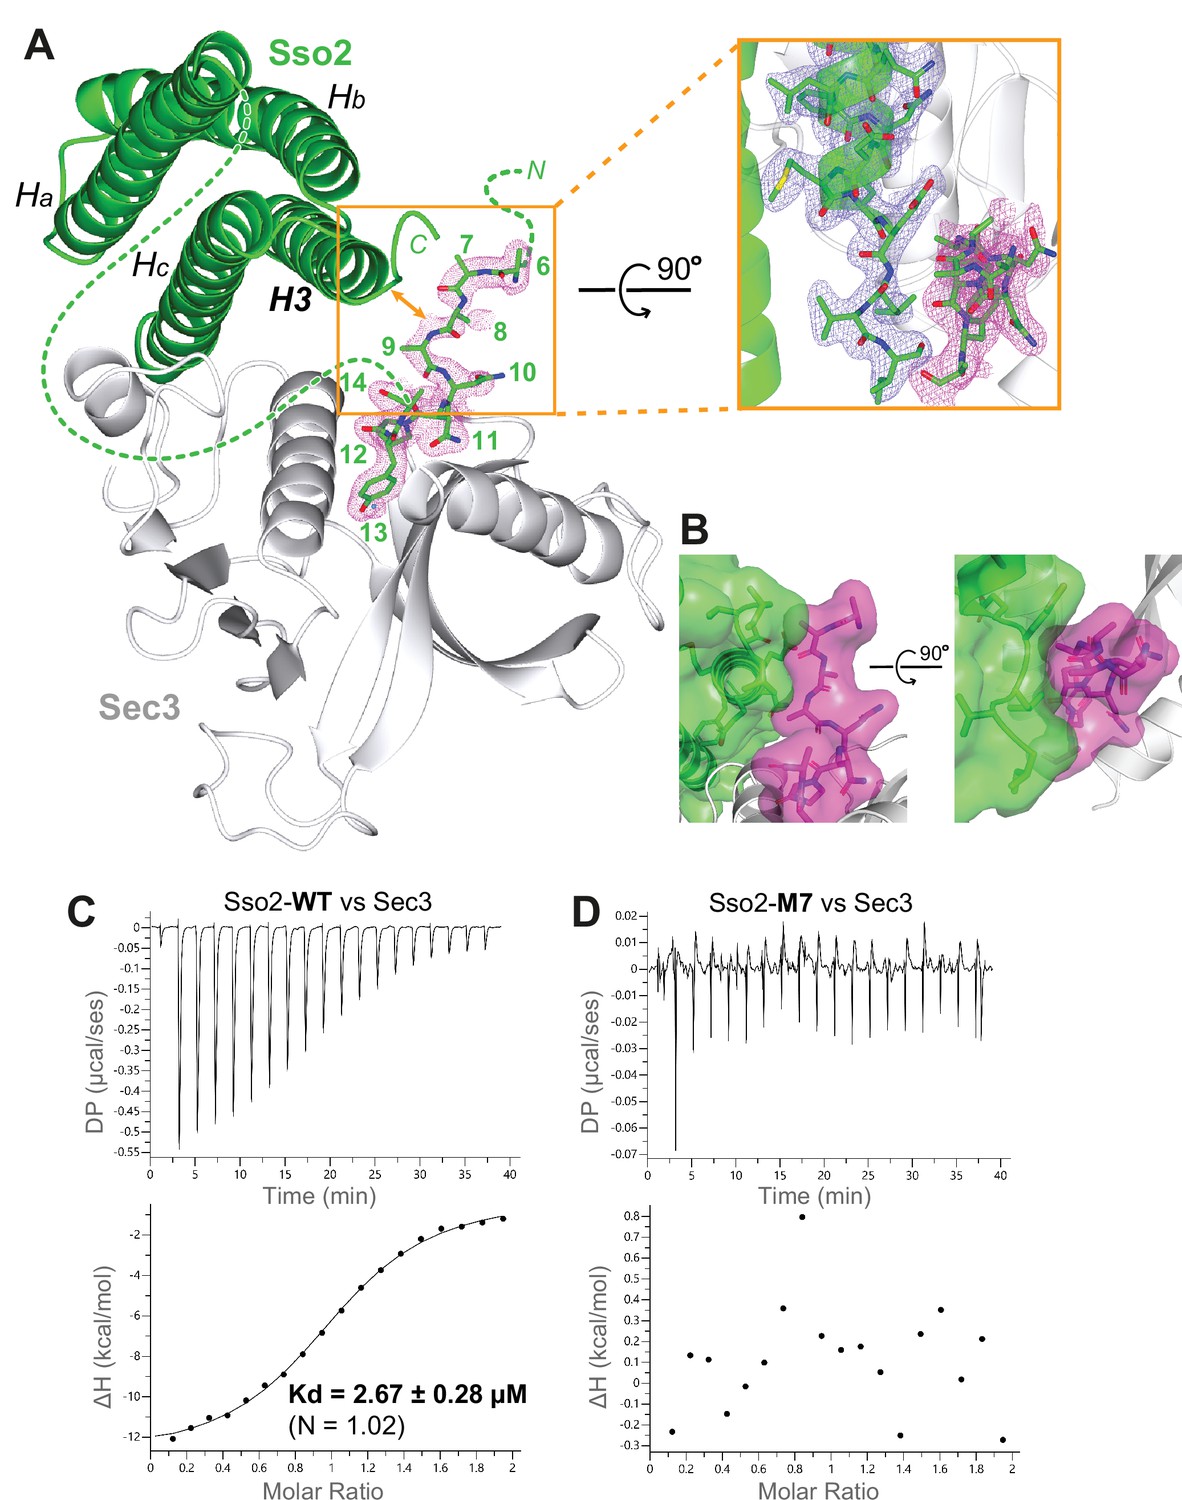
The NPY motifs of Sso2 are packed against the C-terminal tip of its soluble N-ethylmaleimide-sensitive factor-attachment protein receptor (SNARE) motif in the complex structure.
(A) Ribbon diagram of the Sso2/Sec3 complex structure with the 2Fo−Fc map around the NPY motif (residue positions are marked by numbers) shown in dots (1.5σ). The enlarged view shows the close contact between the NPY motif and the C-terminal tip of the H3 helix of Sso2 with their 2Fo−Fc maps shown in magenta and blue, respectively. (B) Two orthogonal views of the contact site between the N-terminal extension (magenta) and the C-terminal region (green) of Sso2. Sso2 structure is shown as ribbons and sticks together with a semitransparent surface plot. (C) Isothermal titration calorimetry (ITC) result shows that wild type (WT) Sso2 (aa1–270) bound Sec3-PH robustly, with a Kd of 2.67 µM. (D) Mutant M7 of Sso2 (aa1–270) did not bind the Sec3 PH domain.
Figure 8—figure supplement 1
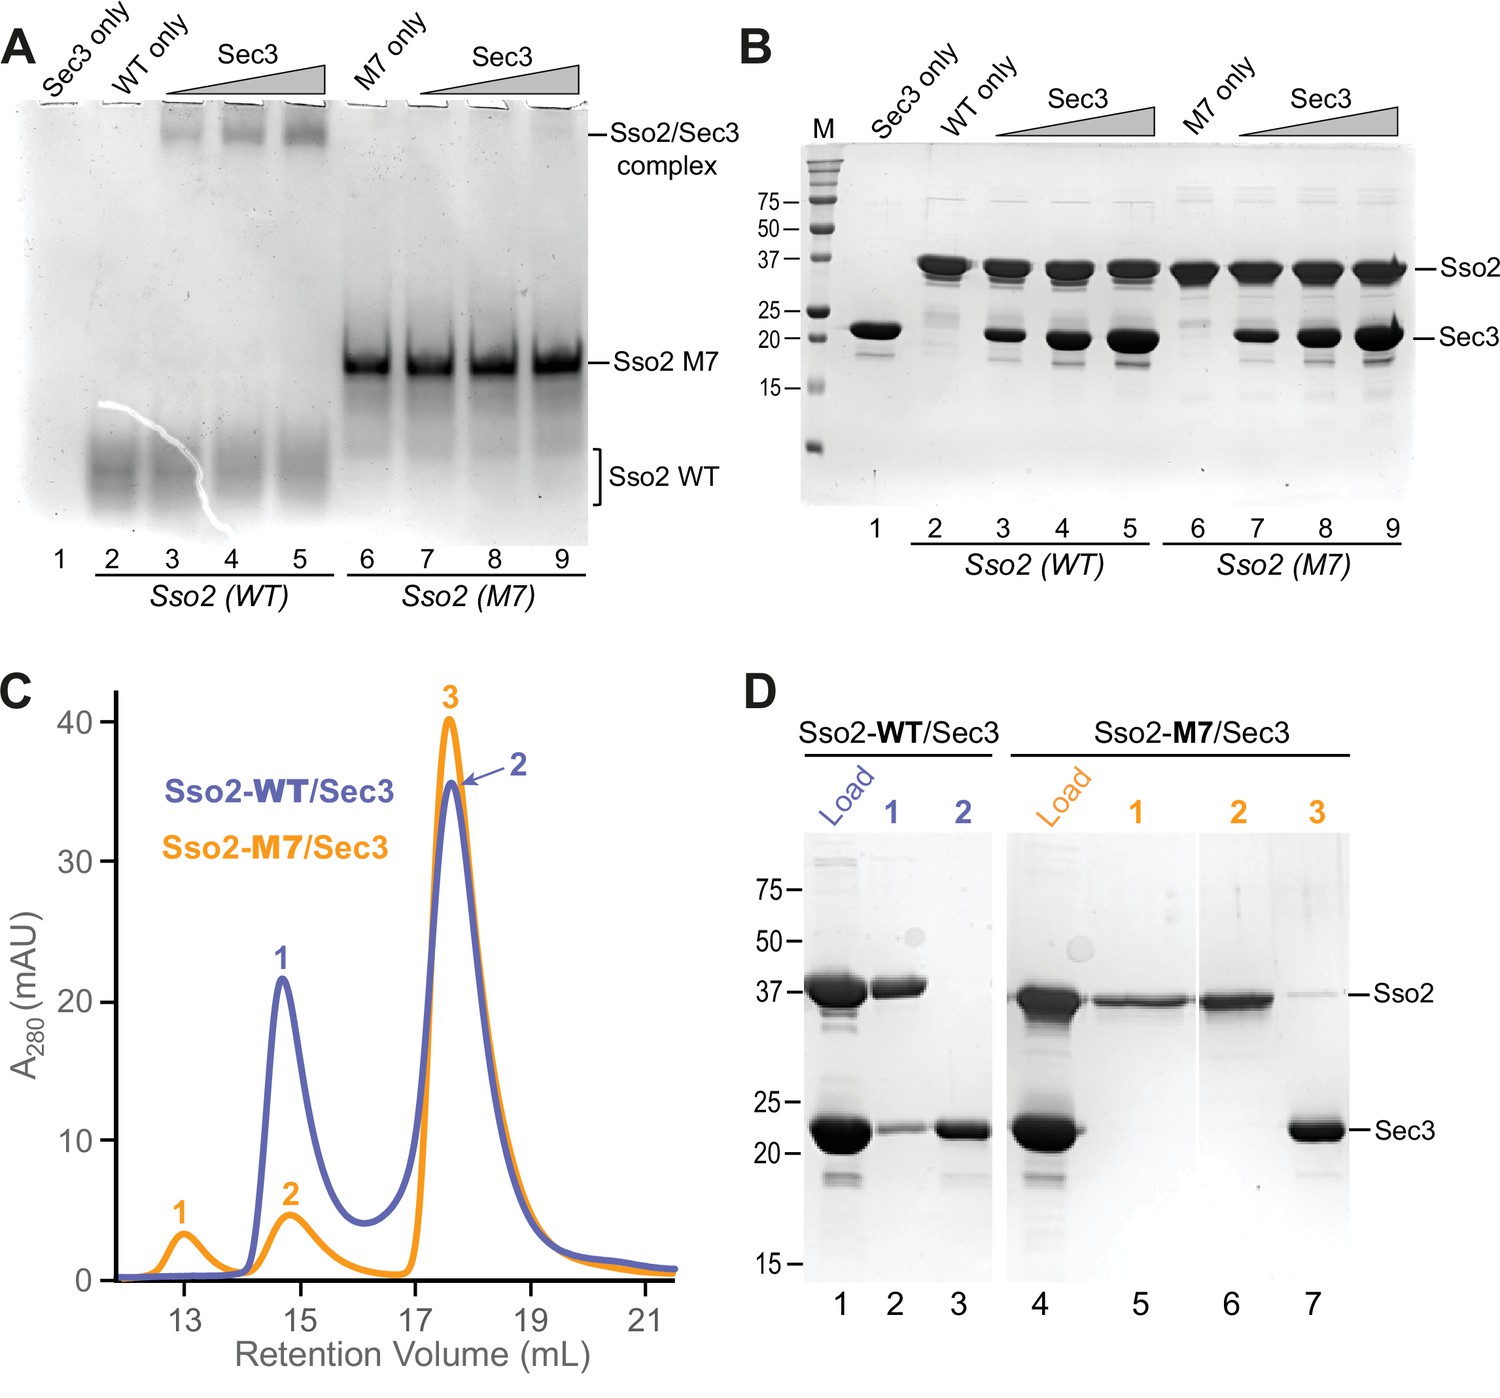
In vitro binding assays to check the interaction between Sec3 and WT or mutant M7 of Sso2.
(A) Native gel electrophoresis shows that WT Sso2 (aa1-270) interacted with the Sec3 PH domain, with the slowly migrating complex bands becoming stronger with increasing amounts of Sec3. In contrast, the M7 mutant of Sso2 (aa1-270) shows no interaction. (B) The same set of samples in (A) were checked on an SDS PAGE gel to visualize the proteins. (C) Size exclusion chromatography elution profiles of either WT (blue) or mutant M7 (orange) Sso2 (aa1-270) mixed with the Sec3 PH domain. (D) The mixtures and samples from the elution peaks in (C) were checked on an SDS PAGE gel.
Figure 8—figure supplement 2
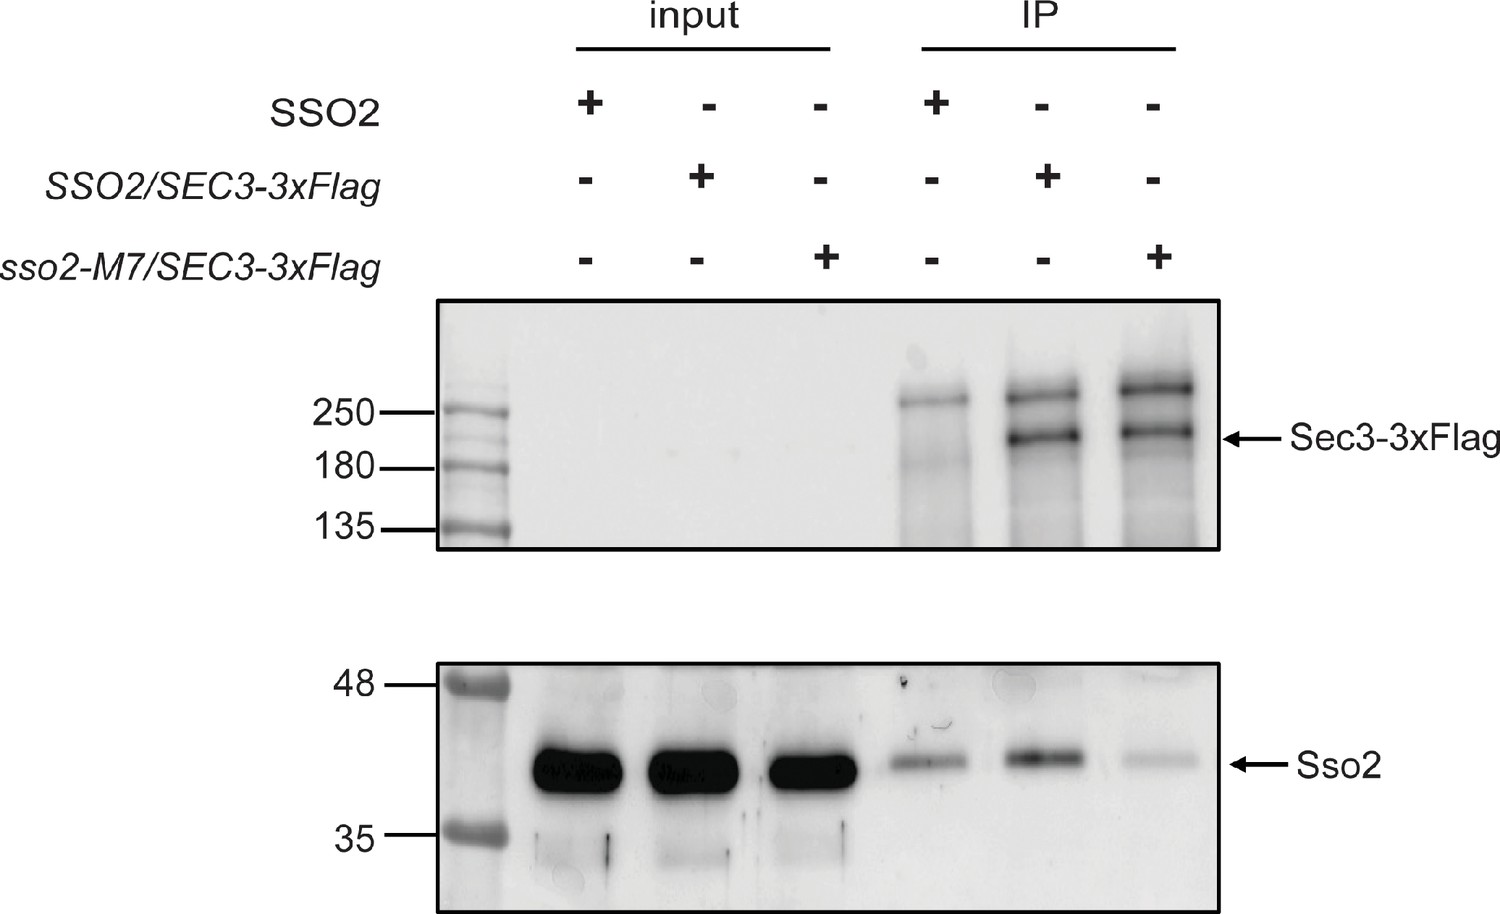
Co-immunoprecipitation of Sec3-3×Flag and Sso2 from yeast extract.
A control yeast strain expressing untagged Sec3 and Sso2 (NY3305) was grown in YPD and strains expressing Sec3-3×Flag and Sso2 (NY3447) or Sec3-3×Flag and Sso2-M7 (NY3448) were grown in SC-Leu medium at 25oC overnight to an OD600 around 1.0. Cell lysates were prepared as described in Methods section, and Sec3-3×Flag was immunoprecipitated from cell lysate with anti-Flag beads. Cell lysates and immunoprecipitated proteins (IPs) were blotted with anti-Flag antibody to detect Sec3-3×Flag (top panel) and anti-Sso antibody to detect Sso2 (bottom panel). The input was 1.7% of the lysate for Sec3-3×Flag and 0.25% for Sso2.
Figure 9 with 1 supplement
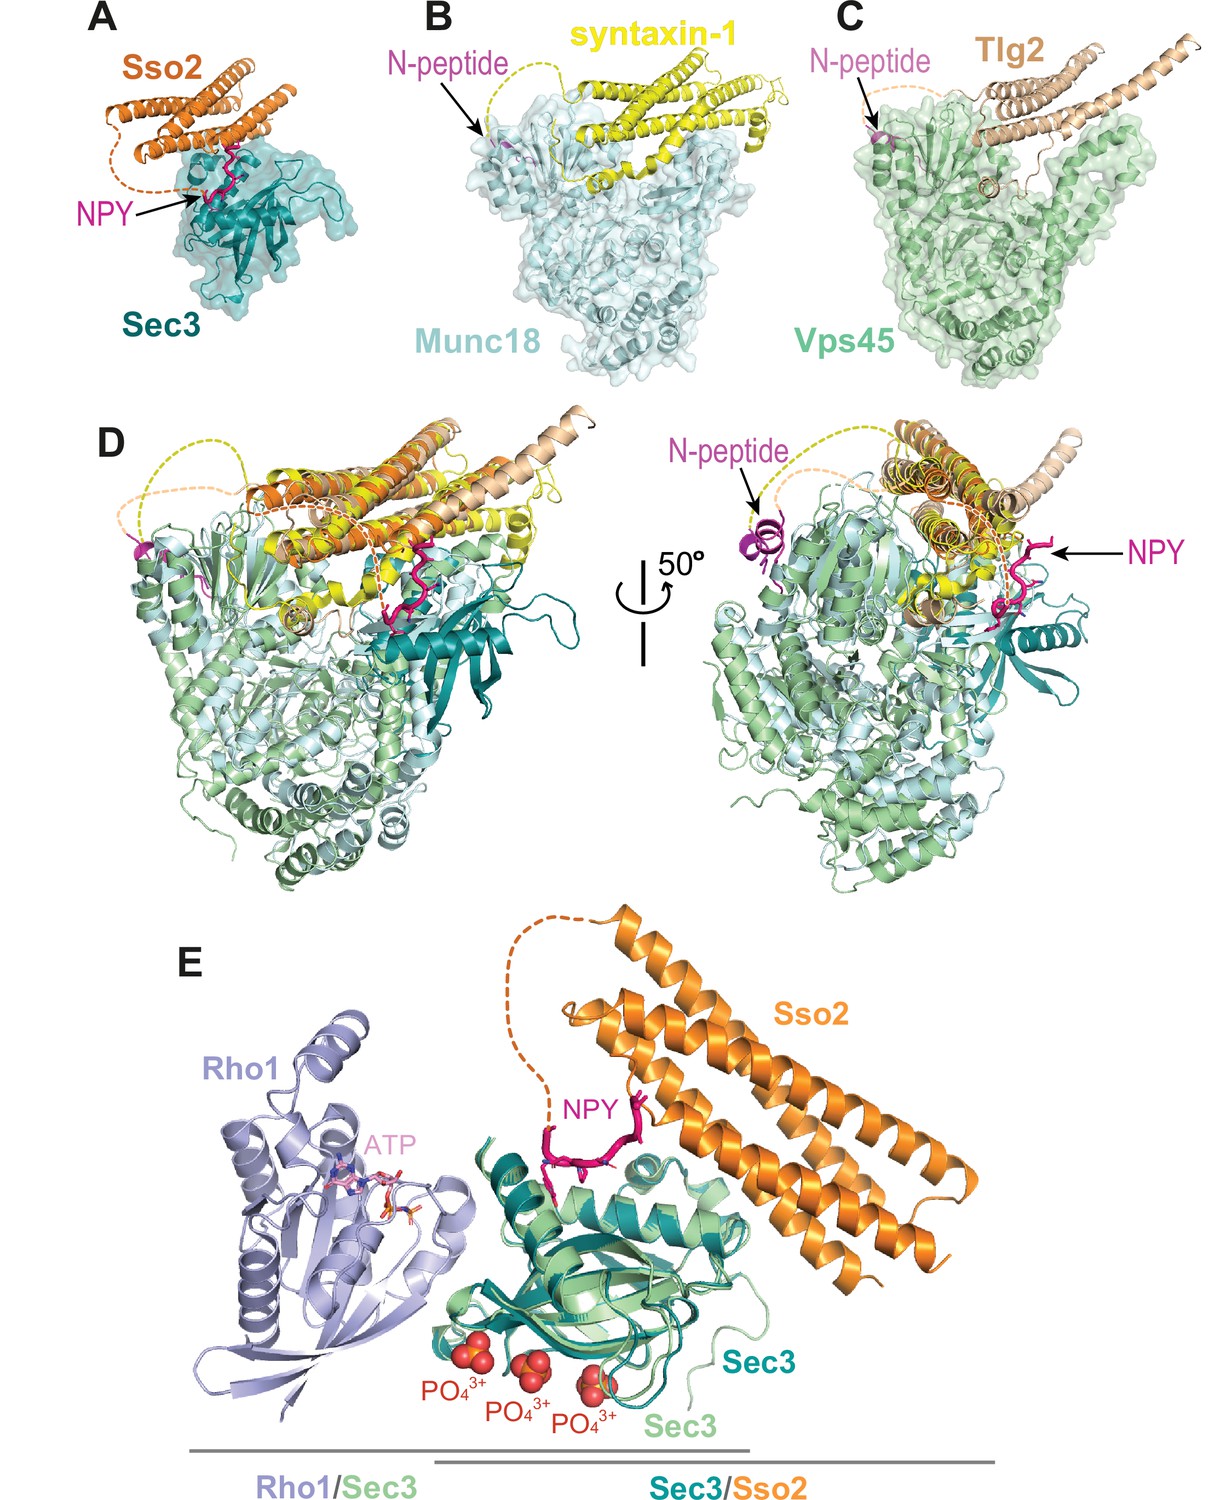
Interaction of the N-terminus of Sso2 with Sec3 in comparison with that in other syntaxin/SM protein complexes.
(A–C) Crystal structures of the complexes of Sso2/Sec3 (PDB code: 7Q83), syntaxin-1/Munc18 (PDB code: 3C98), and Tlg2/Vps45 (PDB code: 2XHE), respectively. All N-terminal extensions of these t-SANREs are indicated by arrows. (D) Superposition of the three complex structures shown in A, B, and C. (E) Superposition of the Rho1/Sec3 complex (PDB code: 3A58) with the Sec3/Sso2 complex (PDB code: 7Q83) on top of their overlapped Sec3 components.
Figure 9—figure supplement 1
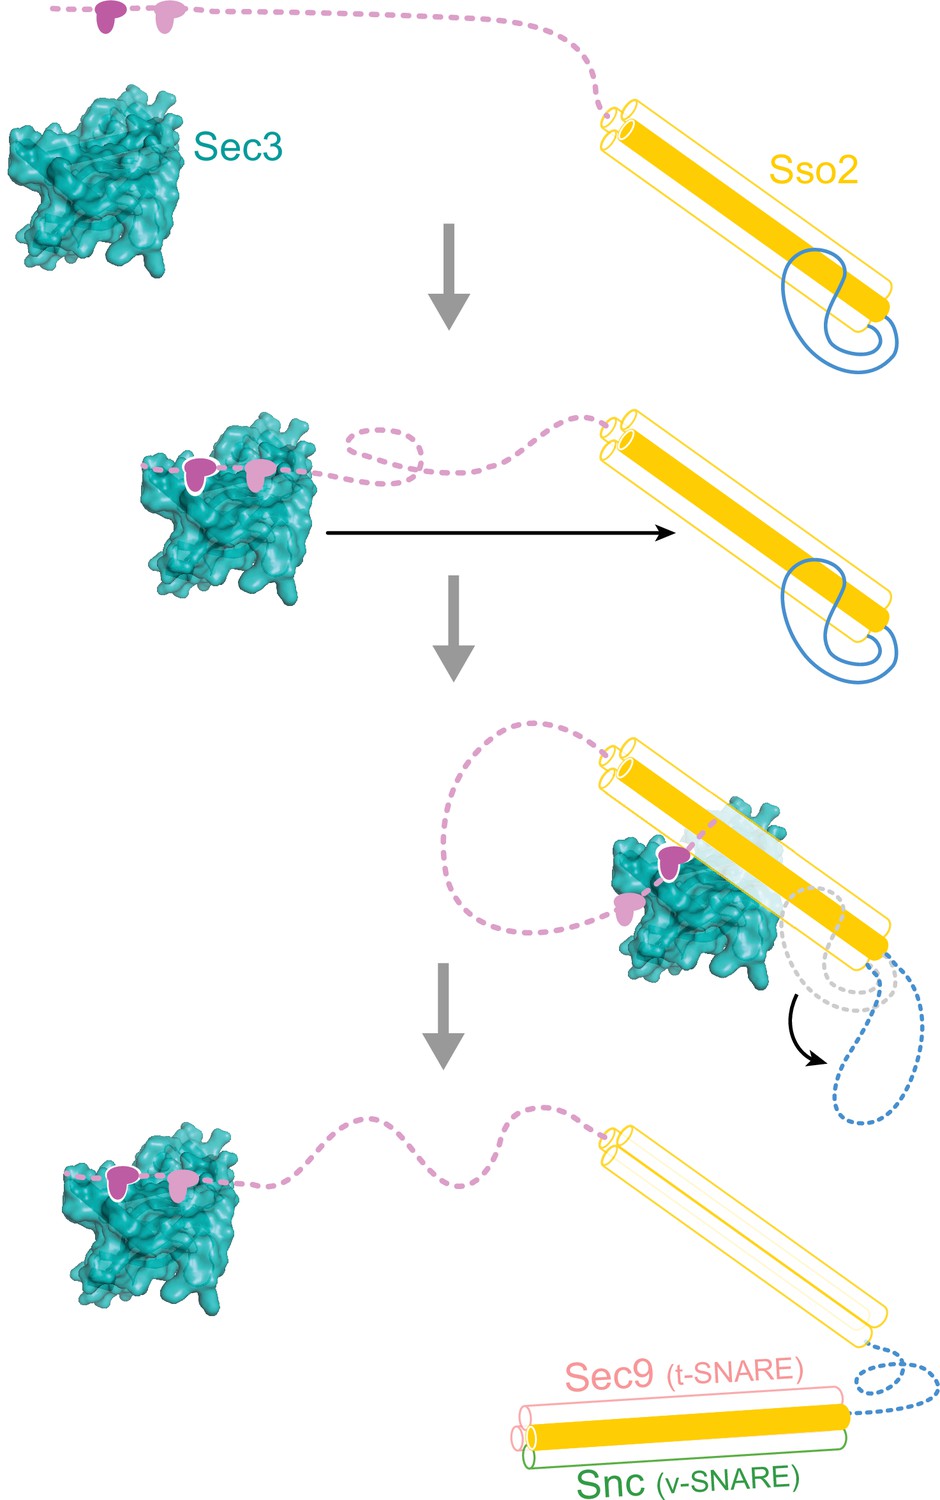
A hypothetical working model for how Sso2 recruits Sec3 in vesicle docking.
The NPY motifs at the N-terminus of Sso2 first reach out to dock into the complementary pocket on the Sec3 PH domain, which then pulls back and allows Sec3 to bind to the middle of the helical bundle of Sso2 (helices Ha, Hb and Hc are shown as semitransparent white cylinders, and H3 as an orange cylinder). Binding of Sec3 allosterically destabilizes the linker connecting Hc and H3 of Sso2 and primes downstream events in SNARE complex assembly.
Tables
Table 1
Data collection and refinement statistics.
| Wavelength (Å) | 0.9793 |
|---|---|
| Resolution range (Å) | 19.95–2.19 (2.27–2.19) |
| Space group | P1 |
| Unit cell (a, b, c; Å) (α, β, γ; °) | 50.961, 58.402, 83.286 104.284, 98.494, 113.198 |
| Total reflections | 164,051 (15,510) |
| Unique reflections | 40,853 (3771) |
| Multiplicity | 4.0 (3.9) |
| Completeness (%) | 96.08 (89.79) |
| I/σ(I) | 6.73 (1.18) |
| Wilson B-factor | 31.15 |
| R-merge | 0.1641 (1.094) |
| R-meas | 0.1894 (1.271) |
| R-pim | 0.09332 (0.636) |
| CC1/2 | 0.99 (0.438) |
| CC* | 0.997 (0.781) |
| Reflections used in refinement | 40,587 (3771) |
| Reflections used for R-free | 2008 (181) |
| R-work | 0.1990 (0.2864) |
| R-free | 0.2394 (0.3374) |
| CC(work) | 0.943 (0.699) |
| CC(free) | 0.907 (0.601) |
| Number of non-hydrogen atoms | 5837 |
| Macromolecules | 5,419 |
| Solvent | 418 |
| Protein residues | 658 |
| RMS (bonds) | 0.002 |
| RMS (angles) | 0.50 |
| Ramachandran favored (%) | 97.82 |
| Ramachandran allowed (%) | 2.18 |
| Ramachandran outliers (%) | 0.00 |
| Rotamer outliers (%) | 0.00 |
| Clashscore | 5.76 |
| Average B-factor | 40.87 |
| Macromolecules | 40.74 |
| Solvent | 42.65 |
-
Statistics for the highest-resolution shell are shown in parentheses.
Additional files
-
MDAR checklist
- https://cdn.elifesciences.org/articles/82041/elife-82041-mdarchecklist1-v2.docx
-
Supplementary file 1
Bacteria strains.
- https://cdn.elifesciences.org/articles/82041/elife-82041-supp1-v2.docx
-
Supplementary file 2
Yeast strains.
- https://cdn.elifesciences.org/articles/82041/elife-82041-supp2-v2.docx
-
Source data 1
Original SDS and native protein gels.
- https://cdn.elifesciences.org/articles/82041/elife-82041-data1-v2.zip
Download links
A two-part list of links to download the article, or parts of the article, in various formats.
Downloads (link to download the article as PDF)
Open citations (links to open the citations from this article in various online reference manager services)
Cite this article (links to download the citations from this article in formats compatible with various reference manager tools)
Double NPY motifs at the N-terminus of the yeast t-SNARE Sso2 synergistically bind Sec3 to promote membrane fusion
eLife 11:e82041.
https://doi.org/10.7554/eLife.82041


