Early myelination involves the dynamic and repetitive ensheathment of axons which resolves through a low and consistent stabilization rate
- Department of Cell and Developmental Biology, University of Colorado School of Medicine, United States
Figures
Figure 1
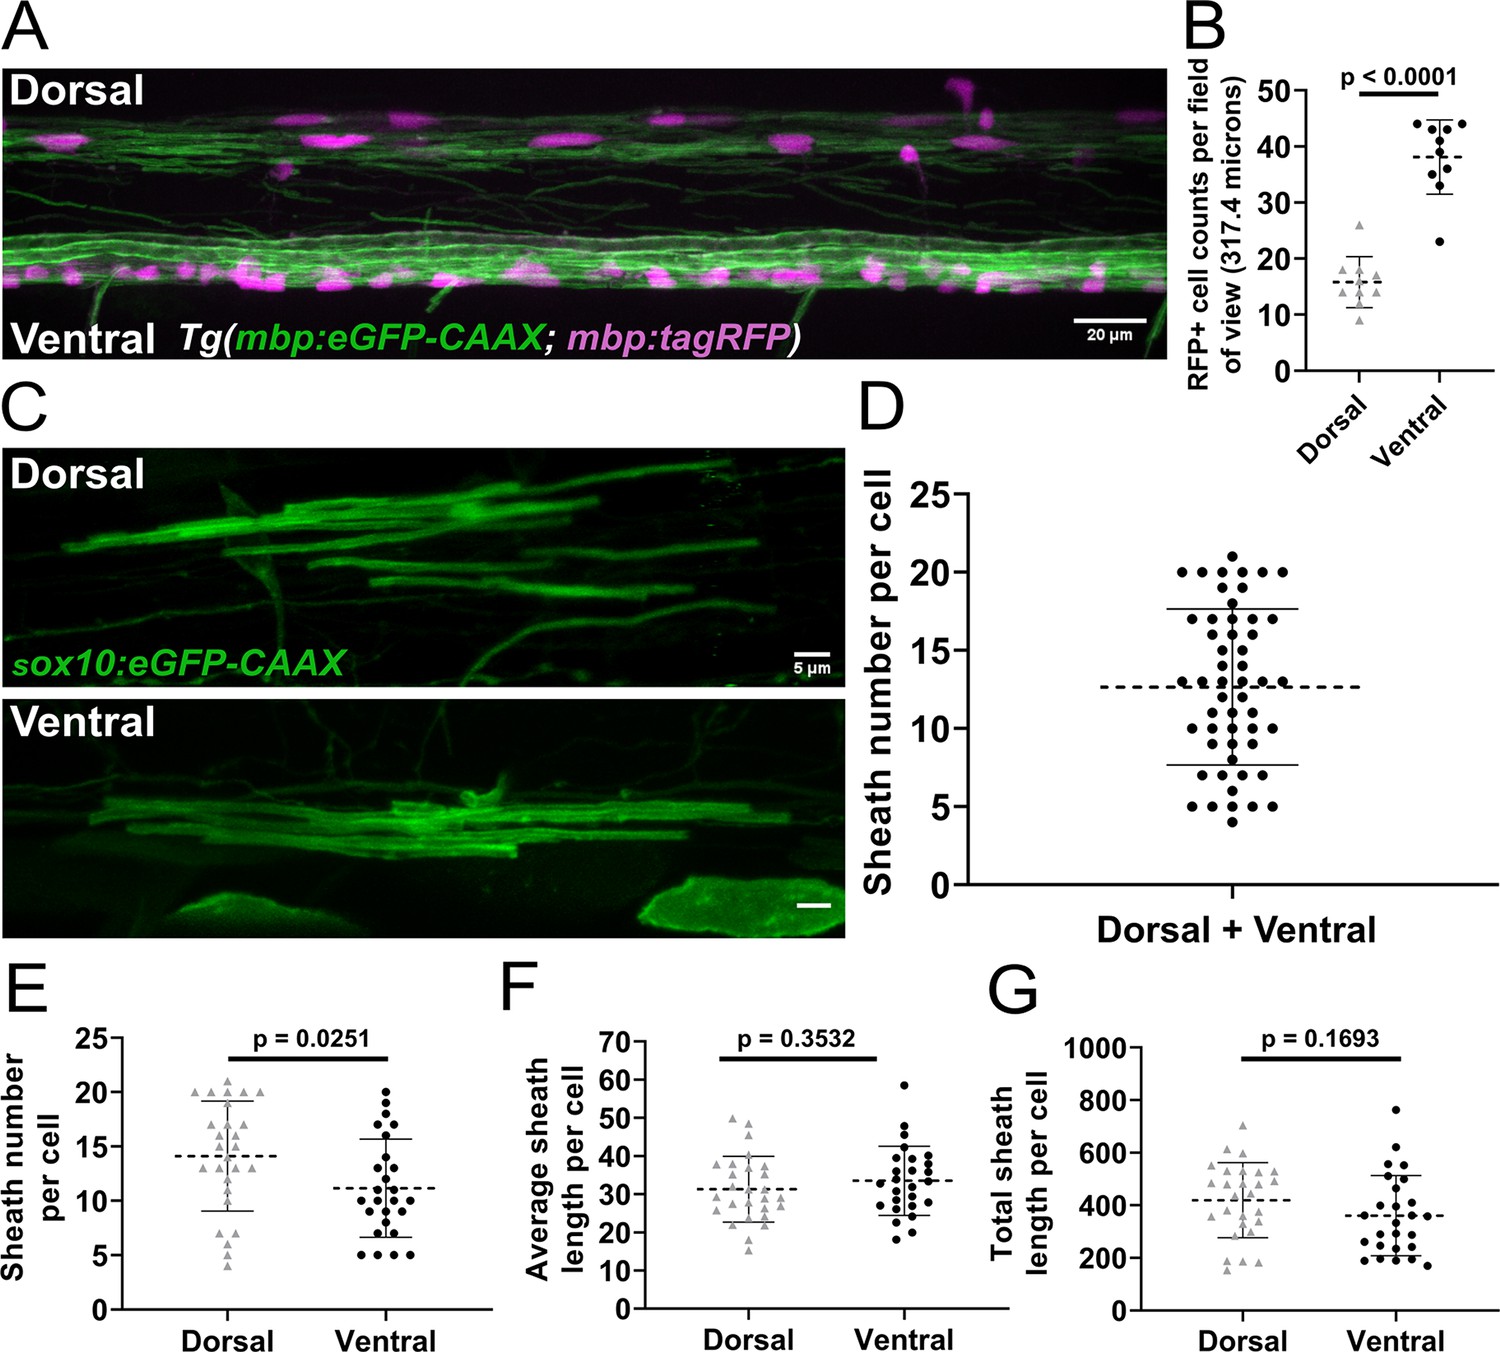
Sheath number was highly variable, but oligodendrocytes in the dorsal region of the spinal cord had more sheaths per cell than oligodendrocytes in the ventral region.
(A) Lateral image of the spinal cord of a living Tg(mbp:eGFP-CAAX; mbp:TagRFP) larva (scale bar = 20 µm). (B) RFP+ oligodendrocyte cell counts in the dorsal and ventral regions of the spinal cord per field of view (317.4 µm long). (n=10 larvae). (C) Representative lateral images of dorsal and ventral oligodendrocytes in the spinal cord of living larvae at 4 days post fertilization (dpf) labeled by sox10:eGFP-CAAX (scale bar = 5 μm). (D) Sheath number per cell, all data combined (n=53 cells/53 larvae). (E–G) Sheath number per cell (E), average sheath length per cell (F), total sheath length per cell (G), comparing the dorsal and ventral regions (dorsal n=27 cells/27 larvae, ventral n=26 cells/26 larvae). The dashed lines in each plot represent average values with all data points shown. The error bars represent standard deviation. Significance determined by Mann-Whitney tests (see associated source data).
-
Figure 1—source data 1
Excel spreadsheet with the oligodendrocyte cell counts for Figure 1B.
- https://cdn.elifesciences.org/articles/82111/elife-82111-fig1-data1-v2.xlsx
-
Figure 1—source data 2
Excel spreadsheet with the oligodendrocyte sheath and length numbers for Figure 1D–G.
- https://cdn.elifesciences.org/articles/82111/elife-82111-fig1-data2-v2.xlsx
Figure 2 with 6 supplements

Oligodendrocytes repetitively ensheathed the same axonal domains before stable sheaths were formed.
(A) Axonal ensheathment dynamics experimental paradigm. (B–C) Representative lateral images of immature ensheathments forming in the spinal cord of living Tg(nkx2.2:eGFP-CAAX) (myelin in green) larvae time-lapsed for 18 hr with a 5 min imaging interval starting at 2.5 days post fertilization (dpf). Axons were labeled with neuroD:tagRFP-CAAX (magenta). YZ images are cross sections of the axon (volume projections from Imaris). 3D reconstructions were generated in Imaris. (B) Time-lapse imaging of a stabilized ensheathment (scale bar = 2 μm). (C) Time-lapse imaging of a destabilized ensheathment (scale bar = 2 μm). (D) Representative lateral images of an axonal domain that was repetitively ensheathed four times before a sheath was stabilized. 3D reconstructions were generated in Imaris (scale bar = 2 μm). (E) Plot showing the number of times each axonal domain was ensheathed, for example, seven axonal domains had only one ensheathment attempt. Dotted red line represents the average number of ensheathment attempts. The error bar represents standard deviation (n=25 axonal domains, 18 axons, 12 larvae, 68 ensheathments imaged total). (F) Pie chart of the number of axonal domains with a final stable ensheathment and the number of ensheathment attempts that were made on each of those domains (n=14 axonal domains). (G) Pie chart of the number of destabilized axonal domains and the number of ensheathment attempts that were made on each of those domains (n=11 axonal domains) (see associated source data and supplementary video files).
-
Figure 2—source data 1
Excel spreadsheet with the repetitive ensheathment numbers and the stabilization status for each axonal domain.
- https://cdn.elifesciences.org/articles/82111/elife-82111-fig2-data1-v2.xlsx
Figure 2—video 1
Figure 2B fluorescence time-lapse video for the stabilized ensheathment example.
The video is set to play at 2 frames per second (fps). The ‘0 min’ frame is first ensheathment.
Figure 2—video 2
Figure 2B 3D reconstruction_360° rotation video for the stabilized ensheathment example.
The video is set to play at 2 frames per second (fps).
Figure 2—video 3
Figure 2C fluorescence time-lapse video for the destabilized ensheathment example.
The video is set to play at 2 frames per second (fps). The ‘0 min’ frame is first ensheathment.
Figure 2—video 4
Figure 2C 3D reconstruction_360° rotation video for the destabilized ensheathment example.
The video is set to play at 2 frames per second (fps).
Figure 2—video 5
Figure 2D fluorescence time-lapse video for the repetitive ensheathment example.
The video is set to play at 1 frame per second (fps) to allow the viewer time to see the details of each ensheathment. The ‘0 min’ frame is first ensheathment.
Figure 2—video 6
Figure 2D 3D reconstruction_360° rotation video for the repetitive ensheathment example.
The video is set to play at 2 frames per second (fps).
Figure 3 with 11 supplements
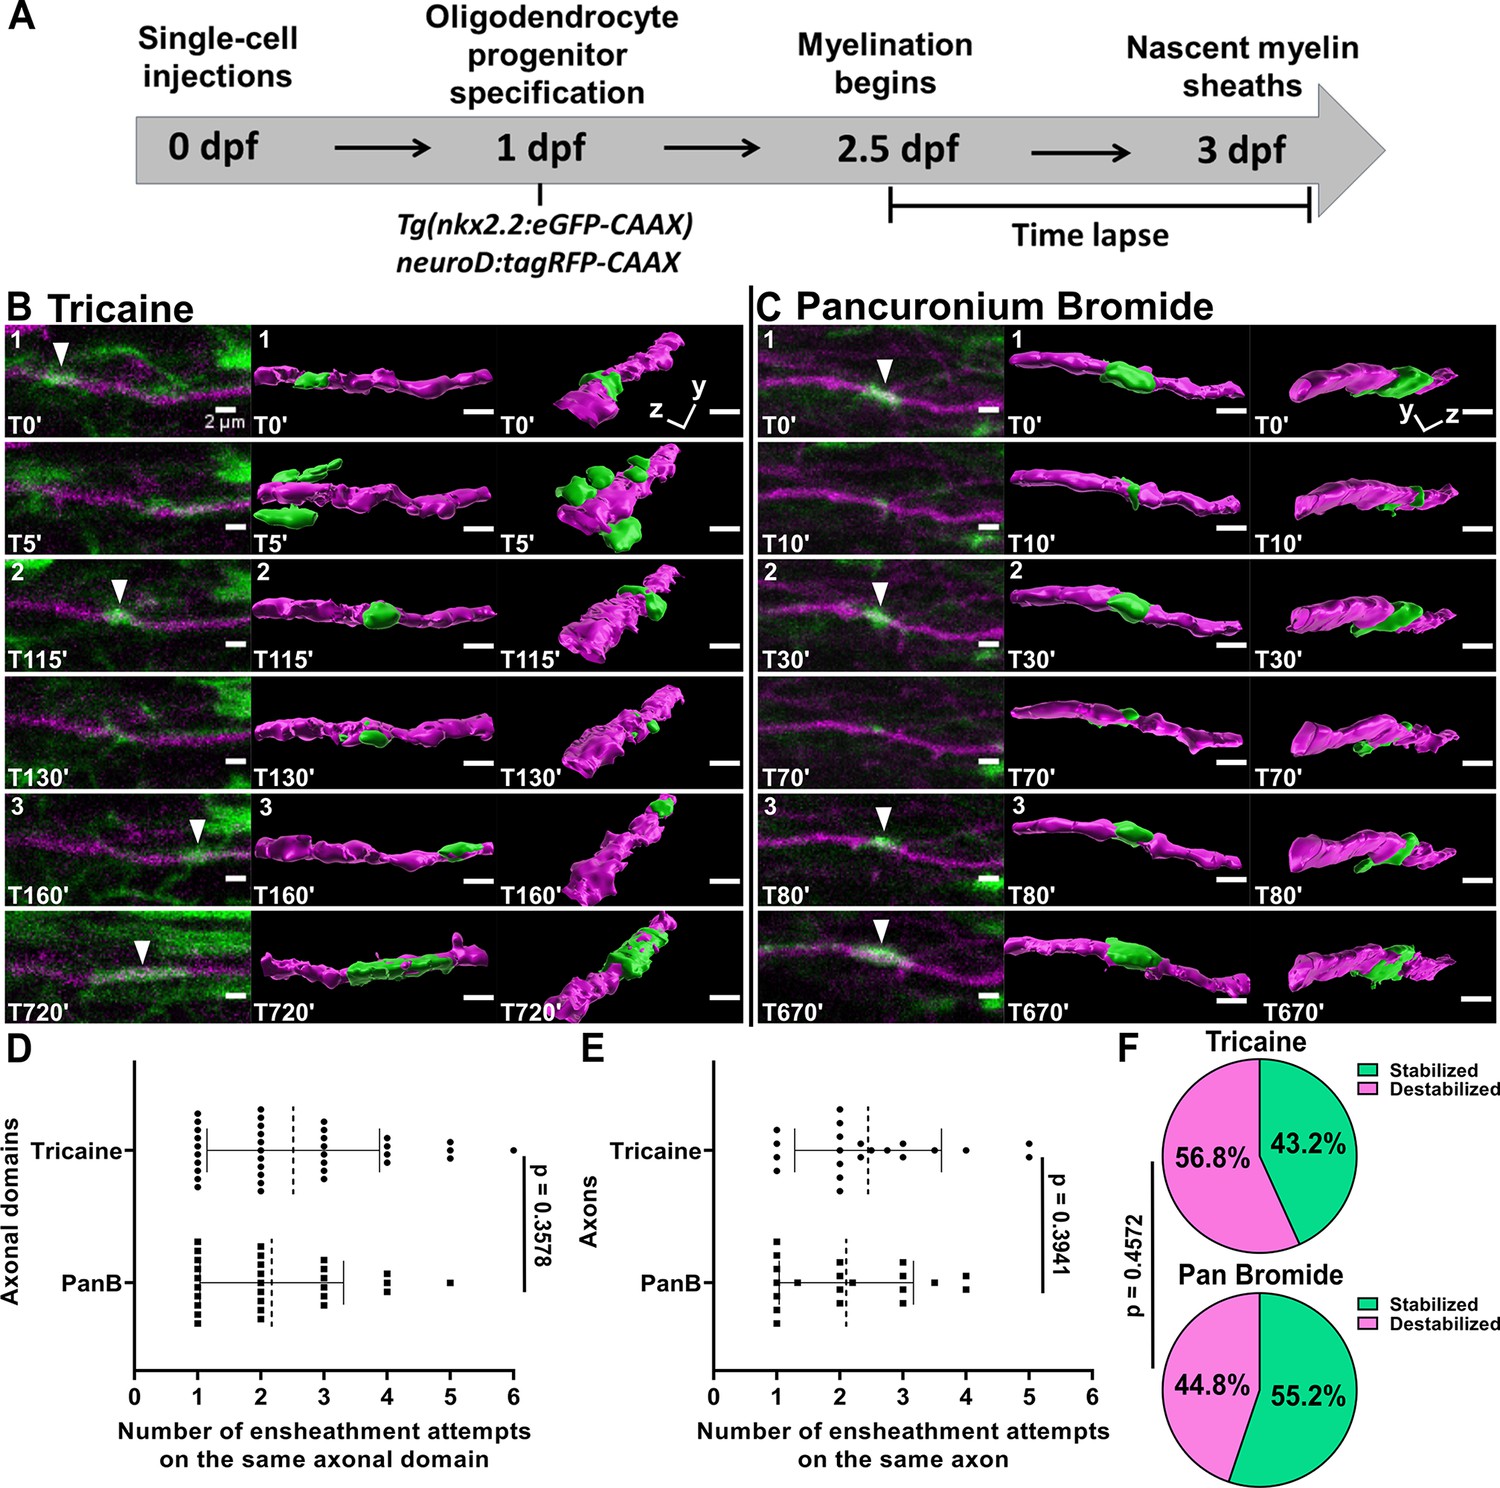
Oligodendrocytes repetitively ensheathed axons in an activity-independent manner.
(A) Axonal ensheathment dynamics experimental paradigm. (B–C) Representative lateral images of repetitive ensheathments forming in the spinal cord of living Tg(nkx2.2:eGFP-CAAX) (myelin in green) larvae time-lapsed for 18 hr with a 5 min imaging interval starting at 2.5 days post fertilization (dpf). Axons were labeled with neuroD:tagRFP-CAAX (magenta). Scale bars = 2 µm. (B) Example from larva that was anesthetized in tricaine. (C) Example of larva that was anesthetized in pancuronium bromide. (D) Plot showing the number of times each axonal domain was ensheathed for the tricaine and pancuronium bromide groups (n=37 axonal domains for tricaine, n=29 axonal domains for pancuronium bromide). (E) The same data as in (D), but normalized by axon. When more than one domain was observed on an axon, the total number of ensheathments attempts for each domain was averaged (n=21 axons for tricaine collected from 15 larvae, n=20 axons for pancuronium bromide collected from 16 larvae). For (D) and (E), the dotted lines represent the average number of ensheathment attempts for each group. The error bars represent standard deviation. (F) Pie chart of the percent of axonal domains that were stabilized vs. destabilized. The top pie chart is for the tricaine group and the bottom pie chart is for the pancuronium bromide group. Significance was determined using non-parametric Mann-Whitney tests for (D, E). Significance was determined using a Fisher’s exact test for (F) (see associated source data and supplementary video files).
-
Figure 3—source data 1
Excel spreadsheet with the repetitive ensheathment numbers and the stabilization status for each axonal domain (tricaine vs pancuronium bromide).
- https://cdn.elifesciences.org/articles/82111/elife-82111-fig3-data1-v2.xlsx
Figure 3—figure supplement 1
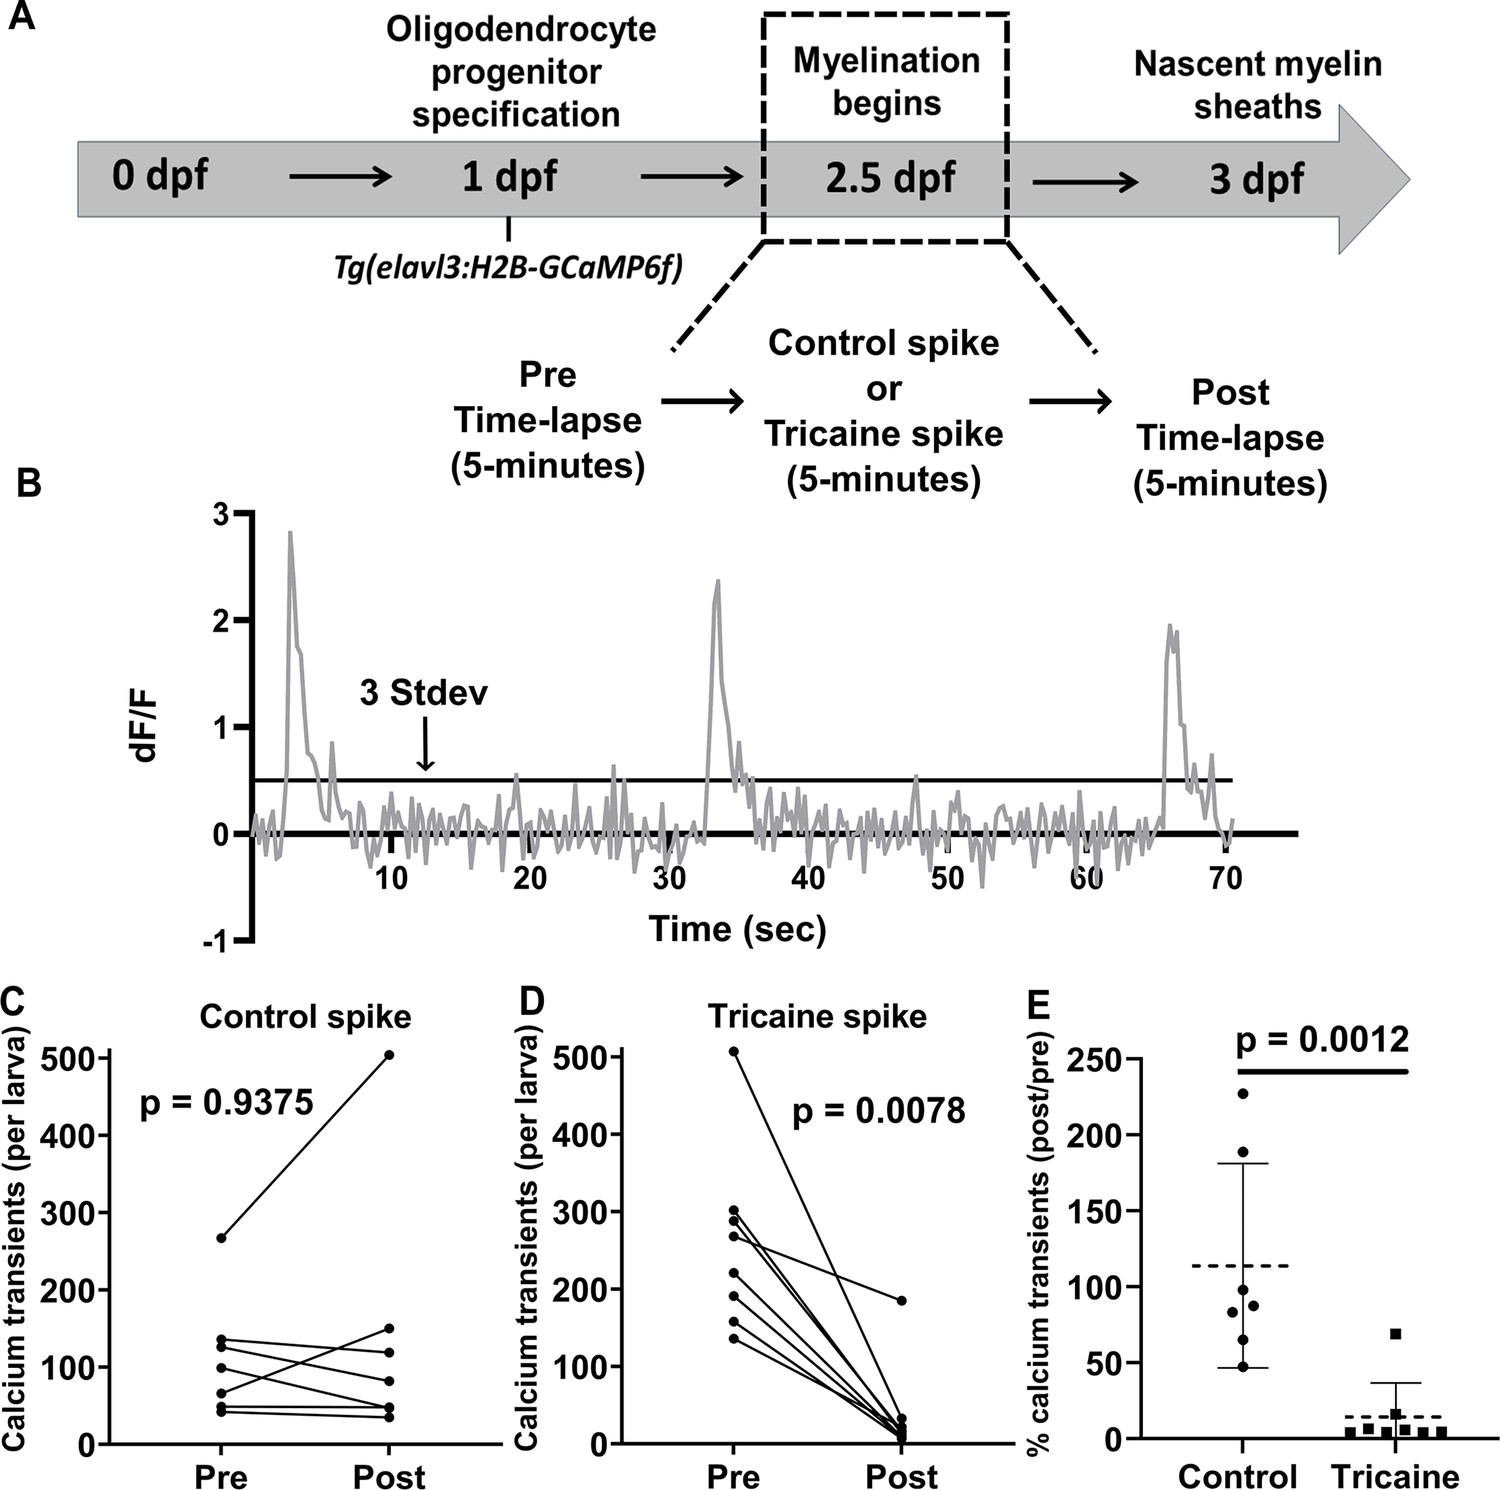
Calcium activity in neurons to compare tricaine vs pancuronium bromide forms of anesthesia.
(A) Calcium imaging experimental paradigm. (B) Example of calcium transients presented as dF/F0. (C) Comparison of the total number of calcium transients in the pre and post time-lapse videos for the control spike group. (D) Comparison of the total number of calcium transients in the pre and post time-lapse videos for the tricaine spike group. (E) Comparison of the percentage of calcium transients in the post/pre time-lapse videos between the control spike and tricaine spike groups. The dotted line in (E) represents the average percentage of post/pre calcium transients. The error bars for (E) is standard deviation. Control spike group n = 7 larvae. Tricaine spike group n = 8 larvae. Non-parametric Wilcoxon matched-pairs signed rank tests were used to test for significance in C and D. A non-parametric Mann-Whitney test was used to test for significance in E. (See associated source data and supplementary video files).
-
Figure 3—figure supplement 1—source data 1
Excel spreadsheet with the summary of the calcium transient counts.
- https://cdn.elifesciences.org/articles/82111/elife-82111-fig3-figsupp1-data1-v2.xlsx
Figure 3—figure supplement 2
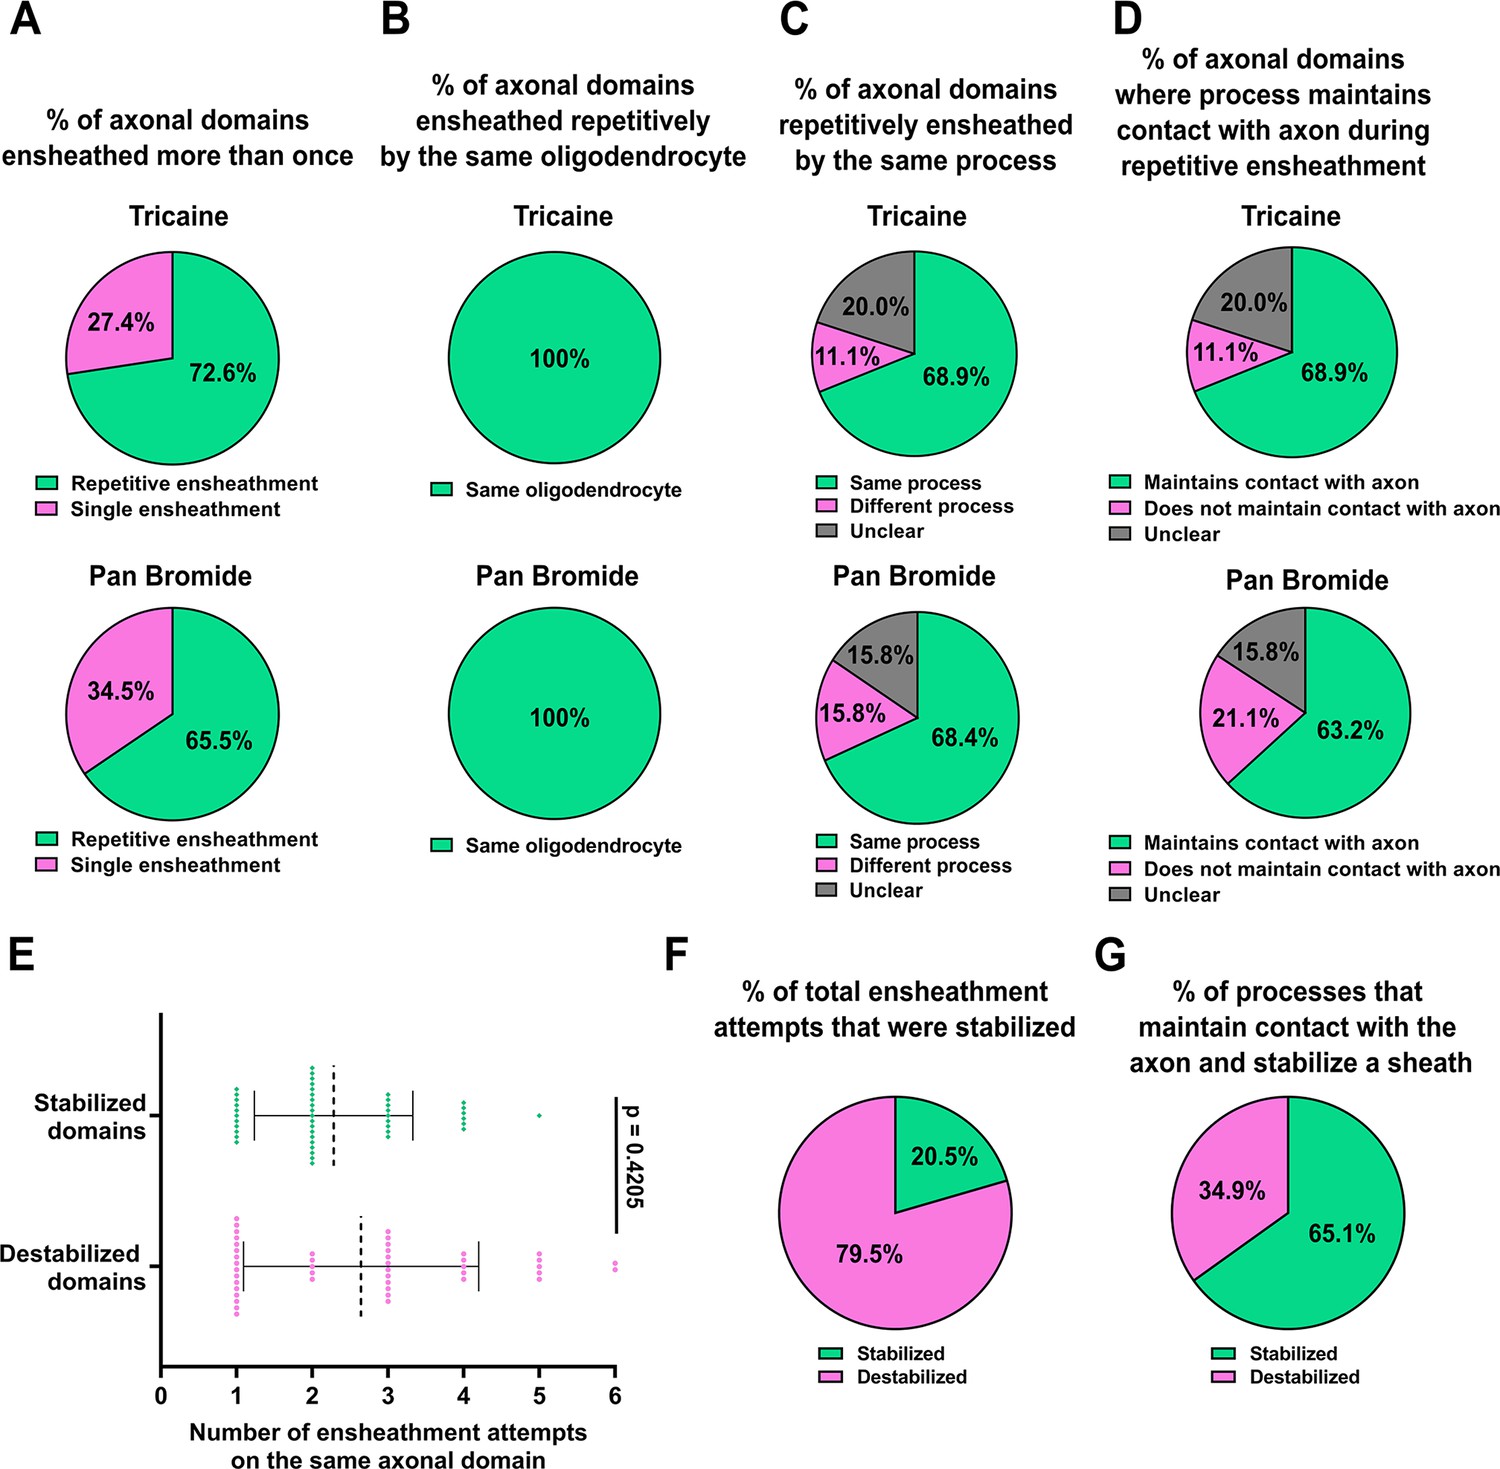
Summary of oligodendrocyte behavior during the repetitive ensheathment of axons.
(A) Pie charts comparing the percent of axonal domains that were ensheathed a single time vs repetitively (more than once). Tricaine n=62 total domains (data from Figures 2 and 3 are combined). Pancuronium bromide n=29 total domains. (B) Pie charts comparing the percent of repetitively ensheathed axonal domains where each ensheathment came from the same oligodendrocyte. Tricaine n=45 total domains (data from Figures 2 and 3 are combined). Pancuronium bromide n=19 total domains. (C) Pie charts comparing the percent of repetitively ensheathed axonal domains where the same process extending from each oligodendrocyte is responsible for each ensheathment. Tricaine n=45 total domains (data from Figures 2 and 3 are combined). Pancuronium bromide n=19 total domains. (D) Pie charts comparing the percent of repetitively ensheathed axonal domains where the process extending from each oligodendrocyte seems to maintain contact with the axon. Tricaine n=45 total domains (data from Figures 2 and 3 are combined). Pancuronium bromide n=19 total domains. (E) Number of ensheathment attempts made on each axonal domain that ends up stabilized or destabilized. The dotted lines represent the average number of ensheathment attempts for each group. The error bars are standard deviation. Stabilized n=46 domains, destabilized n=45 domains (tricaine and pancuronium bromide groups are combined from Figures 2 and 3 here). Significance was determined using a non-parametric Mann-Whitney test for (E). (F) Pie chart showing the overall stabilization rate as determined by dividing the number of stabilized axonal domains (n=46) by the total number of ensheathment attempts (n=224) (tricaine and pancuronium bromide groups are combined from Figures 2 and 3 here). (G) Pie chart showing the percentage of instances where the process maintains contact with axon during repetitive ensheathment and it results in a stabilized sheath. n=43 total domains (tricaine and pancuronium bromide groups are combined from Figures 2 and 3 here) (see associated source data).
-
Figure 3—figure supplement 2—source data 1
Excel spreadsheet with a summary of the repetitive ensheathment numbers for Figures 2 and 3.
- https://cdn.elifesciences.org/articles/82111/elife-82111-fig3-figsupp2-data1-v2.xlsx
Figure 3—figure supplement 3
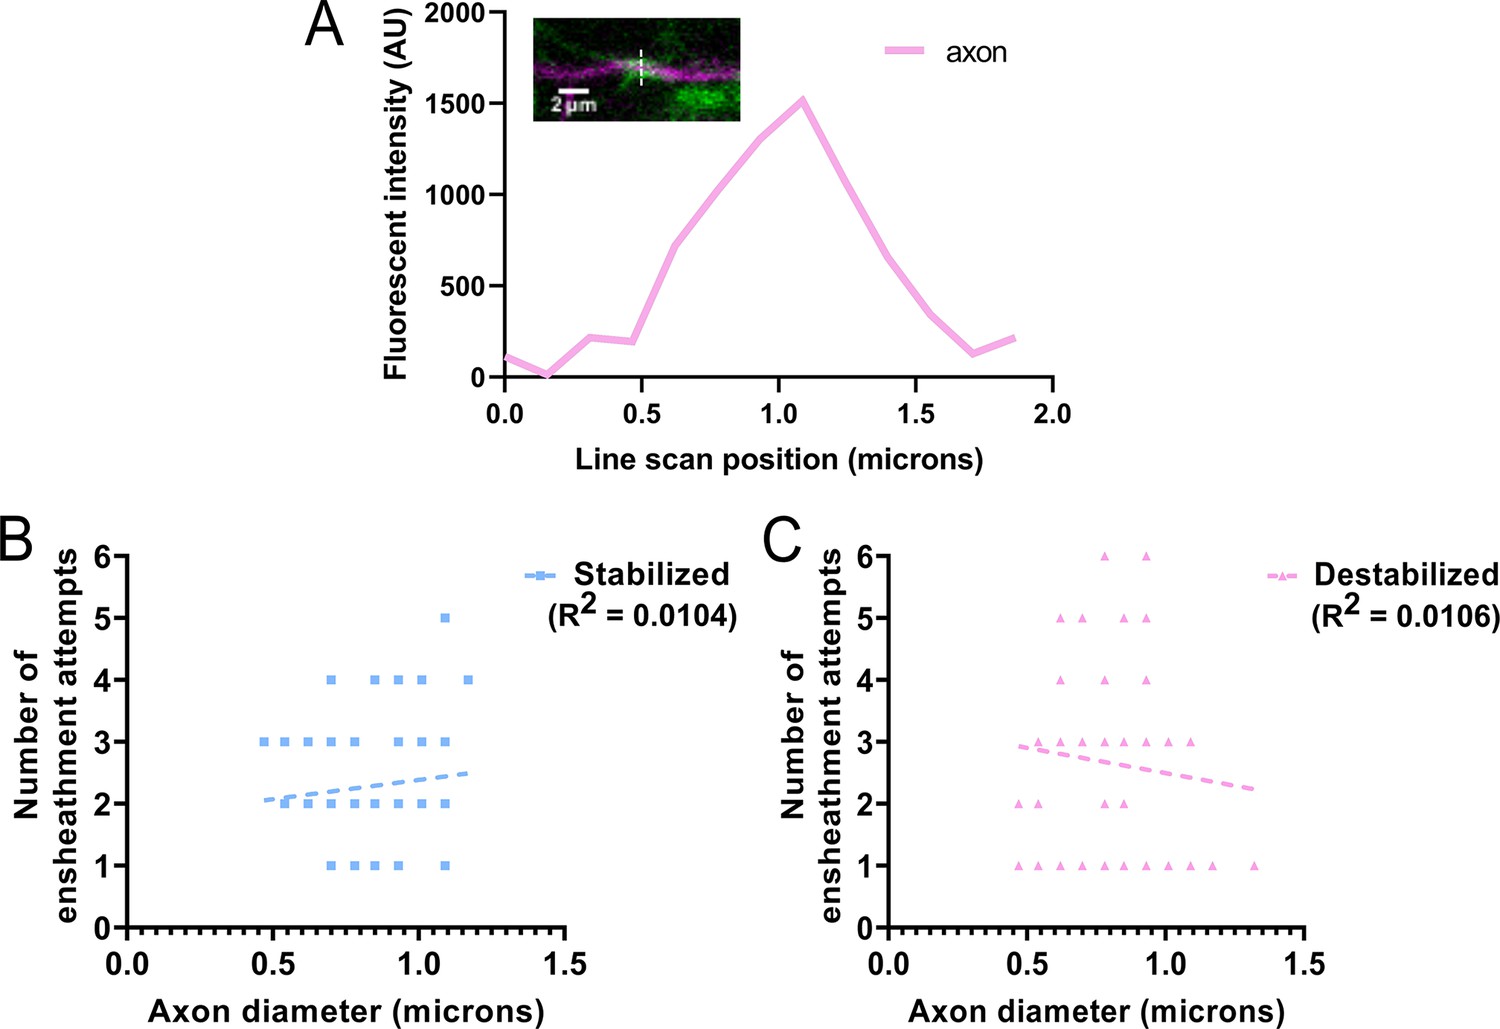
Axon diameter was not related to the number of ensheathment attempts made on each domain.
(A) Example of a line scan measurement of the ensheathment from Figure 2B, T5’ panel. Plot is the fluorescence intensity of the axon from the line scan in the image. (B) Simple linear regression comparing the full-width 1/3 max diameter measurements of each stabilized axonal domain compared to the number of times each domain was ensheathed. There are only 27 of 46 data points visible on this plot due to overlap in the same x, y positions. Dashed line shows regression. (C) Simple linear regression comparing the full-width 1/3 max diameter measurements of each destabilized axonal domain compared to the number of times each domain was ensheathed. There are only 32 of 45 data points visible on this plot due to overlap in the same x, y positions. Dashed line shows regression. The R2 values for each group are shown. All data from Figures 2 and 3 were combined for this analysis. This includes combining the tricaine and pancuronium bromide groups in Figure 3 (n=91 total axonal domains) (see associated source data).
-
Figure 3—figure supplement 3—source data 1
Excel spreadsheet with the axon diameter measurements for the repetitive ensheathment data in Figures 2 and 3.
- https://cdn.elifesciences.org/articles/82111/elife-82111-fig3-figsupp3-data1-v2.xlsx
Figure 3—video 1
Figure 3B fluorescence time-lapse video for the tricaine repetitive ensheathment example.
The video is set to play at 1 frame per second (fps) to allow the viewer time to see the details of each ensheathment. The ‘0 min’ frame is first ensheathment.
Figure 3—video 2
Figure 3B 3D reconstruction_360° rotation video for the tricaine repetitive ensheathment example.
The video is set to play at 2 frames per second (fps).
Figure 3—video 3
Figure 3C fluorescence time-lapse video for the pancuronium bromide repetitive ensheathment example.
The video is set to play at 1 frame per second (fps) to allow the viewer time to see the details of each ensheathment. The ‘0 min’ frame is first ensheathment.
Figure 3—video 4
Figure 3C 3D reconstruction_360° rotation video for the pancuronium bromide repetitive ensheathment example.
The video is set to play at 2 frames per second (fps).
Figure 3—video 5
Fluorescence time-lapse video example for the pre-spike control condition.
The ‘despeckle’ filter in Fiji was applied to this video to remove salt and pepper noise. The video is set to play at 50 frames per second (fps).
Figure 3—video 6
Fluorescence time-lapse video example for the corresponding post-spike control condition.
The ‘despeckle’ filter in Fiji was applied to this video to remove salt-and-pepper noise. The video is set to play at 50 frames per second (fps).
Figure 3—video 7
Fluorescence time-lapse video example for the pre-tricaine spike condition.
The ‘despeckle’ filter in Fiji was applied to this video to remove salt-and-pepper noise. The video is set to play at 50 frames per second (fps).
Figure 3—video 8
Fluorescence time-lapse video example for the corresponding post-tricaine spike condition.
The ‘despeckle’ filter in Fiji was applied to this video to remove salt-and-pepper noise. The video is set to play at 50 frames per second (fps).
Figure 4 with 4 supplements
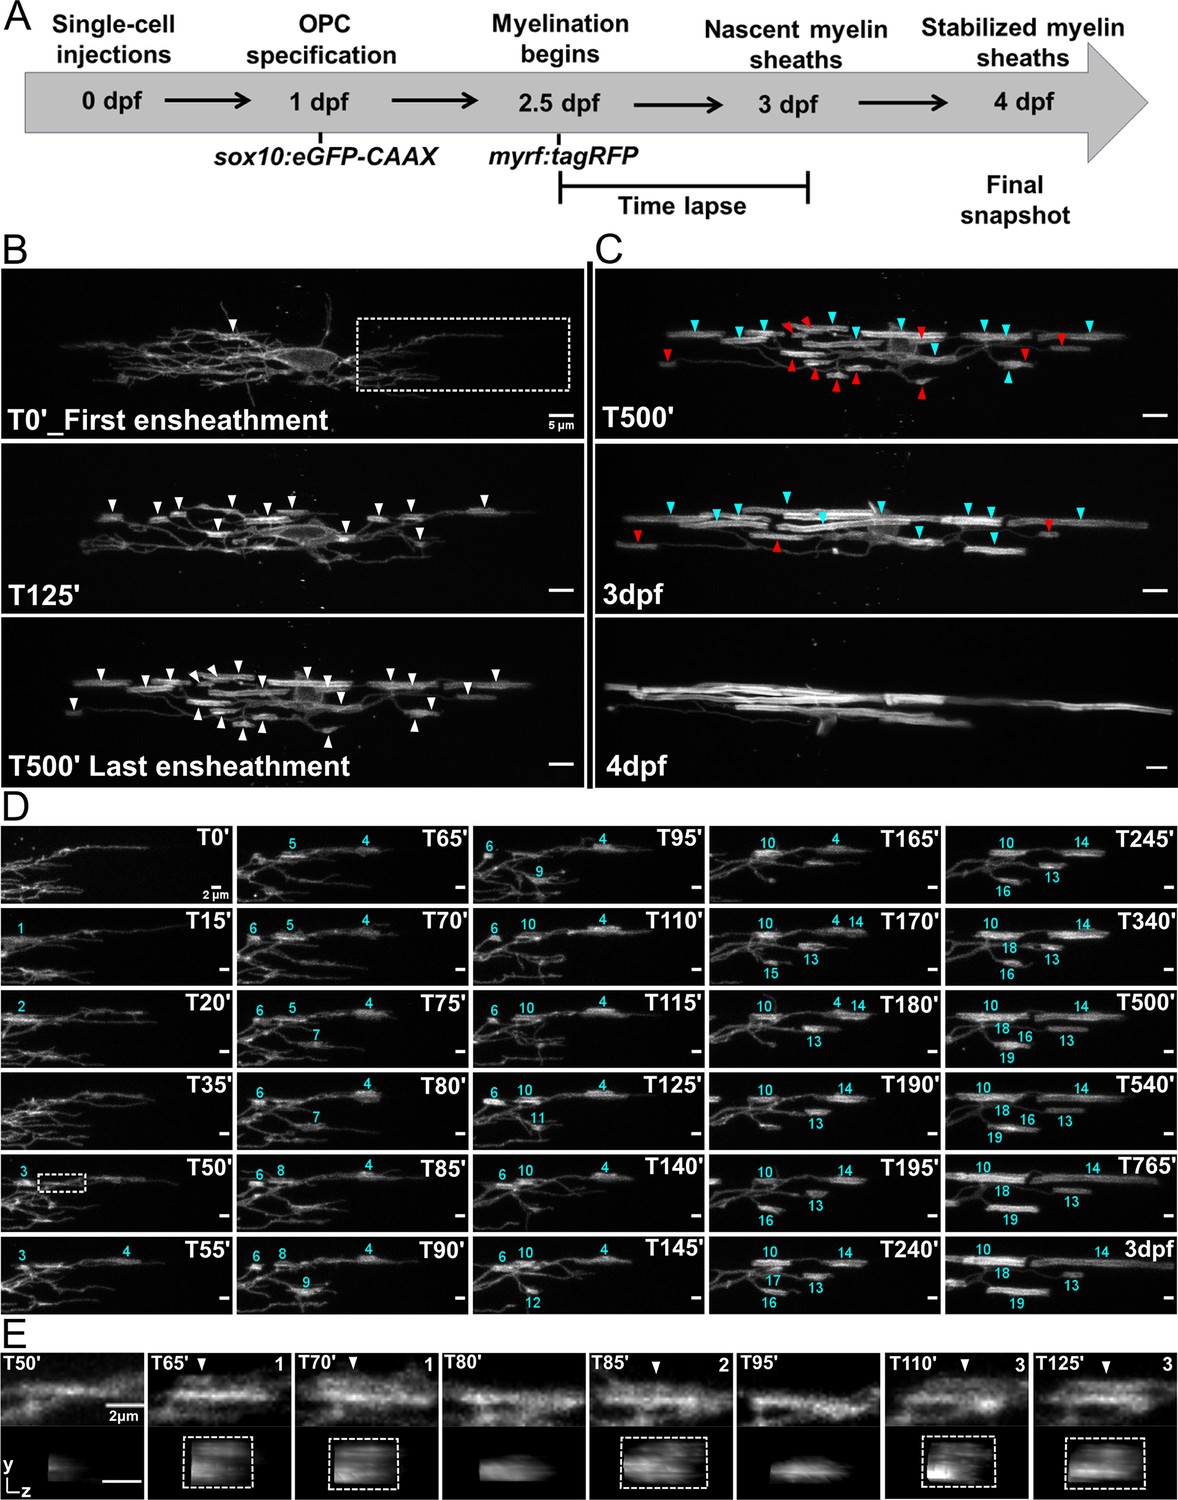
Oligodendrocyte nascent sheath accumulation involved extensive sheath initiation and loss.
(A) Oligodendrocyte ensheathment dynamics imaging paradigm. (B–E) Lateral images of oligodendrocyte ensheathment dynamics in the spinal cord of living larvae labeled with sox10:eGFP-CAAX and time-lapsed for 15 hours with a 5-minute imaging interval from 2.5-3dpf. (B) Images show the progression of immature sheath accumulation from the first ensheathment attempt in the first panel (set at T0’) to the final ensheathment at T500’ in the bottom panel. Outlined region in first panel is analyzed further in Figure D and E. White arrows identify all immature ensheathments in each frame. (Scale bar = 5 μm). (C) Images showing sheath loss during the stabilization phase. T500’ image is presented again in the top panel and is relabeled to identify future stabilized (cyan) or destabilized (red) ensheathments. This oligodendrocyte has 22 immature sheaths at T500’, 11 of which disappeared, and it has 11 stabilized sheaths at 4dpf in the final panel (Figure 4—figure supplement 2). (Scale bar = 5 μm). (D) Images of the outlined region in the first panel of B visualizing frequent sheath initiation and loss. Each ensheathment is represented with the numbers 1-19 to signify the order that each one appears. The numbers disappear when an ensheathment is lost. Only 5 ensheathment attempts were stabilized out of a total of 19. (Scale bar = 2 μm) (E) Further enlarged images of the outlined region in Figure D (T50’). White arrows point out 3 ensheathment attempts before the final one was stabilized. The YZ images are cross sections of each ensheathment (volume projections in Imaris). A box is drawn around each cylindrical ensheathment in the YZ images. (Scale bar = 2 μm). (See associated source data and supplementary video files).
Figure 4—figure supplement 1
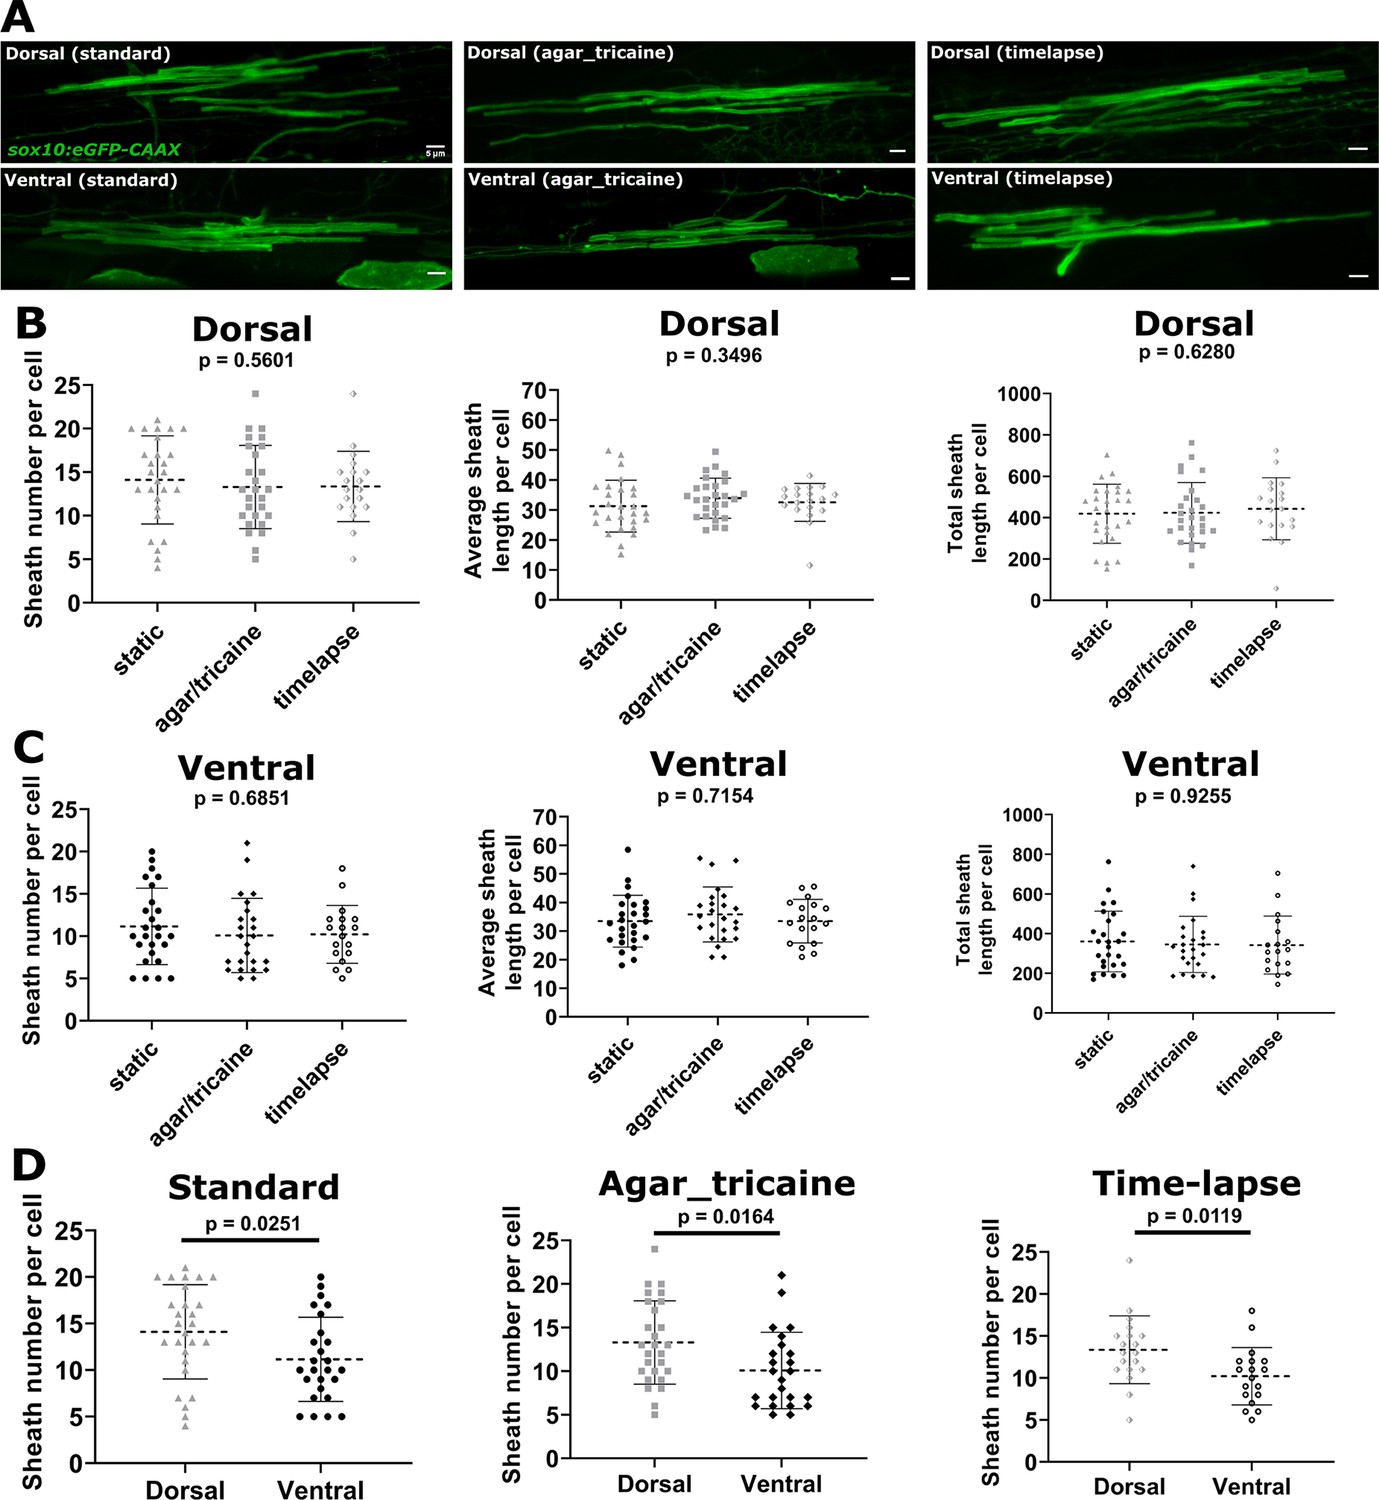
Ensheathment dynamics imaging conditions did not significantly alter sheath number or length.
(A) Representative lateral images of dorsal and ventral oligodendrocytes for each of three testing groups (standard, agar_tricaine, time-lapse) in the spinal cord of living larvae at 4 days post fertilization (dpf) labeled by sox10:eGFP-CAAX (myelin in green). The images and data for the standard group are the same as in Figure 1 (scale bar = 5 μm). (B) Sheath number per cell, average sheath length per cell, total sheath length per cell from left to right for all dorsal data sets. (C) Sheath number per cell, average sheath length per cell, total sheath length per cell from left to right for all ventral data sets. (D) Sheath number per cell comparing the dorsal and ventral populations within each testing group. Standard: dorsal n=27 cells/27 larvae, ventral n=26 cells/26 larvae; agar_tricaine: dorsal n=24 cells/24 larvae, ventral n=25 cells/25 larvae; time-lapse: dorsal n=19 cells/19 larvae, ventral n=18 cells/18 larvae. The dashed lines in each plot represent average values with all data points shown. The error bars are standard deviation. Significance determined by Kruskal-Wallis test for (B, C). Global p-values are presented for each of these plots. Post hoc multiple comparisons tests were not performed since the global p-values were not significant. Mann-Whitney tests were performed for (D) (see associated source data).
-
Figure 4—figure supplement 1—source data 1
Excel spreadsheet with the sheath analysis data comparing the standard condition, tricaine and agar condition, and the time-lapse condition.
- https://cdn.elifesciences.org/articles/82111/elife-82111-fig4-figsupp1-data1-v2.xlsx
Figure 4—figure supplement 2
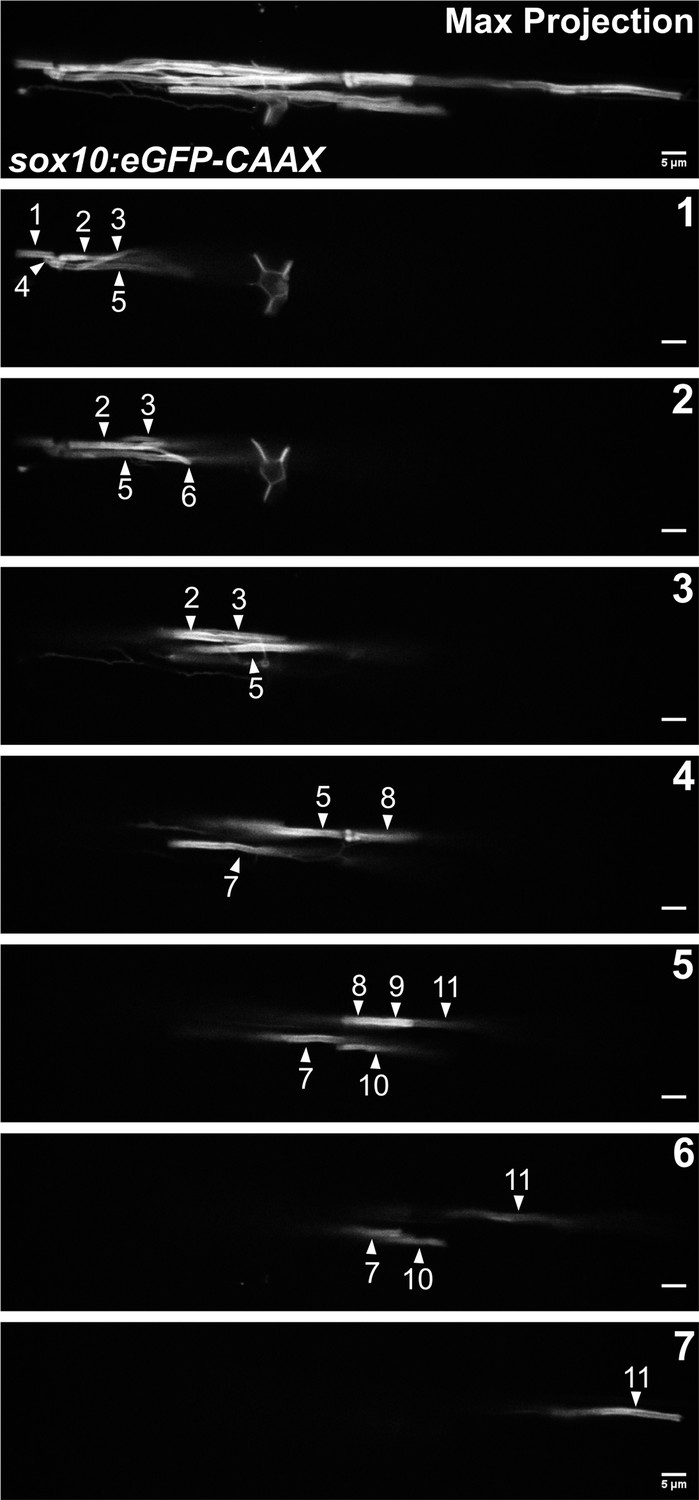
Visual quantification of sheath number at 4 days post fertilization (dpf) for the representative cell in Figure 4C.
Lateral images of an oligodendrocyte in the spinal cord of living larvae labeled with sox10:eGFP-CAAX at 4 dpf. The first panel is a max projection image of the entire cell. Each subsequent panel is a single optical section labeled 1–7. White arrows are pointing out 11 different sheaths (scale bar = 5 μm).
Figure 4—video 1
Figure 4B and C fluorescence time-lapse video for the oligodendrocyte ensheathment dynamics example.
The video is set to play at 2 frames per second (fps). The ‘0 min’ frame is the start of ensheathment.
Figure 4—video 2
Figure 4D fluorescence time-lapse video for inset panel in 4B.
Figure 5
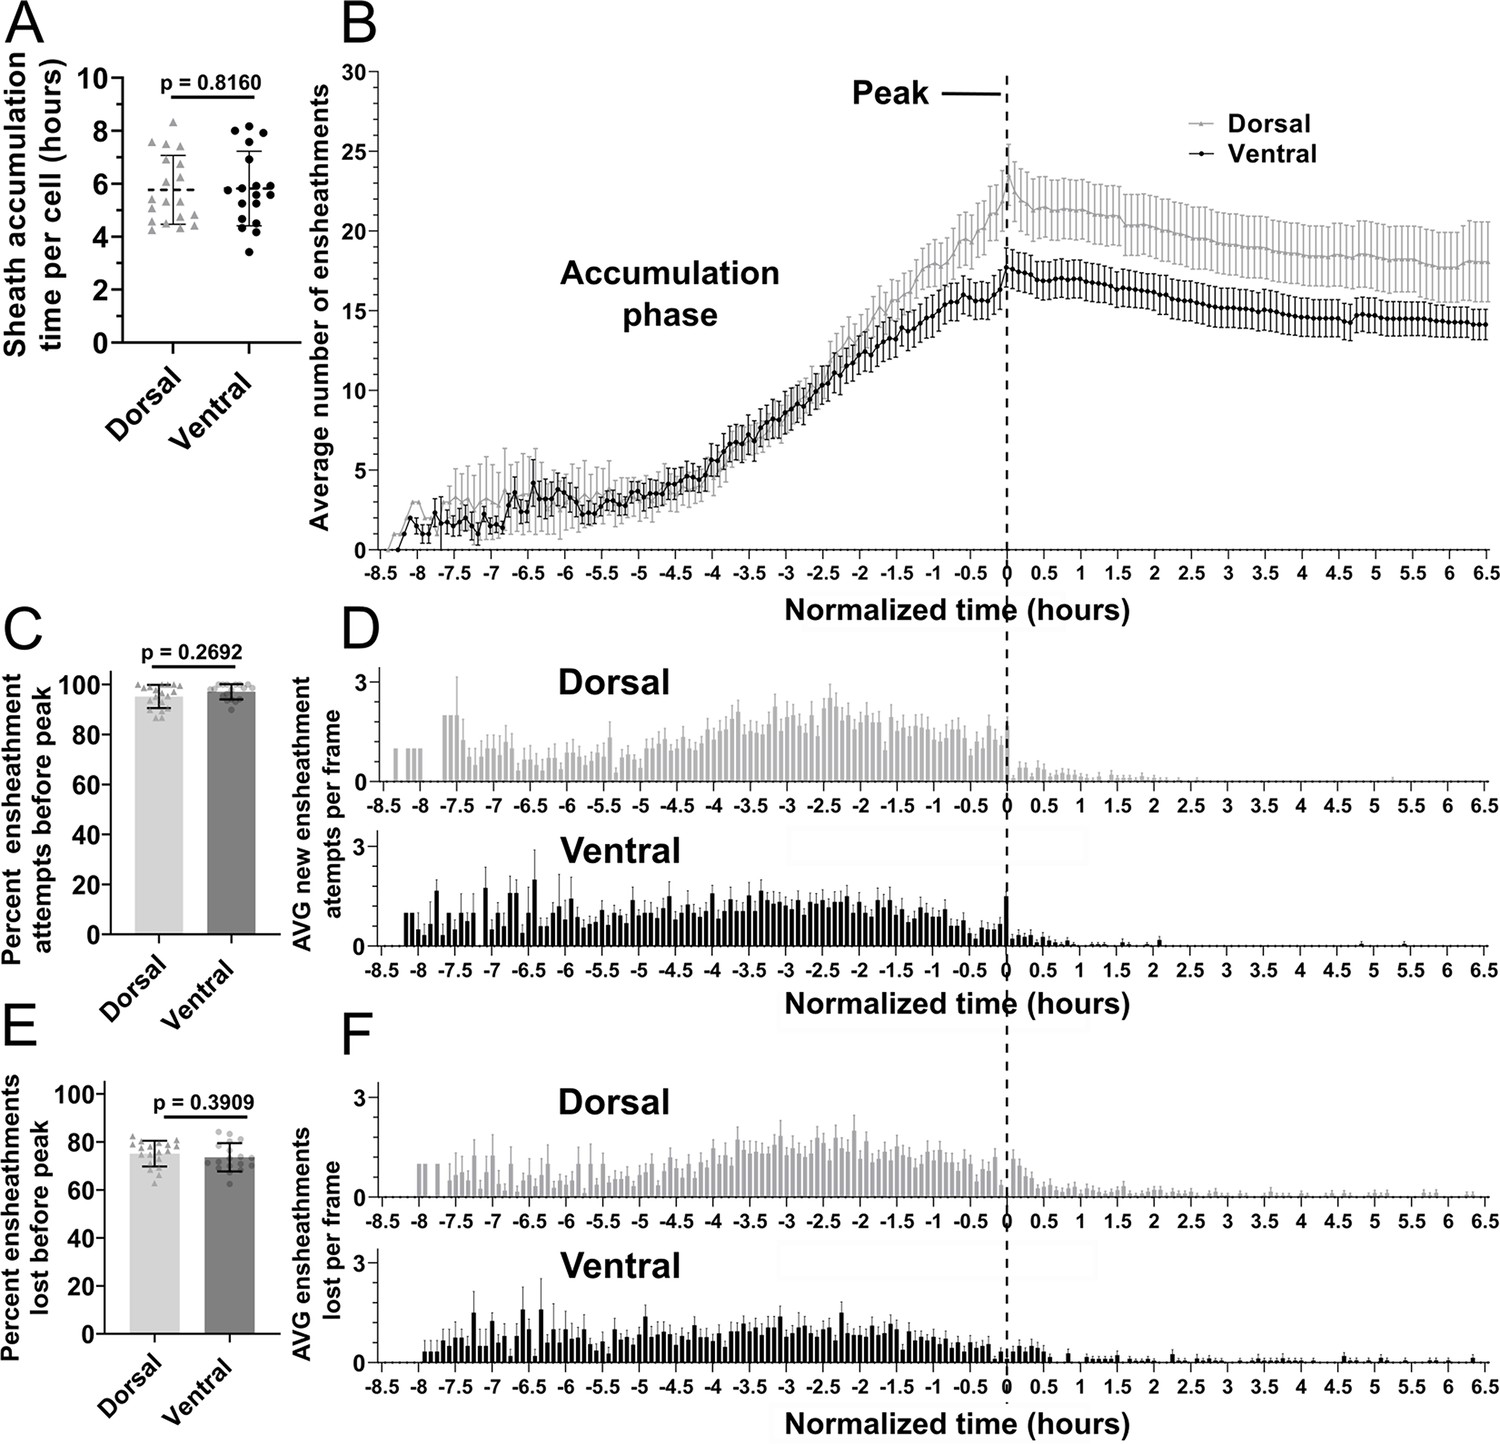
Oligodendrocyte nascent sheath accumulation involved a consistent and high rate of sheath initiation and loss.
(A) Time required for peak (or max) sheath accumulation per cell (hours). Error bars are standard deviation. (B–F) Videos of n=19 dorsal cells (19 larvae) and n=18 ventral cells (18 larvae) were quantified for sheath initiation and loss in each 5 min frame. The time-lapse videos were then normalized for quantitative comparison by defining the video frame at which each cell accumulated its peak (or max) number of immature ensheathments as T0’. Each frame before or after that was –5 min or +5 min. The vertical dashed line aligns the T0’ time point of each graph in B, D, and F. (B) The average number of immature ensheathments for dorsal and ventral cells that are present in each frame is plotted based on time relative to T0’; error bars represent SEM. (C) Percent of ensheathment attempts from the entire imaging period that occurred prior to reaching peak. Error bars represent SEM. (D) The average number of new ensheathment attempts in each frame is plotted with the same time normalization as in B. Error bars represent SEM. (E) Similar to C, the percent of ensheathments from the entire imaging period that were lost prior to reaching peak. Error bars represent SEM. (F) The average number of ensheathments that were lost in each frame is plotted with the same time normalization as in B. Error bars represent SEM. Individual data points are shown and significance was determined by Mann-Whitney tests in A, C, and E. The data in B, D, and F was cropped at +6.5 hr (see associated source data).
-
Figure 5—source data 1
Excel spreadsheet with the sheath accumulation data for the dorsal and ventral oligodendrocyte ensheathment dynamics experiment.
- https://cdn.elifesciences.org/articles/82111/elife-82111-fig5-data1-v2.xlsx
Figure 6 with 5 supplements
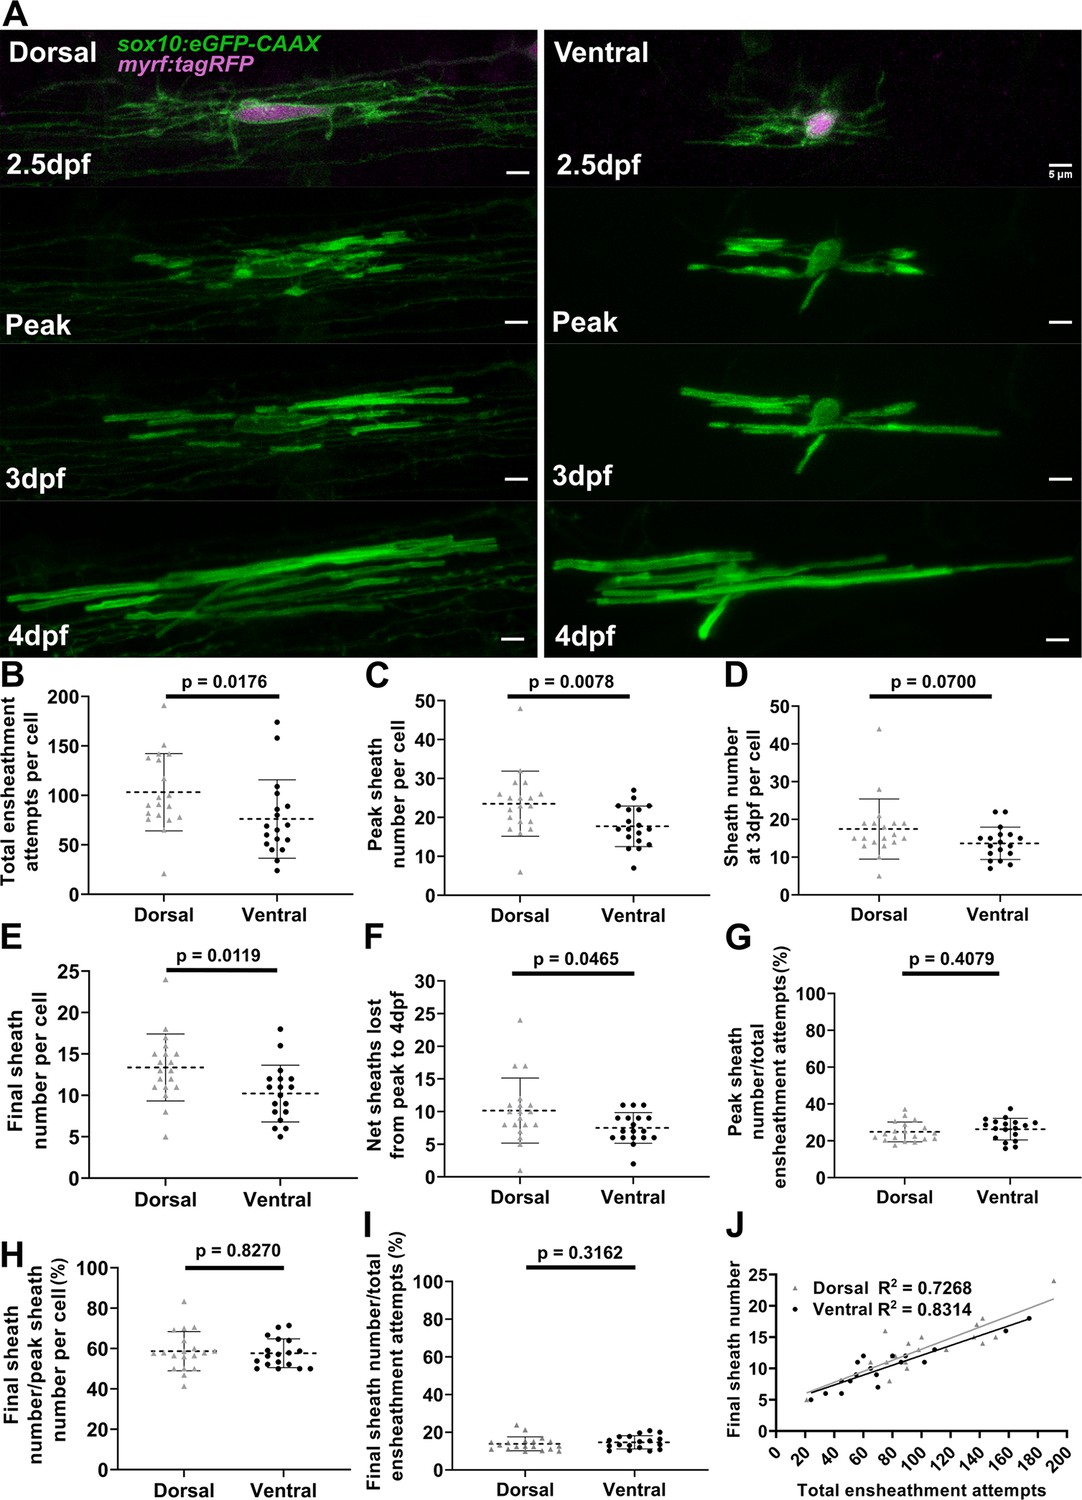
Dorsal cells initiated more ensheathments than ventral cells, but all oligodendrocytes stabilized a similar percentage of these ensheathments.
(A) Dorsal and ventral cell lateral images from the ensheathment dynamics imaging paradigm in the spinal cord of living larvae labeled with sox10:eGFP-CAAX (in green) and time-lapse imaged for 15 hr from 2.5 to 3 days post fertilization (dpf). The upper panels are a dorsal (left) and ventral (right) cell also labeled with myrf:tagRFP (magenta) at the beginning of the time-lapse experiment. The subsequent panels are the same cells at the peak of sheath accumulation, at 3 and 4 dpf (scale bar = 5 μm). (B–J) compares dorsal and ventral cells. (B) Total ensheathment attempts per cell. (C) Peak sheath number per cell. (D) Sheath number at 3 dpf per cell. (E) Final sheath number per cell at 4 dpf. (This is the same data and images as presented in Figure 4—figure supplement 1, time-lapse group.) (F) Net sheaths lost from the peak to 4 dpf. (G) Percent of sheaths stabilized during the accumulation phase (peak sheath number/total ensheathment attempts). (H) Percent of sheaths stabilized during the stabilization phase (final sheath number/peak sheath number). (I) Percent of total sheaths stabilized across both the accumulation and stabilization phases (final sheath number/total ensheathment attempts). (J) Simple linear regression comparing the total number of ensheathment attempts to the final sheath number at 4 dpf for each cell. The R2 values for each group are shown. Dorsal n=19 cells/19 larvae, ventral n=18 cells/18 larvae. The dashed lines in each plot represent average values with all data points shown. The error bars are standard deviation. Significance was determined by Mann-Whitney tests (see associated source data and supplementary video files).
-
Figure 6—source data 1
Excel spreadsheet with the summary data for the dorsal and ventral oligodendrocyte ensheathment dynamics experiment.
- https://cdn.elifesciences.org/articles/82111/elife-82111-fig6-data1-v2.xlsx
Figure 6—figure supplement 1
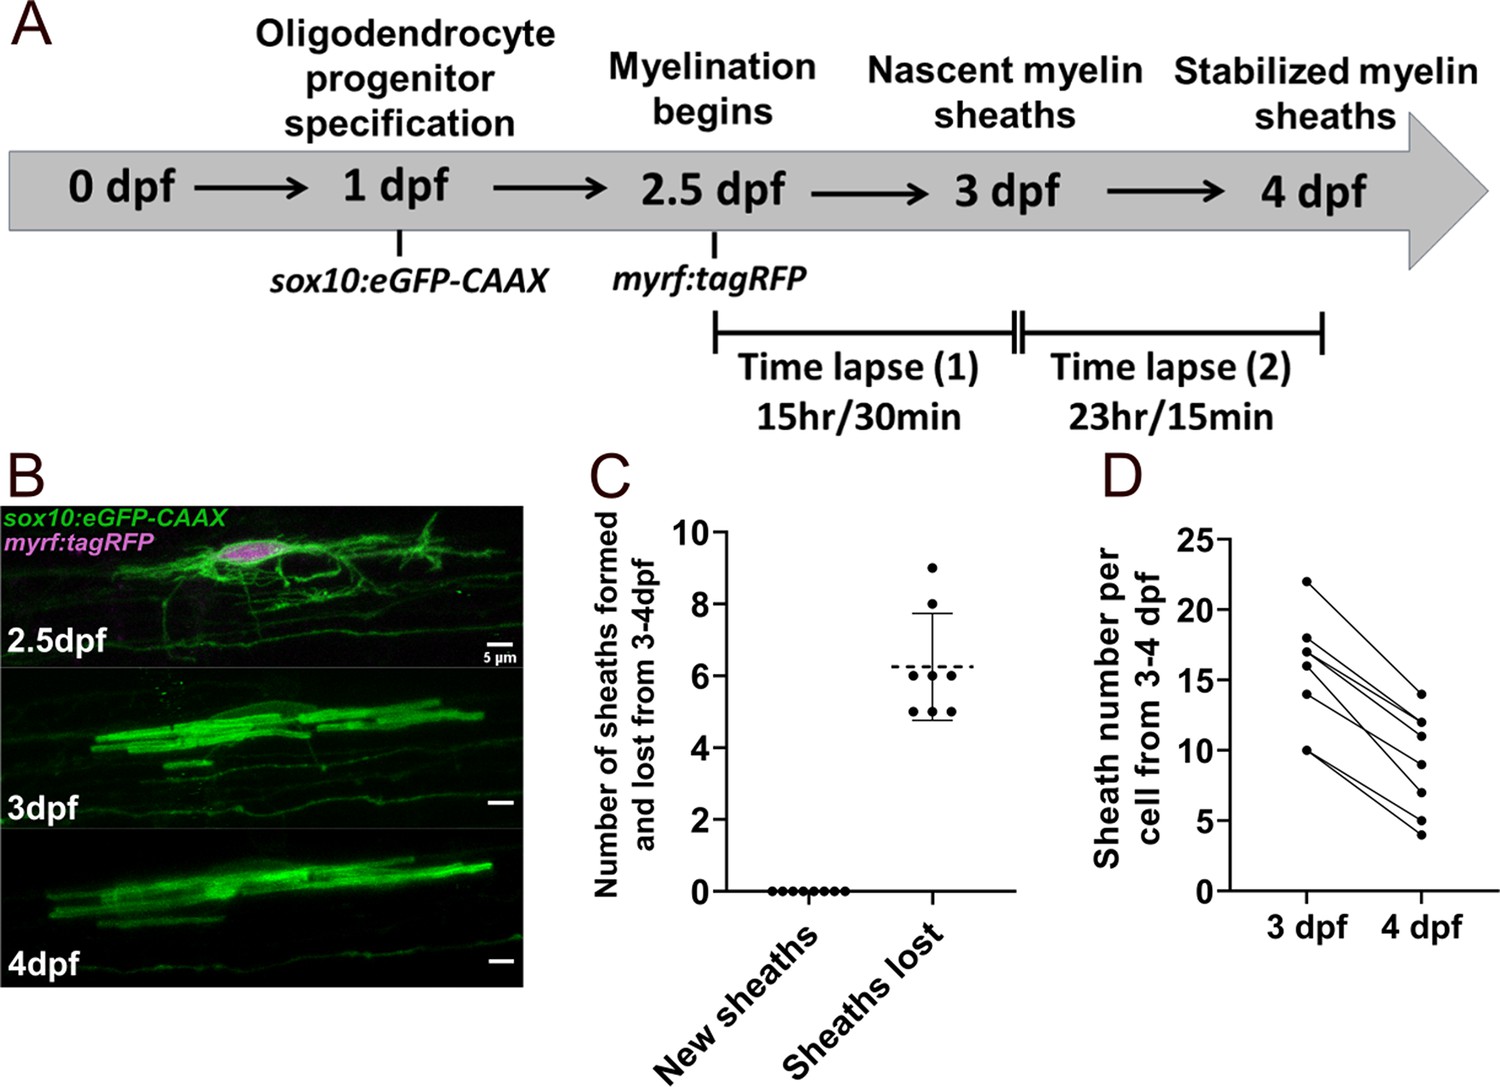
Oligodendrocytes did not make new sheaths during the stabilization phase from 3 to 4 days post fertilization (dpf).
(A) Modified oligodendrocyte ensheathment dynamics imaging paradigm. (B) Lateral images in the spinal cord of living larvae labeled with sox10:eGFP-CAAX (in green) and time-lapsed from 2.5 to 4 dpf. The upper panel is an oligodendrocyte that is also labeled with myrf:tagRFP (magenta) at the beginning of the time-lapse experiment. The subsequent panels are of the same cell at 3 and 4 dpf (scale bar = 5 μm). (C) Number of sheaths formed and lost from 3 to 4 dpf per cell. The dashed lines in this plot represent average values with all data points shown. Error bars are standard deviation. (D) Change in sheath number from 3 to 4 dpf per cell. The straight lines are connecting the number of sheaths at 3 and 4 dpf for each cell. Dorsal n=5 cells/4 larvae, ventral n=3 cells/3 larvae (see associated source data and supplementary video files).
-
Figure 6—figure supplement 1—source data 1
Excel spreadsheet with the summary data for the oligodendrocyte ensheathment dynamics experiment looking at 3–4 days post fertilization (dpf).
- https://cdn.elifesciences.org/articles/82111/elife-82111-fig6-figsupp1-data1-v2.xlsx
Figure 6—video 1
Figure 6A fluorescence time-lapse video for the dorsal oligodendrocyte ensheathment dynamics example.
The video is set to play at 2 frames per second (fps). The ‘0 min’ frame is the start of ensheathment.
Figure 6—video 2
Figure 6A fluorescence time-lapse video for the ventral oligodendrocyte ensheathment dynamics example.
The video is set to play at 2 frames per second (fps). The ‘0 min’ frame is the start of ensheathment.
Figure 6—video 3
Figure 6—figure supplement 1 fluorescence time-lapse video for the 2.5–3 days post fertilization (dpf) oligodendrocyte ensheathment dynamics example.
The video is set to play at 1 frame per second (fps). The ‘0 min’ frame is the start of ensheathment.
Figure 6—video 4
Figure 6—figure supplement 1 fluorescence time-lapse video for the corresponding 3–4 days post fertilization (dpf) oligodendrocyte ensheathment dynamics example.
The video is set to play at 2 frames per second (fps).
Figure 7 with 3 supplements
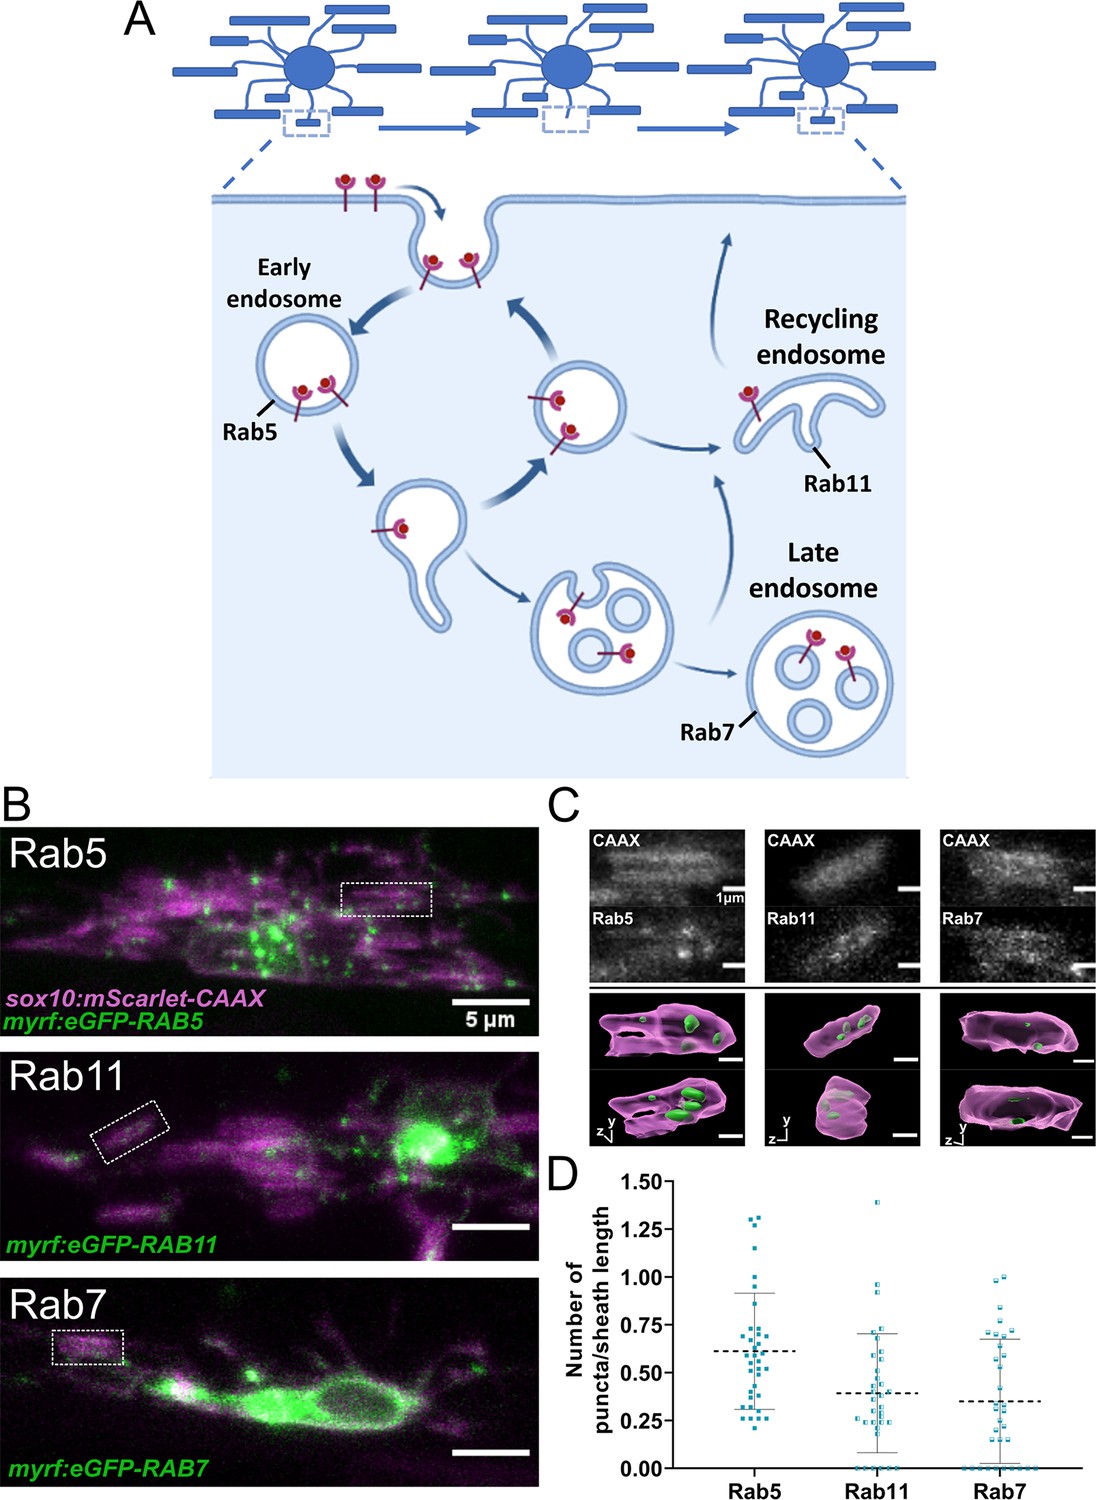
Rab5+, Rab7+, and Rab11+ endosomes localized to immature sheaths.
(A) The endocytic recycling pathway during sheath initiation and loss. (B) Lateral images of oligodendrocytes in the early stages of the ensheathment process in the spinal cord of living larvae at 2.5 dpf labeled with sox10:mScarlet-CAAX (magenta) and expressing either myrf:eGFP-RAB5C, myrf:eGFP-RAB7A, or myrf:eGFP-RAB11A (green). White boxes outline immature sheaths with Rab+ endosomal puncta for each fusion protein. (Scale bar = 5 μm). (C) Top panels are grey inset images from the outlined regions in B. The bottom panels are 3D reconstructions of these insets (Membrane in magenta, endosomes in green). (D) Quantification of Rab+ endosomal puncta in immature sheaths. Number of puncta in each sheath was normalized by the length of the sheath. Rab5 n = 36 sheaths (9 ventral cells/2 dorsal cells/11 larvae), Rab11 n = 34 sheaths (8 ventral cells/2 dorsal cells/10 larvae), Rab7 n = 33 sheaths (9 ventral cells/2 dorsal cells/11 larvae). Dashed lines represent average values and error bars are SD. (See associated source data and supplementary video files).
© 2022, Biorender.com. Panel A adapted from “Endocytic Pathway with Macropinocytosis and Phagocytosis”, by BioRender.com (2022). Retrieved from https://app.biorender.com/biorender-templates/t9025ea05f35722d6800ab456324-endocytic-pathway-with-macropinocytosis-and-phagocytosis. It is not covered by the CC-BY 4.0 license and further reproduction of this panel would need permission from the copyright holder.
-
Figure 7—source data 1
Excel spreadsheet with the Rab5, -7, -11 localization data.
- https://cdn.elifesciences.org/articles/82111/elife-82111-fig7-data1-v2.xlsx
Figure 7—video 1
Figure 7C 3D reconstruction_360˚ rotation video for the Rab5 inset example.
The video is set to play at 2 frames per second (fps).
Figure 7—video 2
Figure 7C 3D reconstruction_360˚ rotation video for the Rab11 inset example.
The video is set to play at 2 frames per second (fps).
Figure 7—video 3
Figure 7C 3D reconstruction_360˚ rotation video for the Rab7 inset example.
The video is set to play at 2 frames per second (fps).
Figure 8
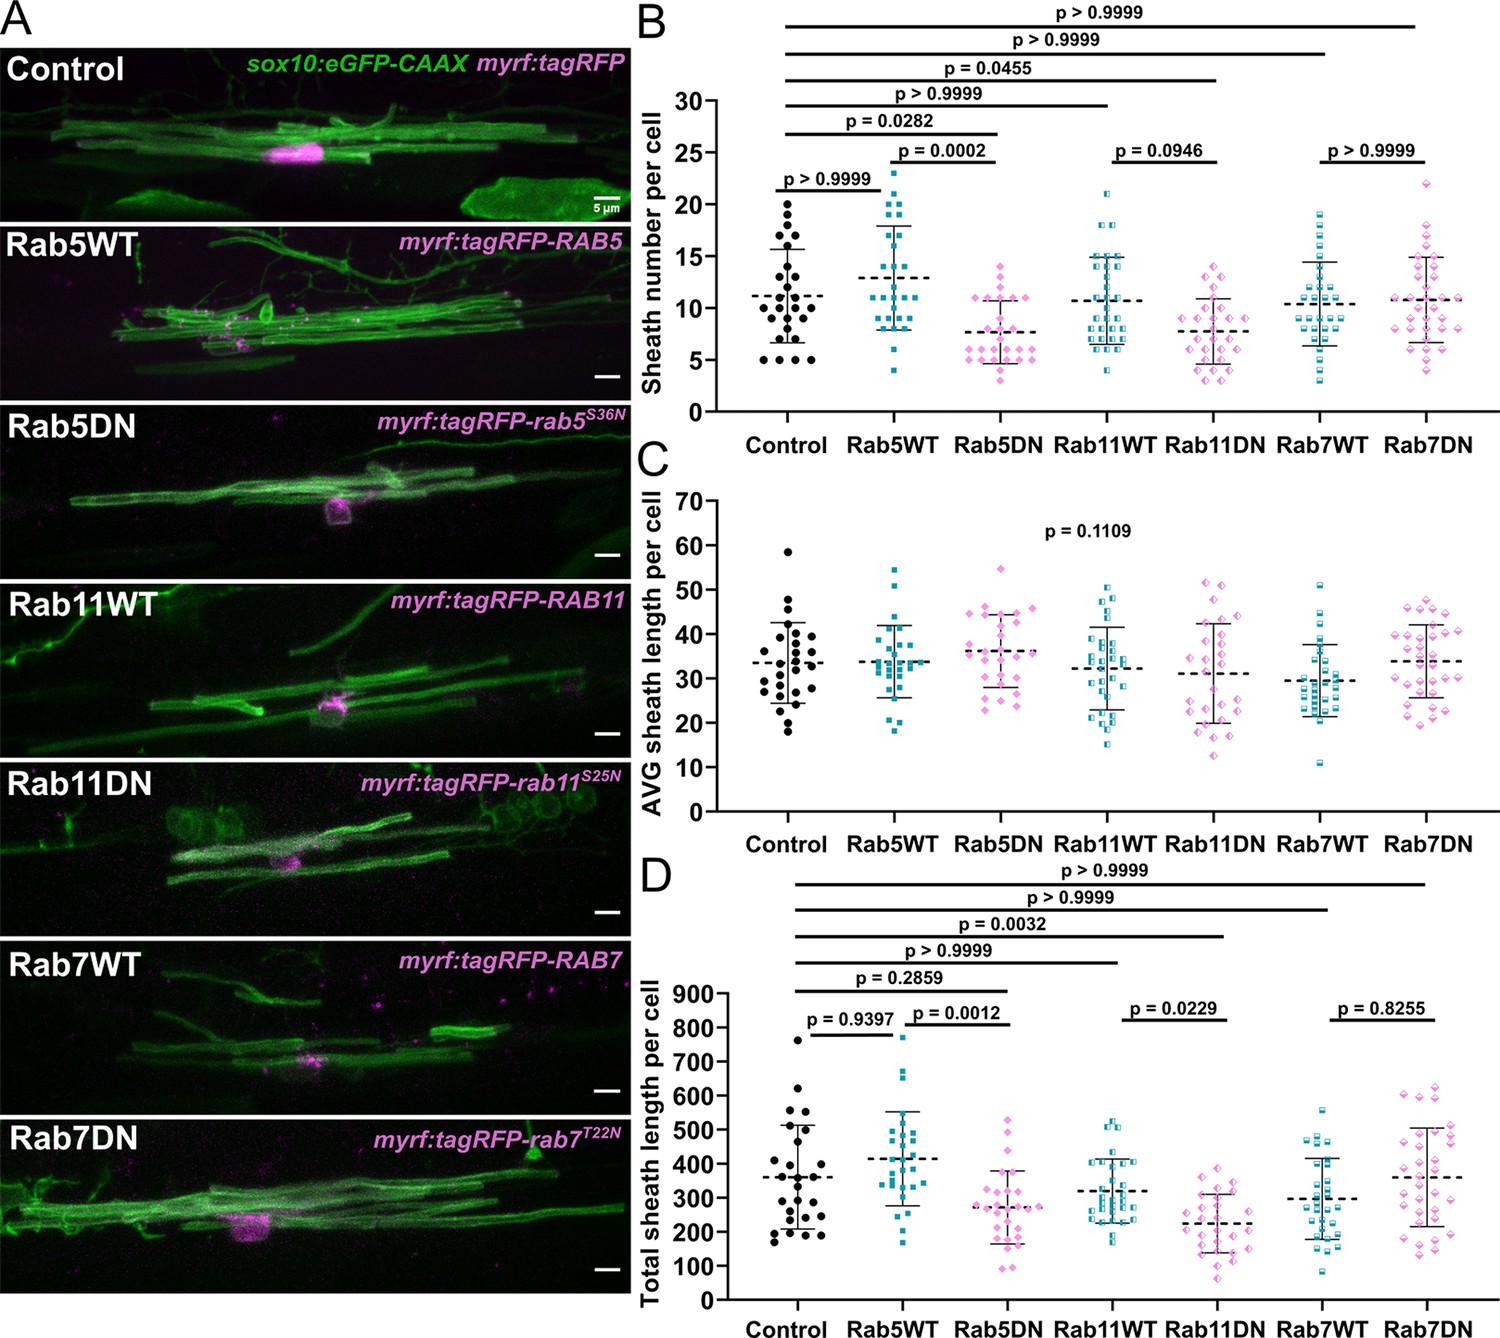
The Rab5 and Rab11 dominant-negative mutants reduced sheath number, but not average sheath length.
(A) Representative lateral images of ventral oligodendrocytes in the spinal cord of living larvae at 4 days post fertilization (dpf) labeled by sox10:eGFP-CAAX (green) and one of the following: myrf:tagRFP, myrf:tagRFP-RAB5C, myrf:tagRFP-rab5CS36N, myrf:tagRFP-RAB7A, myrf:tagRFP-rab7AT22N, and myrf:tagRFP-RAB11A, myrf:tagRFP-rab11AS25N (all in magenta). The image and data for the control is the same as for the ventral group in Figure 1 (scale bar = 5 μm). (B) Sheath number per cell. (C) Average sheath length per cell. (D) Total sheath length per cell (myrf:tagRFP n=26 cells/26 larvae, myrf:tagRFP-RAB5C n=28 cells/28 larvae, myrf:tagRFP-rab5CS36N n=27 cells/27 larvae, myrf:tagRFP-RAB7A n=29 cells/29 larvae, myrf:tagRFP-rab7AT22N n=32 cells/32 larvae, and myrf:tagRFP-RAB11A n=30 cells/30 larvae, myrf:tagRFP-rab11AS25N n=27 cells/27 larvae). The dashed lines in each plot represent average values with all data points shown. Error bars are standard deviation. Global significance was determined using a Kruskal-Wallis test for B–D. This global p-value is shown for C since it was not significant. Post hoc multiple comparison tests were not performed for this analysis. Post hoc Dunn’s multiple comparison tests were performed to compare groups in B and D. We compared everything with the control group and compared each wild-type and associated mutant with each other. The different Rab groups were not compared with each other (see associated source data).
-
Figure 8—source data 1
Excel spreadsheet with the sheath analysis data for the Rab5, -7, -11 dominant-negative mutants.
- https://cdn.elifesciences.org/articles/82111/elife-82111-fig8-data1-v2.xlsx
Figure 9 with 4 supplements
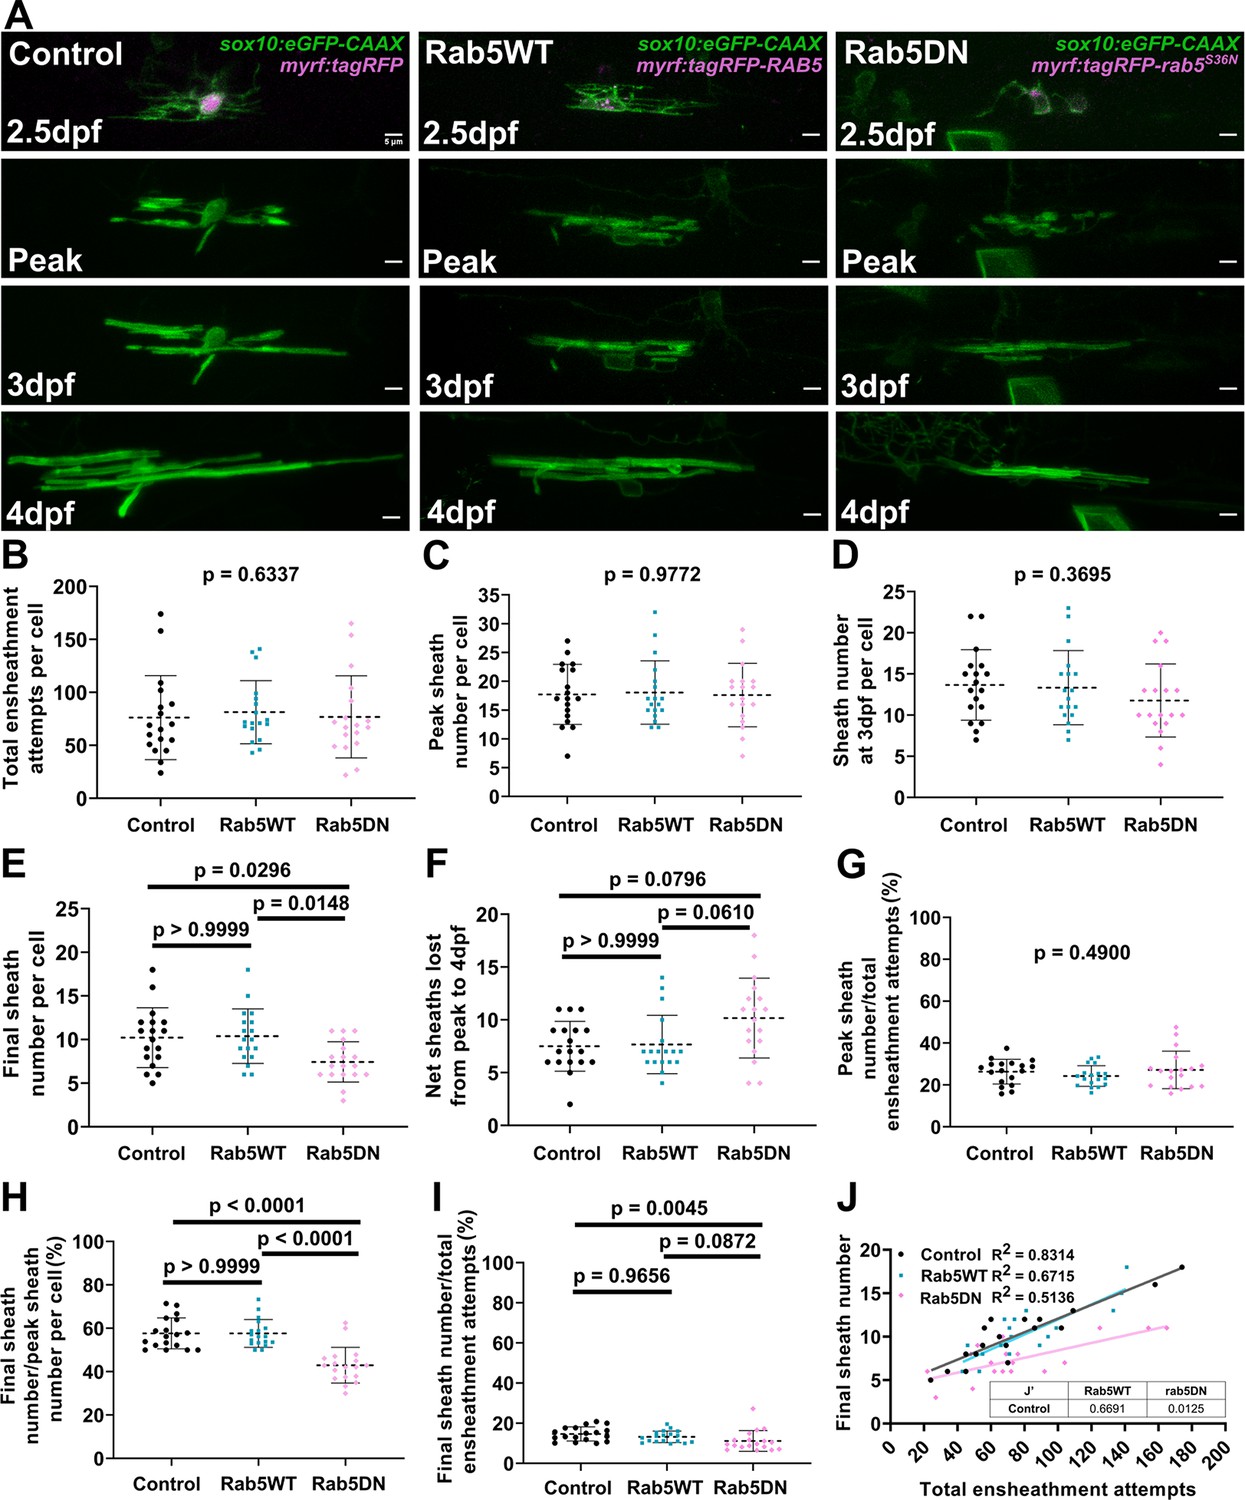
Over-expression of the Rab5 dominant-negative mutant in oligodendrocytes reduced sheath stability in the stabilization phase.
(A) Lateral images from the ventral spinal cord of living larvae labeled with sox10:eGFP-CAAX (in green) and one of the following: myrf:tagRFP, myrf:tagRFP-RAB5C, myrf:tagRFP-rab5CS36N (all in magenta); and time-lapsed for 15 hours from 2.5-3dpf. The first panel is an image taken immediately before starting the time-lapse experiment. The subsequent panels are the same cells at the peak of sheath accumulation, at 3dpf, and at 4dpf. The images and data for the control are the same as for the ventral group in Figure 6. (Scale bar = 5 μm). (B) Total ensheathment attempts per cell. (C) Peak sheath number per cell. (D) Sheath number at 3dpf per cell. (E) Final sheath number per cell at 4dpf. (F) Net sheaths lost from the peak to 4dpf. (G) Percent of sheaths stabilized during the accumulation phase (peak sheath number/total ensheathment attempts). (H) Percent of sheaths stabilized during the stabilization phase (final sheath number/peak sheath number). (I) Percent of total sheaths stabilized across both the accumulation and stabilization phases (final sheath number/total ensheathment attempts). (J) Simple linear regression comparing the total number of ensheathment attempts to the final sheath number at 4dpf for each cell. (control n=18 cells/18 larvae, wild-type Rab5 n=18 cells/18 larvae, Rab5DN n=18 cells/17 larvae). The dashed lines in each plot represent average values with all data points shown. The error bars are standard deviation. Significance was determined using global Kruskal-Wallis tests. These p-values are shown for B-D and G since they were not significant. Post hoc multiple comparisons tests were not performed for these analyses. Post hoc Dunn’s multiple comparisons tests were done for E, F, H, and I and the individual p-values are shown. (J’) The slopes of the Rab5WT and Rab5DN regression lines from J were compared to the control in Graphpad by (two-tailed) testing the null hypothesis that the slopes are identical (the lines are parallel). P-values are shown in the table. (See associated source data and supplementary video files).
-
Figure 9—source data 1
Excel spreadsheet with the summary data for the Rab5 dominant-negative mutant oligodendrocyte ensheathment dynamics experiment.
- https://cdn.elifesciences.org/articles/82111/elife-82111-fig9-data1-v2.xlsx
Figure 9—figure supplement 1
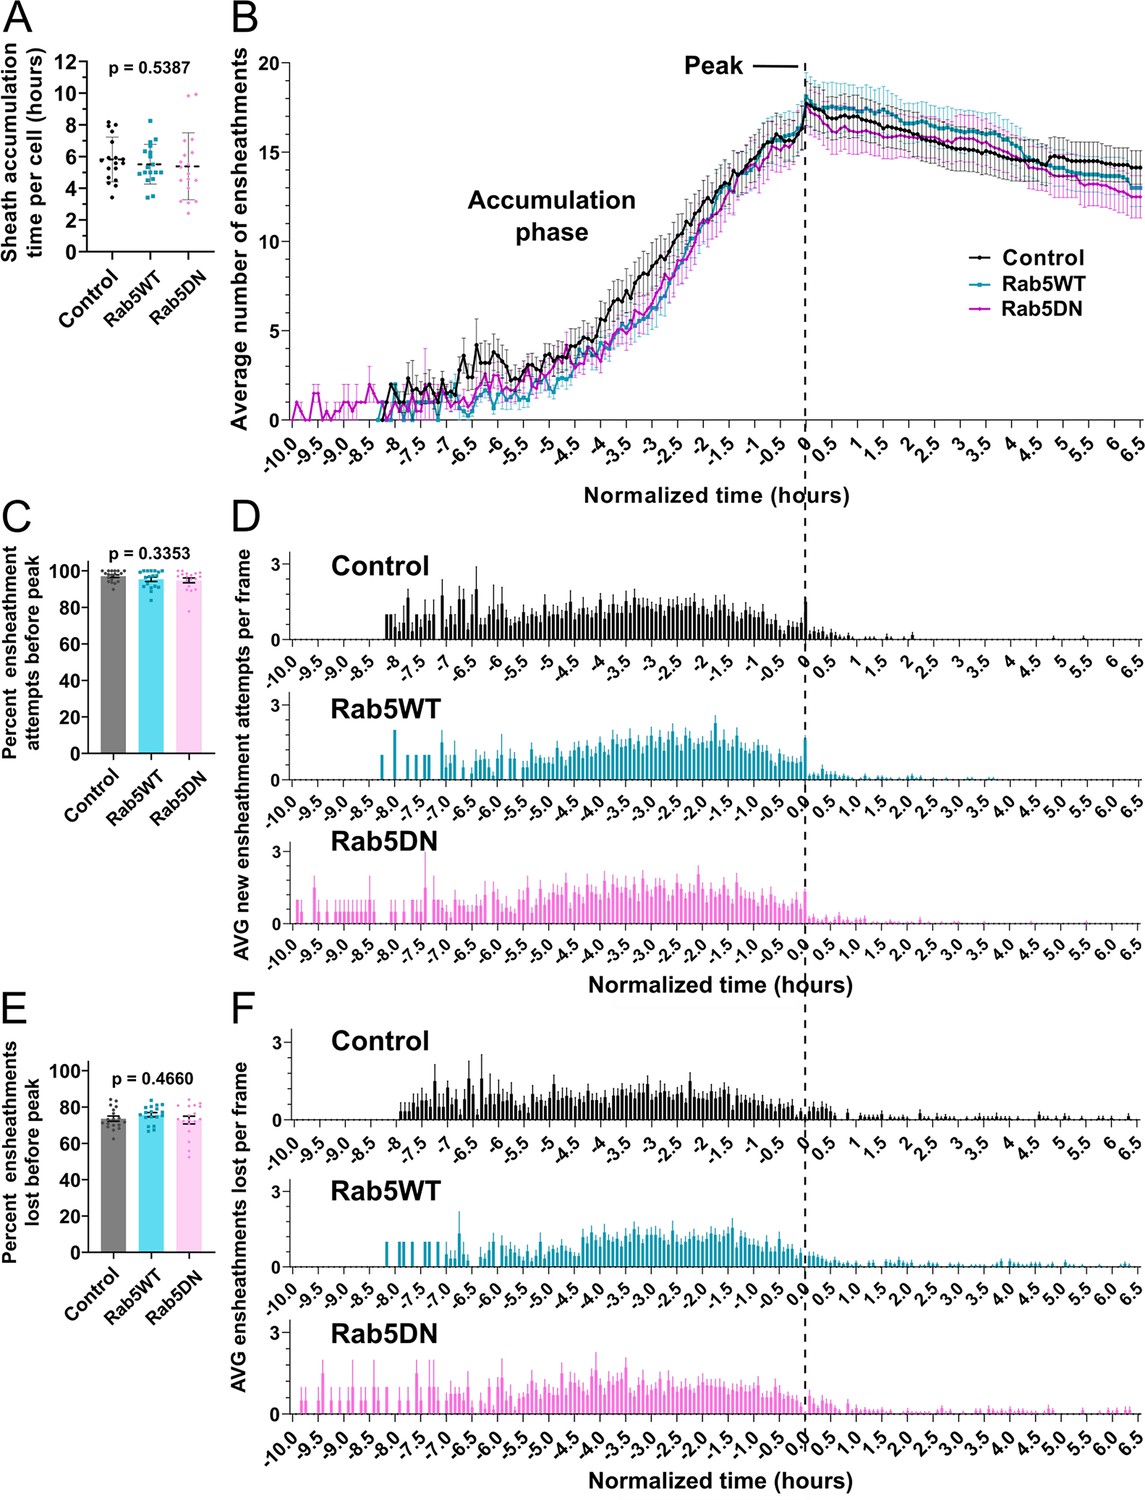
The dynamics of the sheath accumulation phase were not altered by Rab5DN over-expression.
(A) Time required for peak (or max) sheath accumulation per cell (hours). Dashed lines represent the average values and the error bars are standard deviation. (B–F) The control, Rab5WT, and Rab5DN time-lapse data sets were quantified for sheath initiation and loss in each 5 min frame. This data was normalized by setting the video frame where each cell accumulates a peak number of immature sheaths as T0’, as in Figure 5. The vertical dashed line aligns the T0’ time point of each graph in B, D, and F. (B) The average number of immature ensheathments in each frame are plotted as a line with error bars representing SEM. The data for the control is the same as for the ventral group in Figure 5. (C) Percent of the total ensheathment attempts that occurred prior to reaching peak. Error bars represent SEM. (D) The average number of new ensheathment attempts in each frame was quantified with the same time normalization as in B. Error bars represent SEM. (E) Similar to C, the percent of the total number of immature ensheathments that were lost prior to reaching peak. Error bars represent SEM. (F) The average number of immature ensheathments that were lost in each frame was quantified with the same time normalization as in B. Error bars represent SEM. Significance was determined using global Kruskal-Wallis tests in A, C, and E. These p-values are shown for each plot since they were not significant. Post hoc multiple comparisons tests were not performed for these analyses. Control n=18 cells/18 larvae, wild-type Rab5WT n=18 cells/18 larvae, Rab5DN n=18 cells/17 larvae. The data in B, D, and F was cropped at +6.5 hr (see associated source data).
-
Figure 9—figure supplement 1—source data 1
Excel spreadsheet with the sheath accumulation data for the Rab5 dominant-negative mutant oligodendrocyte ensheathment dynamics experiment.
- https://cdn.elifesciences.org/articles/82111/elife-82111-fig9-figsupp1-data1-v2.xlsx
Figure 9—video 1
Fluorescence time-lapse video for the control ventral oligodendrocyte ensheathment dynamics example.
This is the same video as for the ‘Figure 6—video 2’ file. The video is set to play at 2 frames per second (fps). The ‘0 min’ frame is the start of ensheathment.
Figure 9—video 2
Fluorescence time-lapse video for the Rab5WT ventral oligodendrocyte ensheathment dynamics example.
The video is set to play at 2 frames per second (fps). The ‘0 min’ frame is the start of ensheathment.
Figure 9—video 3
Fluorescence time-lapse video for the Rab5DN ventral oligodendrocyte ensheathment dynamics example.
The video is set to play at 2 frames per second (fps). The ‘0 min’ frame is the start of ensheathment.
Figure 10
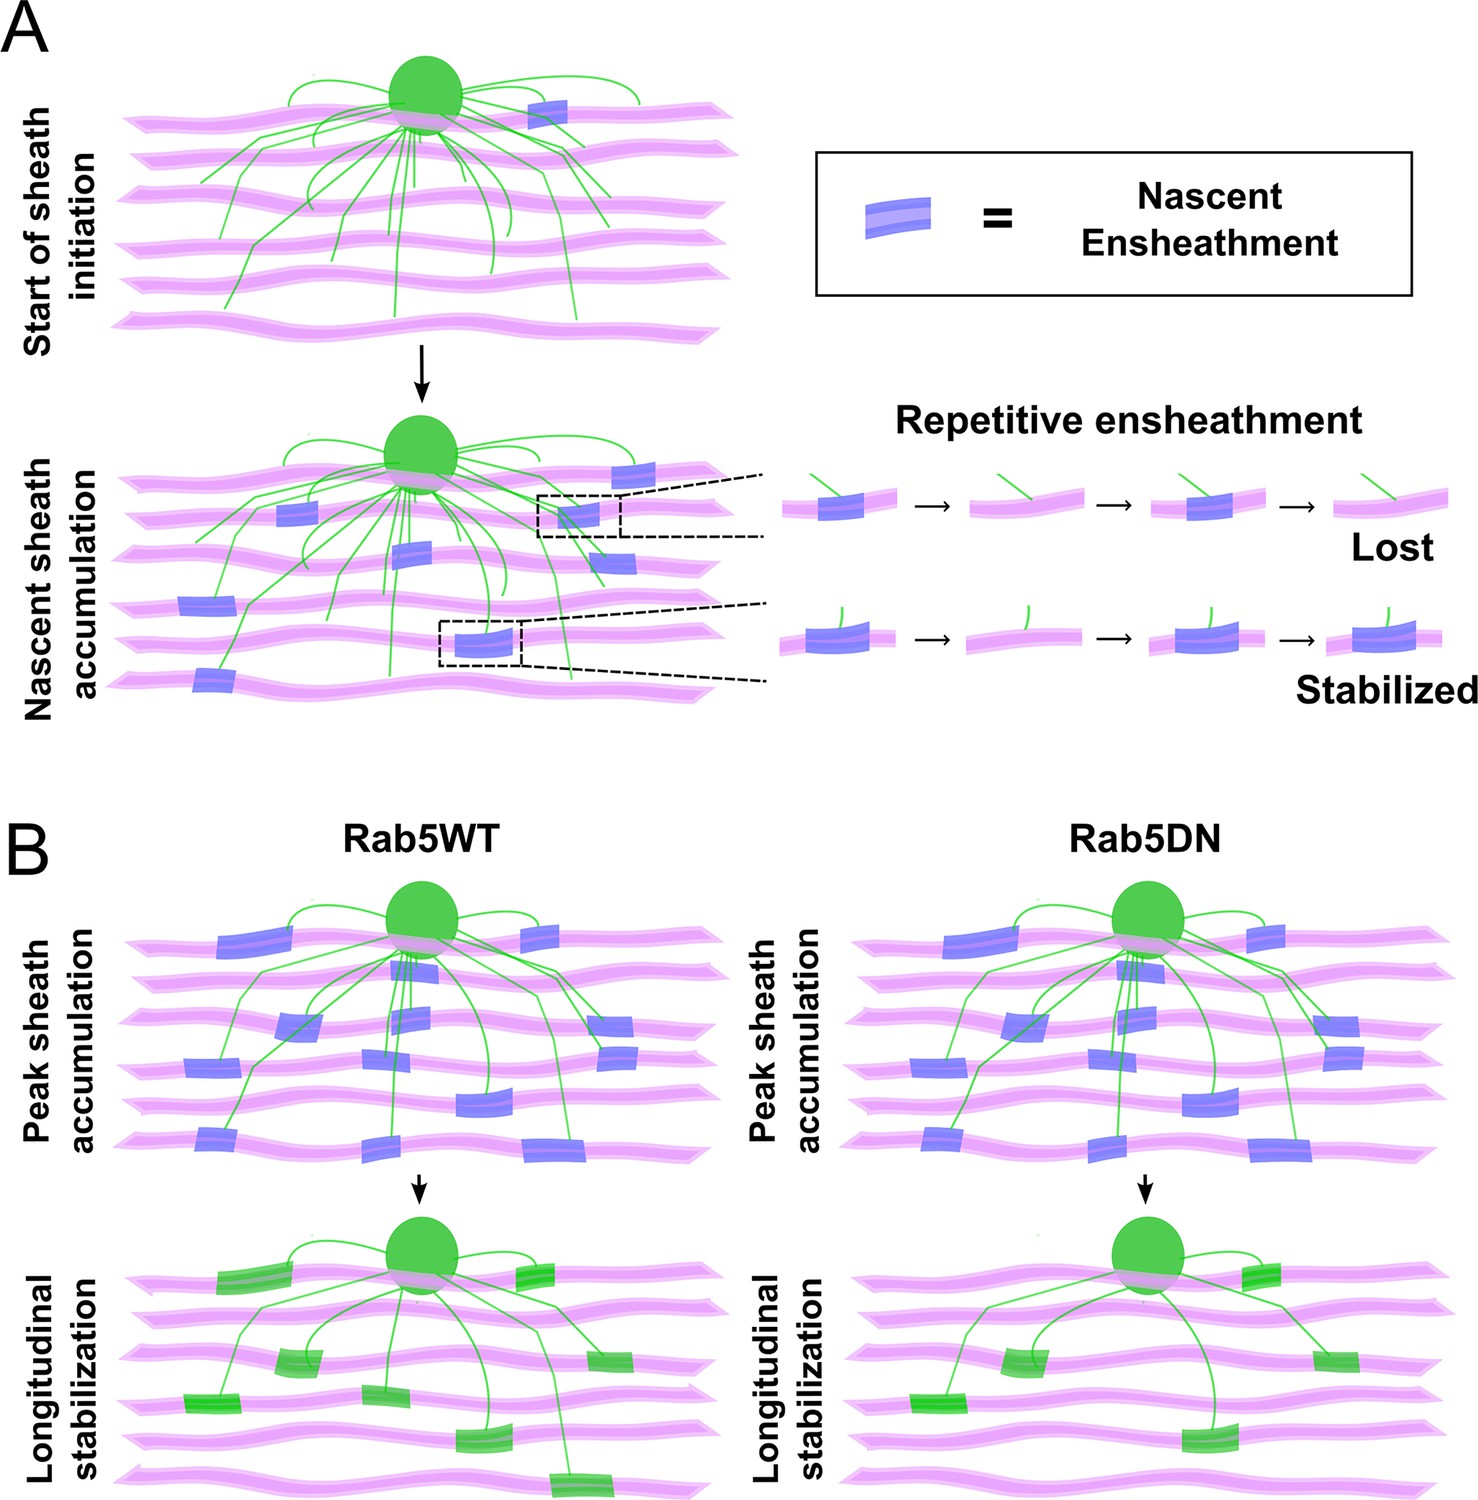
The process of sheath accumulation involves the repetitive ensheathment of axons and Rab5 promotes longitudinal sheath stabilization.
(A) A model depicting how the repetitive ensheathment of axons is occurring during the dynamic accumulation phase of the sheath formation process. Oligodendrocytes are green, axons are pink, and the nascent ensheathments are purple. (B) A model depicting that Rab5WT helps to promote the stabilization of nascent sheaths during the stabilization phase of the sheath formation process (left). The Rab5DN mutant instead results in fewer stabilized sheaths (right). Oligodendrocytes are green, axons are pink, nascent ensheathments are purple, and stabilized ensheathments are also green.
Tables
Key resources table
| Reagent type (species) or resource | Designation | Source or reference | Identifiers | Additional information |
|---|---|---|---|---|
| Gene (Danio rerio) | RAB5C | Addgene | 80518 | Plasmid |
| Gene (Danio rerio) | RAB7A | Addgene | 80522 | Plasmid |
| Gene (Danio rerio) | RAB11A | Addgene | 80529 | Plasmid |
| Genetic reagent (Danio rerio) | sox10:eGFP-CAAX | This paper | Expresses membrane localized eGFP in oligodendrocyte lineage. | |
| Genetic reagent (Danio rerio) | sox10:mScarlet-CAAX | Gift from Appel lab | Expresses membrane localized mScarlet in oligodendrocyte lineage. | |
| Genetic reagent (Danio rerio) | neuroD:tagRFP-CAAX | This paper | Expresses membrane localized tagRFP in neurons. | |
| Genetic reagent (Danio rerio) | myrf:eGFP-RAB5C | This paper | Expresses eGFP-Rab5 fusion in pre-myelinating oligodendrocytes. | |
| Genetic reagent (Danio rerio) | myrf:eGFP-RAB7A | This paper | Expresses eGFP-Rab7 fusion in pre-myelinating oligodendrocytes. | |
| Genetic reagent (Danio rerio) | myrf:eGFP-RAB11A | This paper | Expresses eGFP-Rab11 fusion in pre-myelinating oligodendrocytes. | |
| Genetic reagent (Danio rerio) | myrf:tagRFP-RAB5C | This paper | Expresses tagRFP-Rab5 fusion in pre-myelinating oligodendrocytes. | |
| Genetic reagent (Danio rerio) | myrf:tagRFP-RAB7A | This paper | Expresses tagRFP-Rab7 fusion in pre-myelinating oligodendrocytes. | |
| Genetic reagent (Danio rerio) | myrf:tagRFP-RAB11A | This paper | Expresses tagRFP-Rab11 fusion in pre-myelinating oligodendrocytes. | |
| Genetic reagent (Danio rerio) | myrf:tagRFP-rab5CS36N | This paper and Clark et al., 2011 | Expresses tagRFP-Rab5 DN mutant fusion in pre-myelinating oligodendrocytes. | |
| Genetic reagent (Danio rerio) | myrf:tagRFP-rab7AT22N | This paper and Clark et al., 2011 | Expresses tagRFP-Rab7 DN mutant fusion in pre-myelinating oligodendrocytes. | |
| Genetic reagent (Danio rerio) | myrf:tagRFP-rab11AS25N | This paper and Clark et al., 2011 | Expresses tagRFP-Rab11 DN mutant fusion in pre-myelinating oligodendrocytes. | |
| Genetic reagent (Danio rerio) | myrf:tagRFP | This paper | Expresses cytosolic tagRFP in pre-myelinating oligodendrocytes. | |
| Genetic reagent (Danio rerio) | Tg(nkx2.2a:EGFP-CAAX) | Kirby et al., 2006; Kucenas et al., 2008 | Transgenic line expressing membrane localized eGFP in oligodendrocyte lineage. | |
| Genetic reagent (Danio rerio) | Tg(mbp:eGFP-CAAX) | Preston et al., 2019; Brown et al., 2021 | Transgenic line expressing membrane localized eGFP in myelinating oligodendrocytes. | |
| Genetic reagent (Danio rerio) | Tg(mbp:tagRFP) | Preston et al., 2019; Brown et al., 2021 | Transgenic line expressing cytosolic tagRFP in myelinating oligodendrocytes. | |
| Genetic reagent (Danio rerio) | Tg(elav3:H2B-GCaMP6f) | Gift from Dr. David Schoppik Dunn et al., 2016 | Transgenic line expressing nuclear localized GCaMP6f in neurons. | |
| Chemical compound, drug | Tricaine methanesulfonate | Syndel | MS-222 | Anesthesia |
| Chemical compound, drug | Pancuronium bromide | Sigma | P1918 | Anesthesia |
Additional files
Download links
A two-part list of links to download the article, or parts of the article, in various formats.
Downloads (link to download the article as PDF)
Open citations (links to open the citations from this article in various online reference manager services)
Cite this article (links to download the citations from this article in formats compatible with various reference manager tools)
Early myelination involves the dynamic and repetitive ensheathment of axons which resolves through a low and consistent stabilization rate
eLife 12:e82111.
https://doi.org/10.7554/eLife.82111


