MMP14 cleaves PTH1R in the chondrocyte-derived osteoblast lineage, curbing signaling intensity for proper bone anabolism
- School of Biomedical Sciences, University of Hong Kong, Pokfulam, Hong Kong
- Department of Physiology and Pharmacology, Karolinska Institutet, Sweden
- Department of Orthopaedics and Traumatology, The University of Hong Kong-Shenzhen Hospital, China
Figures
Figure 1 with 1 supplement
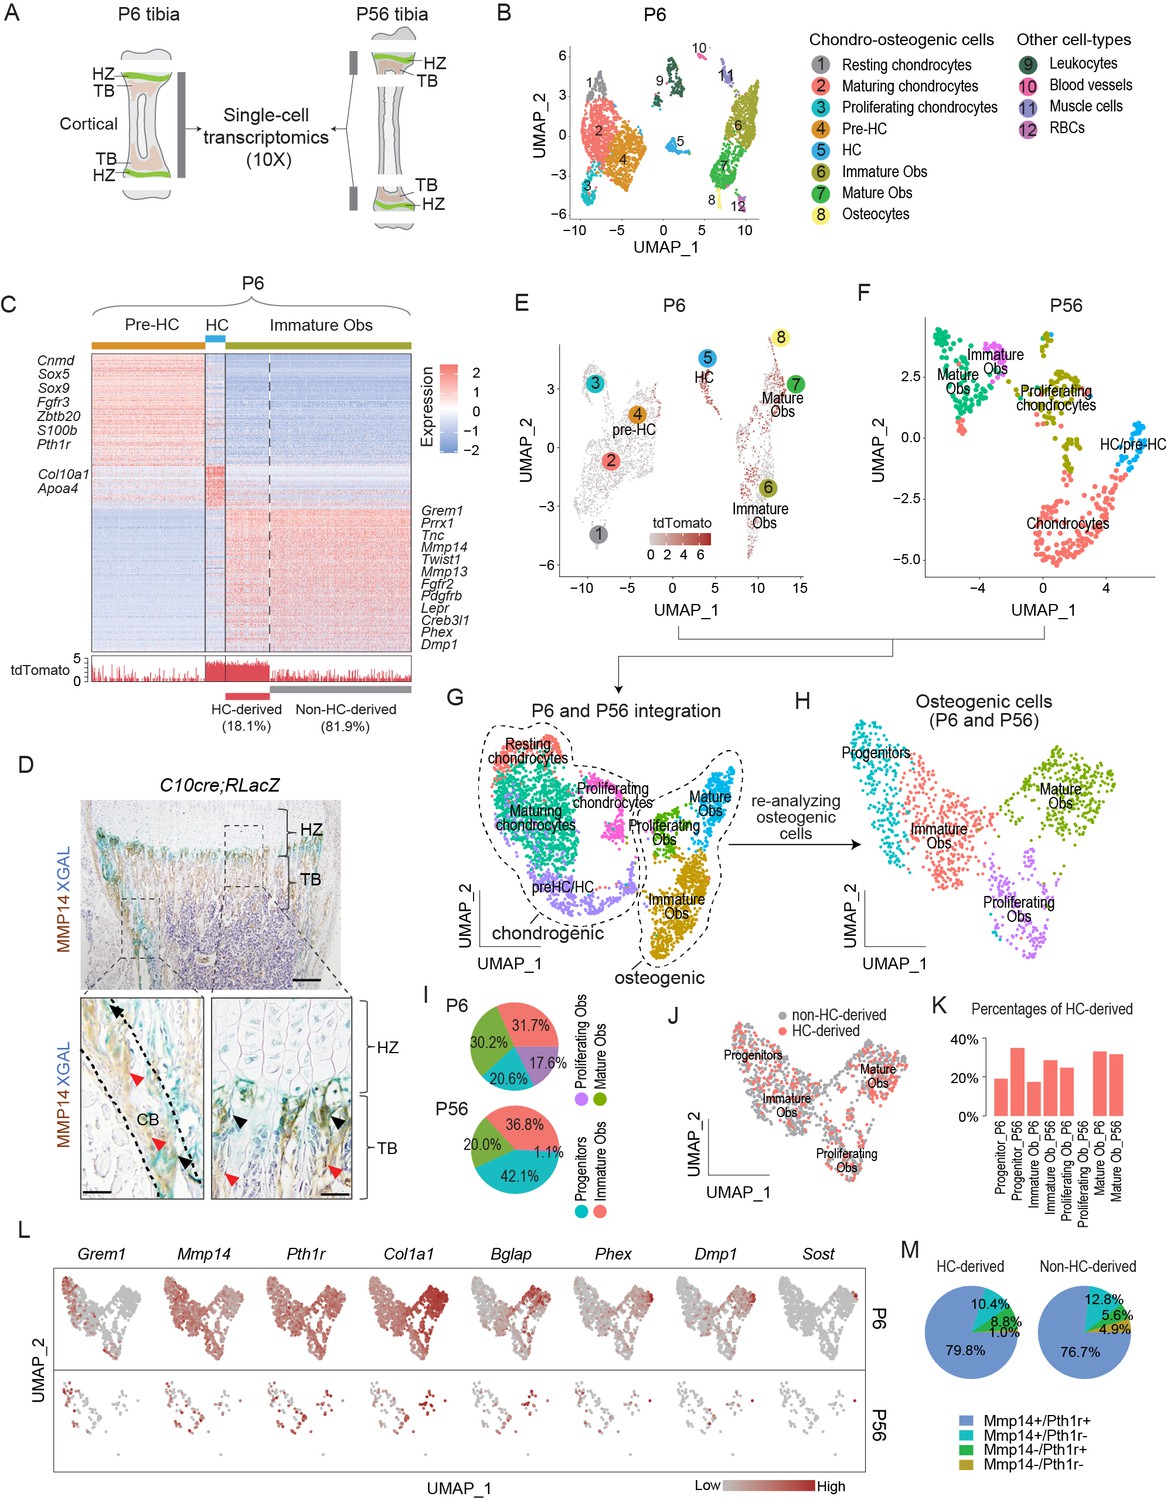
Single-cell transcriptomic analyses of endochondral bone sub-populations at P6 and P56.
(A) Schematic diagram showing the isolation of osteochondrogenic cells from mouse tibia for single-cell transcriptomics (scRNAseq). (B) Scatter plot showing the 3420 single cells, 3163 of which belong to the chondro-osteogenic clusters, as identified in the P6 sample by dimension reduction method UMAP. HC: hypertrophic chondrocytes; Obs: osteoblasts; RBC: red blood cells. (C) Upper panel: heatmap showing the expression patterns of P6 signature genes in the preHC, HC, and immature Ob clusters, when comparing in a one-vs.-all manner among the three. Representative signature genes of interest are listed by the side. Lower panel: signal track indicating the level of tdTomato expression inferred from the WPRE signal. (D) Representative immunostaining showing the spatial distribution of MMP14 and X-gal stained (blue) in hematoxylin-stained sections from C10Cre;RLacZ tibia. HZ, hypertrophic zone; TB, trabecular region; CB, cortical region. Black arrows in enlarged figures indicate LacZ+;MMP14+ cells. Red arrows indicate Mmp14+;LacZ- cells. Dotted line draws chondro-osseous junction. Scale bar 200 μm, 50 μm (magnified picture). (E–G) Scatter plots showing the integration (G) of the 3163 and 430 chondro-osteogenic cells of the P6 (E) and the P56 (F) mice, respectively. (H) Scatter plot showing the reanalyzed UMAP of the 1219 cells osteogenic cells (1124 from P6 and 95 from P56). (I) Piecharts showing the percentages of osteoblast subpopulations in both time points. (J) Scatter plot showing the distribution of HC-derived Obs in the 1219 Obs in (H). (K) Bar chart showing the percentages of HC-derived Obs in the Ob subpopulations of both time points. (L) A panel of scatter-plots showing the expression pattern of a list of selected markers, representing the different osteoblast differentiation states. (M) Piechart showing the percentages of Mmp14 and Pth1r co-expression in HC- and non-HC-derived Obs.
-
Figure 1—source data 1
Cluster signatures for the sub-populations in the P6 sample (Figure 1E).
- https://cdn.elifesciences.org/articles/82142/elife-82142-fig1-data1-v2.xlsx
-
Figure 1—source data 2
Enriched Gene Ontology terms for the subpopulations at P6.
- https://cdn.elifesciences.org/articles/82142/elife-82142-fig1-data2-v2.xlsx
-
Figure 1—source data 3
Cluster signatures for the sub-populations at P56 (Figure 1F), and for the sub-populations of P6 and P56 combined (Figure 1J and Figure 1—figure supplement 1I).
- https://cdn.elifesciences.org/articles/82142/elife-82142-fig1-data3-v2.xlsx
-
Figure 1—source data 4
Differentially expressed genes (DEGs) between hypertrophic chondrocyte (HC)- and non-HC-derived Obs in the combined osteogenic cells of P6 and P56.
- https://cdn.elifesciences.org/articles/82142/elife-82142-fig1-data4-v2.xlsx
Figure 1—figure supplement 1
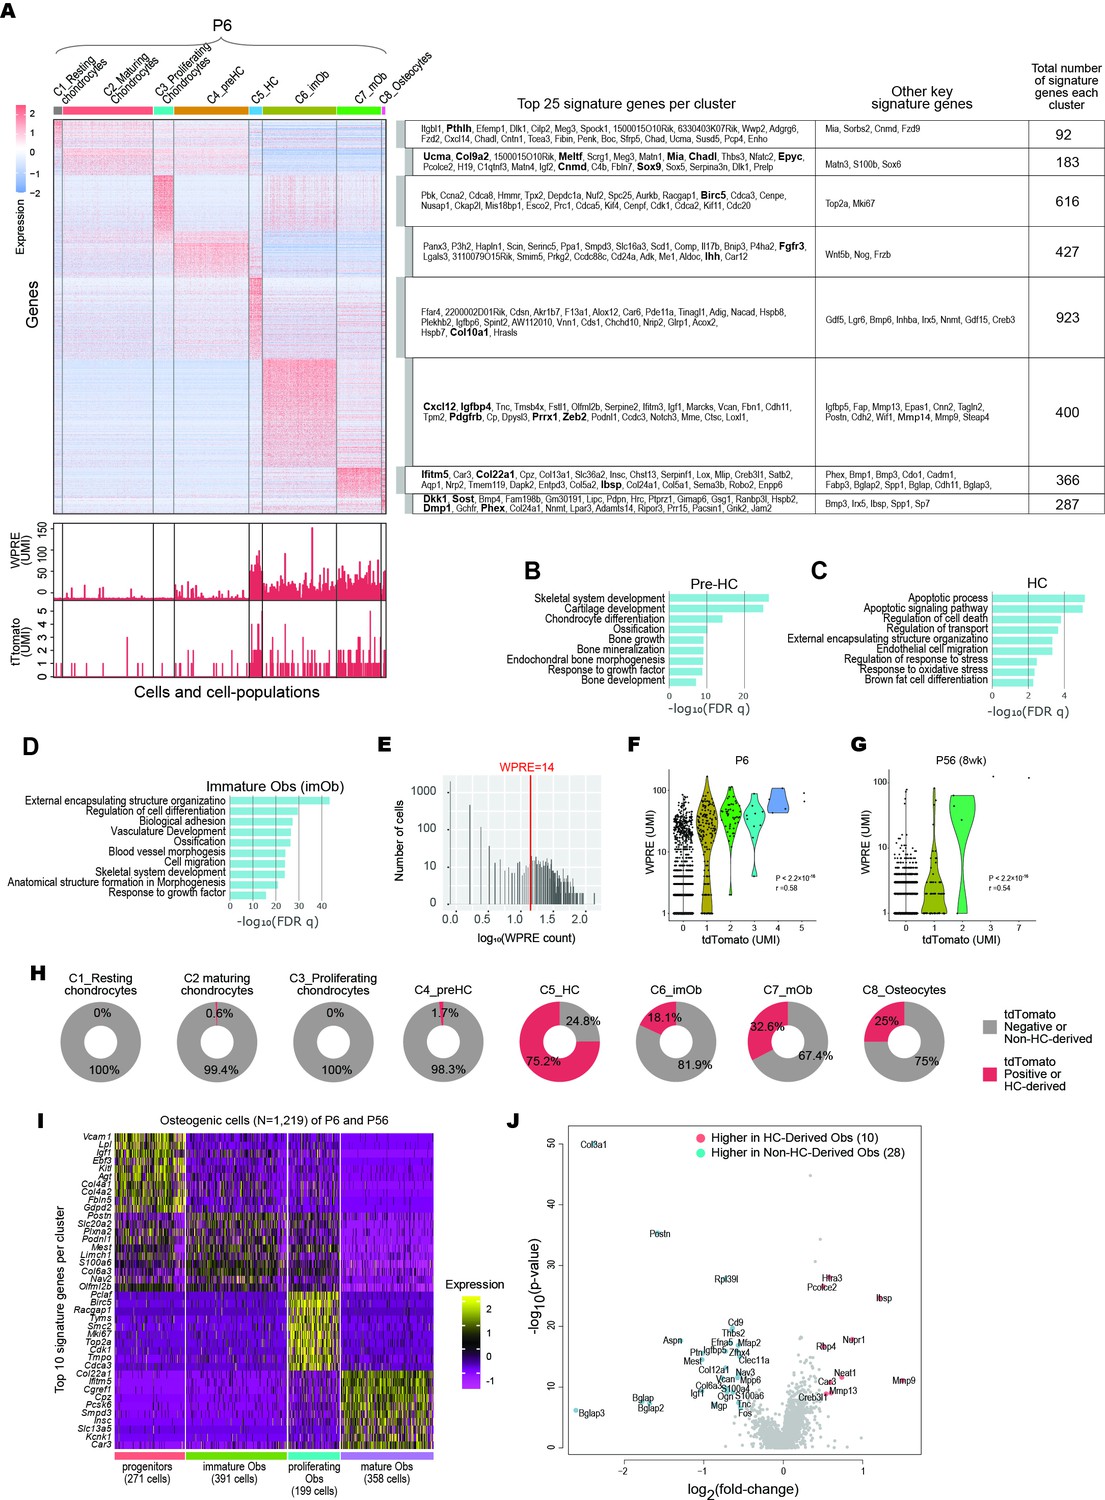
Integrative analyses of endochondral bone subpopulations at P6 and P56.
(A) Heatmap showing the signature genes of the eight-cell clusters in the P6 sample. Both the top 25 signature and certain key signature genes were listed. WPRE: Woodchuck Hepatitis Virus (WHV) Post-transcriptional Regulatory Element. (B–D) Gene Ontology analysis of significant cellular processes involved in Pre-HCs (B), HCs (C), and Immature-Obs (D). Refer to Figure 1—source data 1 for full list. (E) A histogram showing the expression level of tdTomato and WPRE per cell. An optimal cutoff at WPRE >14, above which a cell was considered HC-derived, was chosen such that it corresponds to the saddle point of the histogram. (F, G) Violin plots showing the correlation between expression levels of WPRE and tdTomato in P6 (C) and P56 (D) samples. (H) Pie charts showing the percentages of tdTomato-positive cells in each of the eight clusters in P6. For cells in the C6, C7, and C8, these will correspond to being HC-derived. (I) Heatmap showing the top 10 signature genes for each of the four osteogenic subpopulations identified in the P6 and P56 data combined (refer to Figure 1H and Figure 1 - source data 3 for full lists). (J) Volcano plot showing the differentially expressed genes (DEGs) between HC-derived and non-HC-derived Osteoblasts in the integrated data of P6 and P56. preHC: pre-hypertrophic chondrocytes; HC: hypertrophic chondrocytes; imOb: immature osteoblasts; mOb: mature osteoblasts.
Figure 2 with 2 supplements
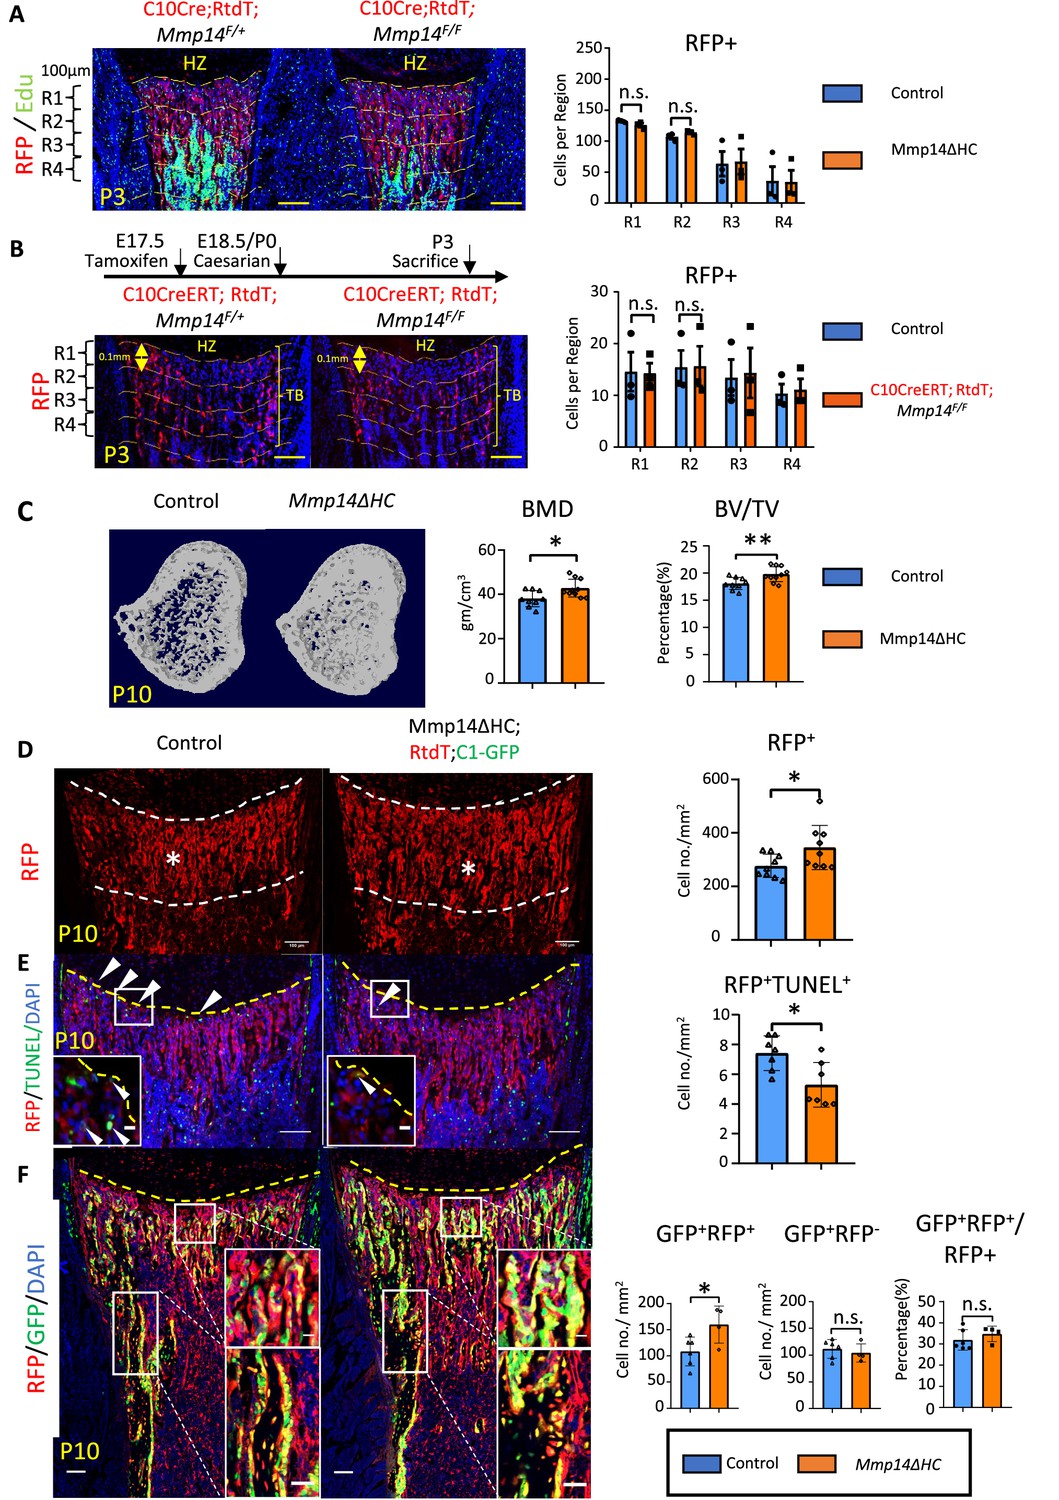
Increased osteogenesis in Mmp14ΔHC is not because of abnormal transition of hypertrophic chondrocytes (HCs).
(A) Immunofluorescence staining of RFP and Edu-labeled cells counterstained with DAPI in Mmp14ΔHC (orange bar) and control mice tibia at P3. For quantification, the trabecular bone is divided into four zones, each 0.1 mm in thickness. The number of RFP+(red) cells in each region were counted. (B) Schematic of experimental design. Tamoxifen was administered to C10CreERT;Rtdt;Mmp14F/+ and C10CreERT;Rtdt;Mmp14F/F mice at E17.5 and harvested at P3. Staining and quantification as (A). (C) Transverse image of Micro-CT analysis in Mmp14ΔHC mutants and their littermate controls at P10. Statistical analysis of bone mineral density (BMD) and bone volume over tissue volume ratio (BV/TV) using Micro-CT in Mmp14ΔHC and their littermate control (blue bar) (n = 9). The data points were pooled across multiple bone samples. (D) Representative immunofluorescence staining and quantification of tdTomato-labeled HC descendants in trabecular bone (asterisk) of Mmp14ΔHC and littermate controls at P10. White dotted line highlights the region below the chondro-osseous junction. Scale bars, 100 μm. The data represent means ± SEM. The data points were pooled across multiple bone samples (n = 7). (E), In situ terminal deoxynucleotidytransferase deoxyuridine triphosphate nick end labeling (TUNEL) assay labeling apoptotic cells and quantification in Mmp14ΔHC and control mice at chondro-osseous junction at P10 (n = 7). (F), Representative immunofluorescence staining and quantification of RFP (red), GFP (green) counterstained with DAPI (blue) marking tdTomato labeled HC descendants, GFP-labeled osteoblasts and nucleus in Mmp14ΔHC;Rtdt;C1-GFP and control littermates at P10. RFP+ GFP+ , RFP-GFP+ and ratio of GFP+ RFP+/RFP+ cells in the trabecular bone comparing Mmp14ΔHC and littermates. Mmp14F/-;C10Cre and Mmp14 F/F;C10Cre were pooled and abbreviated as Mmp14ΔHC for analysis. The data points were pooled measurements across multiple bone sections per animal. n = 4 for Mmp14ΔHC, n = 6 for control. Statistics: the data represent means ± SEM. (b, e, g, h): p values were calculated using two-tailed unpaired t-tests, *p<0.05, **p<0.01, ***p<0.001.
Figure 2—figure supplement 1

Abnormal localization of hypertrophic chondrocytes (HC) descendants in Mmp14-/- mice.
(A) Cells in cortical bone and groove of Ranvier at P10. Yellow arrow indicates megakaryocytes. Green arrow indicate endosteal bone lining cells. Black arrow indicates perichondral cells. Scale bar, 100um (B) Bright-field and fluorescence images of radius, ulna, and scapula of C10Cre;RYFP; Mmp14+/+ and C10Cre;RYFP;Mmp14-/- mice at P3. Green fluorescence label HC-derived cells. Red arrows mark chondro-osseous junction. Yellow arrow marks trabecular region. HZ represents hypertrophic zone. Scale bar, 2mm (C), Immunofluorescence staining of RFP and Edu-labeled cells counterstained with DAPI in C10Cre;RtdT;Mmp14+/+ and C10Cre;RtdT;Mmp14-/- tibia at P3. For quantification, the trabecular bone is divided into four zones, each 0.1 mm in thickness. The number of RFP+(red), RFP+ Edu+ (red and green) cells in each region were counted. Data are presented as means ± SEM **p<0.01, *p<0.05, unpaired Student’s t-test. (D), Immunostaining of endomucin (Endo) labeling blood vessels below chondro-osseous junction comparing wild-type (yellow bar)and Mmp14-/-(green bar) mice at P3. The vascular density and number of Ecmn cells are presented (n = 9). Data are presented as means ± SEM **p<0.01, *p<0.05, unpaired Student’s t-test. HZ, hypertrophic zone; TB, trabecular bone.Scale bar, 100um.
Figure 2—figure supplement 2
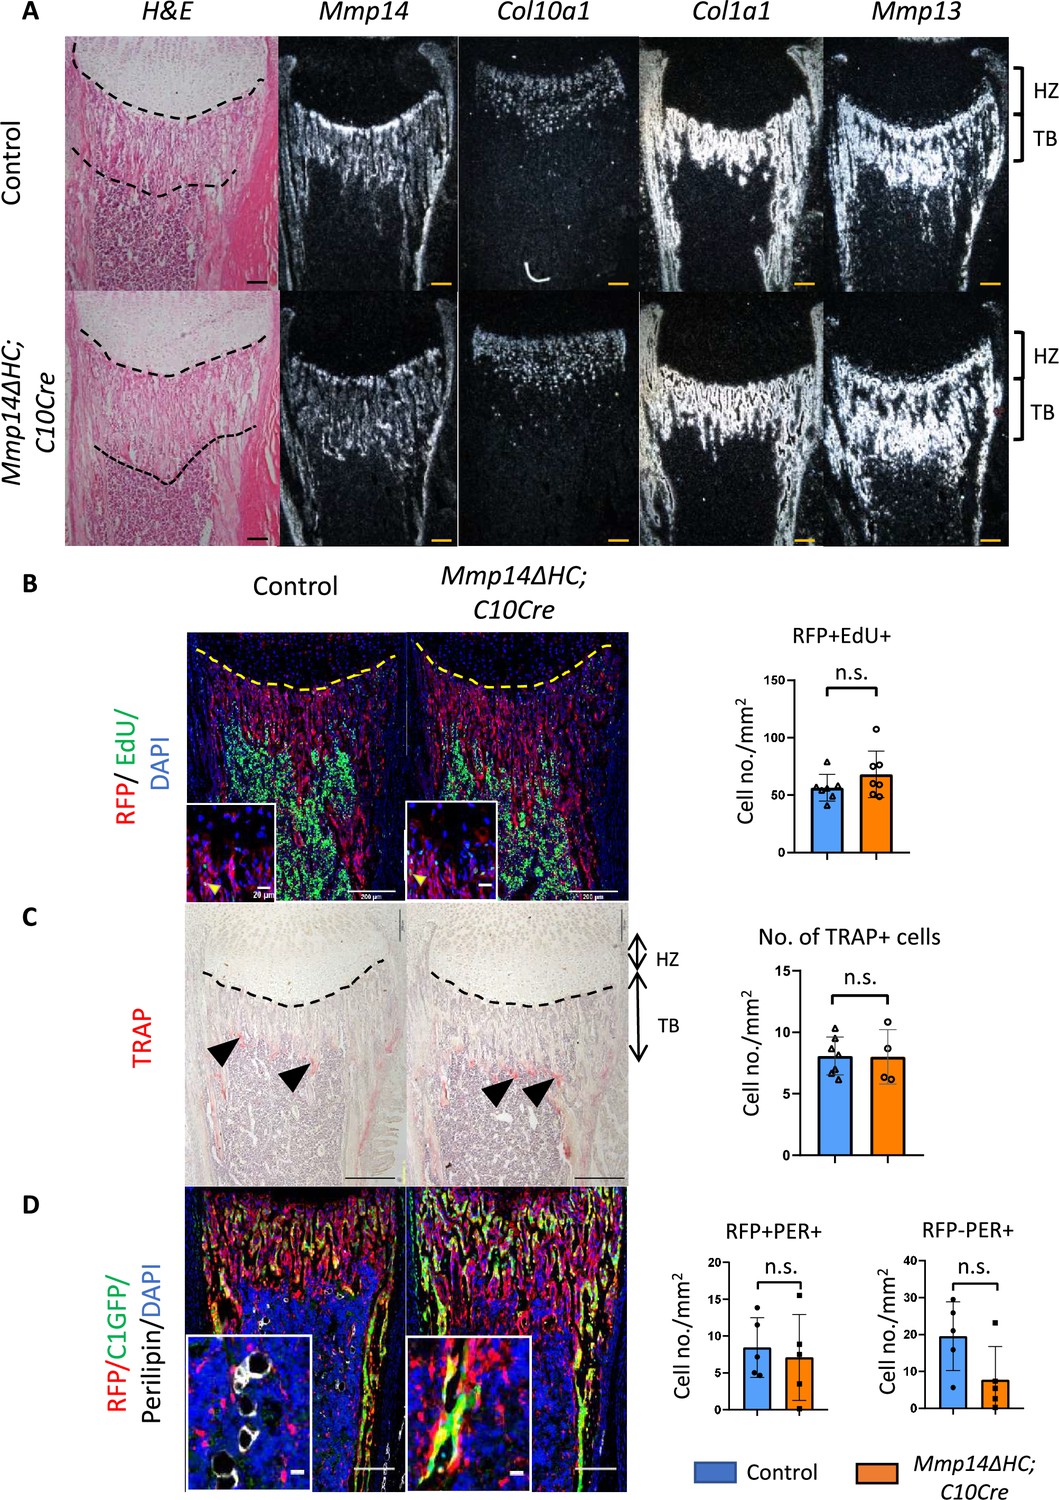
Molecular characterization of skeletal phenotype in Mmp14ΔHC mice.
(A) H&E staining and in situ hybridization of Col10a1, Col1a1, Mmp13, Mmp14 in Mmp14ΔHC and control mice at P10. White signals marks mRNA expression of corresponding genes. HZ, hypertrophic zone; TB, trabecular region. Scale bar, 50um(B) Edu labeling assay in Mmp14ΔHC and control mice. Hypertrophic chondrocytes (HC) descendants, nucleus, and proliferating cells were labeled with RFP (red), DAPI (blue), and Edu (green). (C) Tartrate-resistant acid phosphatase (TRAP) staining comparing Mmp14ΔHC and control mice. Black arrows mark TRAP+ cells. HZ, hypertrophic zone; TB, trabecular bone. Counting of TRAP+ cells suggests the number of osteoclasts are not significantly affected in the mutants (n = 6 for control, n = 4 for Mmp14ΔHC mutants). (D) Immunofluorescence staining of RFP, Perilipin, GFP, and DAPI labeling tdTomato (red), adipocytes (white), osteoblasts (green), and nucleus at P10. Quantitation of RFP+ PER+ , RFP-PER+, and PER+ cells at distal tibia comparing Mmp14ΔHC mutants and control at P10. Unpaired Student’s t-test are used for PER+ RFP and PER+ RFP+ and cells. Quantitation is shown in (n = 5) (p<0.05).
Figure 3 with 1 supplement
PTH1R is a substrate of MMP14.
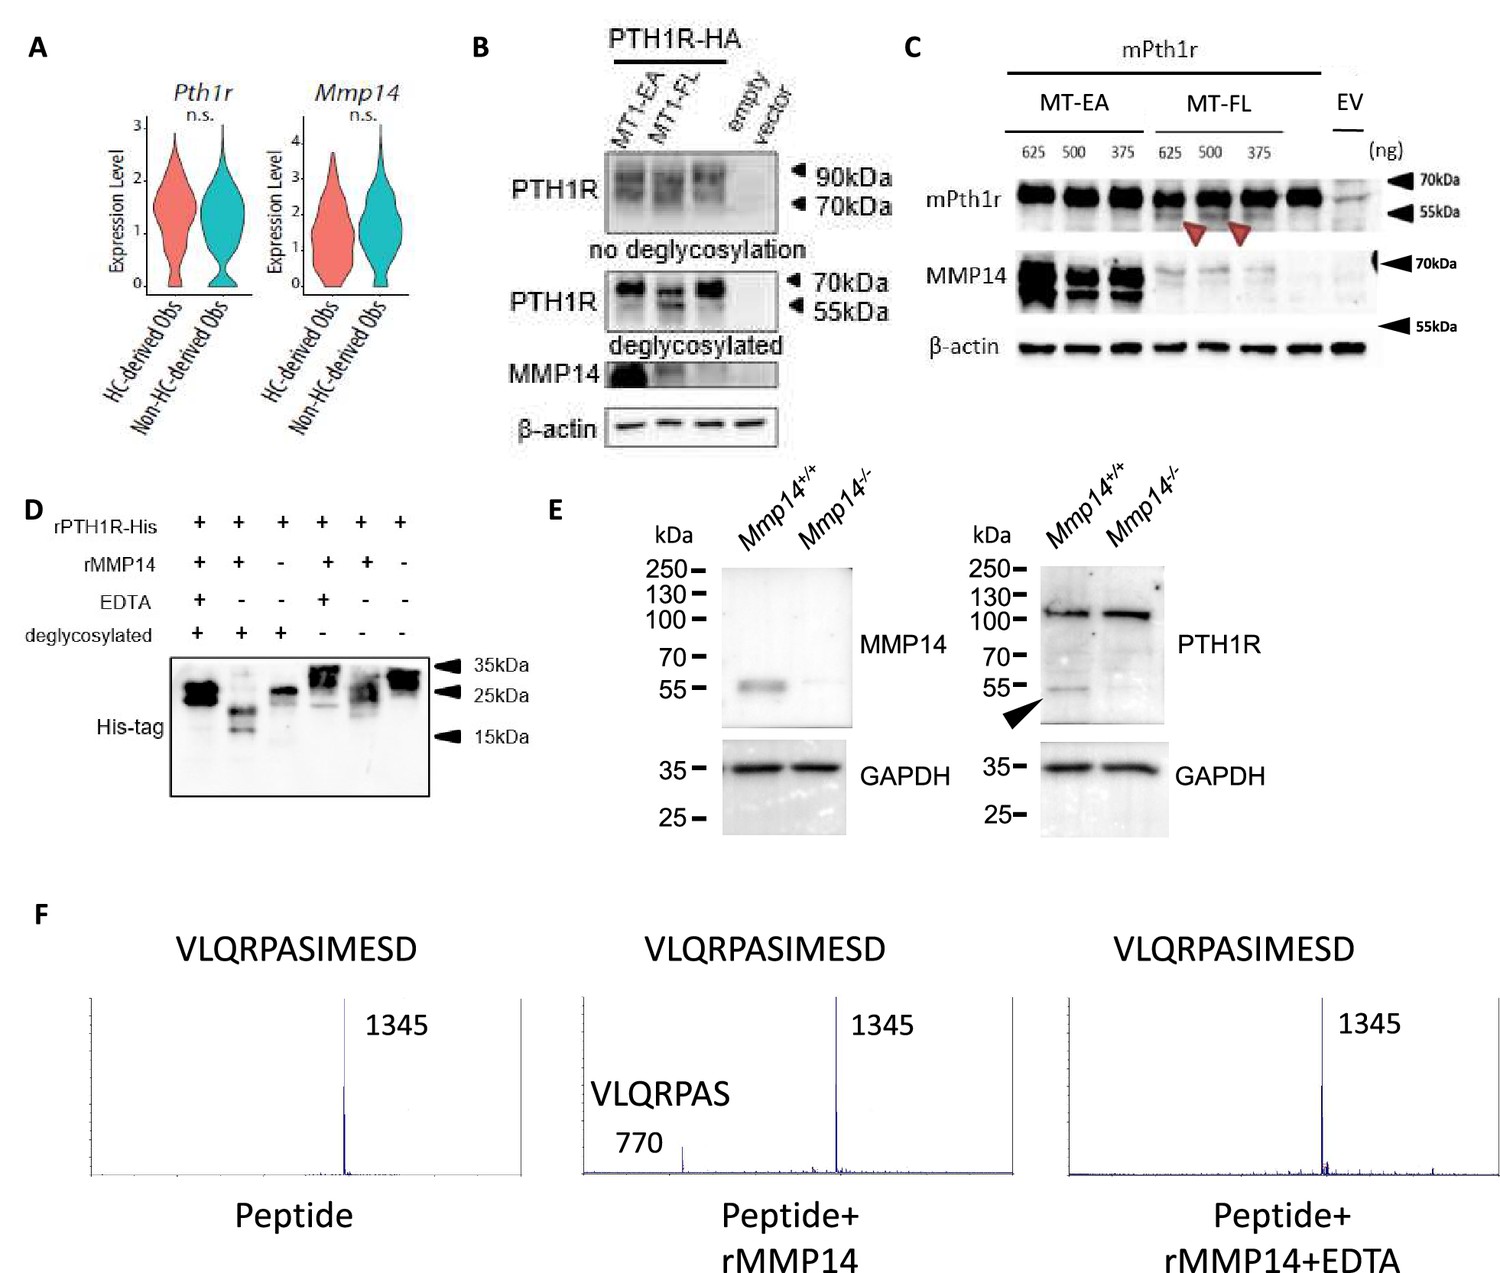
(A) Violin plots showing the expression levels of Pth1r and Mmp14 in the hypertrophic chondrocytes (HC)-derived and non-HC-derived osteoblasts. n.s., not significant. (B) HEK293T cells expressing HA-tagged human PTH1R were transfected with either WT (MT1- FL) or E/A catalytic inactive mutant MMP14 (MT1 EA). β-Actin is used as a loading control. Image representative of three independent experiments. (C) HEK293T cells expressing mouse Pth1r (without HA-tag) were transfected with either WT(MT1-FL) or E/A catalytic inactive mutant MMP14 (MT1-EA). Mouse Pth1r was deglycosylated, detected with anti-PTH1R antibody and β-actin is used as a internal loading control. Images are representative of three independent experiments. (D) His-tagged rPTH1R-ECD was incubated with recombinant catalytic domain of MMP14 (lanes 1, 2, 4, 5) with EDTA (lanes 1, 4), and with (lanes 1–3) and without (lanes 4–6) deglycosylation. Western blotting analyses used specific antibodies as indicated. Data are representative of three independent experiments. His-tagged rPTH1R-ECD was incubated with recombinant catalytic domain of MMP14 at two enzyme/substrate ratios (rPTH1R-ECD only, 1:50, 1:10, and 1:10 with EDTA). The protein mixture were deglycosylated (left panel). (E) Western blots showing cleaved fragment of PTH1R in trabecular bone extracts from Mmp14+/+(left lane) and Mmp14-/-(right lane) mice at P14. (F) Synthetic peptide from extracellular domain of PTH1R 55–67 was incubated with recombinant MMP14. The presence of 770 Da suggests a fragment of VLQRPAS.
-
Figure 3—source data 1
Contains raw uncropped western blot gel photos of Figure 3 and Figure 3—figure supplement 1.
- https://cdn.elifesciences.org/articles/82142/elife-82142-fig3-data1-v2.zip
Figure 3—figure supplement 1
MMP14 is a major protease for PTH1R.
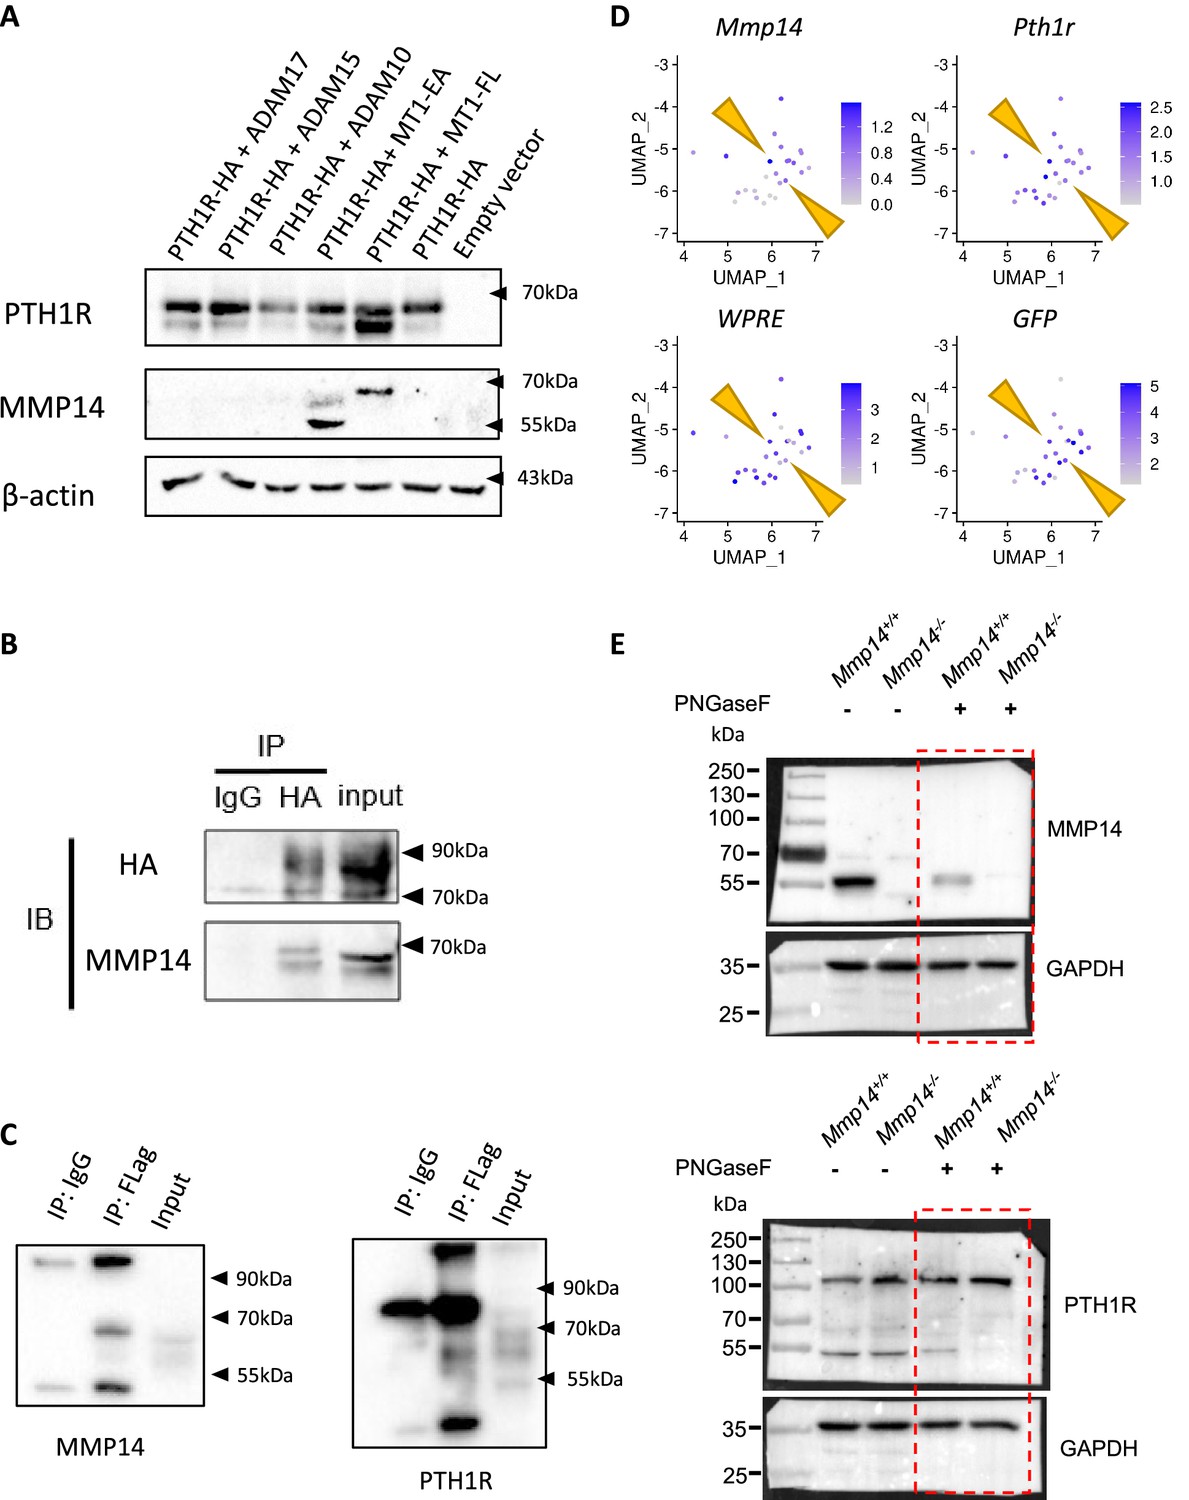
(A) Western blot of HEK293T cells transfected with human PTH1R-HA, MT1-FL, MT1-EA, ADAM10, ADAM15, and ADAM17. (B) Co-immunoprecipitation of MMP14 with PTH1R in HEK293T cells transfected with MT1-FL and PTH1R-HA. PTH1R-HA was immunoprecipitated with anti-HA antibody in G-agarose. (C) Cell lysate from HEK293T cells transfected with PTH1R-HA, MMP14-Flag were immunoprecipitated with anti-Flag-tag antibody and analyzed by western blot. (D) FeaturePlot showing expression of Mmp14, Pth1r, WPRE (mRNA transcripts co-expressed with tdTomato), and GFP from C1-GFP using isolated cells from P56. Yellow arrow indicates cells expressing Mmp14, Pth1r, tdtomato, and GFP. (E) Uncropped western blots showing truncation of PTH1R treated with PNGaseF in Mmp14+/+ (lane 3) compared to Mmp14-/- (lane 4).
Figure 4 with 1 supplement
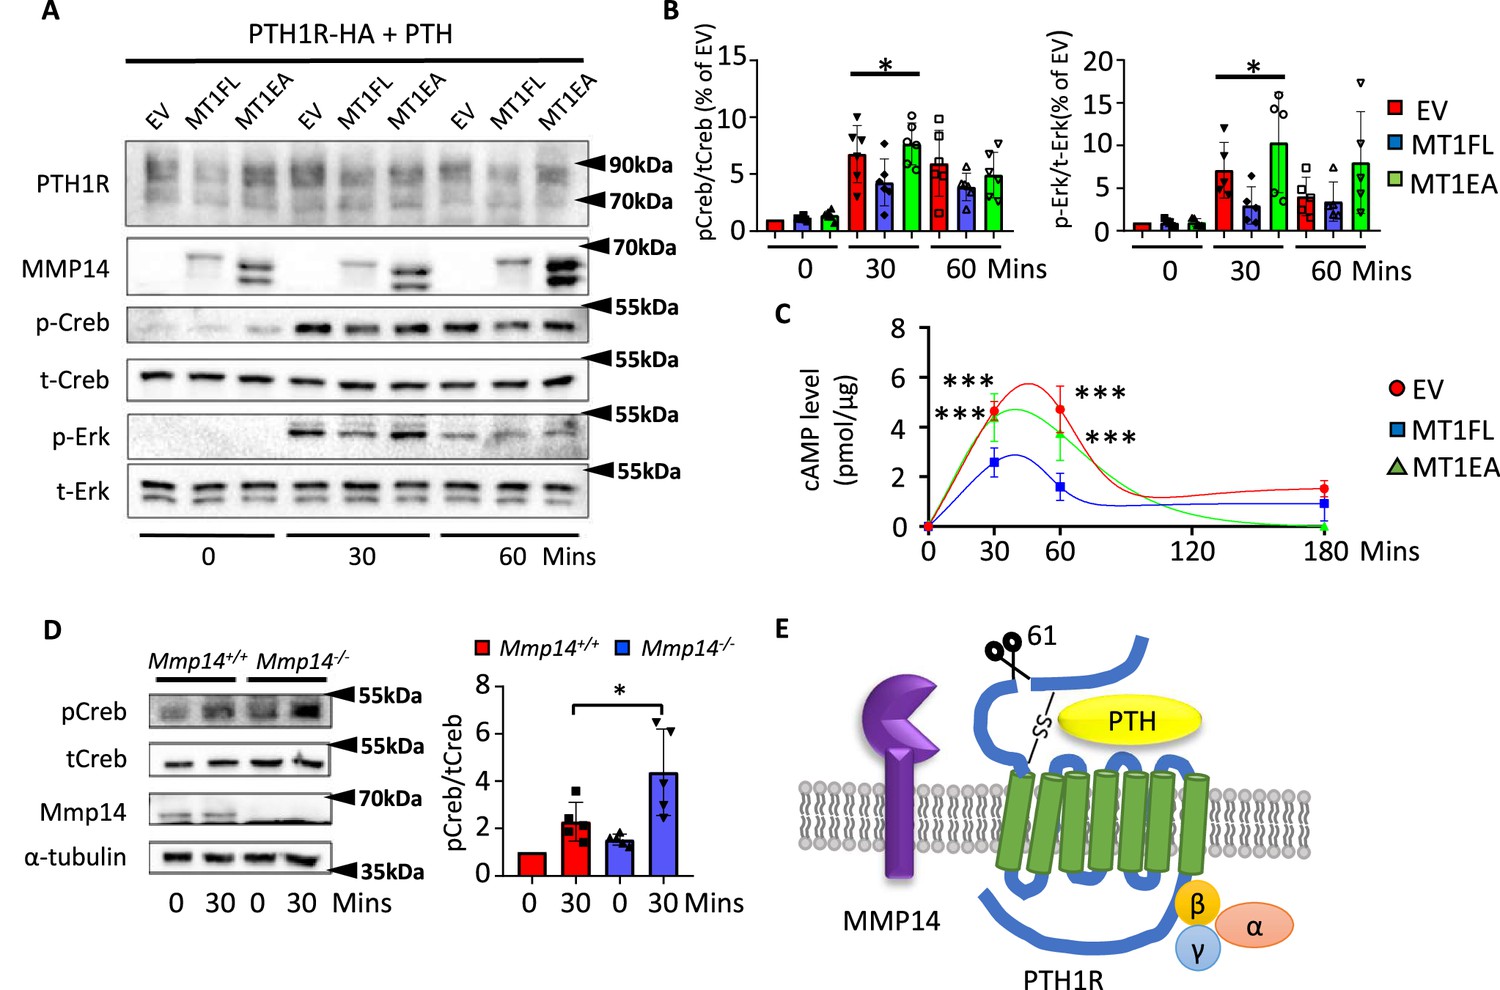
MMP14 inhibits PTH signaling.
(A), MMP14 can inhibit PTH signaling in HEK293 cells. HEK293 cells stably expressing PTH1R-HA were transfected with empty vector (EV), MMP14 (MT1-FL), and catalytic inactive MMP14 (MT1-EA). Cells were challenged with 1 × 10⁻⁷M PTH in vitro for 0, 30, and 60 min. PTH1R, MMP14, phospho-CREB (p-CREB), total-CREB (t-CREB), phosphor-Erk, total-Erk, and loading control β-actin were analyzed by western blotting. (B) Relative level of p-CREB/t-CREB and p-Erk/t-Erk was quantitated and measured using ImageJ (n = 6 for p-CREB/t-CREB and n = 5 for p-Erk/t-Erk). One-way ANOVA followed by unpaired t Welch’s correction was used to determine statistical significance. Data are presented as means ± SEM. **p<0.01, *p<0.05. (C) HEK 293 cells expressing PTH1R were challenged with PTH for 30, 60, and 180 min and the level of cAMP with MT1-FL, MT1-EA, or empty vector were measured (n=5). One-way ANOVA followed by unpaired t Welch’s correction was used to determine statistical significance. (D) Trabecular osteoblasts extracted from Mmp14+/+ (red bar) and Mmp14-/- (blue bar) mice were challenged with 1 × 10⁻⁷ M PTH(1–34). Cell lysate were analyzed by western blotting for p-CREB and t-CREB level (left). Right: quantification of relative level of p-CREB/t-CREB in trabecular osteoblasts extracted from Mmp14+/+ and Mmp14-/- mice (n = 5). Data are presented as means ± SEM. **p<0.01, * p<0.05, unpaired t-test. (E) Schematic diagram showing MMP14 cleaves PTH1R at amino acid 61. Seven-pass transmembrane domains are in green. PTH1R transduces signals via G-protein complex α, β, γ.
-
Figure 4—source data 1
Contains raw uncropped western gel photos for Figure 4 and Figure 4—figure supplement 1.
- https://cdn.elifesciences.org/articles/82142/elife-82142-fig4-data1-v2.zip
Figure 4—figure supplement 1
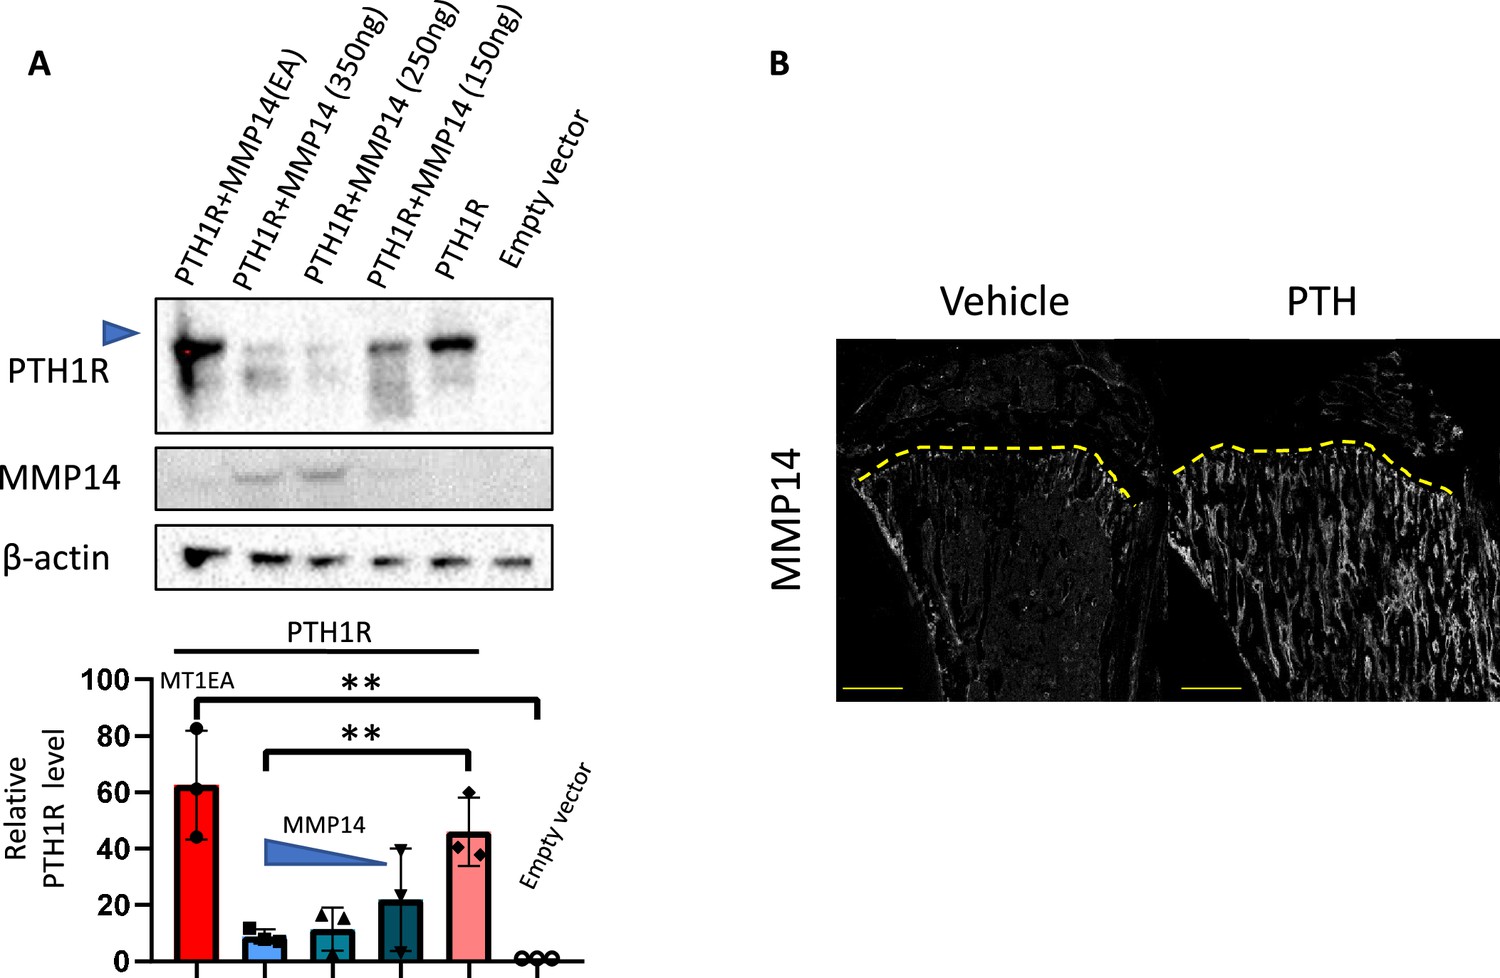
MMP14 destabilize PTH1R and can be upregulated by PTH.
(A) Relative level of PTH1R in HEK293T cells co-transfected with empty vector, MMP14 and MMP14-EA. (B) Immunofluorescence staining of MMP14 in P56 mice treated with vehicle (left) and PTH(1–34).
Figure 5
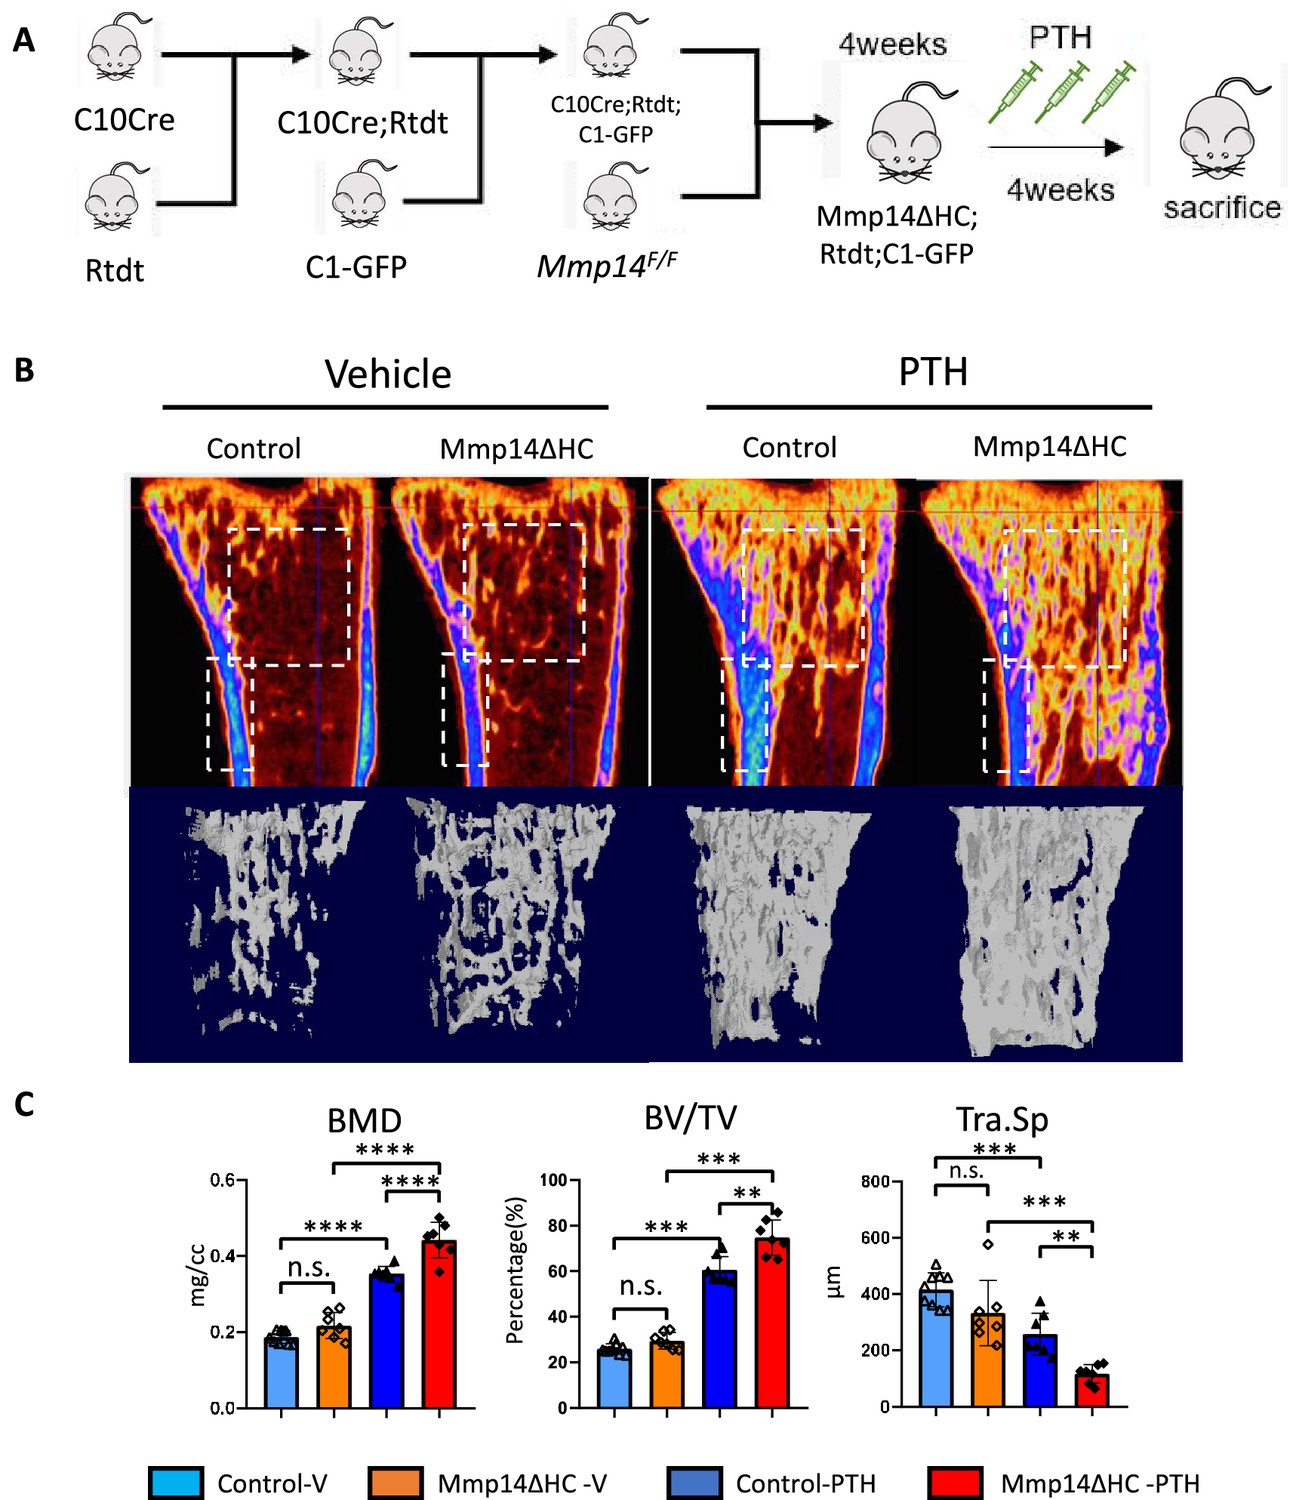
Increased anabolic response of hypertrophic chondrocyte (HC)-derived osteoblasts to PTH treatment in Mmp14ΔHC mice.
(A) Schematic diagram showing experimental design for generation of Mmp14ΔHC;Rtdt;C1-GFP mice for teriparatide treatment. (B) Sagittal and reconstructed 3D image of micro-CT of control and Mmp14ΔHC mice treated with vehicle and PTH(1–34) for 1 month starting from P28 for five injections per week. (C) Statistical analysis of bone mineral density (BMD), bone volume over tissue volume ratio (BV/TV), and trabecular separation (Tra.Sp.) using Micro-CT in control (blue [n = 9] and deep blue [n = 7] bars) and Mmp14ΔHC (orange [n = 7] and red [n = 7] bars), mice treated with vehicle (blue and orange) and PTH(1–34) (deep blue and red), for 1 month. Data are presented as means ± SEM. **p<0.01, *p<0.05, One-way ANOVA followed by unpaired t Welch’s correction was used to determine statistical significance. Control samples were pooled from mice of following genotypes: Col10a1Cre/+;Mmp14F/+;Rosa26LSL-tdTomato/LSL-tdTomato;C1-GFP and Col10a1Cre/+;Mmp14F/+;Rosa26LSL-tdTomato/LSL-tdTomato and Col10a1+/+;Mmp14F/+;Rosa26LSL-tdTomato/LSL-tdTomato;C1-GFP. Mmp14ΔHC samples were from Col10a1Cre/+;Mmp14F/-;Rosa26LSL-tdTomato/LSL-tdTomato;C1-GFP mice.
Figure 6 with 1 supplement
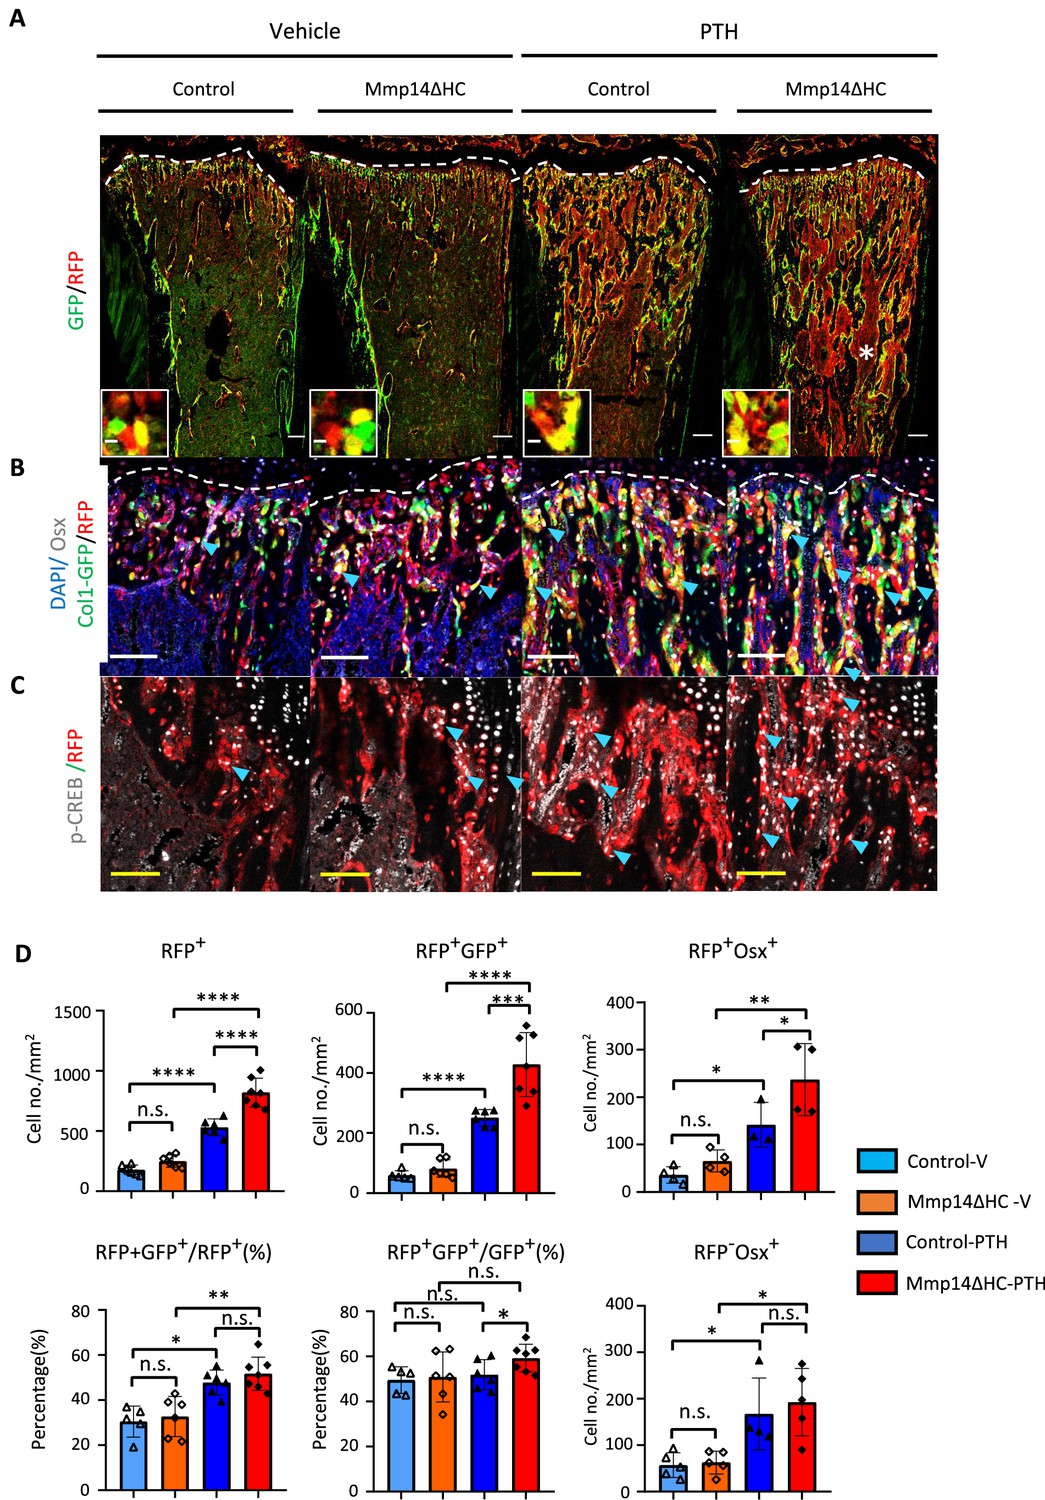
MMP14 controls expansion of chondrocyte descendants after PTH treatment.
(A) Representative immunofluorescence staining of GFP (green) and RFP (red), marking hypertrophic chondrocytes (HC)-descendants and osteoblasts, respectively. Mmp14ΔHC mutant mice (8 weeks) and their littermate controls were treated with vehicle or PTH(1–34) for 4 weeks. Yellow dotted line demarcates chondro-osseous junction. Scale bar 50 μm. (B) Fluorescence colours mark nuclei, pre-osteoblasts, and HC-descendants as for Figure 2. Scale bar 100 μm. (C) Representative immunofluorescence staining of phospho-CREB (pCREB [gray] and RFP [red]). Scale bar 100 μm. (D) Quantification of cell number/mm2: RFP+ (HC descendants); RFP+ GFP+ (mature HC-derived Osteoblasts); RFP+ Osx+ (HC-derived pre-osteoblasts), ratio of RFP+ GFP+ /RFP+ cells, ratio of RFP+ GFP+/GFP+ cells, number of RFP+ Osx+ and number of RFP-Osx+ cells in control (blue and deep blue) and Mmp14ΔHC (orange and red) mice (n = 5). The data represent means ± SEM. p-Values were calculated using one-way ANOVA followed by unpaired t Welch’s correction. Statistical significance of RFP+GFP+/GFP+ ratio is analyzed by Student’s t-test (*p<0.05). The data points were pooled across multiple bone samples.
Figure 6—figure supplement 1
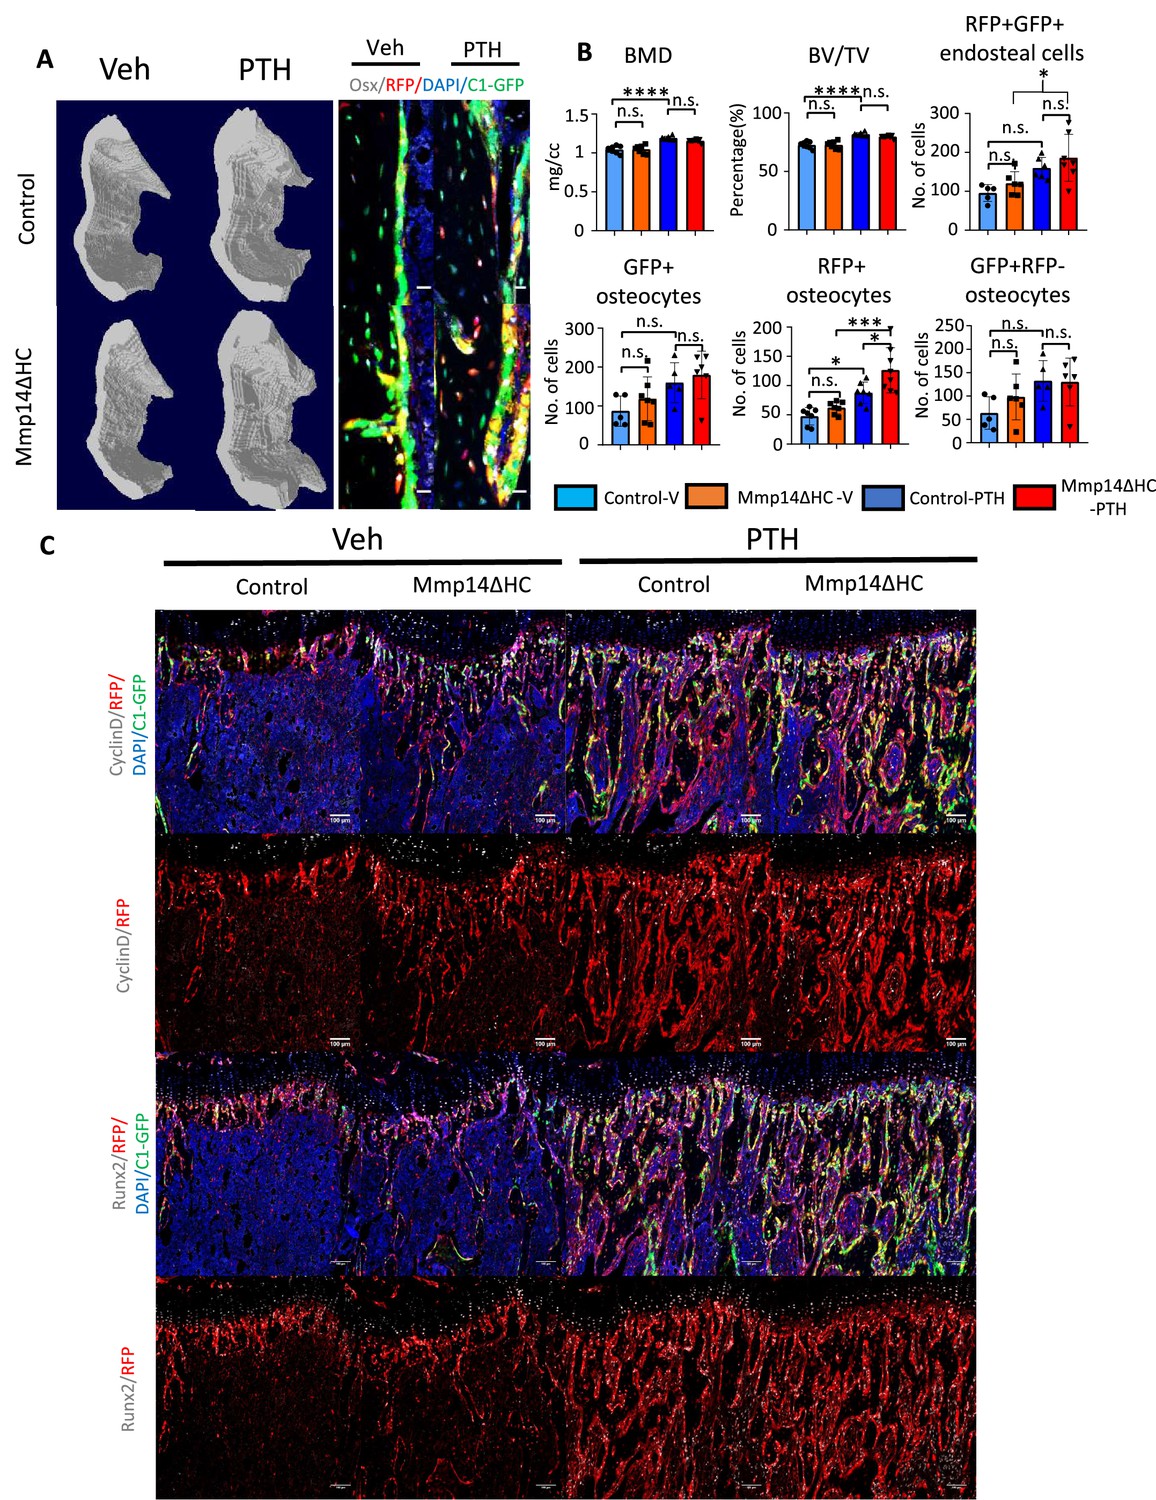
Differential response to PTH in cortical osteocytes compared to trabecular osteoblast.
(A) Transverse images of cortical bone via microCT reconstruction in Control and Mmp14ΔHC mice treated with vehicle and PTH(1–34). Representative immunofluorescence images of OSTERIX, RFP, GFP, and DAPI in cortical region are presented. (B) Quantitation of BMD, BV/TV in the cortical region as indicated in (A). Quantitation of RFP+ GFP+ , RFP+, RFP-GFP+ osteocytes and endosteal RFP+ cells. *p<0.05, **p<0.01, ***p<0.001 by one-way ANOVA followed by Turkey’s post hoc test was used to determine statistical significance. (C) Representative immunofluorescence images of CyclinD, Runx2, RFP, GFP, and DAPI in trabecular region are presented.
Figure 7 with 1 supplement
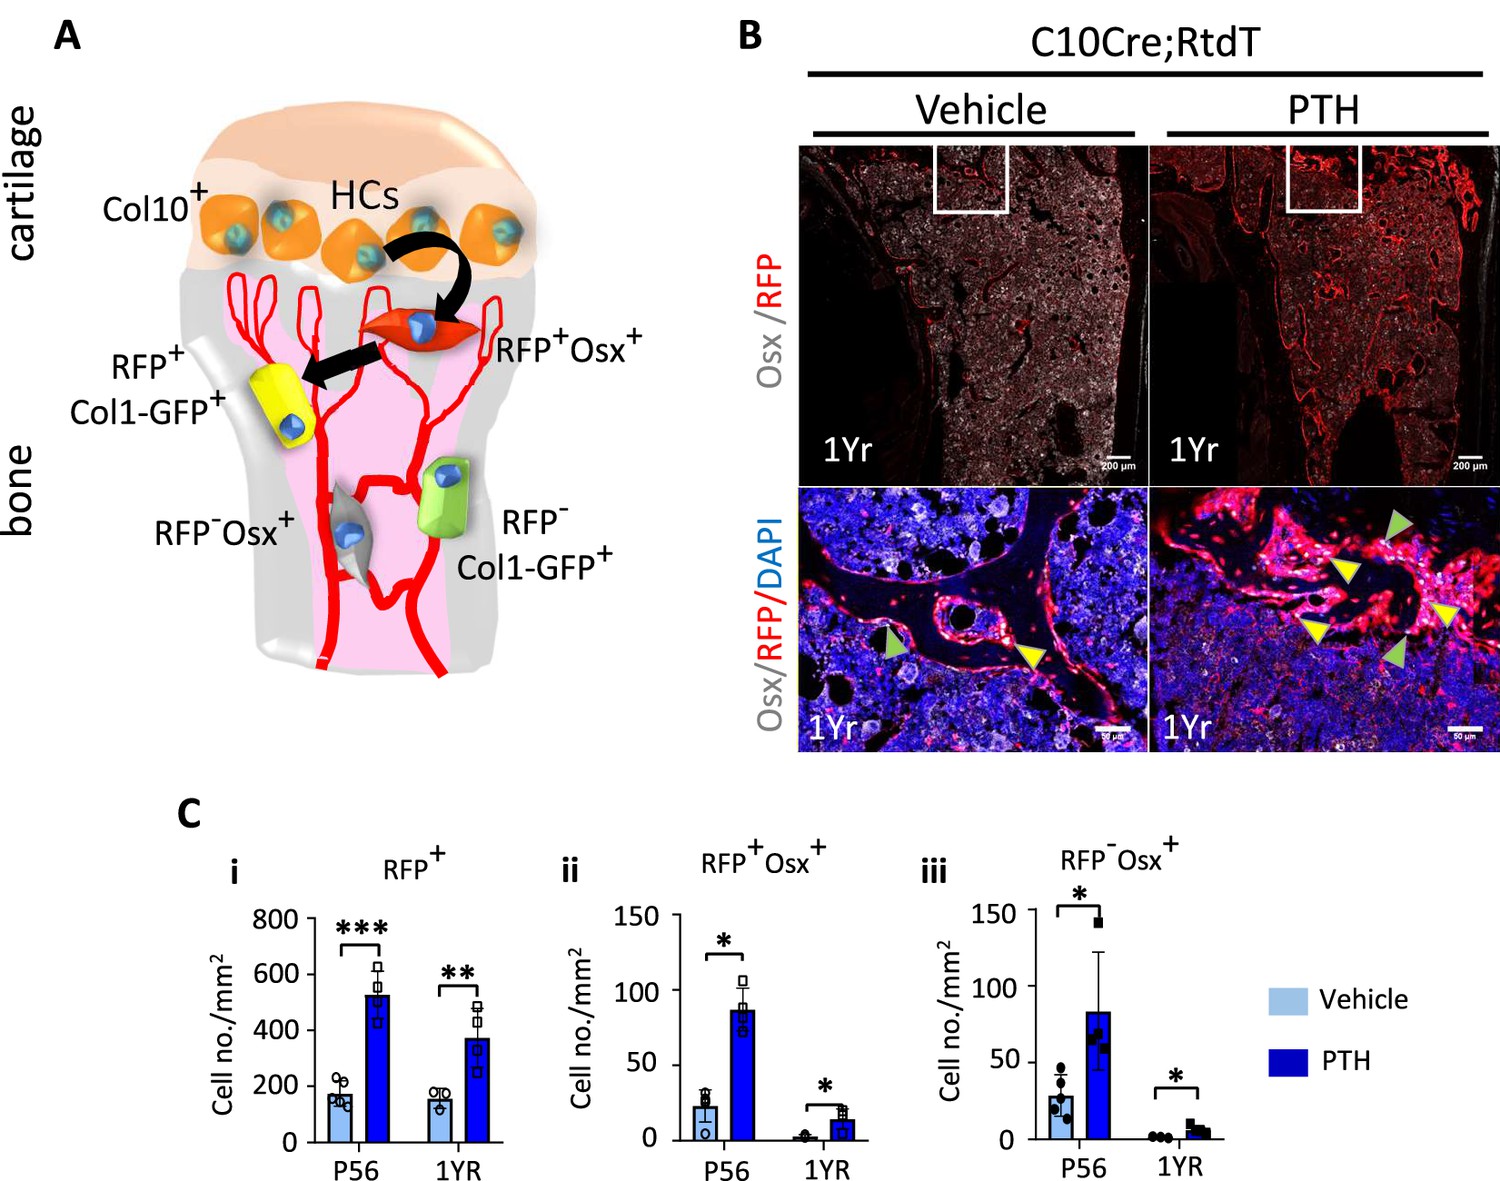
Hypertrophic chondrocyte (HC) descendants persists in trabecular bone and contribute to PTH response in ages adult mice.
(A) Schematic diagram showing ontogeny of HC-derived and non-HC-derived osteogenic cells and their markers. (B) Immunofluorescence staining of DAPI (blue), Osterix (gray), and RFP (red) for marking cell nuclei, pre-osteoblasts, and HC-descendants, respectively. Mice were treated with vehicle or PTH(1–34) for 4 weeks at five injections per week starting from 1 year old. Magnified picture of at the trabecular bone (white box) is also presented. Yellow arrows mark HC-derived pre-osteoblasts. (C) P56 and 1-year mice treated with PTH: (i–iii) quantification of number/mm2 of RFP+ cells, RFP+ Osx+ cells, RFP-Osx+ cells (n = 3). Data are represented as mean ± SEM. p-Values were calculated using two-tailed unpaired t-test, *p<0.05, **p<0.01, ***p<0.001. Data points were pooled measurements across multiple bone sections per animal.
Figure 7—figure supplement 1

Expression of Mmp14 in hypertrophic chondrocyte (HC)-derived cells in 1-year-old mice.
(A) Representative immunofluorescence images of RFP (red), Mmp14 (green), and DAPI (blue) in trabecular region from 1-year-old control mice before (left) and after PTH induction (right column). Scale bar = 100 µm, 20 µm.
Figure 8
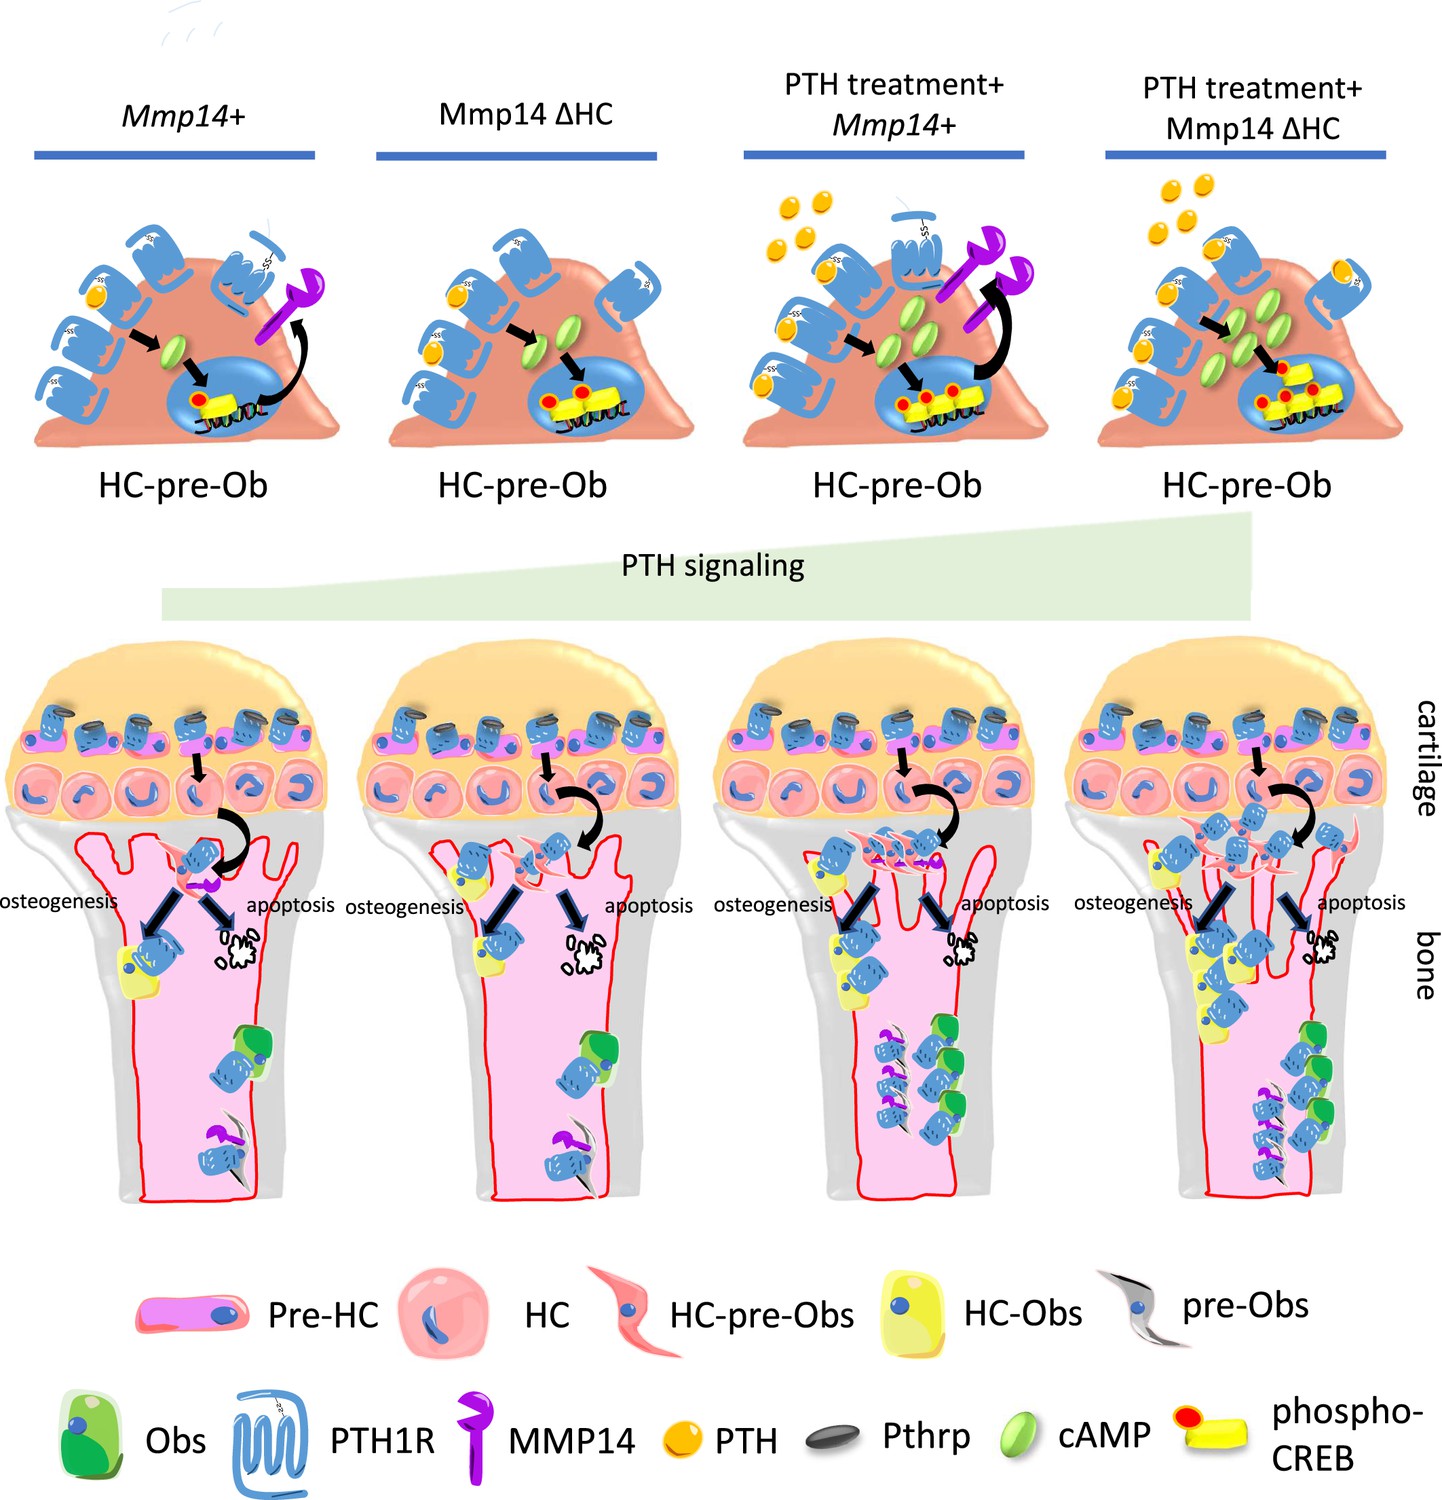
Model of MMP14 moderation of PTH signaling intensity and osteogenesis.
Upon PTH binding, PTH1R generates cAMP signals to activate cAMP response element binding protein (CREB). Activation of PTH1R causes upregulation of MMP14. MMP14 in turn cleaves PTH1R to inhibit its signaling activity. In the chondrocyte lineage, pre-hypertrophic chondrocytes (pre-HC) differentiate to hypertrophic chondrocytes (HCs), translocate to the subchondral space, and subsequently to HC-pre-osteoblasts contributing to trabecular, endosteal and endocortical bone and can respond to PTH treatment. Together, MMP14 moderates the HC derivatives’ response to PTH ensuring a controlled supply of osteoblast precursors and thereby bone anabolism. Obs, osteoblasts; PHZ, hypertrophic zone; HZ, hypertrophic zone; TB, trabecular bone.
Additional files
-
MDAR checklist
- https://cdn.elifesciences.org/articles/82142/elife-82142-mdarchecklist1-v2.pdf
-
Supplementary file 1
List of antibodies and probes.
- https://cdn.elifesciences.org/articles/82142/elife-82142-supp1-v2.pdf
Download links
A two-part list of links to download the article, or parts of the article, in various formats.
Downloads (link to download the article as PDF)
Open citations (links to open the citations from this article in various online reference manager services)
Cite this article (links to download the citations from this article in formats compatible with various reference manager tools)
MMP14 cleaves PTH1R in the chondrocyte-derived osteoblast lineage, curbing signaling intensity for proper bone anabolism
eLife 12:e82142.
https://doi.org/10.7554/eLife.82142


