Tracking multiple conformations occurring on angstrom-and-millisecond scales in single amino-acid-transporter molecules
- Department of Physiology, Perelman School of Medicine, University of Pennsylvania, United States
Figures
Figure 1 with 1 supplement
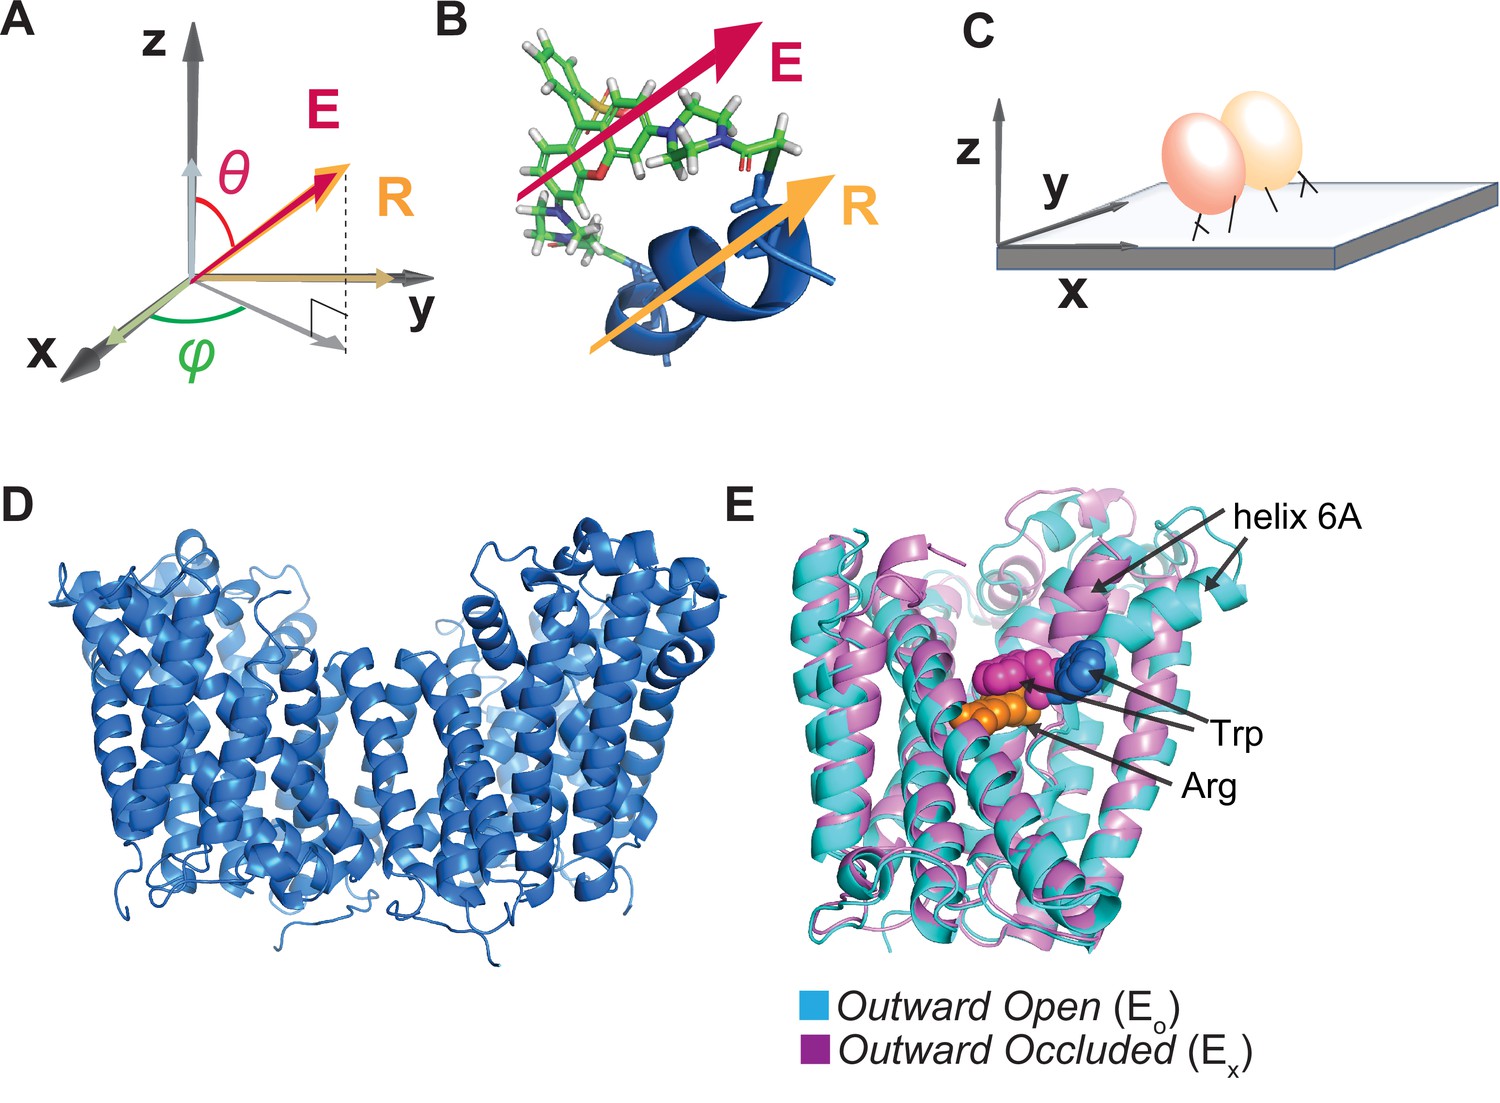
Illustration of the attachment of fluorophore to the AdiC protein and the protein to a glass surface.
(A, B) The orientation of the fluorophore dipole, defined in in terms of θ and φ, can be directly related to that of the alpha helix (A), to which bifunctional rhodamine is attached via two mutant cysteine residues (B) where both orientations of the fluorophore dipole and the helix are indicated by the respective arrows. (C) Cartoon illustrating the attachment of an AdiC molecule to a streptavidin-coated coverslip glass via a biotin moiety covalently linked to the N-terminus and two streptavidin-binding tags fused to the N- and C-termini in each of its two subunits, totaling six available sites for binding to streptavidin molecules. (D) Structure of AdiC shown as a dimer (PDB: 7O82). (E) Spatially aligned structures of EO and EX states of AdiC shown with a single subunit (PDB: 3OB6, 3L1L). Helix 6, chosen as a labeling site, is indicated in either structure. The substrate Arg+ (orange) and a Trp residue external to it in the two states (blue and purple) are represented using space-filling models.
Figure 1—figure supplement 1
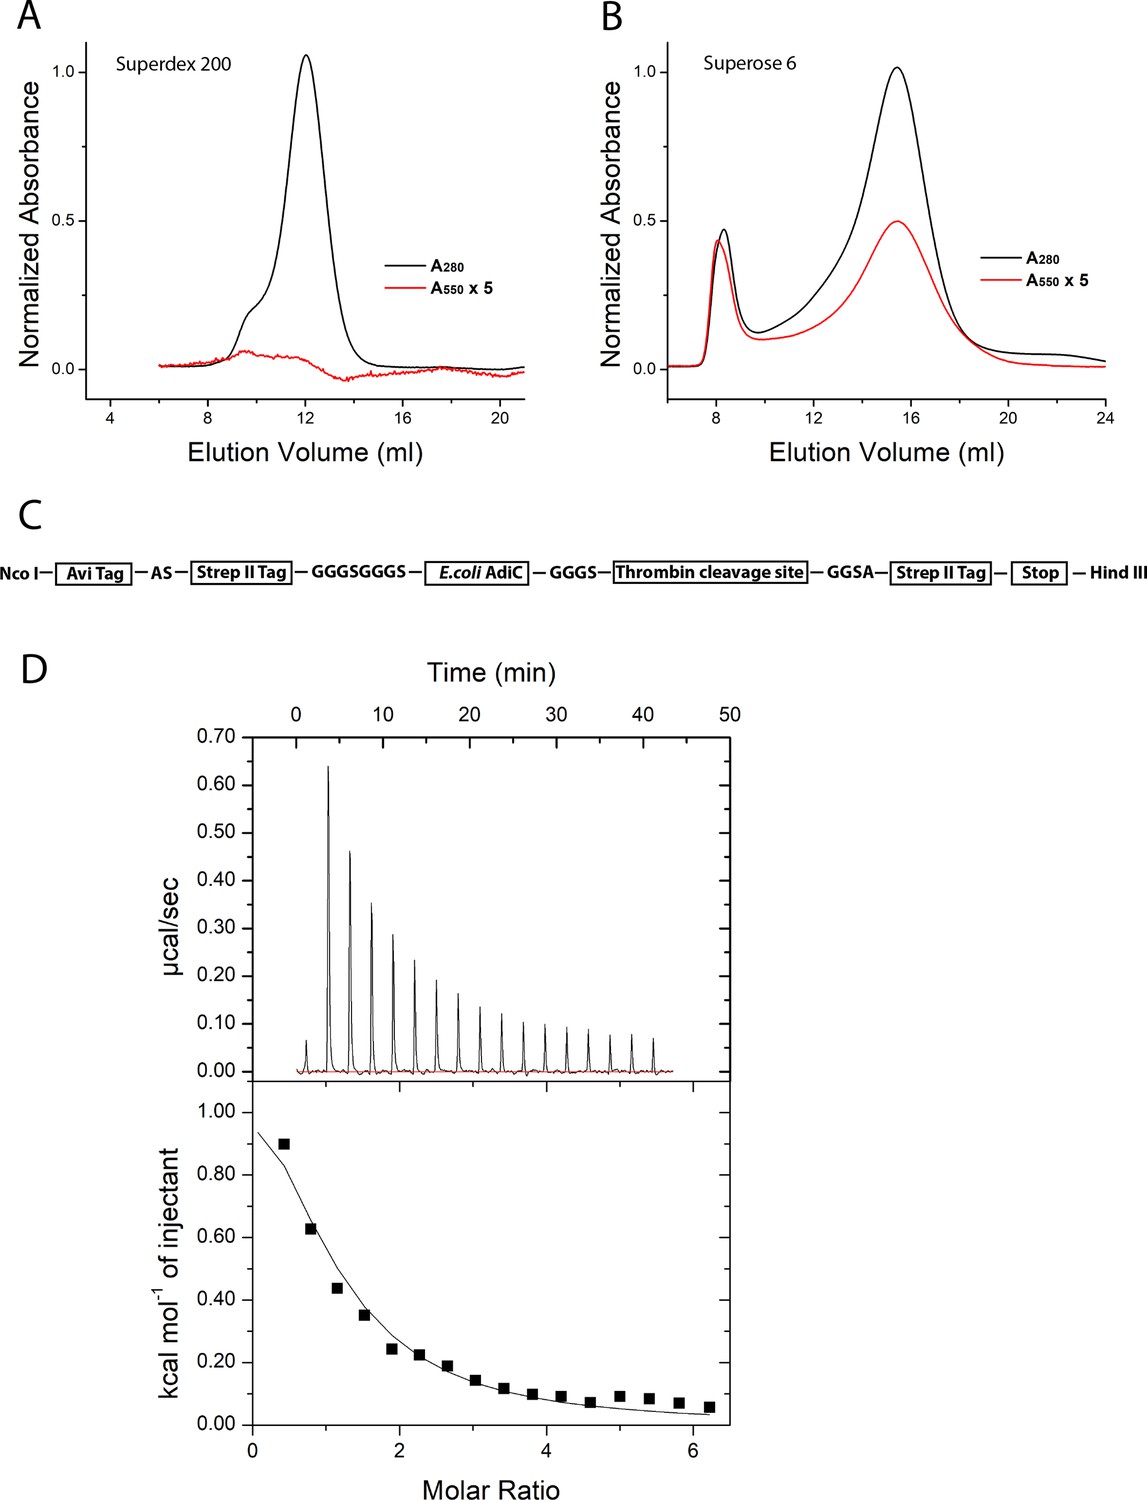
Gel filtration chromatography and ITC profiles.
(A, B) Size-exclusion chromatography profiles of AdiC protein without (A; Superderx 200 10/300 column) and with (B; Superose 6 10/300 column) the G188C-S195C double cysteine mutations. The elution profiles were monitored simultaneously at 280 nm (black) and 550 nm (red) wavelength. For each panel, A or B, the black and red traces were first scaled to the maximum of black trace, and for ease of visualization, the red trace was magnified fivefold after the scaling.(C) Illustration of the sequences attached to the AdiC protein. The N-ternimus was fused with an Avi tag and a Strep II tag, whereas the C-terminus was fused with a thrombin cleavage recognition sequence and a Strep II tag. The residues in the four spacer sequences are shown in capitol letters. The cDNA construct was inserted into pET28(b) vector between the Nco I site and Hind III site. (D) ITC of the protein resulting from the cDNA construct genetically engineered for the present purpose. The titration profile is shown at the top and the heat exchange is plotted below against the molar ratio of Arg+ to the subunit of AdiC. The Kd value is 104 µM for 1:1 binding. During the titration using a MicroCal iTC 200 system (25°C), the sample cell was loaded with a solution containing 0.14 mM purified protein sample, 100 mM NaCl, 1 mM DDM, and 50 mM HEPES titrated to pH 7.5, whereas the syringe was loaded with a solution containing 5 mM Arg+, 100 mM NaCl, and 50 mM Hepes titrated to pH 7.5. The volume of the first injection was 0.4 µl, and those of the subsequent 16 successive injections were all 2 µl.
-
Figure 1—figure supplement 1—source data 1
Data for gel filtration chromatography and ITC profiles.
- https://cdn.elifesciences.org/articles/82175/elife-82175-fig1-figsupp1-data1-v2.xlsx
Figure 2
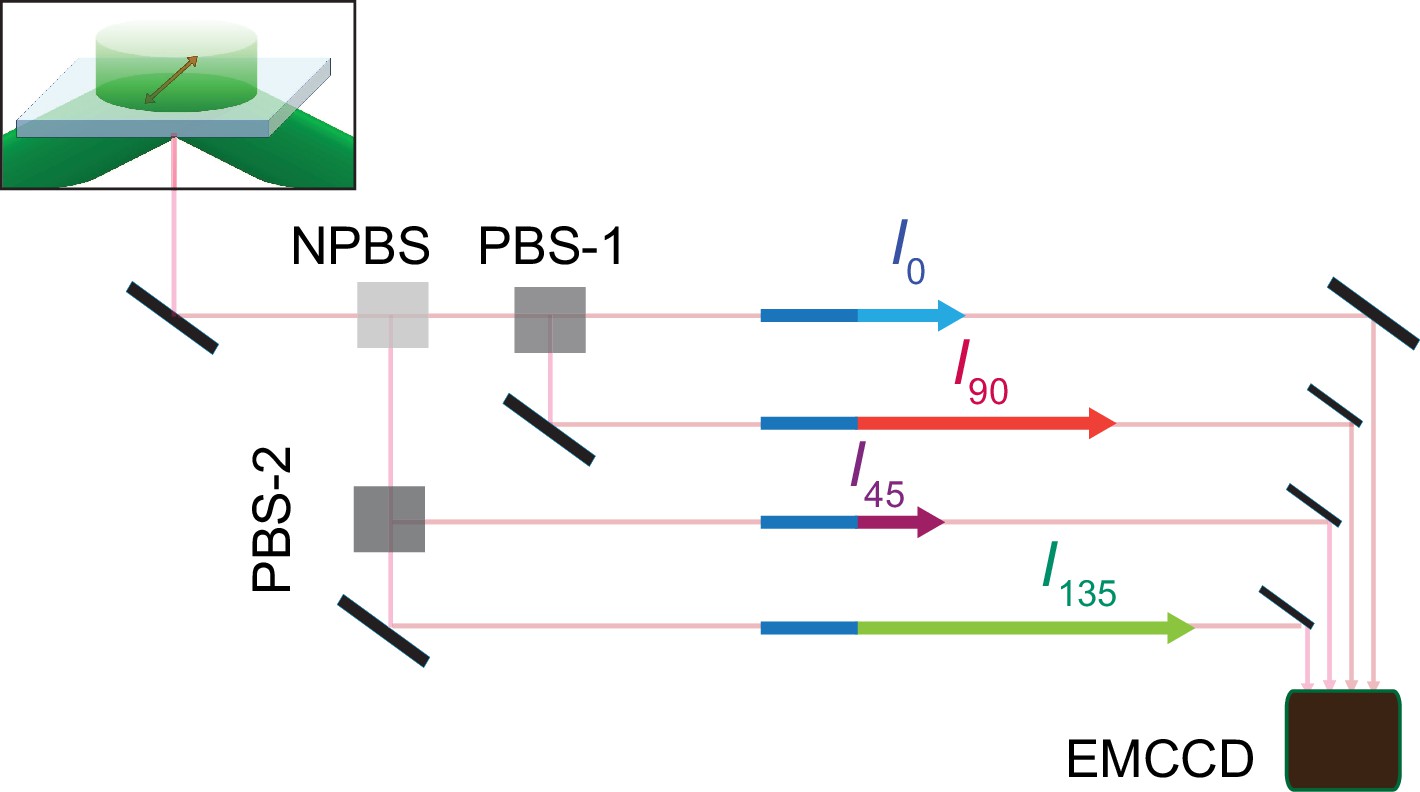
Schematic for four polarized emission intensities collected via a microscope and imaged on an EMCCD camera.
Photons, emitted from a fluorophore excited by a circularly polarized laser beam, are collected by an objective and directed to a non-polarizing beam splitter (NPBS) that splits it evenly to two beams. Beam 1 is further split into 0 and 90° polarized components (I0 and I90) with a glass (N–SF1) polarizing beam splitter (PBS-1), and beam 2 into 45 and 135° components (I45 and I135) using a wire grid polarizing beam splitter (PBS-2). These four beams are aligned along one path using pick-off mirrors and directed onto separate sections of an EMCCD camera.
Figure 3 with 2 supplements
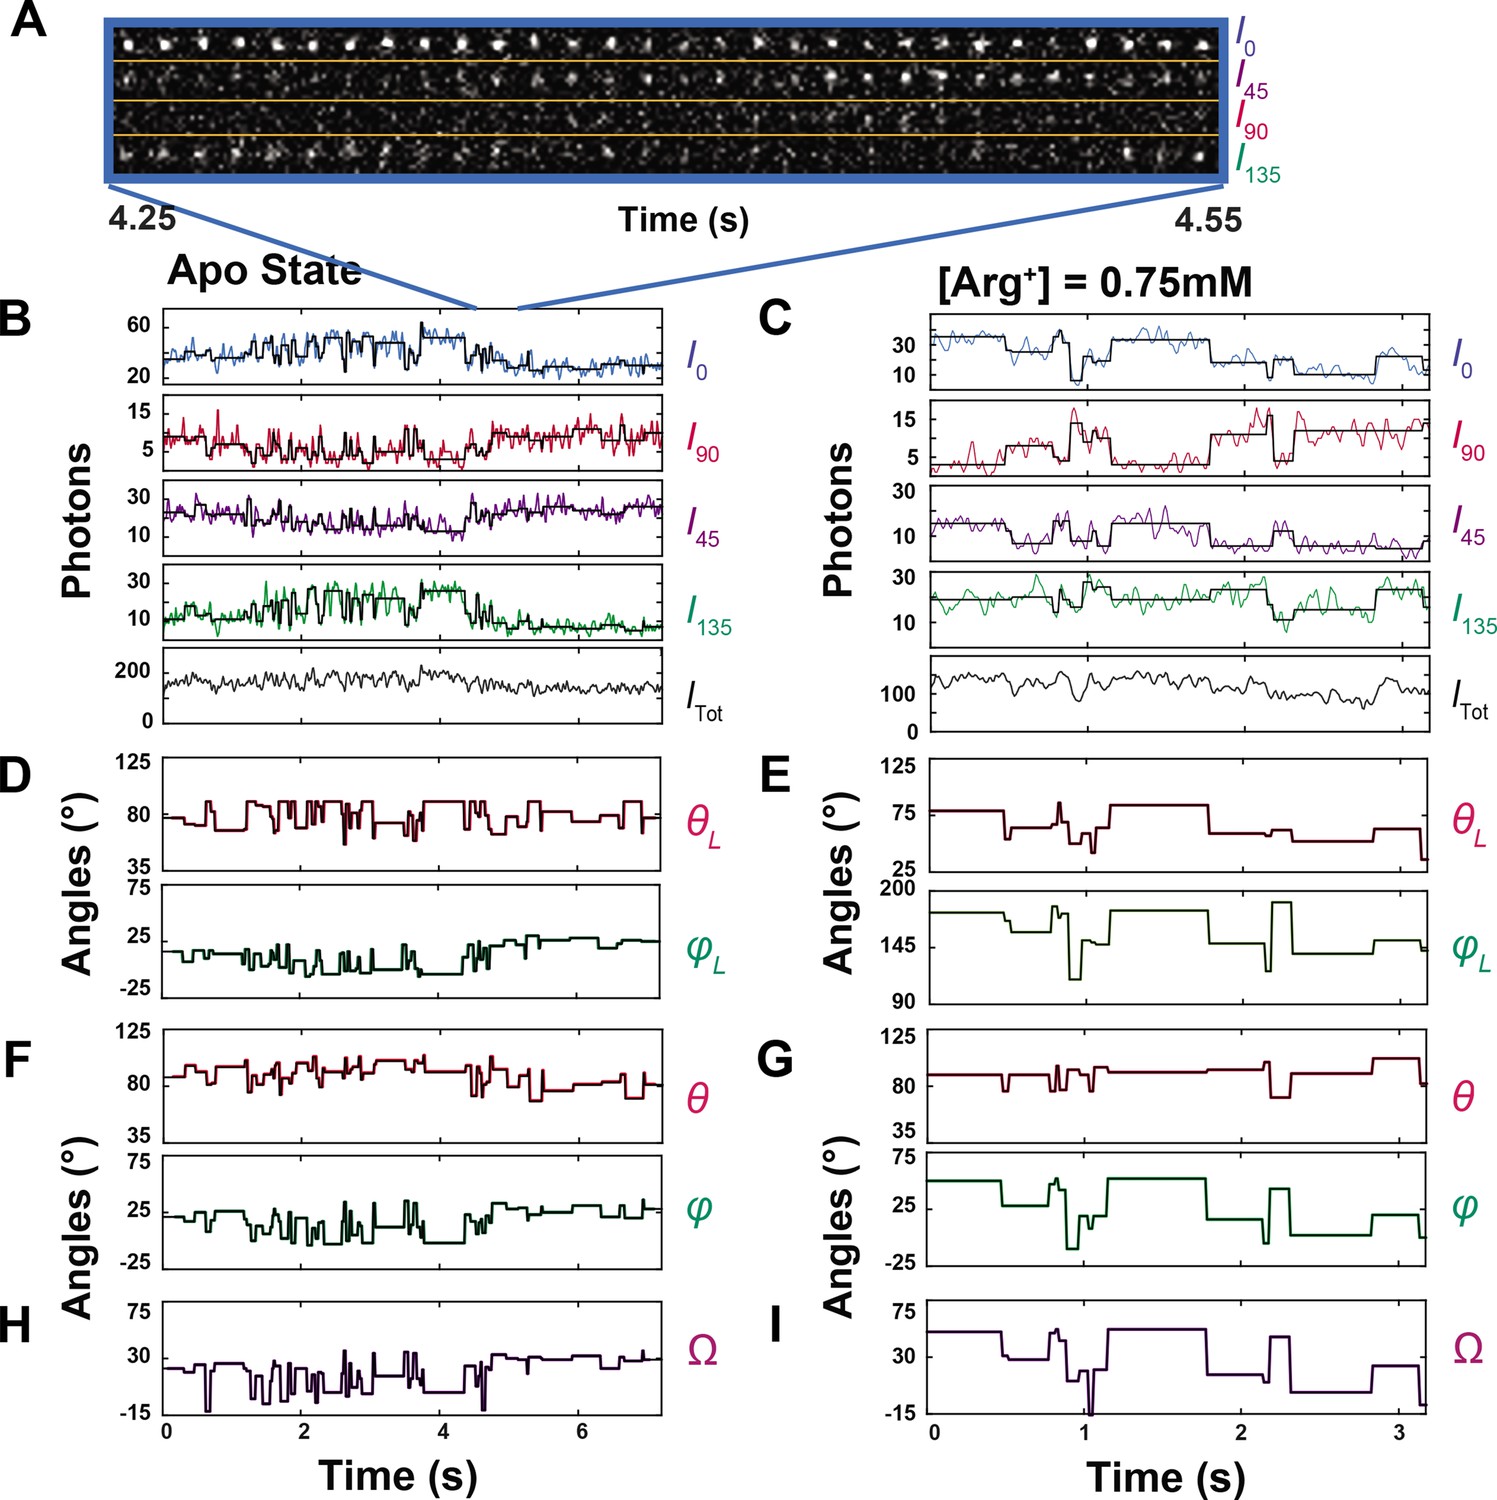
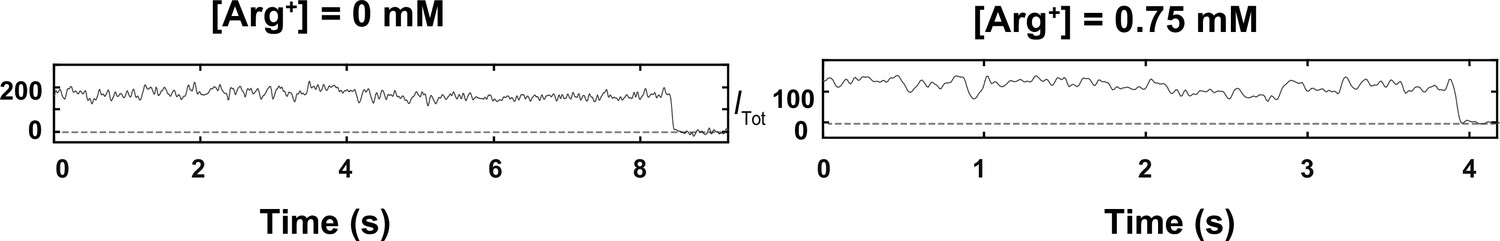
Polarized intensity components of single fluorescent particles and θ and φ angles calculated from the components.
(A) Consecutive frames of four intensity components (I0, I45, I90 and I135) of a bifunctional-rhodamine-labeled apo AdiC molecule captured over a 300 ms interval in a 7.2 s recording (Figure 3—video 1). (B, C) The time courses of integrated intensities color-coded for I0, I45, I90 and I135 of two bifunctional-rhodamine-labeled AdiC molecules in the absence (B) or presence (C) of 0.75 mM Arg+, from which Itot is calculated. Each vertical line in the black traces, superimposed on the colored traces, indicates the time point at which a change in the fluorophore’s orientation is identified, whereas the horizontal lines represent the mean intensity between two identified consecutive time points. (D–G) The traces θL and φL (D, E) in the laboratory frame of reference calculated from black intensity traces, which were rotated into the local frame of reference (F, G). (H, I) Values of Ω calculated according to Equation 33 from the changes in either θL and φL or θ and φ.
-
Figure 3—source data 1
Intensity and angle data for [Arg]=0 mM condition.
- https://cdn.elifesciences.org/articles/82175/elife-82175-fig3-data1-v2.xlsx
-
Figure 3—source data 2
Intensity and angle data for [Arg]=0.75 mM condition.
- https://cdn.elifesciences.org/articles/82175/elife-82175-fig3-data2-v2.xlsx
Figure 3—figure supplement 1
Total intensities of individual molecules including the bleaching step.
The shown intensities are the same as those Itot traces shown in Figure 3B and C except being 10% longer. The small extra length of each trace contains the bleaching step and is not used in the data analysis.
-
Figure 3—figure supplement 1—source data 1
Intensity data including the bleaching step for [Arg]=0 mM condition.
- https://cdn.elifesciences.org/articles/82175/elife-82175-fig3-figsupp1-data1-v2.xlsx
-
Figure 3—figure supplement 1—source data 2
Intensity data including the bleaching step for [Arg]=0.75 mM condition.
- https://cdn.elifesciences.org/articles/82175/elife-82175-fig3-figsupp1-data2-v2.xlsx
Figure 3—video 1
A 7.2 second-long video of the four polarized emission intensities captured on an EMCCD camera, ordered top to bottom as I0, I45, I90 and I135.
A portion of these intensities are also shown in Figure 3A. Running traces of the intensities integrated from the original movies are displayed in the middle section, and the angle traces, θ, φ and Ω (with C1 as a reference) calculated from the intensities are shown in the right section.
Figure 4
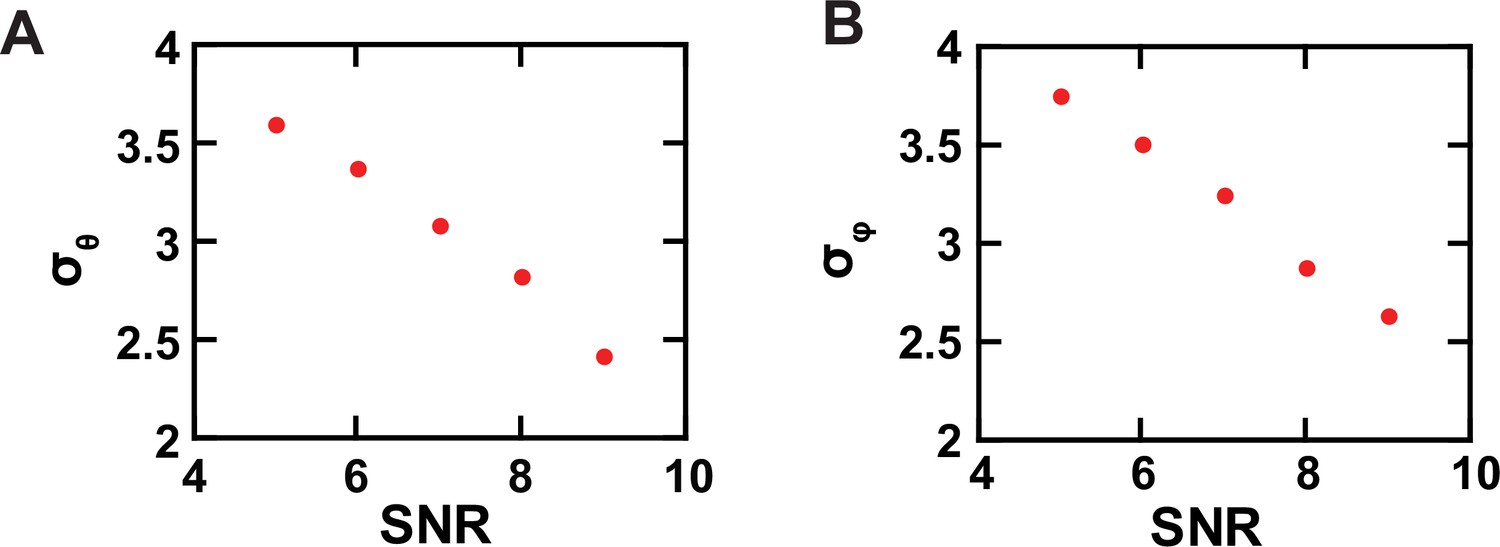
Experimental resolution of conformational states.
(A, B) The σ values of the θ (A) and φ (B) populations, built with data acquired from individual single AdiC molecules labeled with bifunctional rhodamine, are plotted against SNR.
-
Figure 4—source data 1
Data for the relation between SNR and σ of φ and θ.
- https://cdn.elifesciences.org/articles/82175/elife-82175-fig4-data1-v2.xlsx
Figure 5
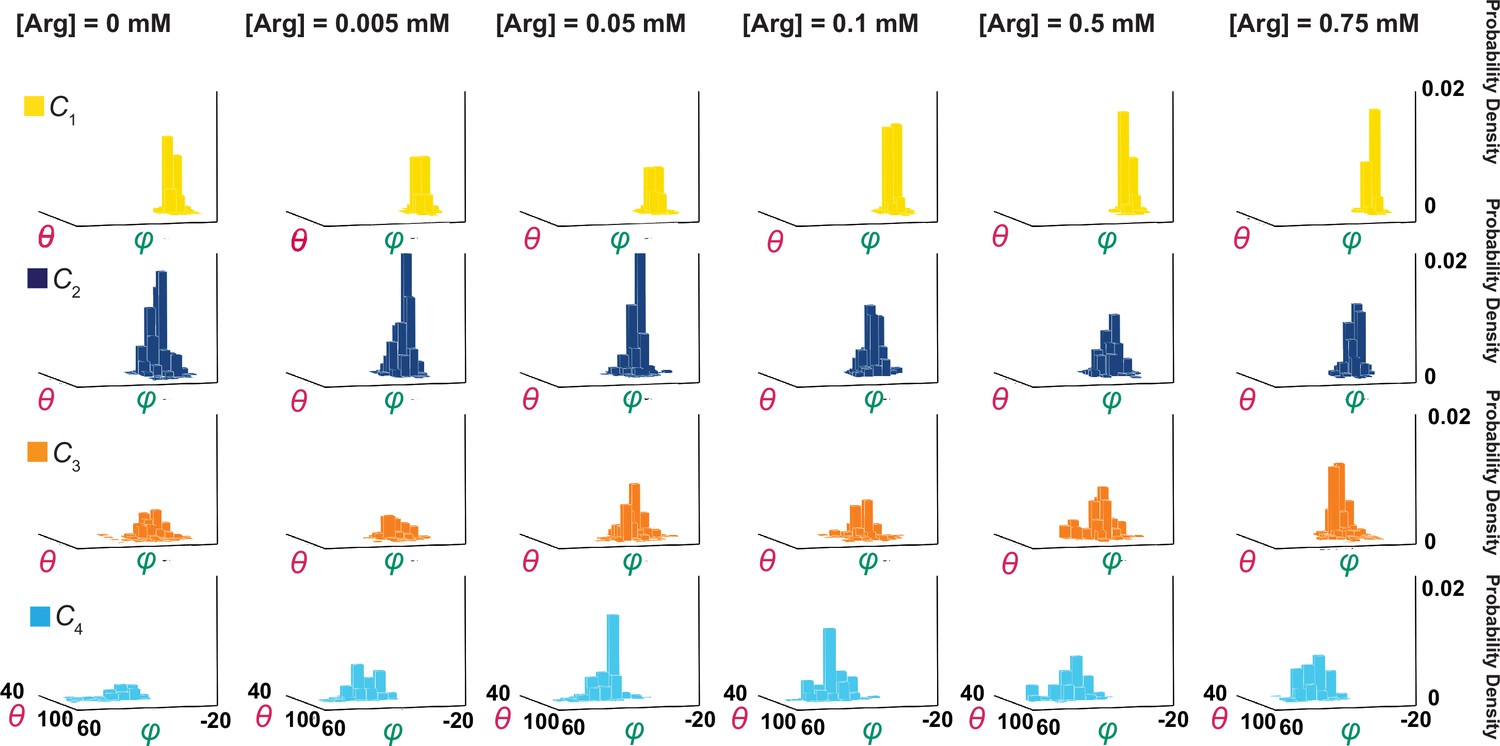
Ensemble 3D probability density distributions of θ and φ.
The θ and φ distributions of four individual states in the absence or presence of the indicated concentrations of Arg+, in which the value of φ is plotted along the x-axis, the value of θ along the y-axis, and the value of probability density along the z-axis. Distributions were built with the data analyzed from 91 or 75 number of particles with a total 3048 or 1494 number of events. Data columns for the conformational state C1 are colored yellow, C2 colored blue, C3 colored orange, and C4 color cyan.
-
Figure 5—source data 1
φ angles for probability density distributions, organized by state and [Arg+].
- https://cdn.elifesciences.org/articles/82175/elife-82175-fig5-data1-v2.xlsx
-
Figure 5—source data 2
θ angles for probability density distributions, organized by state and [Arg+].
- https://cdn.elifesciences.org/articles/82175/elife-82175-fig5-data2-v2.xlsx
-
Figure 5—source data 3
φ and θ sample histogram data for [Arg+] = 0 mM.
- https://cdn.elifesciences.org/articles/82175/elife-82175-fig5-data3-v2.xlsx
-
Figure 5—source data 4
φ and θ sample histogram data for [Arg+] = 0.75 mM.
- https://cdn.elifesciences.org/articles/82175/elife-82175-fig5-data4-v2.xlsx
Figure 6
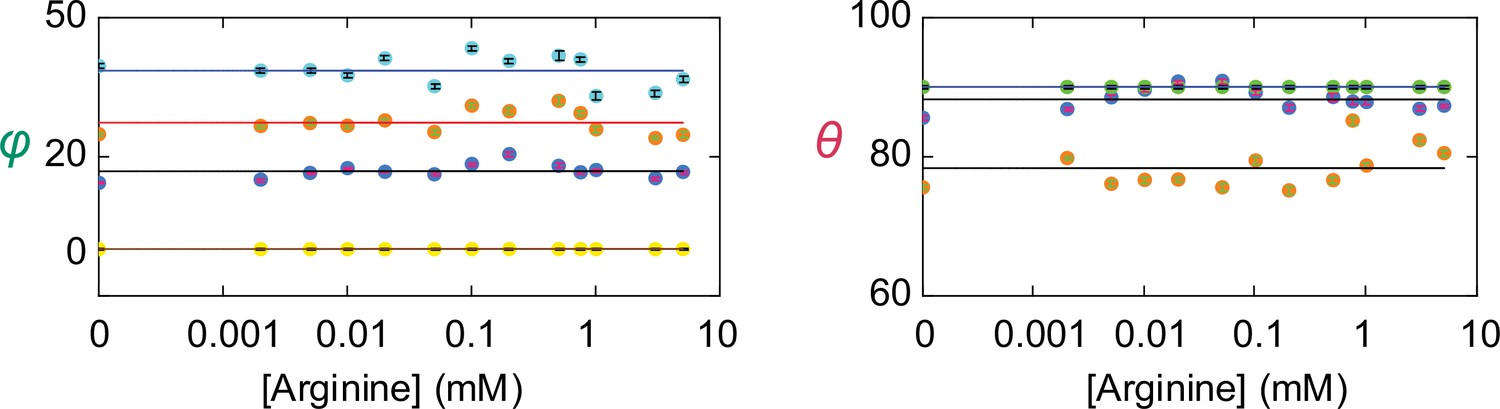
Angle values of individual conformational states.
The values of θ and φ (mean ± sem) for each of the four conformations are plotted against the concentration of Arg+. The number of events is 691–3084. The symbols for the conformational state C1 is colored yellow, C2 colored blue, C3 colored orange, and C4 color cyan. Note that θ for both C1 (yellow) and C4 (cyan) are set to 90° as described in the text and are thus overlapped.
-
Figure 6—source data 1
Table of mean values for θ and φ organized by state and [Arg+].
- https://cdn.elifesciences.org/articles/82175/elife-82175-fig6-data1-v2.xlsx
Figure 7 with 1 supplement
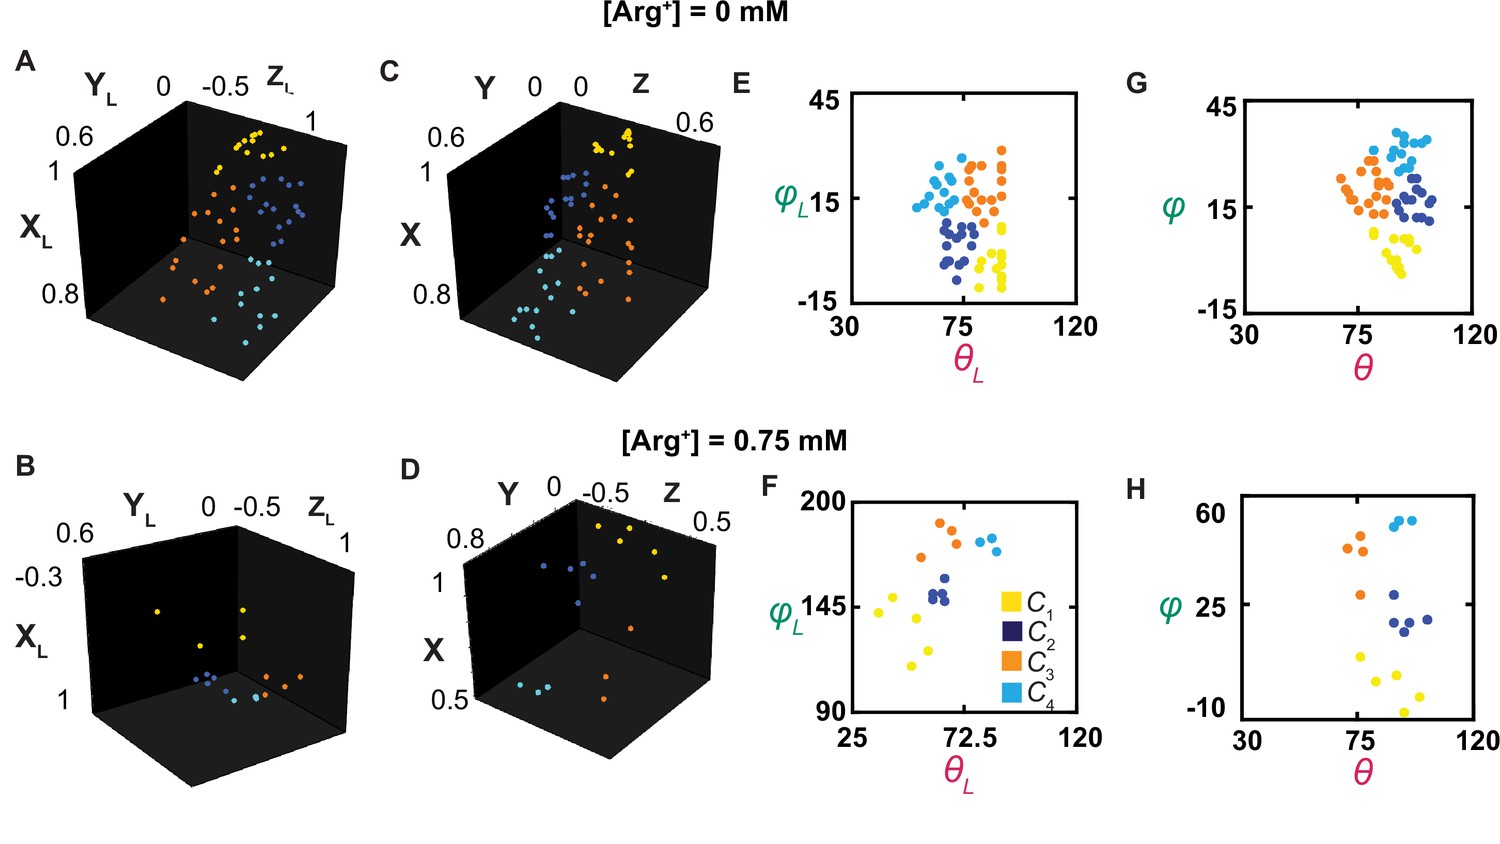
The orientations of the dipole vector of the fluorescence probe in different conformational states.
(A–D) The positions of the arrowheads of individual dipole vectors are mapped onto a unit sphere, on the basis of being in a Cartesian coordinate system defined according to the usual laboratory framework (A, B) or a local one (C, D), described in the text. The XL, YL, and ZL positions calculated from θL and φL, determined in Figure 3, and a radius of a unit length. (E–H) The inclination and rotation angle values are plotted against each other in the laboratory (E, F) or the local (G, H) frame of reference. The data points for conformational state C1 are colored yellow, C2 colored blue, C3 colored orange, and C4 color cyan.
-
Figure 7—source data 1
Orientation information of the fluorophore for [Arg] = 0 mM.
- https://cdn.elifesciences.org/articles/82175/elife-82175-fig7-data1-v2.xlsx
-
Figure 7—source data 2
Orientation information of the fluorophore for [Arg] = 0.75 mM.
- https://cdn.elifesciences.org/articles/82175/elife-82175-fig7-data2-v2.xlsx
Figure 7—figure supplement 1
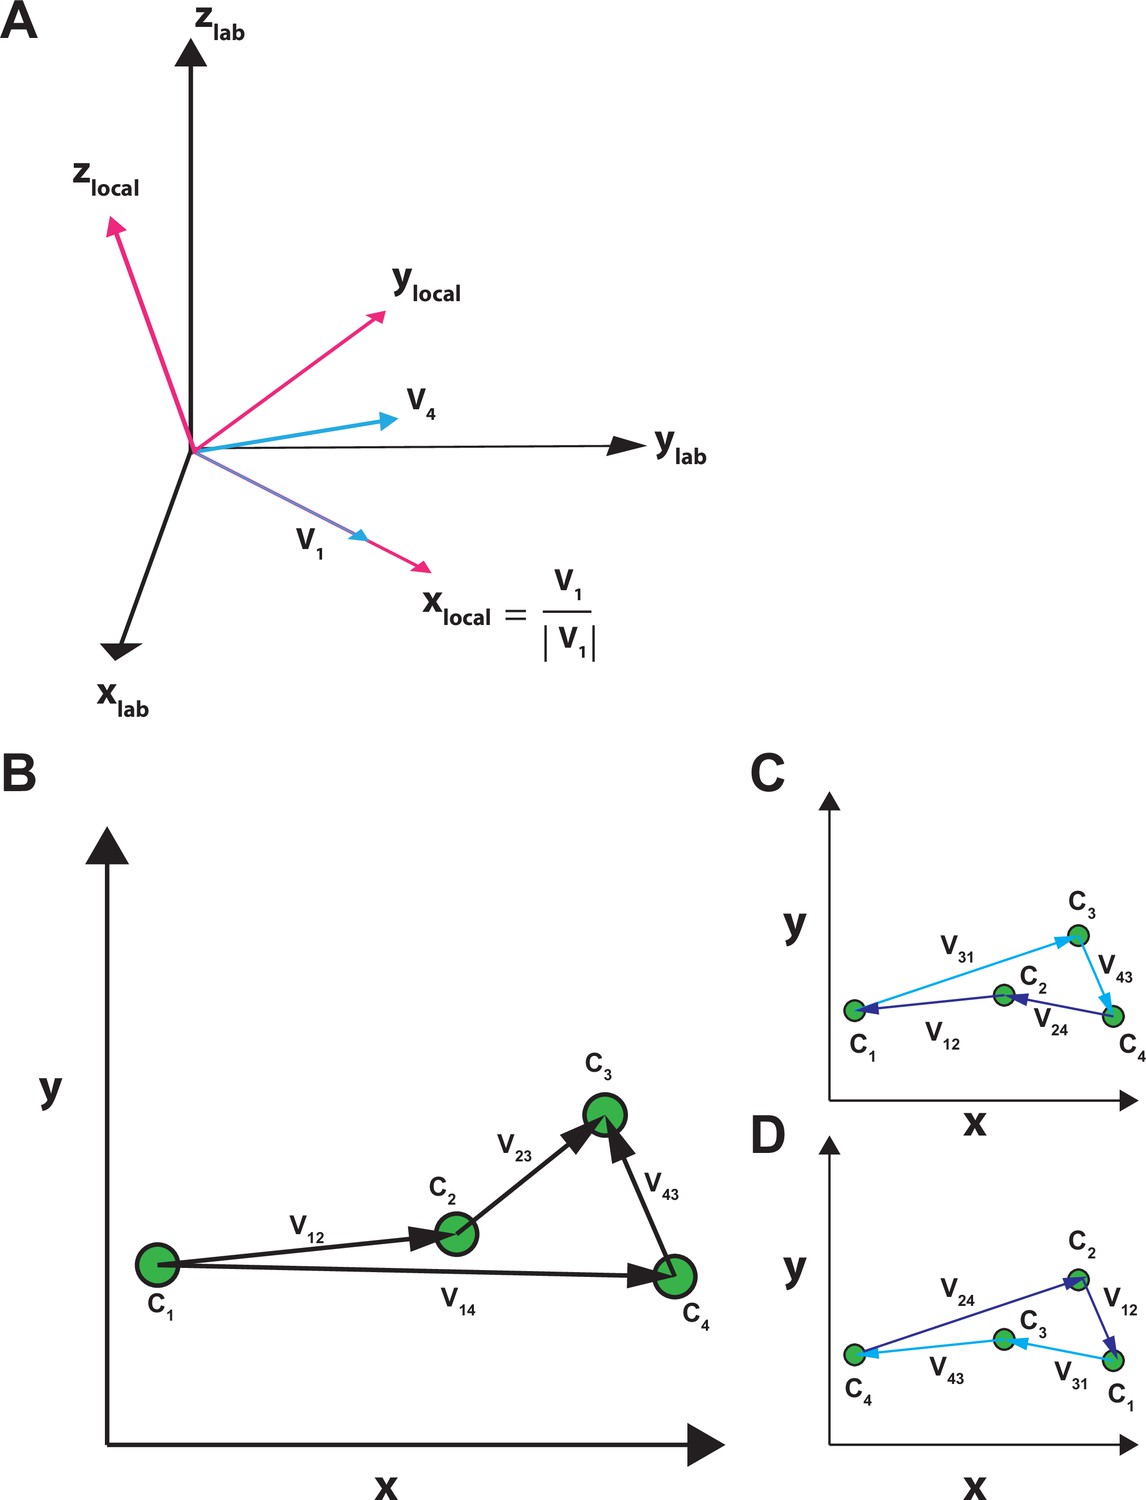
Transformation between the laboratory and local coordinates, and assignment of states.
(A) Coordinate transformation. In the laboratory frame of reference (colored black), the zlab-axis is defined as parallel to the optical axis of the microscope objective and the xlab,ylab-axes are defined within the plane of the sample glass, perpendicular to the axis of the objective and the zlab-axis. Coordinates are transformed to the local frame of reference defined by the vectors V1 and V4 that represent the orientations of C1 and C4, respectively, such that the new x-axis becomes parallel to the vector V1 (Equation 29, ‘Materials and methods’), the new y-axis becomes perpendicular to the new x-axis in the plane defined by V1 and V4, and the new z-axis becomes perpendicular to the new x,y-plane. (B–D) State assignment. Among four states, there are 24 unique serial relations. The path between a given pair of states Ci and Cj is indicated by a vector Vi,j between them (B). To ensure the same sequence among the four states is assigned in all particles analyzed individually, states C1 through C4 are aligned such that the calculated distance among them, defined by |V12|+|V23|+|V34|, is shortest. Thus, their combined distance is closest to the length of the direct path between C1 and C4 defined by the length of V14 (Equation 26, ‘Materials and methods’). This operation should, in principle, yield two solutions with inverted sequences: C1-C2-C3-C4 (C) versus C4-C3-C2-C1 (D). The sequence of C1-C2-C3-C4 in (C) was consistently chosen.
Figure 8
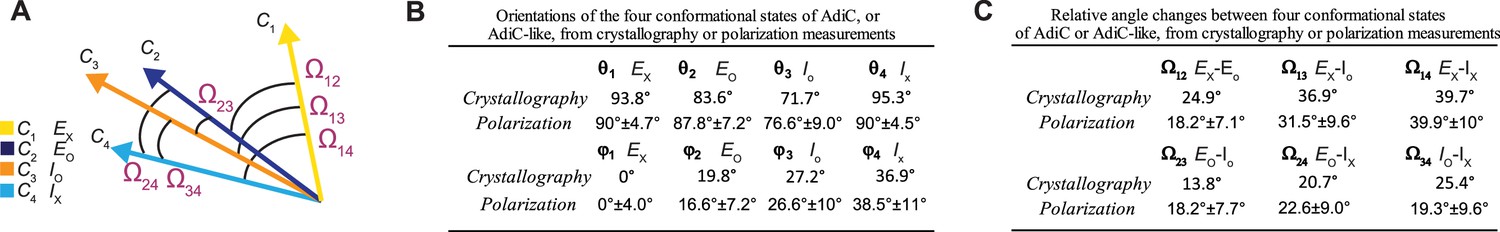
Comparison of the orientations of helix 6A in the corresponding states determined from the crystal structures and in the polarization study.
(A) Depiction of the six Ω angles among the four orientations of the helix in the four states, represented by four arrows color-coded for states. (B, C) The θ and φ angles (B) of the helix for corresponding states determined from the crystal structures and in the polarization study, as well as the Ω angles (C), are compared in the local frame of reference. All angle values for the conformational states determined by polarization are presented as mean ± standard deviation (σ). In the structural analysis, the AdiC structures in the states EO (blue) (PDB: 7O82) and EX (yellow) (PDB: 3L1L), and the BasC and ApcT structures in the states IO (orange) (PDB: 6F2G) and IX (cyan)(PDB: 3GIA) were used.
-
Figure 8—source data 1
θ and φ values of the four conformational states.
- https://cdn.elifesciences.org/articles/82175/elife-82175-fig8-data1-v2.xlsx
-
Figure 8—source data 2
Ω values of the four conformational states.
- https://cdn.elifesciences.org/articles/82175/elife-82175-fig8-data2-v2.xlsx
Figure 9
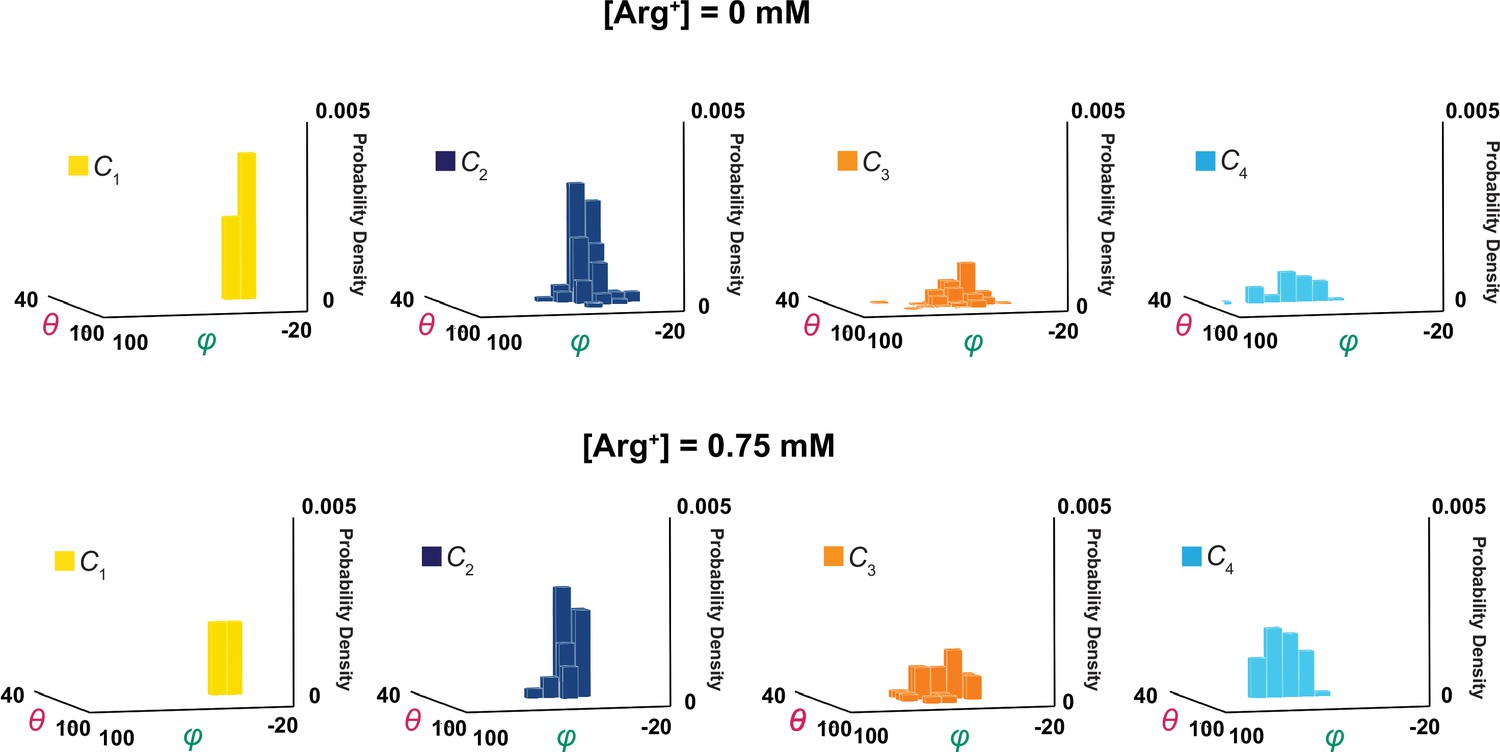
3D probability density distributions of mean θ and φ determined from individual molecules.
The value of φ is plotted along the x-axis, the value of θ along the y-axis, and the value of probability density along the z-axis, obtained in the absence (top) and presence (bottom) of a saturating concentration of Arg+. Distributions were built with the data analyzed from 34 or 91 number of particles with a total 691 or 3048 number of events. Data column for the conformational state C1 is colored yellow, C2 colored blue, C3 colored orange, and C4 color cyan.
-
Figure 9—source data 1
φ data for mean angle distributions.
- https://cdn.elifesciences.org/articles/82175/elife-82175-fig9-data1-v2.xlsx
-
Figure 9—source data 2
θ data for mean angle distributions.
- https://cdn.elifesciences.org/articles/82175/elife-82175-fig9-data2-v2.xlsx
Figure 10

Ligand dependence of the probabilities of conformational states and the diagram of a conformational state model of AdiC.
(A) The probabilities of individual states (mean ± sem, number of events is 691–3084) are plotted against the Arg+ concentration on a logarithm scale. The four curves superimposed on the data correspond to a global fit of a model in which the interaction between the subunit of AdiC and Arg+ has an one-to-one stoichiometry. The fitted values of all parameters are summarized in Table 1. (B) An eight-state model that accounts for the observed conformational behaviors of AdiC: four apo states and four ligand-bound states.
-
Figure 10—source data 1
State probabilities and associated errors organized according to [Arg+].
- https://cdn.elifesciences.org/articles/82175/elife-82175-fig10-data1-v2.xlsx
Figure 11
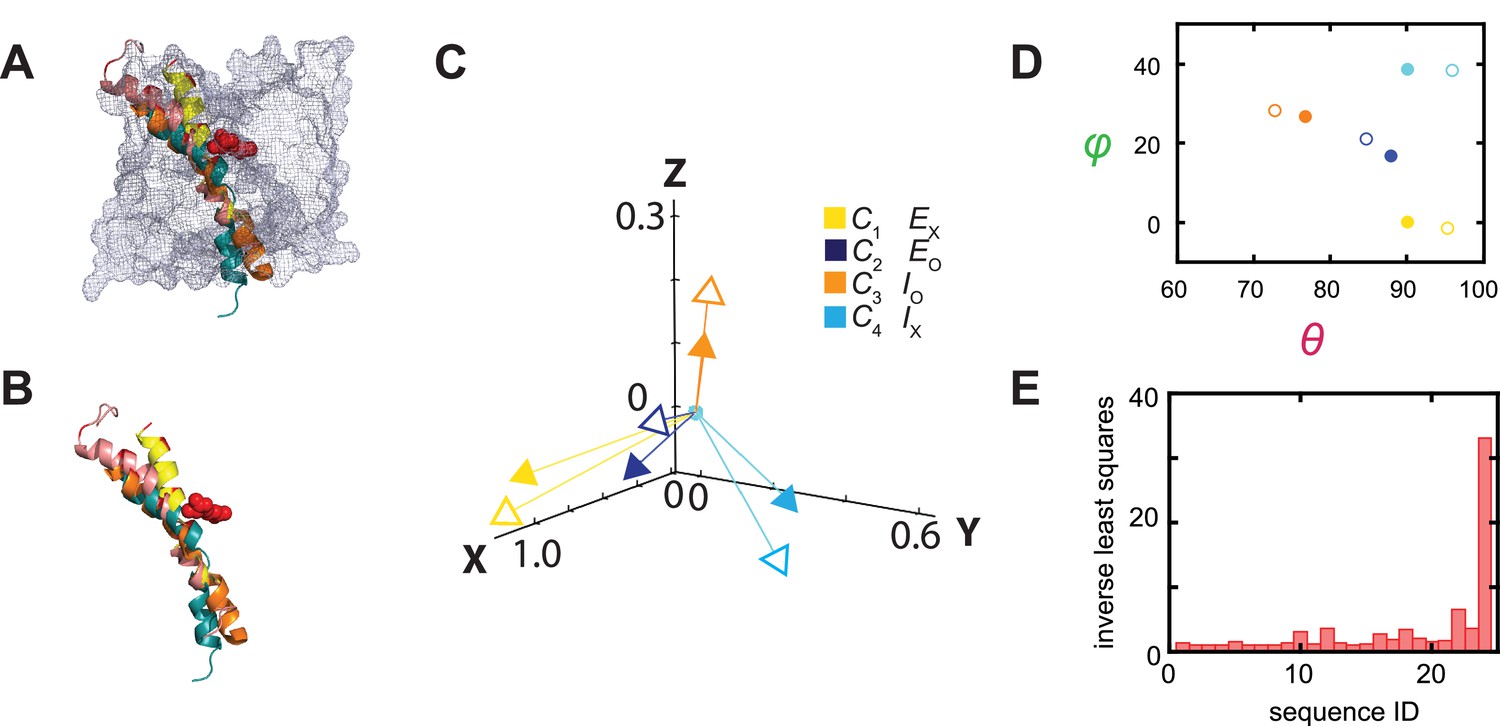
Relations between the structural and conformational states determined respectively from the crystal structures and in the polarization study.
(A, B) Alignments of AdiC’s helix 6A in the structural states EO (blue) (PDB: 7O82) and EX (yellow) (PDB: 3L1L) with the corresponding helices of BasC and ApcT in the states IO (orange) (PDB: 6F2G) and IX (cyan) (PDB: 3GIA), with (A) or without (B) the rest of the protein represented by a mesh contour. (C) The four mean orientations of the helix in the four conformational states are represented by a set of four unit-vectors (closed heads) in the local framework of coordinates whereas those for the four structural states by another set of unit vectors (open heads). The vectors for the conformational states are drawn according to mean θ and φ values obtained from their respective distributions and color-coded for the corresponding states. The two sets of vectors are overlaid as described in the text. (D) Scatter plots of mean θ versus φ values (closed circles) for four conformational states, which are compared with those for the four structural states (open circles); all are color coded for states. (E) The inverse values of combined least-distance-squares between the locations of the arrow heads of the two compared groups (open versus closed) in (C) for all 24 possible combinations among them.
-
Figure 11—source data 1
Tables comparing mean angles calculated from polarization measurements and those from structure.
Table listing the inverse values of combined least-distance-squares of the different state combinations.
- https://cdn.elifesciences.org/articles/82175/elife-82175-fig11-data1-v2.xlsx
Tables
Table 1
Probabilities and equilibrium constants for apo and Arg+ bound states.
| Apo state | ||||||
|---|---|---|---|---|---|---|
| P1 | 0.192 + 0.015/–0.024 | |||||
| K2,1 | 2.566 + 0.589/–0.244 | P2 | 0.492 + 0.040/–0.014 | |||
| K3,1 | 0.923 + 0.061/–0.149 | P3 | 0.177 + 0.011/–0.037 | |||
| K4,1 | 0.729 + 0.225/–0.103 | P4 | 0.140 + 0.026/–0.014 | |||
| Arg+ bound state | KD (µM) | |||||
| argP1 | 0.172 + 0.020/–0.020 | argKD1 | 49 + 46/–25 | |||
| argK2,1 | 1.795 + 0.298/–0.319 | argP2 | 0.308 + 0.013/–0.025 | argKD2 | 69 + 67/–33 | |
| argK3,1 | 1.782 + 0.272/–0.193 | argP3 | 0.306 + 0.019/–0.018 | argKD3 | 25 + 20/–14 | |
| argK4,1 | 1.250 + 0.228/–0.188 | argP4 | 0.214 + 0.018/–0.015 | argKD4 | 28 + 31/–14 | |
-
Parameters from fit of Equation 5 to the plots of AdiC conformational state probabilities versus [Arg+] (Figure 10A). 95% confidence intervals were calculated from the maximum likelihood optimization of 1000 sets of simulated data obtained from bootstrapping.
Additional files
Download links
A two-part list of links to download the article, or parts of the article, in various formats.
Downloads (link to download the article as PDF)
Open citations (links to open the citations from this article in various online reference manager services)
Cite this article (links to download the citations from this article in formats compatible with various reference manager tools)
Tracking multiple conformations occurring on angstrom-and-millisecond scales in single amino-acid-transporter molecules
eLife 12:e82175.
https://doi.org/10.7554/eLife.82175


