Ether lipid biosynthesis promotes lifespan extension and enables diverse pro-longevity paradigms in Caenorhabditis elegans
- Center for Genomic Medicine and Diabetes Unit, Endocrine Division, Department of Medicine, Massachusetts General Hospital and Harvard Medical School, United States
- Broad Institute of Harvard and MIT, United States
- Program in Biological and Biomedical Sciences, Division of Medical Sciences, Harvard Medical School, United States
- Leonard Davis School of Gerontology, University of Southern California, United States
- Department of Medicine and Pharmacology, University of California San Diego, United States
- Biomedical Informatics Core, Massachusetts General Hospital and Harvard Medical Schoo, United States
- Program in Innate Immunity, Division of Infectious Diseases and Immunology, University of Massachusetts Medical School, United States
Figures
Figure 1 with 2 supplements
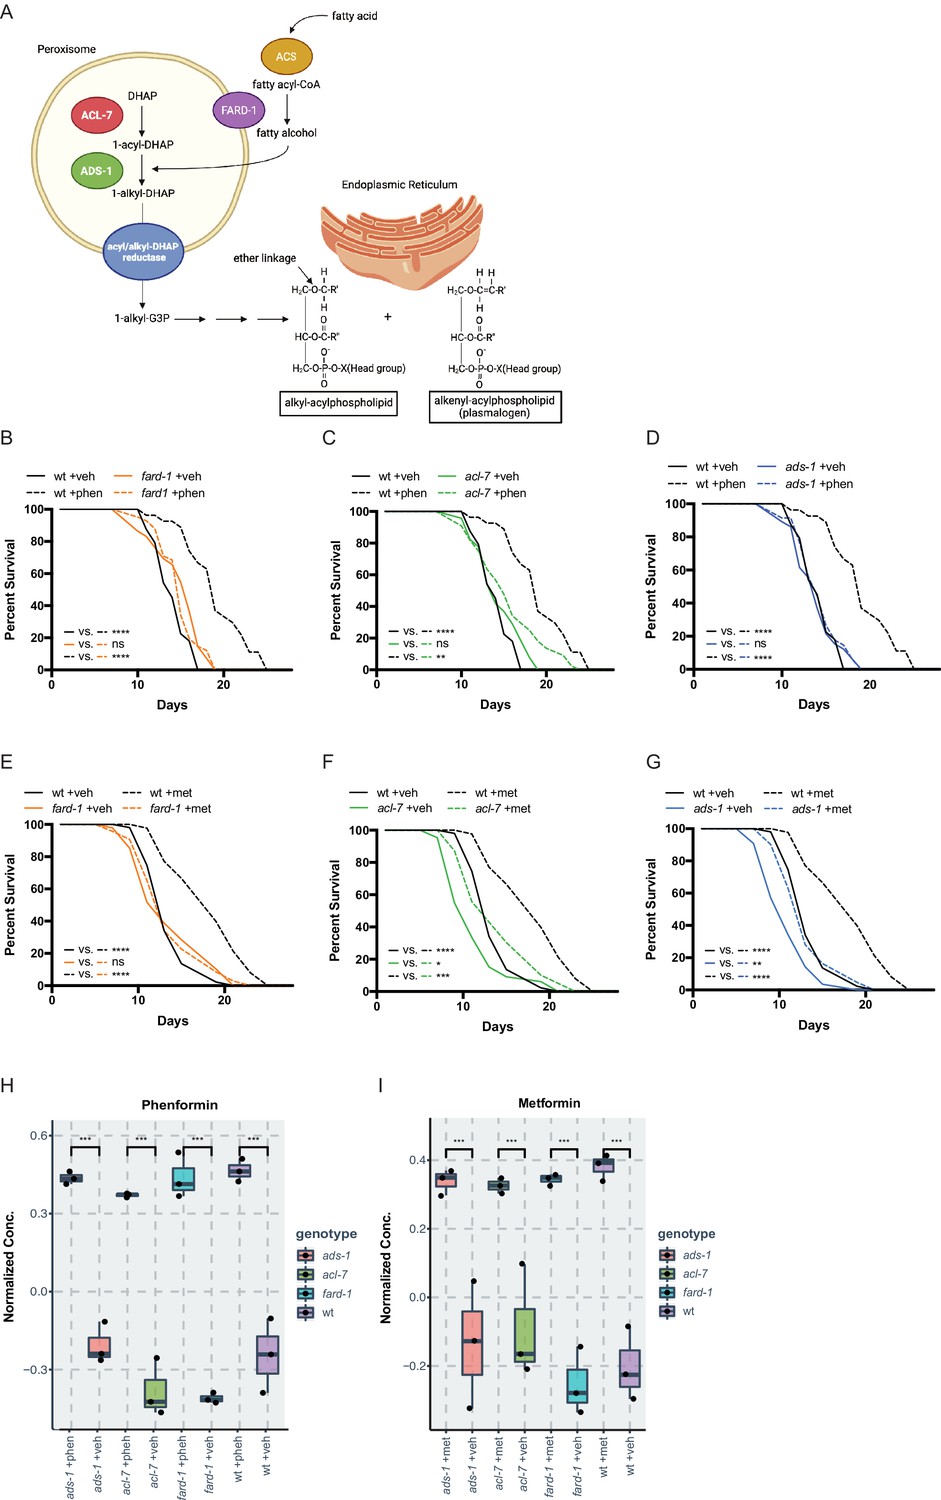
Genes responsible for ether lipid biosynthesis are necessary for biguanide-induced lifespan extension.
(A) C. elegans ether lipid synthesis is catalyzed by three enzymes: fatty acyl reductase FARD-1, acyltransferase ACL-7, and alkylglycerone phosphate synthase ADS-1 (adapted from Figure 1 of Shi et al., 2016 and Dean and Lodhi, 2018). The latter two are localized to the peroxisomal lumen. (B–D) Missense, loss-of-function mutations in fard-1 (B), acl-7 (C), and ads-1 (D) in C. elegans suppress phenformin-induced lifespan extension. (E–G) A deficiency of ether lipid synthesis in fard-1 (E), acl-7 (F), and ads-1 (G) worm mutants blunts metformin-induced lifespan extension. Results are representative of three biological replicates. *, p<0.05; **, p<0.01; ***, p<0.001; ****, p<0.0001 by log-rank analysis. Note that (B–D) and (E–G) contain the same wild-type (wt) controls as they are visualized from the same replicate of the study. See also Figure 1—figure supplement 1 and refer to Supplementary file 1 for tabular survival data and biological replicates. (H–I) Normalized concentrations of phenformin (H) and metformin (I) in vehicle, 4.5 mM phenformin, or 50 mM metformin-treated wt C. elegans versus fard-1, acl-7, and ads-1 mutants. n=3 biological replicates; ***, p<0.004 by two-tailed Student’s t-test with Bonferroni correction for multiple hypothesis testing. Box represents 75th/25th percentiles, while whisker represents higher/lower hinge ± [1.5 * interquartile range (IQR)].
Figure 1—figure supplement 1
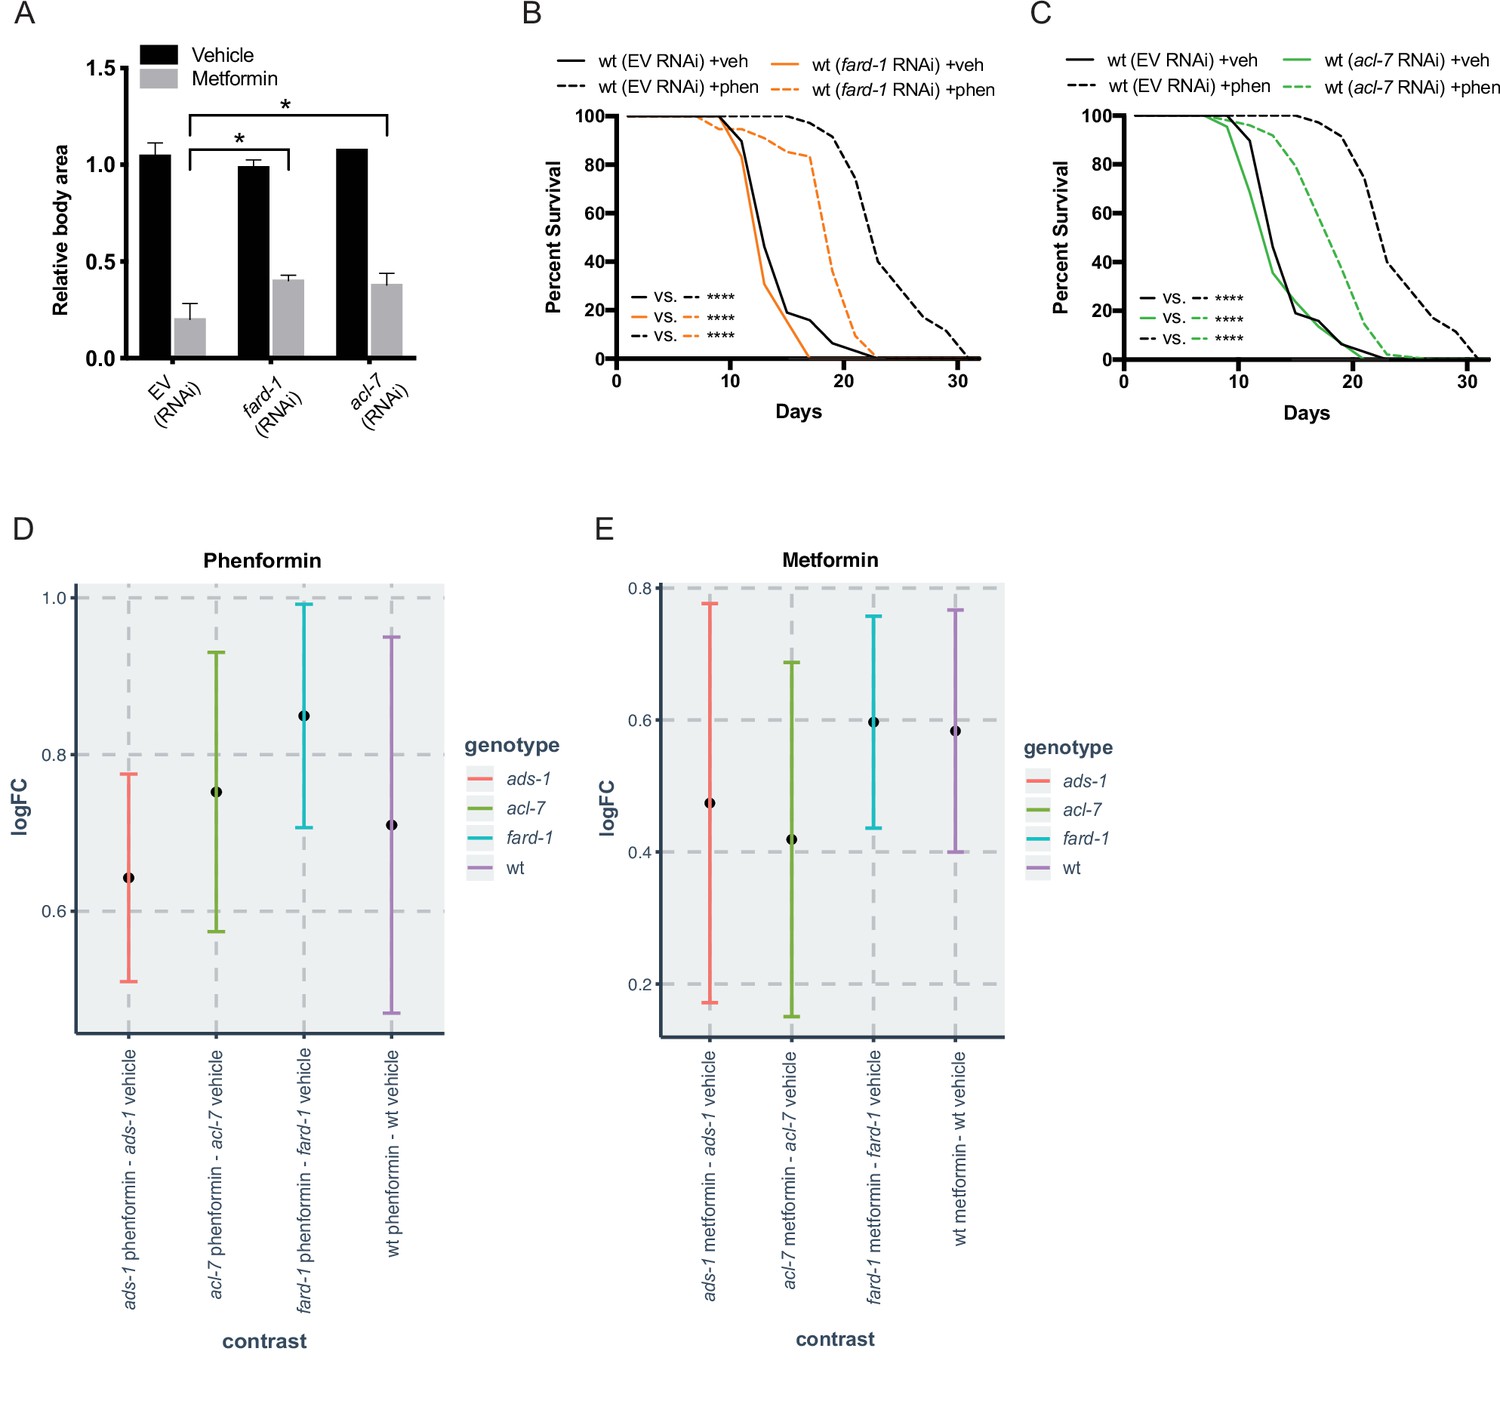
Reduced function of genes responsible for ether lipid biosynthesis partially suppresses biguanide effects of growth and lifespan without affecting biguanide levels.
(A) RNA interference (RNAi) knockdown of fard-1 and acl-7 induces resistance to growth inhibition by 160 mM metformin treatment in C. elegans. *, p<0.05, by two-way ANOVA, n=2 biological replicates. (B–C) RNAi knockdown of fard-1 (B) and acl-7 (C) in C. elegans partially suppresses phenformin’s effect on lifespan extension. For (B and C), results are representative of three biological replicates. Note that (B–C) contain the same wild-type controls as they are visualized from the same replicate of the study. ****, p<0.0001 by log-rank analysis; for tabular survival data and biological replicates see also Supplementary file 1. (D) Log fold change (LogFC) of phenformin abundance in samples treated with 4.5 mM phenformin versus vehicle reveals that the increase in phenformin levels in wild-type and three ether lipid deficient mutants is similar. (E) LogFC of metformin abundance in samples treated with 50 mM metformin versus vehicle shows that metformin increases are similar across all four strains. n = 3 biological replicates. Bars represent mean and 95% confidence intervals.
Figure 1—figure supplement 2
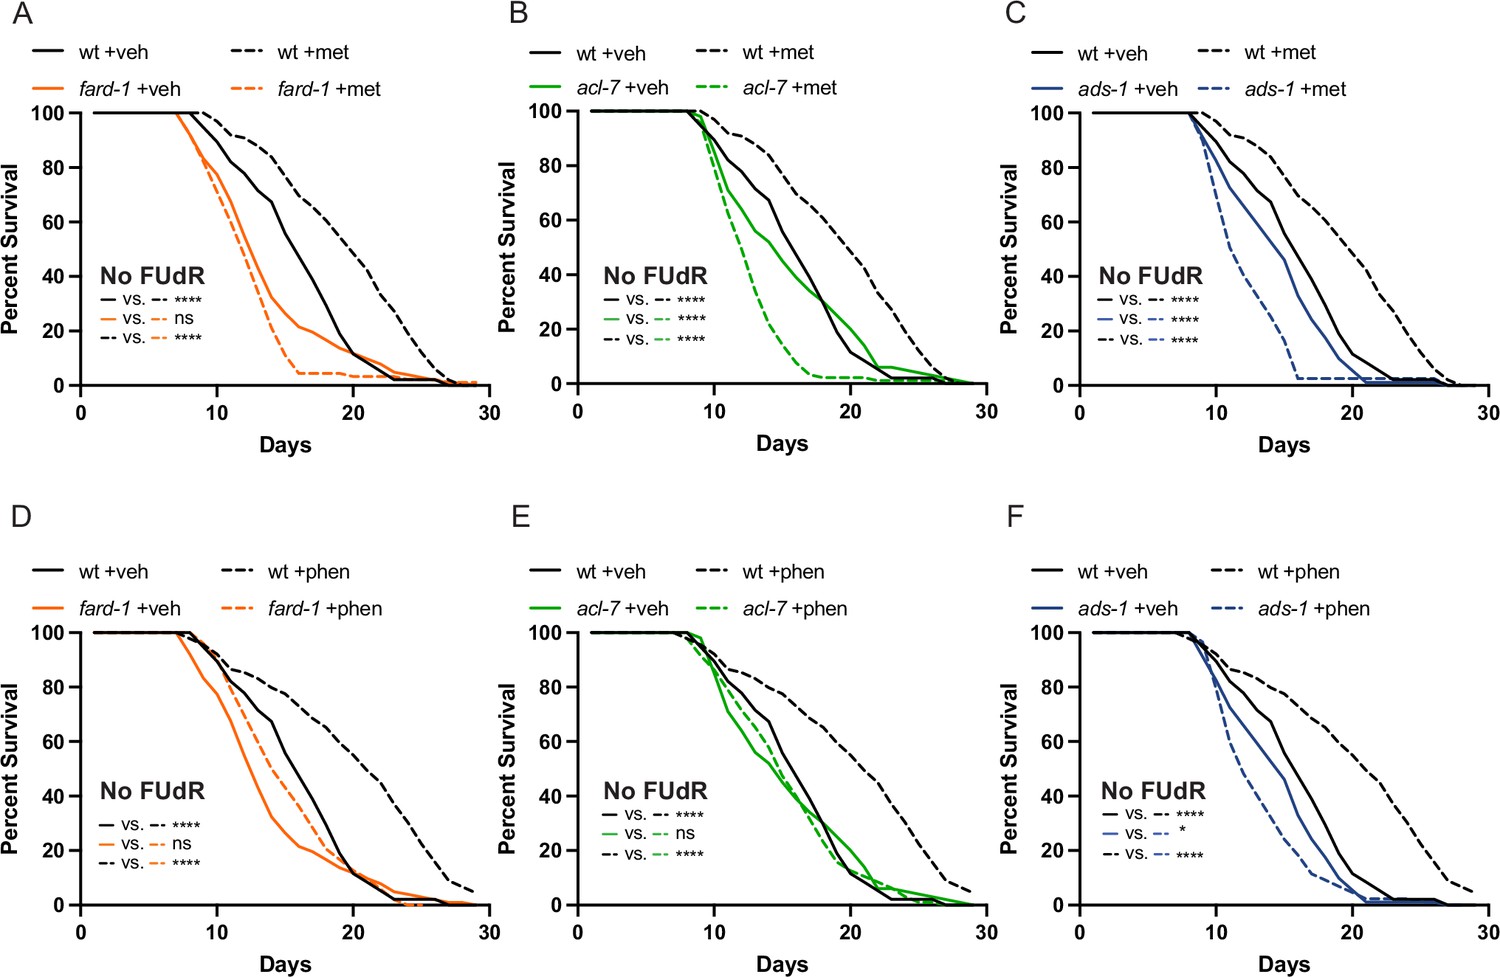
The use of 5-fluoro-2′-deoxyuridine (FUdR) in lifespan analyses does not impact the observed epistases between the ether lipid machinery and biguanide-mediated lifespan extension.
Lifespans performed without the use of FUdR to inhibit progeny formation corroborate that a deficiency of ether lipid synthesis in fard-1 (A/D), acl-7 (B/E), and ads-1 (C/F) worm mutants negates both metformin (top row) and phenformin (bottom row)-induced lifespan extension. Loss-of-function mutants for fard-1, acl-7, and ads-1 are compared to wild-type (wt) treated with vehicle control (veh) versus 50 mM metformin (met) or 4.5 mM phenformin (phen). Results are representative of three biological replicates. *, p<0.05; **, p<0.01; ***, p<0.001; ****, p<0.0001 by log-rank analysis. Note that A/D, B/E, and C/F contain the same vehicle controls as they are visualized from the same replicate of the study. Please refer to Supplementary file 1 for tabular survival data and biological replicate summary statistics.
Figure 2 with 2 supplements
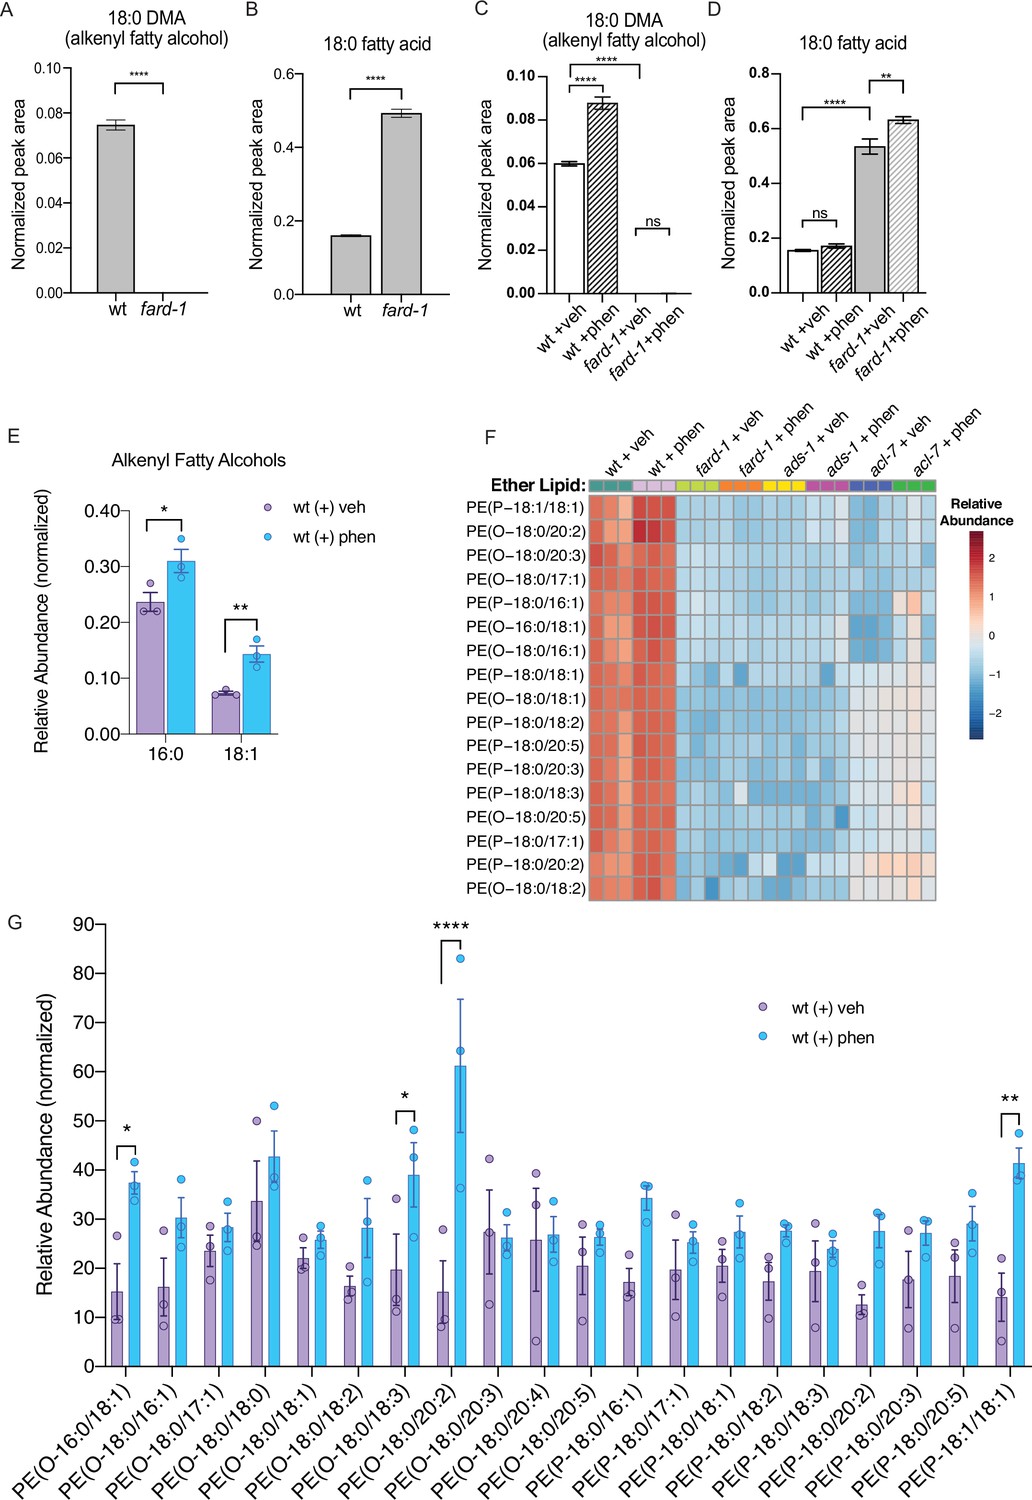
Phenformin treatment of C. elegans leads to increased abundance of multiple alkyl and alkenyl ether lipids.
(A–B) Loss-of-function fard-1 mutants have significant reduction in 18:0 fatty alcohols derivatized from 18-carbon containing alkenyl ether lipids (dimethylacetal [DMA]) by gas chromatography/mass spectrometry (GC/MS) (A) and accumulation of the saturated fatty acid stearate (18:0, B). (C) Wild-type (wt) worms treated with 4.5 mM phenformin display a significant increase in 18:0 DMA relative to vehicle control, indicative of higher levels of alkenyl ether lipids, with levels remaining essentially undetectable in fard-1 mutants on vehicle or drug. (D) Phenformin (4.5 mM) treatment does not impact stearate levels in wt worms, however it does result in a greater accumulation of stearate in fard-1 mutants. For (A–D), **, p<0.01; ****, p<0.0001, by t-test (A–B) or two-way ANOVA (C–D), n=3 biological replicates. (E) Phenformin (4.5 mM) treatment results in a significant increase in 16:0 DMA and 18:1 DMA in wt worms, relative to vehicle-treated controls *, p<0.05; **, p<0.01, by multiple t-tests, with two-stage linear step-up procedure of Benjamini, Krieger, and Yekutieli. n=3 biological replicates. (F) Heatmap of normalized ether lipid abundance following phenformin treatment in wt C. elegans indicates an overall increase in ether lipids relative to vehicle-treated controls, and this shift is absent in ether lipid deficient mutants. All metabolites shown have an FDR adjusted p<0.05 by one-way ANOVA followed by Fisher’s LSD post hoc testing for wt versus fard-1, ads-1, and acl-7 mutants. (G) Liquid chromatography-tandem mass spectrometry (LC-MS) analysis shows that phosphatidylethanolamine-containing ether lipids detected exhibited a general trend toward increased abundance in wild-type worms treated with 4.5 mM phenformin. Four of these ether lipids reached statistical significance: PE(O-16:0/18:1), PE(O-18:0/18:3), PE(O-18:0/20:2), and PE(P-18:1/18:1). Eleven of the ether lipids detected are of the alkyl-type (indicated by ‘O’ in their name prior to fatty alcohol designation) whereas nine are of the alkenyl-type (plasmalogen, indicated by ‘P’ in their name prior to the fatty alcohol designation) ether lipids. For (G), *, p<0.05; **, p<0.01; ****, p<0.0001, by multiple t-tests, with multiple hypothesis testing correction by two-stage step-up method of Benjamini, Krieger, and Yekutieli, n=3 biological replicates. See Figure 2—source data 1 for raw and normalized mass spectrometry data.
-
Figure 2—source data 1
Excel file containing raw, normalized, and normalized and log10 transformed mass spectrometry data for phosphatidylethanolamine containing ether lipids detected by liquid chromatography-tandem mass spectrometry (LC-MS/MS).
Data from three biological replicates are shown for molecules indicated for vehicle or 4.5 mM phenformin treatment, for four different genetic backgrounds: wild-type animals (N2, wt), BX10 (ads-1 mutant), BX259 (acl-7 mutant), and BX275 (fard-1 mutant). Compound identity for each detected lipid as well as raw, normalized, or transformed mass counts on each of three tabs. Note, several of the lipids were not uniformly detected or of low abundance, and thus were filtered by the MetaboAnalyst parameters used and not represented on the ‘Normalized’ and ‘Normalized-Log10 Transformed’ tabs.
- https://cdn.elifesciences.org/articles/82210/elife-82210-fig2-data1-v1.xlsx
Figure 2—figure supplement 1
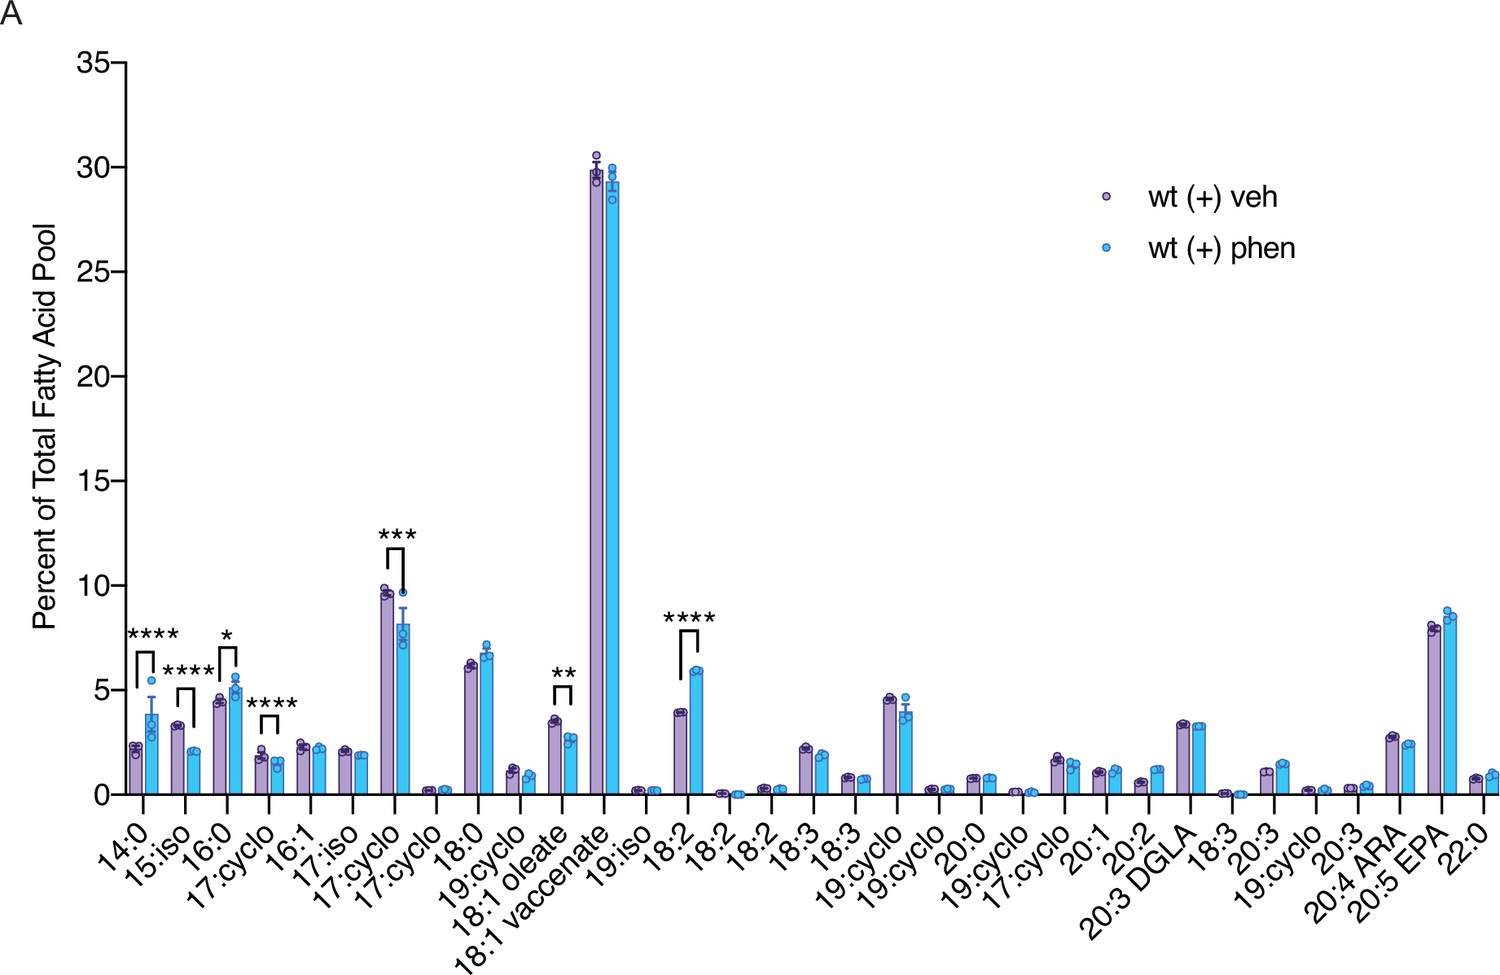
Biguanide treatment modulates abundance of fatty acids in C. elegans.
A comparison of the percent of the total fatty acid pool for 33 fatty acids shows that 7 fatty acids are significantly altered in phenformin-treated wild-type worms. n=3 biological replicates. *, p<0.05; **, p<0.01; ***, p<0.001; ****, p<0.0001 by multiple t-tests (corrected for multiple hypothesis testing with two-stage step-up method of Benjamini, Krieger, and Yekutieli).
Figure 2—figure supplement 2
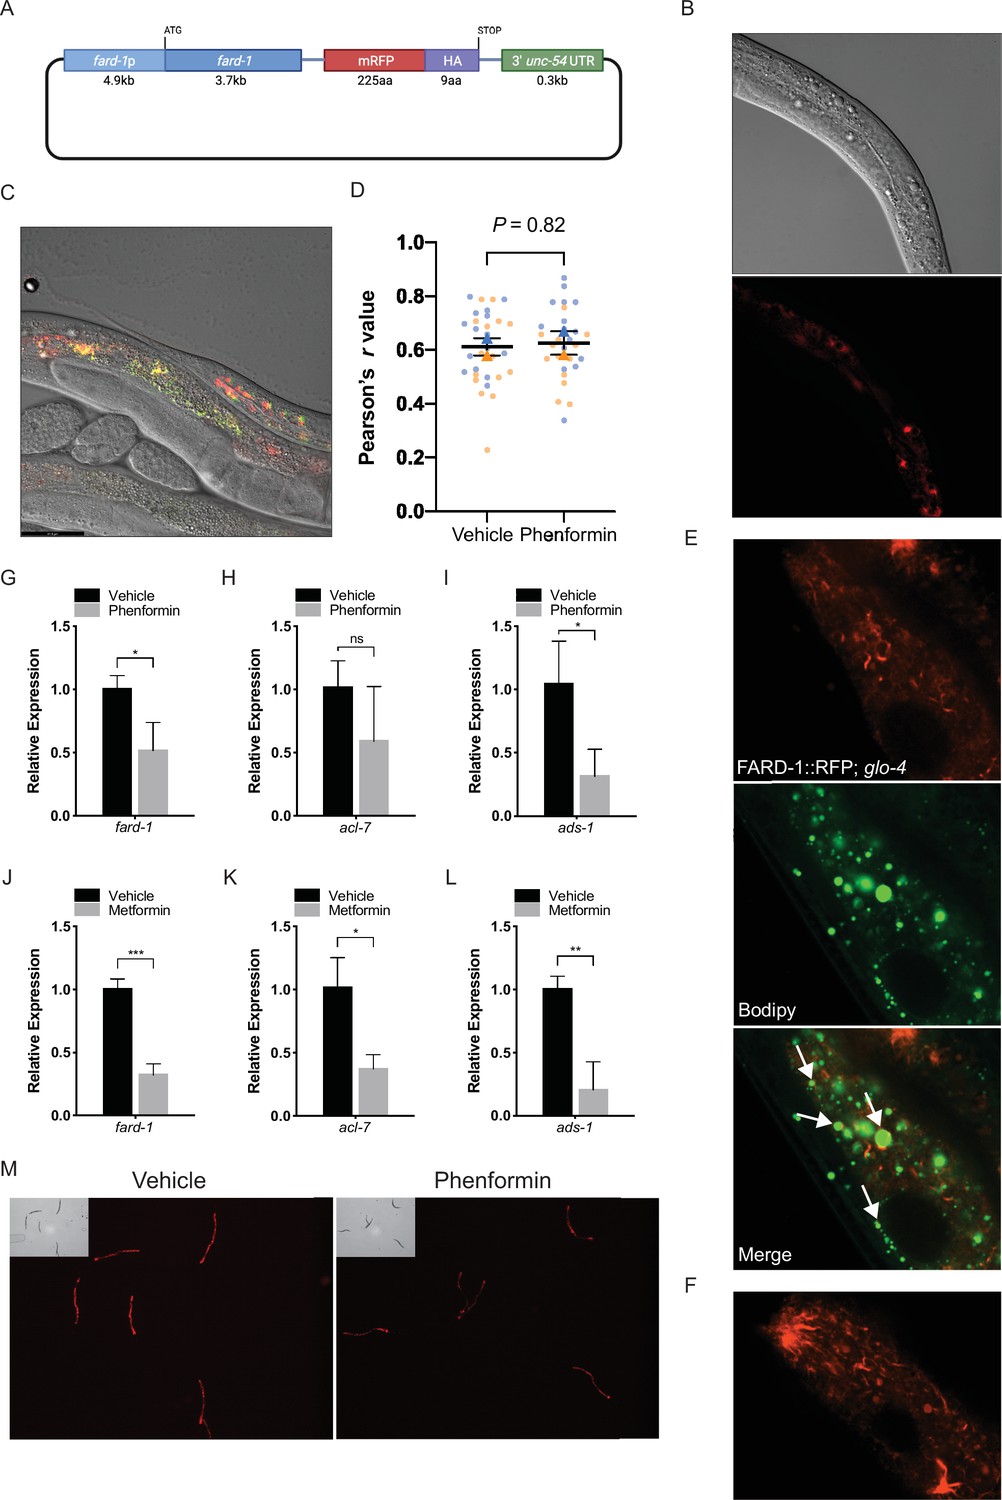
FARD-1::RFP localizes to intestinal lipid droplets and peroxisomes and is not positively regulated at the RNA or protein level by phenformin.
(A) Schematic representation of the C. elegans FARD-1::RFP overexpression reporter. (B) FARD-1::RFP (fard-1 oe1) exhibits intestinal expression in C. elegans. FARD-1 displays a cytoplasmic distribution and an association with structures resembling lipid droplets (B, arrows). (C) Co-expression of FARD-1::RFP and peroxisomally targeted GFP::PTS1 in transgenic animals indicates partial colocalization of FARD-1 with peroxisomes in intestine. (D) Superplot displays colocalization of RFP and GFP in vehicle- or phenformin-treated GFP::PTS1; FARD-1::RFP transgenics (N=20 total worms assessed; 5 worms per condition; 3 images per worm [upper/mid/lower intestine]) for a total of 15 images (dots) per replicate; blue = replicate 1, orange = replicate 2. Correlation coefficients were separately calculated for each biological replicate and the mean is represented for each pool (blue or orange triangle). These two means were then used to calculate the average (horizontal bar), standard error of the mean (error bars), and p-value. Analysis of the average Pearson’s r values demonstrates no significant difference between colocalization of FARD-1::RFP and GFP::PTS1 in vehicle or phenformin-treated worms. n=2 biological replicates. (E) Confocal imaging of an integrated FARD-1::RFP reporter (fard-1 oe3) in C. elegans stained with C1-BODIPY-C12 (treated with glo-4 RNAi to remove BODIPY positive lysosome related organelles) demonstrates localization of FARD-1 protein to the surface of lipid droplets in the worm intestine. (F) In fard-1(oe3) transgenics, confocal imaging indicates FARD-1::RFP organization into web-like structures and bright punctae that represent the intersection of these ‘webs’. These structures may represent smooth endoplasmic reticulum. Images were taken using a Zeiss Plan-Apochromat 63×/1.4 Oil DIC M27 objective with a 2.0 scan zoom for each field. (G–I) Levels of fard-1, acl-7, and ads-1 mRNA decrease in wild-type C. elegans treated with 4.5 mM phenformin versus vehicle. n=3 biological replicates; ns, not significant; *, p<0.05 by unpaired t-test. (J–L) Levels of fard-1, acl-7, and ads-1 mRNA decrease in wild-type C. elegans treated with 50 mM metformin versus vehicle. n=3 biological replicates; *, p<0.05; **, p<0.01; ***, p<0.001 by unpaired t-test. (M) Phenformin (4.5 mM) results in decreased expression of the FARD-1::RFP translational reporter (fard-1 oe1). n=3 biological replicates; total assessed: N=30 worms per condition (10 worms per replicate).
Figure 3
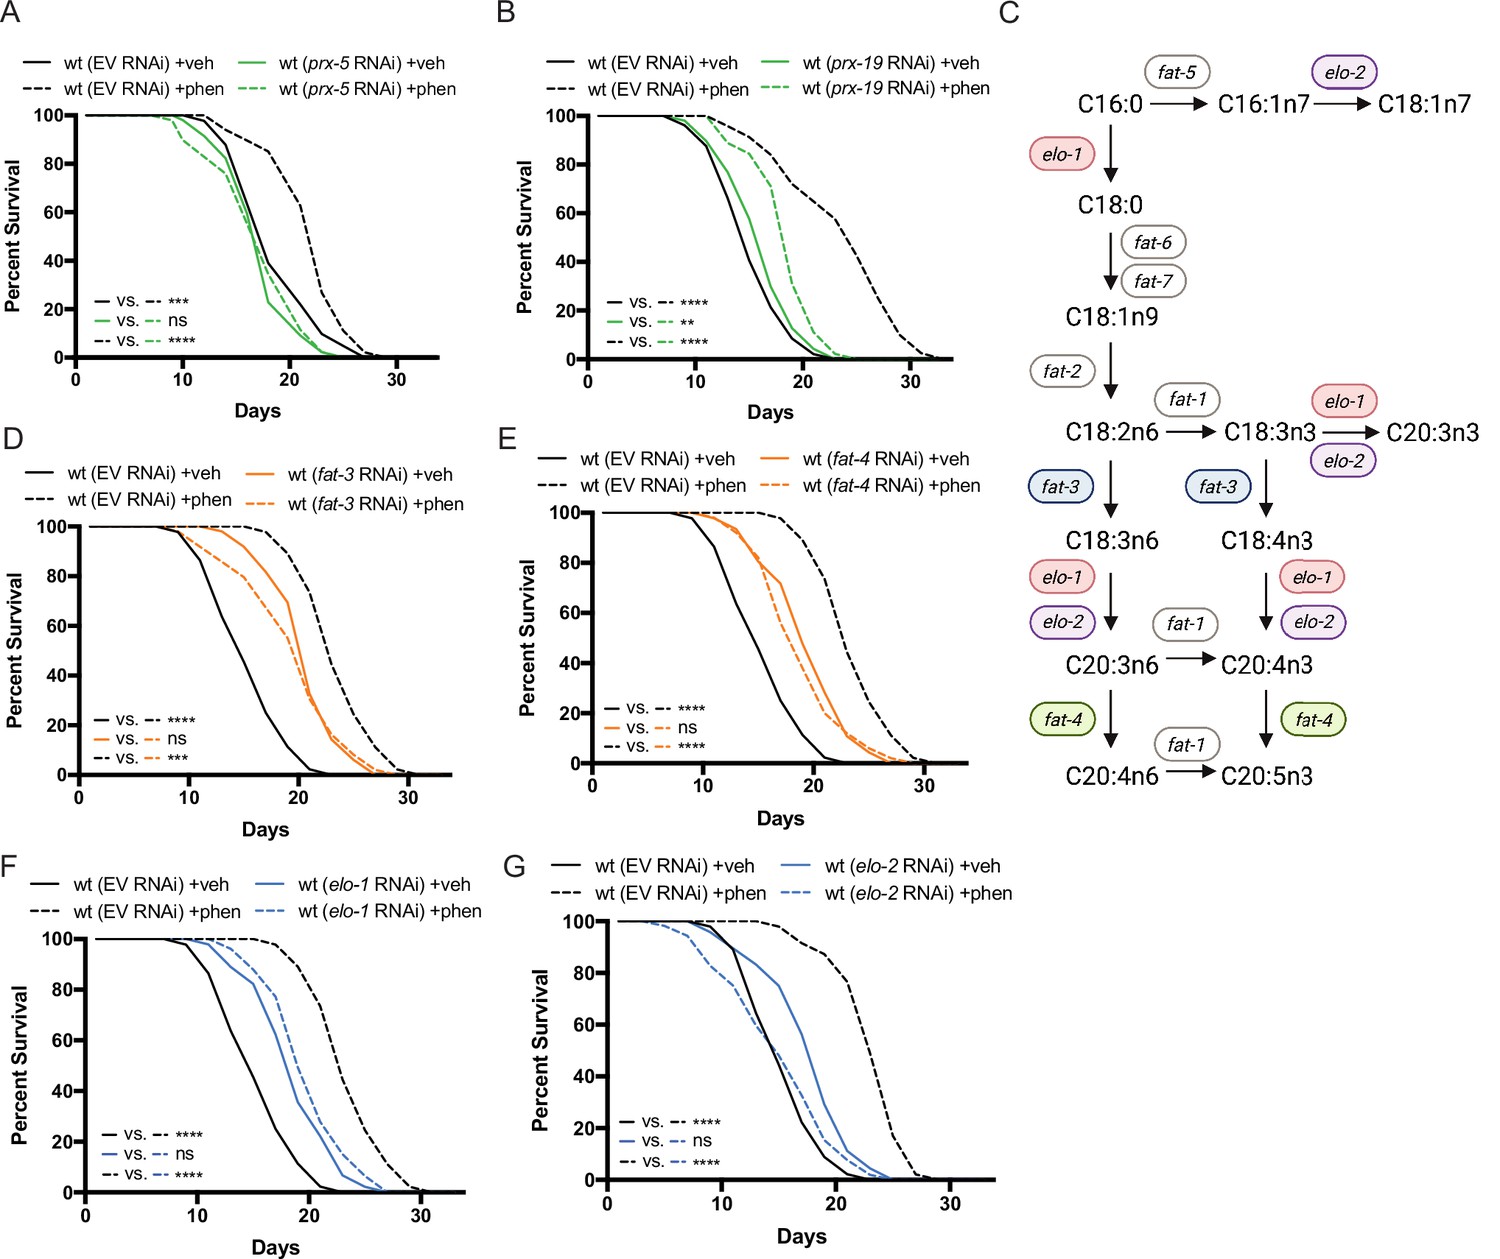
Peroxisomal protein import, fatty acid elongases, and fatty acid desaturases are required for the pro-longevity effects of biguanides.
(A–B) Knockdown of prx-5 (A) and prx-19 (B) by RNA interference (RNAi) eliminates or significantly suppresses phenformin-mediated lifespan extension. (C) Schematic representation of the mono- (MUFA) and polyunsaturated fatty acid (PUFA) synthesis pathway in C. elegans (adapted from Figure 1 of Watts, 2016). (D–G) RNAi of two fatty acid desaturases (D–E) and two fatty acid elongases (F and G) involved in the synthesis of 18- and 20-carbon PUFAs blunt phenformin-mediated lifespan extension in wild-type worms. Colored symbols for elo and fat genes (vs. those in black and white) in (C) indicates those that inhibit phenformin lifespan extension when knocked down by RNAi. For (A, B) and (D–G), results are representative of two to three biological replicates. **, p<0.01; ***, p<0.001; ****, p<0.0001 by log-rank analysis. Note that (D–G) contain the same wild-type controls as they are visualized from the same replicate of the study. See also Supplementary file 1 for tabular survival data and biological replicates.
Figure 4 with 1 supplement
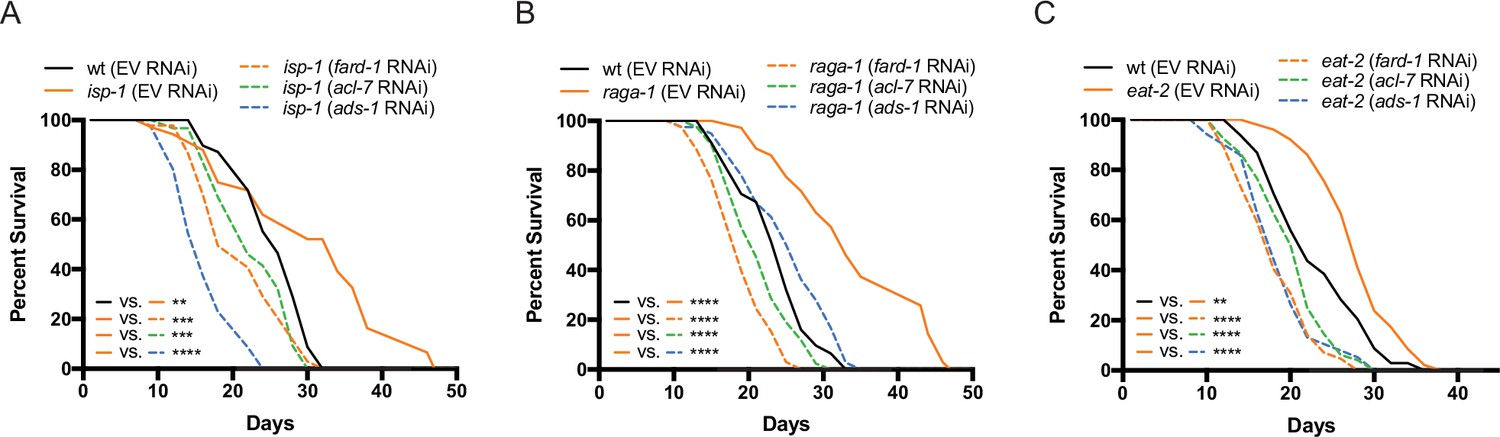
Genes involved in ether lipid biosynthesis are required for lifespan extension in multiple longevity paradigms.
(A–C) isp-1, raga-1, and eat-2 mutants display extended lifespan relative to wild-type animals that is dependent upon the three members of the ether lipid biosynthetic pathway. Results are representative of three biological replicates. **, p<0.01; ***, p<0.001; ****, p<0.0001 by log-rank analysis. See also Figure 4—figure supplement 1 and Supplementary file 1 for tabular survival data and biological replicates.
Figure 4—figure supplement 1

Ether lipid biosynthetic genes are not necessary for daf-2-dependent lifespan extension.
daf-2 mutants display extended lifespan relative to wild-type animals. RNA interference (RNAi) knockdown of fard-1, acl-7, and ads-1 does not impact lifespan extension in these mutants. ns, p>0.05; ***, p<0.001 by log-rank analysis. For tabular survival data and biological replicates, see also Supplementary file 1.
Figure 5 with 1 supplement
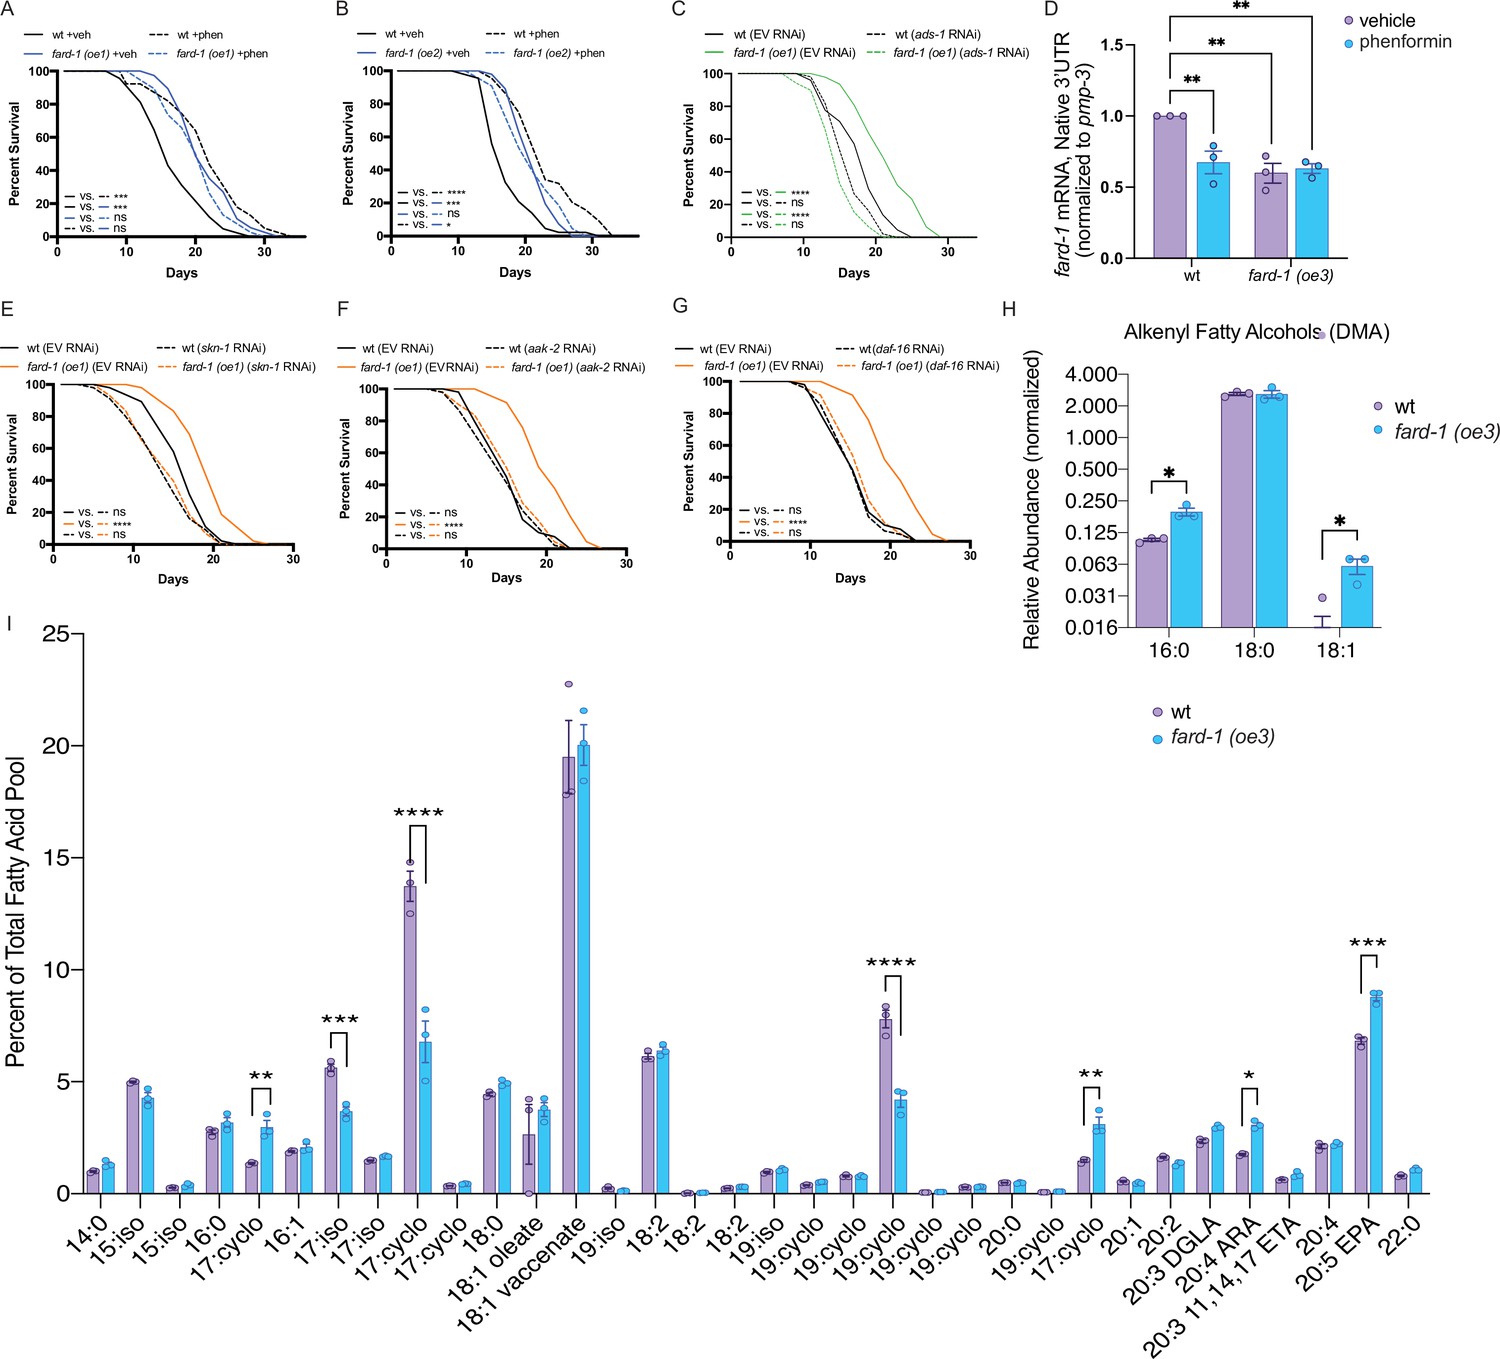
fard-1 overexpression is sufficient to extend lifespan by modulating ether lipid synthesis.
(A–B) Two independently generated fard-1 overexpression (fard-1 oe1 and fard-1 oe2) transgenic strains exhibit lifespan extension that is not further extended by concomitant phenformin treatment. (C) RNA interference (RNAi) knockdown of ads-1 fully suppresses fard-1(oe1) lifespan extension, indicating that the fard-1(oe)-mediated lifespan extension is dependent upon ether lipid synthesis. (D) qRT-PCR analysis of wild-type and fard-1(oe3) animals treated with vehicle or phenformin until adult day 1 reveals that both biguanide treatment and fard-1 exogenous overexpression results in an equivalent reduction of native fard-1 gene expression, as indicated by primers targeting the native 3’ UTR of fard-1, a sequence not represented in the fard-1 overexpression transgene (n=3 biological replicates). (E–G) RNAi of skn-1 (E), aak-2 (F), and daf-16 (G) suppress fard-1(oe1)-mediated lifespan extension. For (A–C) and (E–G), results are representative of two to three biological replicates. *, p<0.05; ***, p<0.001; ****, p<0.0001 by log-rank analysis. Note that (F–G) contain the same wild-type controls as they are visualized from the same replicate of the study. See also Figure 4—figure supplement 1 and Supplementary file 1 for tabular survival data and biological replicates. **, p<0.01 by two-way ANOVA followed by Tukey’s multiple comparisons test. (H) Worms overexpressing a backcrossed, integrated FARD-1 (fard-1 oe3) display a significant increase in 16:0 and 18:1 but not 18:0 alkenyl ether lipids by gas chromatography/mass spectrometry (GC/MS). (I) Comparison of the total fatty acid pool indicates that the polyunsaturated fatty acids 20:4 arachidonic acid (ARA) and 20:5 eicosapentaenoic acid (EPA) are significantly increased in fard-1 overexpressing (fard-1 oe3) worms vs. wild-type animal, while several isomethyl (iso) and cyclopropyl (cyclo) fatty acids change in opposing directions. For (H–I), n=3 biological replicates. *, p<0.05; **, p<0.01; ***, p<0.001; ****, p<0.0001 by multiple t-tests (with multiple hypothesis correction by two-stage step-up method of Benjamini, Krieger, and Yekutieli).
Figure 5—figure supplement 1
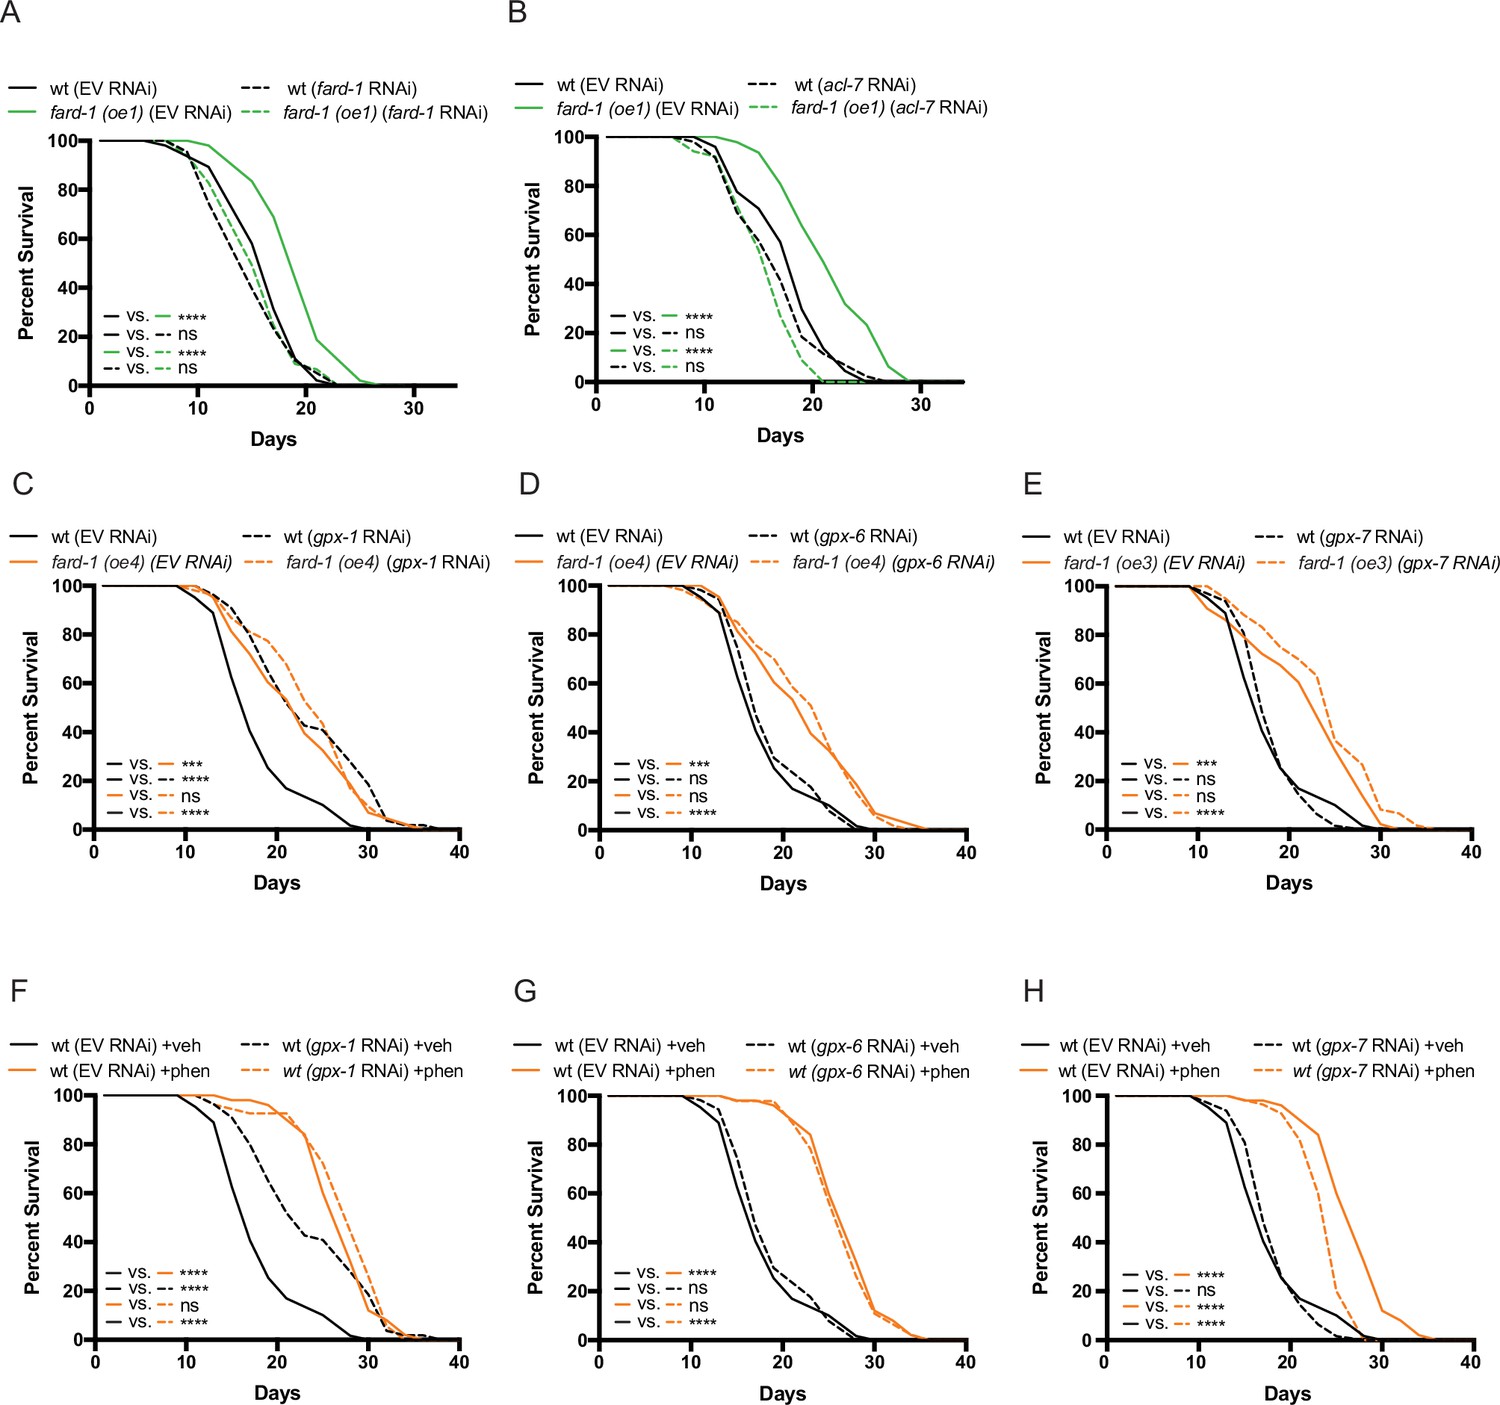
fard-1 overexpression extends lifespan in a manner dependent upon ether lipid biosynthesis, and not apparently involving ferroptosis.
(A–B) RNA interference (RNAi) knockdown of fard-1 (A) and acl-7 (B) suppresses fard-1 overexpression(oe1)-associated lifespan extension. (C–E) Independent knockdown of glutathione peroxidases, gpx-1 (C), gpx-6 (D), or gpx-7 (E) by RNAi does not mitigate lifespan extension by integrated fard-1 overexpression (fard-1 oe3 and fard-1 oe4), as would be expected if fard-1 overexpression extended lifespan by lowering ferroptosis. gpx-1 knockdown unexpectedly extends lifespan in a non-additive manner with fard-1 (oe4). (F–H) Similarly, knockdown of gpx-1 (F), gpx-6 (G), or gpx-7 (H) by RNAi do not suppress phenformin-mediated lifespan extension. For (A–H), results are representative of two to three biological replicates. Note that (C–H) contain the same wild-type (wt) controls as they are visualized from the same replicate of the study. ***, p < 0.001; ****, p < 0.0001 by log-rank analysis. For tabular survival data and biological replicates, see also Supplementary file 1.
Figure 6 with 3 supplements
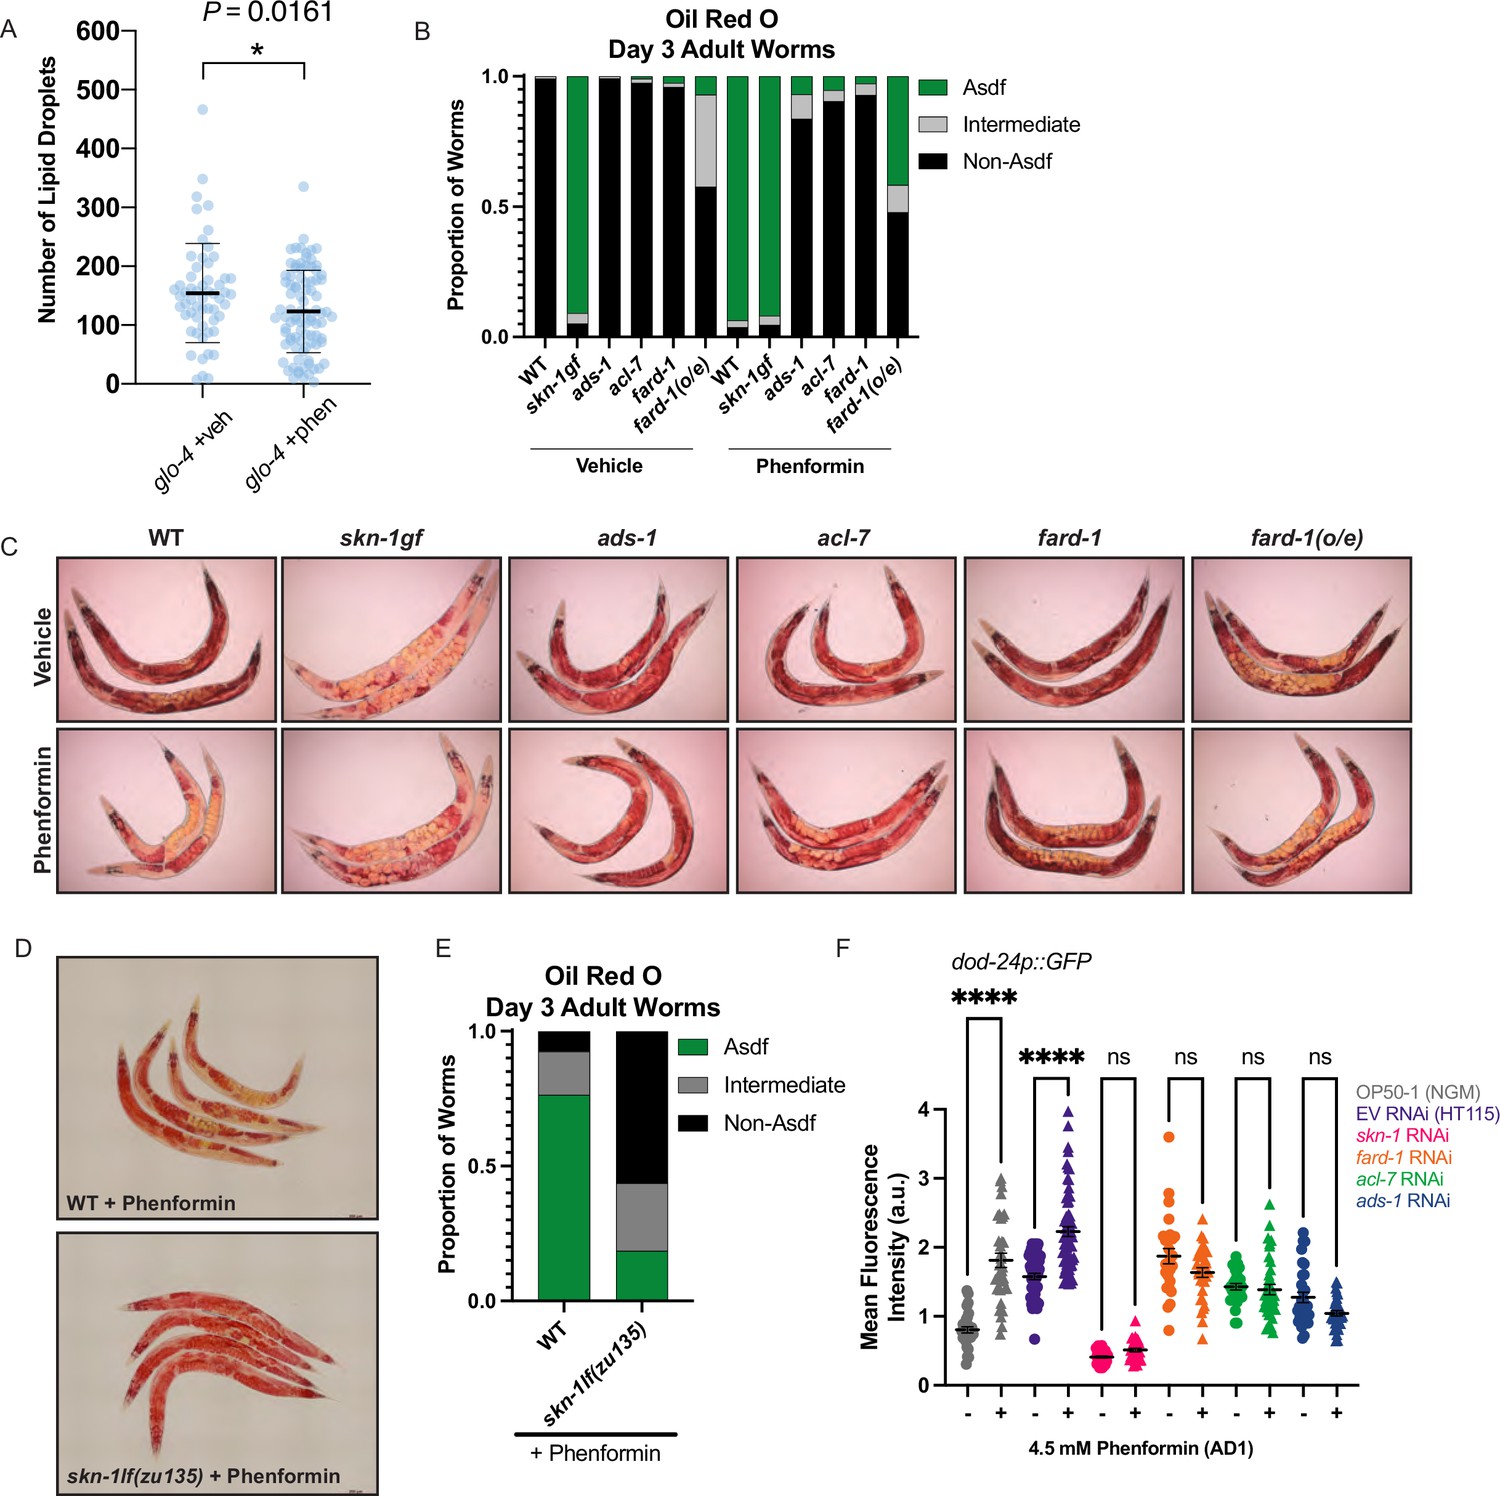
Phenformin modulates systemic lipid metabolism through an ether lipid-skn-1 signaling relay.
(A) The number of intestinal, C1-BODIPY-C12 labeled lipid droplets are significantly lower in day 1 adult phenformin-treated animals versus vehicle (FARD-1::RFP reporter transgenic [fard-1 oe3] worms are also treated with glo-4 RNA interference (RNAi) to remove BODIPY-positive lysosome-related organelles). n=2 biological replicates. *, p<0.05 by unpaired t-test. (B–C) Oil-red-O staining of day 3 adult phenformin-treated wild-type animals indicates that drug treatment leads to age-dependent somatic depletion of fat (Asdf), as previously reported for skn-1 gain-of-function mutants (skn-1 gf), suggesting that phenformin activates Asdf downstream of skn-1. Quantification (B) indicates that the proportion of Asdf animals is non-additively increased by phenformin treatment in an skn-1gf mutant, and that phenformin is no longer able to activate Asdf in three independent ether lipid deficient mutants (ads-1, acl-7, and fard-1). fard-1 overexpression results in an Asdf phenotype, moderately strengthened by phenformin treatment. For (B–C), n=3 biological replicates. (D–E) Oil-red-O staining of day 3 adult phenformin-treated wild-type and skn-1lf(zu135) animals reveals that the total loss of skn-1 function completely abrogates the phenformin-induced Asdf phenotype. Quantification (E) reveals that skn-1lf(zu135) decreases the proportion of Asdf animals relative to wild-type controls treated with phenformin. For (D–E), data represent n=3 biological replicates. (F) Phenformin treatment induces intestinal expression of dod-24, an established SKN-1 response target and innate immune effector, as indicated by increased dod-24p::GFP expression, in both OP50-1 and HT115 bacterial diets. RNAi knockdown of skn-1, fard-1, acl-7, and ads-1 all prevent significant phenformin-mediated induction of dod-24p::GFP. Quantification performed with at least 30 animals in each condition (10 animals assayed per replicate for 3 biologically independent experiments). ns, p>0.05; ****, p<0.0001 by two-way ANOVA followed by Tukey’s multiple comparisons test.
Figure 6—figure supplement 1
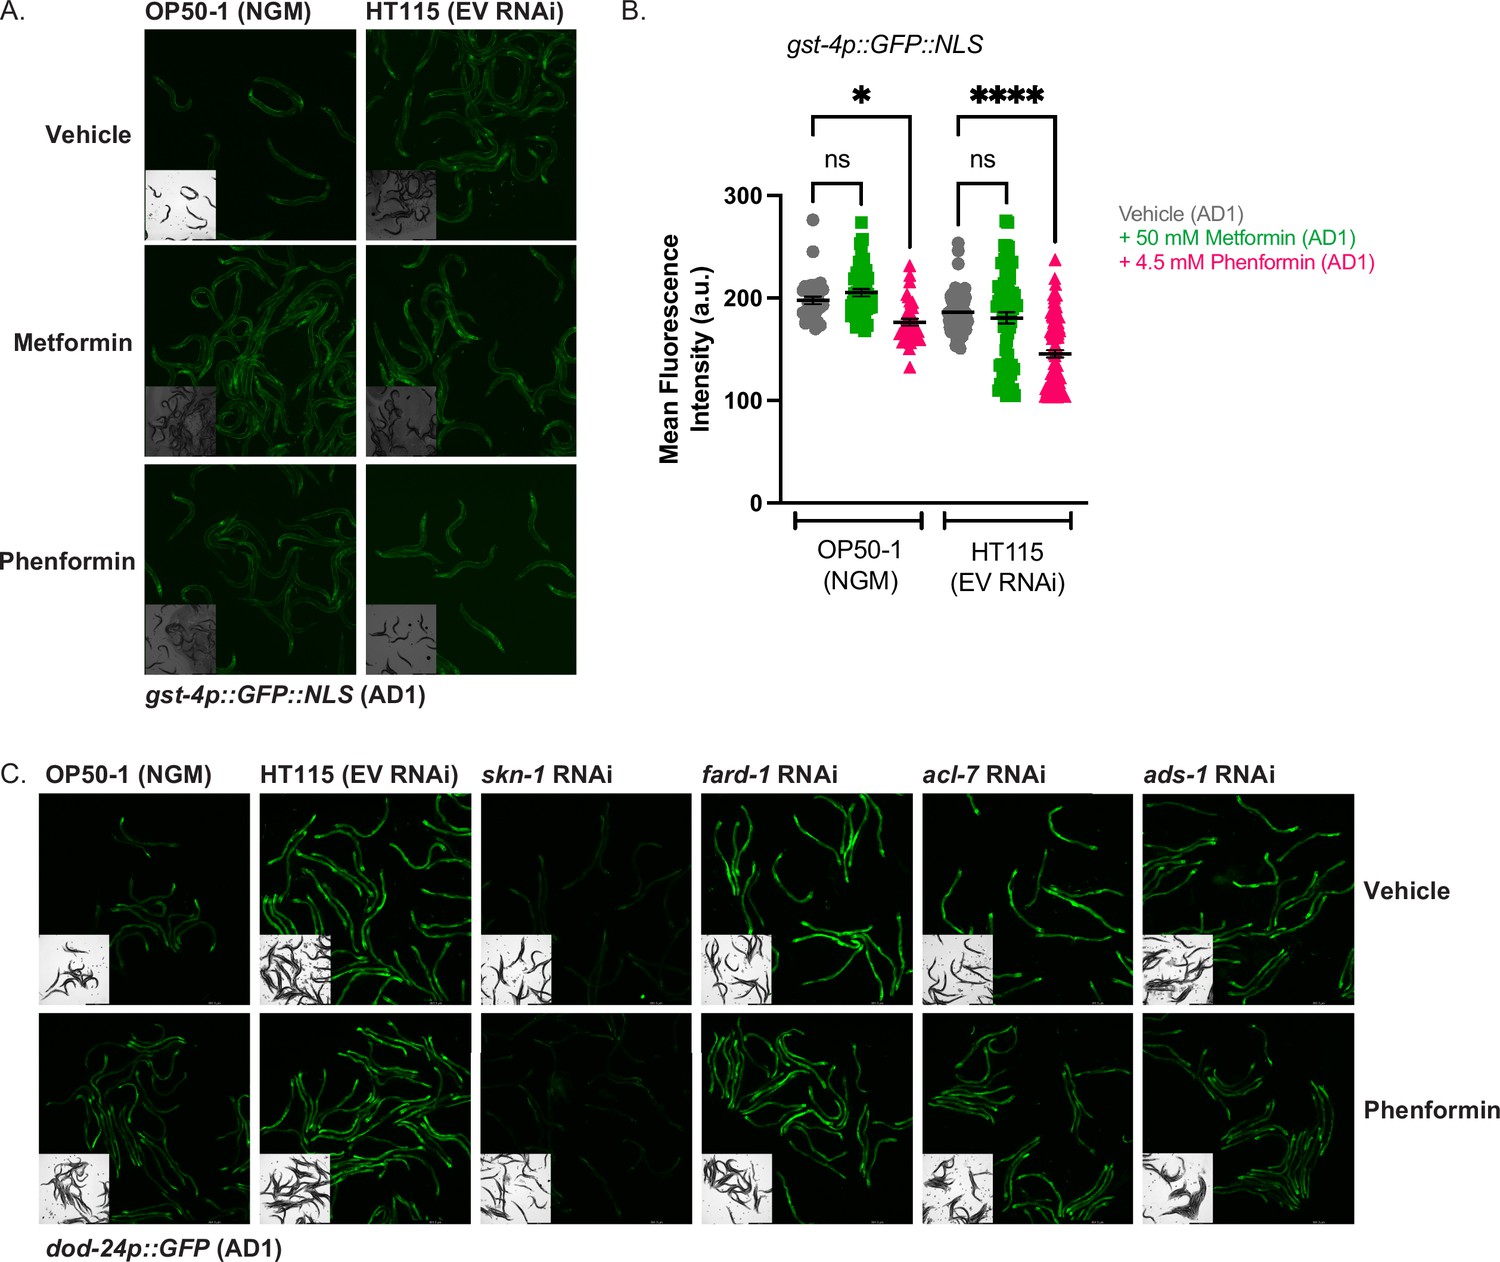
Biguanides do not activate gst-4 expression irrespective of bacterial diet.
(A–B) GFP quantification of gst-4p::NLS::GFP animals treated from hatching with vehicle, 50 mM metformin, or 4.5 mM phenformin on either OP50-1 seeded nematode growth media (NGM) plates or EV HT115 seeded RNA interference (RNAi) plates, and imaged at adult day 1. For (B), data represent the mean ± SEM of at least 30 animals per condition (at least 10 animals per replicate combined from three biologically independent experiments). ns, p>0.05; *, p<0.05; ****, p<0.0001 by two-way ANOVA followed by Tukey’s multiple comparisons testing. (C) Representative images of dod-24p::GFP animals treated from hatching with vehicle or 4.5 mM phenformin and grown on OP50-1 seeded NGM plates, or RNAi plates seeded with EV, skn-1, fard-1, acl-7, or ads-1 RNAi and imaged at adult day 1, as quantified in Figure 6F.
Figure 6—figure supplement 2
Disruption of bacterial growth and metabolism does not prevent biguanide-mediated induction of ether lipid synthesis.
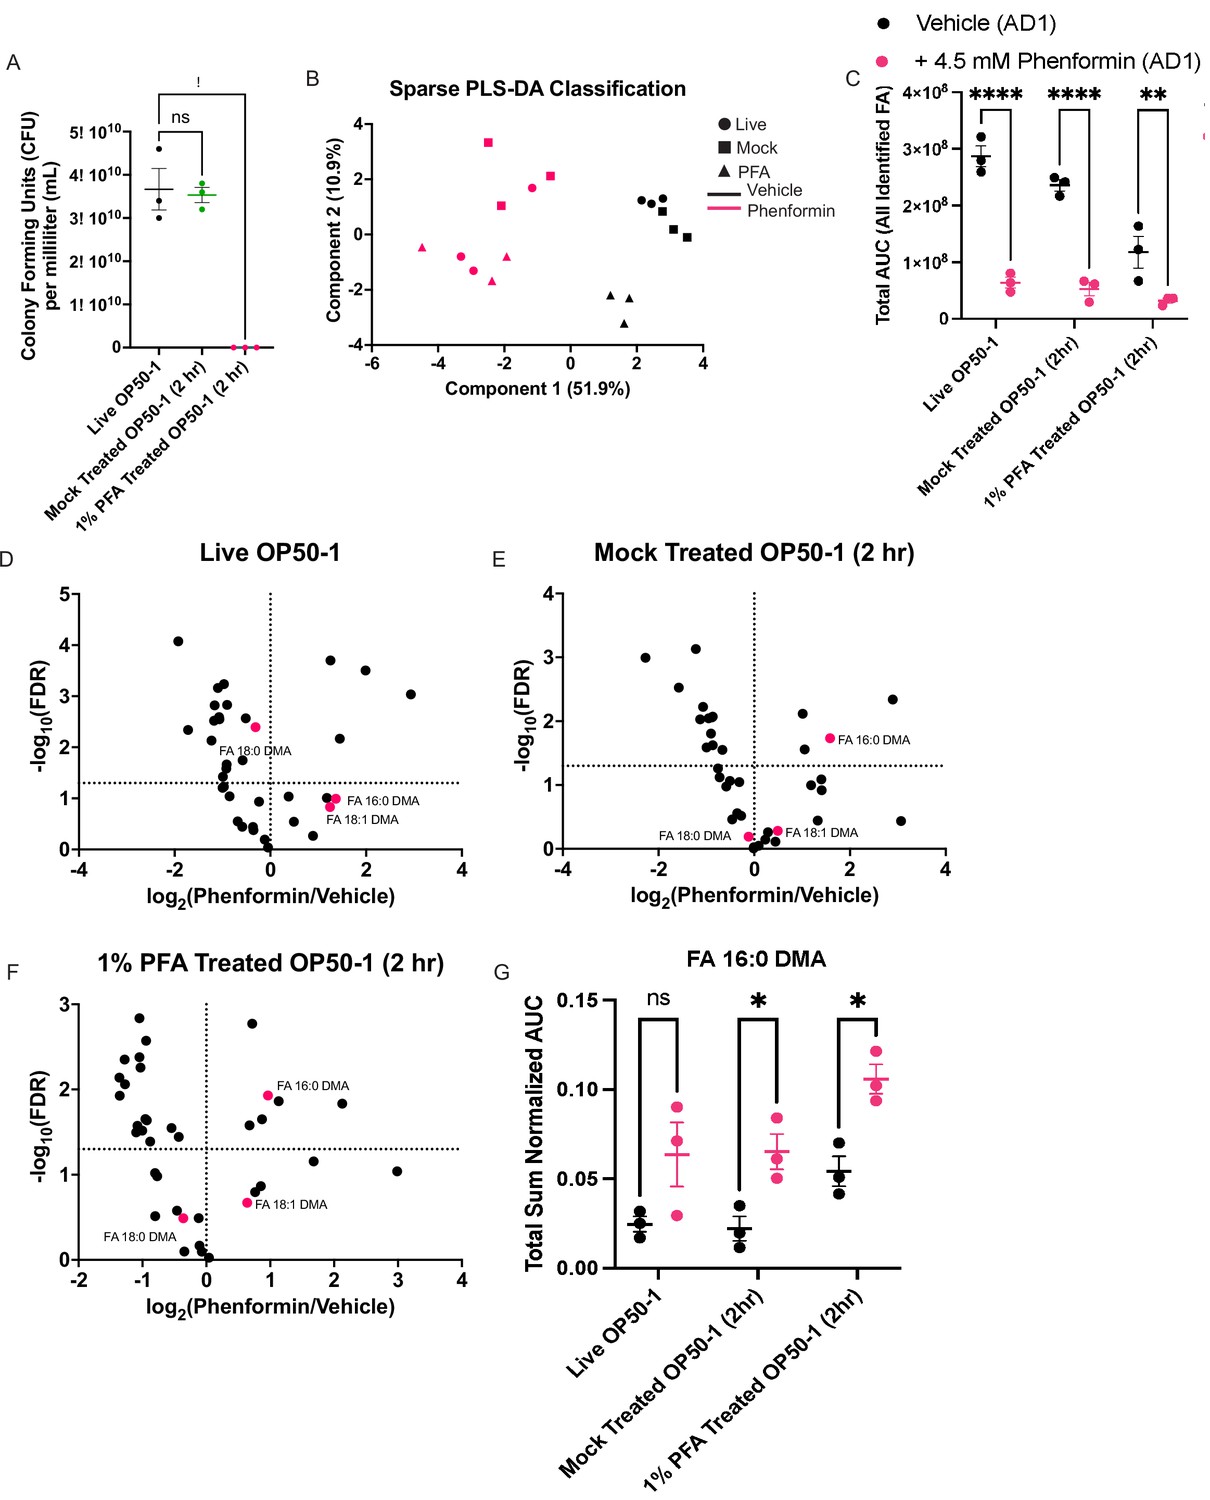
(A) Bacterial titer assay measuring viability of OP50-1 treated with standard seeding conditions (live OP50-1), treated with 1% phosphate buffered saline (PBS) for 2 hr (mock-treated OP50-1 [2 hr]), or treated with 1% paraformaldehyde (PFA) for 2 hr (1% PFA-treated OP50-1 [2 hr]). Data represent mean ± SEM, n=3 biological replicates. ns, p>0.05; *, p<0.05 by one-way ANOVA followed by Dunnett’s multiple comparisons test. (B) Sparse partial-least squares linear discriminant analysis (PLS-DA) of total sum normalized AUC for lipids measured using extraction and derivatization of total fatty acids as fatty acid methyl esters analyzed by gas chromatography/mass spectrometry (GC/MS) in wild-type animals treated with vehicle/4.5 mM phenformin until adult day 1, and grown either on live OP50-1, mock-treated OP50-1 (2 hr), or 1% PFA-treated OP50-1 (2 hr). Samples separate predominantly on Component 1 by drug treatment. n=3 biological replicates. (C) Combined total area values for all derivatized fatty acids identified in samples collected in (B) reveal that biguanides reduce total fatty acid abundance irrespective of bacterial growth conditions. The same number of worms of the same stage were used as input for each biological replicate. Data represent mean ± SEM, n=3 biological replicates for each condition. **, p<0.01; ****, p<0.0001 by two-way ANOVA followed by Tukey’s multiple comparisons testing. (D–F) Volcano plots for all differentially expressed lipids reveal that ether lipids are preferentially sustained despite a global loss of somatic lipids observed, irrespective of bacterial growth conditions. Fold change and false discovery rate (FDR) calculations were performed with t-tests followed by Benjamini-Hochberg FDR adjustment using MetaboAnalyst 3.0. (G) Total sum normalized AUC measurement of 16:0 dimethylacetal (DMA) levels across bacterial growth conditions and drug treatments reveal that biguanides increase 16:0 DMA levels irrespective of the bacterial growth and metabolic conditions. Data represent mean ± SEM. ns, p>0.05, *; p<0.05 by two-way ANOVA followed by Tukey’s multiple comparisons testing.
Figure 6—figure supplement 3
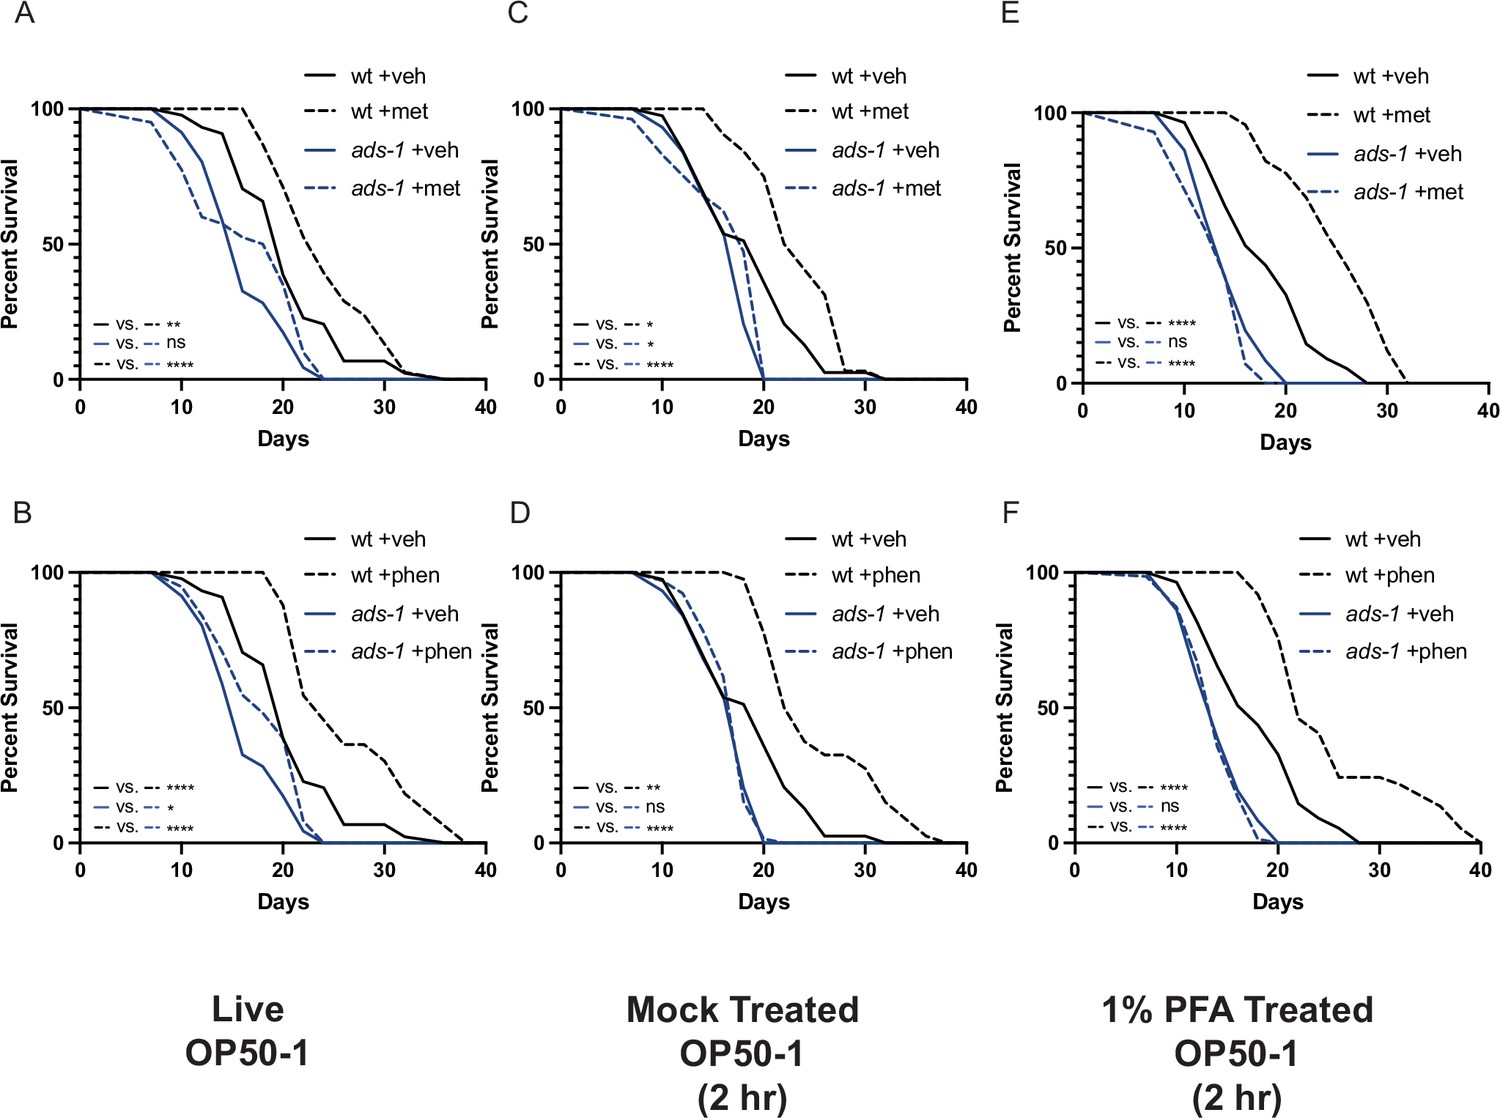
Inactivation of ether lipid machinery disrupts biguanide-mediated lifespan extension independent of effects on bacterial growth or metabolism.
Lifespan analyses of wild-type (wt) or ads-1 mutant animals grown on live OP50-1 (A–B), mock-treated OP50-1 for 2 hr (C–D), or 1% paraformaldehyde (PFA)-treated OP50-1 for 2 hr (E–F) reveal that ads-1-mediated ether lipid deficiency disrupts metformin (top row) or phenformin (bottom row) mediated lifespan extension independent of whether the bacterial food source is live or killed and metabolically inactive (1% PFA-treated). Results are representative of two biological replicates. *, p<0.05; **, p<0.01; ***, p<0.001; ****, p<0.0001 by log-rank analysis. Note that the results from panels (A–B), (C–D), and (E–F) share the same same-day wild-type controls as they originate from the same replicate. Please refer to Supplementary file 1 for tabular survival data and biological replicate summary statistics.
Figure 7
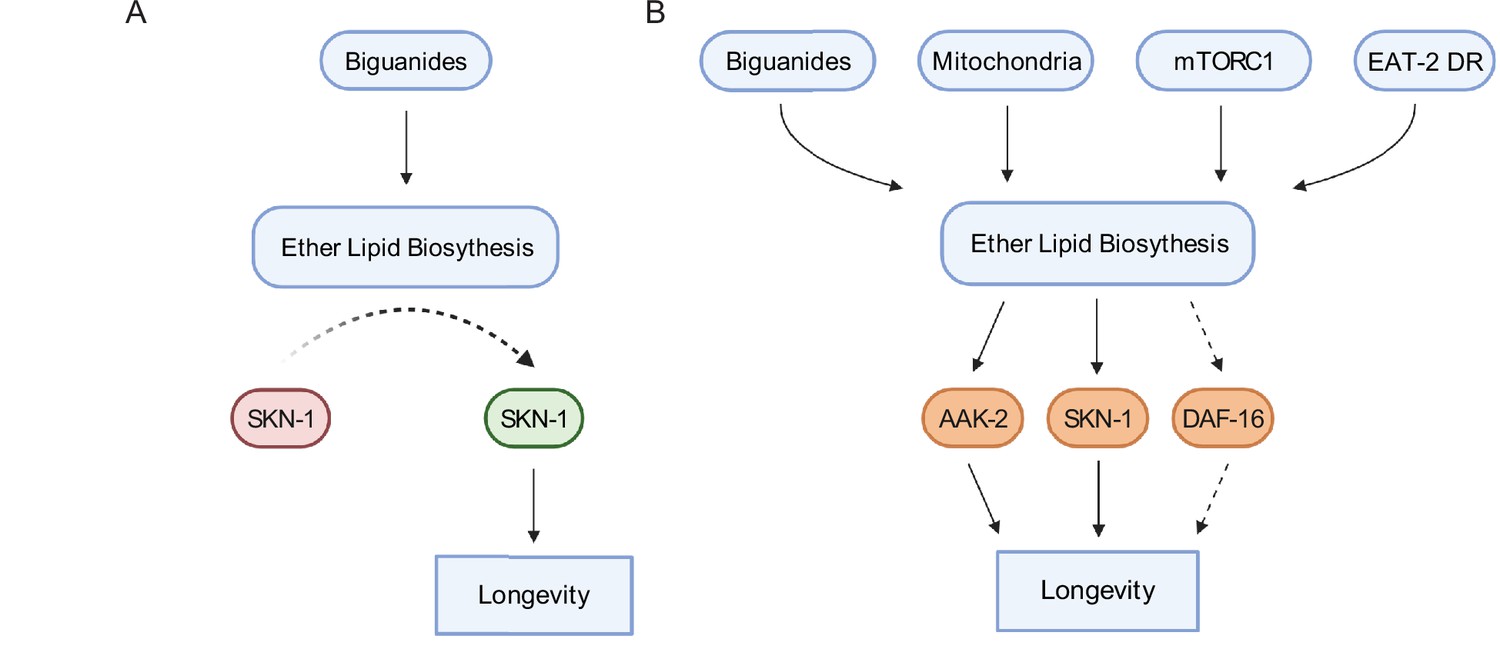
Schematic representation for the role of the ether lipid biosynthetic machinery in multiple pro-longevity paradigms.
(A) Model of ether lipid action in biguanide-prompted lifespan extension. Activation of ether lipid biosynthesis leads to longevity-promoting activity of metabolic stress defenses downstream of the transcription factor skn-1. (B) Model portraying a broader than previously appreciated role of ether lipids in longevity downstream of biguanides, mitochondrial electron transport inhibition, mTORC1 inhibition, and eat-2 mutation-mediated dietary restriction (EAT-2 DR). Dashed lines for DAF-16 indicate its requirement for fard-1 overexpression-, but not biguanide-mediated lifespan extension, suggesting a context-dependent role for daf-16/FoxO in mediating pro-longevity outcomes through modulation of ether lipid levels.
Author response image 1

Gain of function mutation in SKN-1 results in global depletion of free fatty acid levels and elevates ether lipid precursor alcohols.
(A) Quantification of total area under the curve (AUC) measurements for all identified free fatty acids (FFA) in wildtype (N2) and skn-1gf(lax188) animals at Adult Day 2 using fatty acid methyl ester extraction followed by gas chromatography – mass spectrometry (FAME GC/MS). (B) Quantification of alkenyl dimethylacetal fatty alcohols (DMA) in N2 and skn-1gf(lax188) animals at Adult Day 2 using FAME GC/MS. Data are total sum normalized to percentage of total FFA pool. For A-B, data represent the mean +/- SEM of n = 4 independent biological replicates. *, P < 0.05; **, P < 0.01; ***, P < 0.001; ****, P < 0.0001 by Student’s t-test (A) or multiple t-tests with multiple hypothesis correction by two-stage step-up method of Benjamini, Krieger, and Yekutieli (B).
Tables
Key resources table
| Reagent type (species) or resource | Designation | Source or reference | Identifiers | Additional information |
|---|---|---|---|---|
| Strain, strain background (Escherichia coli) | OP50-1 | Caenorhabditis Genetics Center | RRID: WB-STRAIN:WBStrain00041971 | Standard laboratory stock |
| Strain, strain background (Escherichia coli) | HT115(DE3) | Caenorhabditis Genetics Center | RRID: WB-STRAIN:WBStrain00041079 | Background strain for RNAi clones utilized from Ahringer and Vidal Libraries |
| Strain, strain background (Caenorhabditis elegans) | Bristol N2 (wt) | Caenorhabditis Genetics Center | RRID: WB-STRAIN:WBStrain00000001 | Standard laboratory wild-type strain |
| Strain, strain background (Caenorhabditis elegans) | fard-1(wa28) [G261D] | Caenorhabditis Genetics Center | RRID: WB-STRAIN:WBStrain00004025 | BX275 |
| Strain, strain background (Caenorhabditis elegans) | acl-7(wa20) [R234C] | Caenorhabditis Genetics Center | RRID: WS-STRAIN:WBStrain00004024 | BX259 |
| Strain, strain background (Caenorhabditis elegans) | ads-1(wa3) [G454D] | Caenorhabditis Genetics Center | RRID: WB-STRAIN:WBStrain00004007 | BX10 |
| Strain, strain background (Caenorhabditis elegans) | daf-2(e1370) | Caenorhabditis Genetics Center | RRID: WB-STRAIN:WBStrain00004309 | CB1370 |
| Strain, strain background (Caenorhabditis elegans) | isp-1(qm150) | Caenorhabditis Genetics Center | RRID: WB-STRAIN:WBStrain00026672 | MQ989 |
| Strain, strain background (Caenorhabditis elegans) | raga-1(ok701) | Caenorhabditis Genetics Center | RRID: WB-STRAIN:WBStrain00035849 | VC533 |
| Strain, strain background (Caenorhabditis elegans) | eat-2(da465) | Caenorhabditis Genetics Center | RRID: WB-STRAIN:WBStrain00005463 | DA465 |
| Strain, strain background (Caenorhabditis elegans) | mgIs43[ges-1p::GFP::PTS1] | Soukas Laboratory | N/A | MGH48 |
| Strain, strain background (Caenorhabditis elegans) | skn-1(lax188) | Caenorhabditis Genetics Center | RRID: WB-STRAIN:WBStrain00034420 | skn-1gf, SPC168 |
| Strain, strain background (Caenorhabditis elegans) | agIs6[dod-24p::GFP] | Caenorhabditis Genetics Center | RRID: WB-STRAIN:WBStrain00004921 | CF3556 |
| Strain, strain background (Caenorhabditis elegans) | dvIs19[(pAF15)gst-4p::GFP::NLS] | Caenorhabditis Genetics Center | RRID: WB-STRAIN:WBStrain00005102 | CL2166 |
| Strain, strain background (Caenorhabditis elegans) | skn-1(zu135) | Caenorhabditis Genetics Center | RRID: WB-STRAIN:WBStrain00007251 | skn-1lf, EU31 |
| Genetic reagent (Caenorhabditis elegans) | alxEx122[fard-1p::FARD-1::mRFP::HA unc-54 3'UTR myo-2p::GFP] | This study | MGH471 | fard-1 (oe1) |
| Genetic reagent (Caenorhabditis elegans) | alxEx135[fard-1p::FARD-1::mRFP::HA unc-54 3'UTR myo-2p::GFP] | This study | MGH472 | fard-1 (oe2) |
| Genetic reagent (Caenorhabditis elegans) | alxIs45[fard-1p::FARD-1::mRFP::HA::unc-54 3'UTR myo-2p::GFP] | This study | MGH605 | fard-1 (oe3), backcrossed into N2 8× |
| Genetic reagent (Caenorhabditis elegans) | alxIs46[fard-1p::FARD-1::mRFP::HA::unc-54 3’UTR myo-2p::GFP] | This study | MGH606 | fard-1 (oe4), backcrossed into N2 8× |
| Genetic reagent (Caenorhabditis elegans) | mgIs43[ges-1p::GFP::PTS1]; alxEx122[fard-1p::FARD-1::mRFP::HA::unc-54 3’UTR myo-2p::GFP] | This study | MGH607 | GFP::PTS1; FARD-1::RFP, prepared by crossing MGH48 into MGH471 |
| Sequence-based reagent | 5’-TGCATGCCTGCAGGTCGACTTTGACAAAAGTTCTGTTGCCG-3’ | This study | AS-4524 | Forward primer used to generate fard-1 overexpression construct |
| Sequence-based reagent | 5’-TTTGGGTCCTTTGGCCAATCGCTTTTTTGAAGATACCGAGAATAATCC-3’ | This study | AS-4527 | Reverse primer used to generate fard-1 overexpression construct |
| Sequence-based reagent | 5’-TGCTGATCGTATGCAGAAGG-3’ | This study | act-1 F | qRT-PCR Primer |
| Sequence-based reagent | 5’-TAGATCCTCCGATCCAGACG-3’ | This study | act-1 R | qRT-PCR Primer |
| Sequence-based reagent | 5’-GTTCCCGTGTTCATCACTCAT-3’ | This study | pmp-3 F | qRT-PCR Primer |
| Sequence-based reagent | 5’-ACACCGTCGAGAAGCTGTAGA-3’ | This study | pmp-3 R | qRT-PCR Primer |
| Sequence-based reagent | 5’-ACAAGTCACCAATGGCTCCAC-3’ | This study | fard-1 F | qRT-PCR Primer |
| Sequence-based reagent | 5’-GCTTTGGTCAGAGTGTAGGTG-3’ | This study | fard-1 R | qRT-PCR Primer |
| Sequence-based reagent | 5’-cgatagtgtgtctgttgattgtga-3’ | This study | fard-1 F (Native 3’ UTR) | qRT-PCR Primer |
| Sequence-based reagent | 5’-agttattgttgatgagagagtgcg-3’ | This study | fard-1 R (Native 3’ UTR) | qRT-PCR Primer |
| Sequence-based reagent | 5’-GTTTATGGCTGGCGTGTTG-3’ | This study | acl-7 F | qRT-PCR Primer |
| Sequence-based reagent | 5’-CGGAGAAGACAGCCCAGTAG-3’ | This study | acl-7 R | qRT-PCR Primer |
| Sequence-based reagent | 5’-GCGATTAACAAGGACGGACA-3’ | This study | ads-1 F | qRT-PCR Primer |
| Sequence-based reagent | 5’-CGATGCCCAAGTAGTTCTCG-3’ | This study | ads-1 R | qRT-PCR Primer |
| Chemical compound, drug | C1-BODIPY-C12 (green) | Invitrogen | Cat#D-3823 | N/A |
| Chemical compound, drug | 5-fluoro-2′-deoxyuridine (FUdR) | Fisher Scientific | Cat#F10705 | N/A |
| Chemical compound, drug | Metformin hydrochloride | MilliporeSigma | Cat#PHR1084 | N/A |
| Chemical compound, drug | Phenformin hydrochloride | MilliporeSigma | Cat#PHR1573 | N/A |
| Commercial assay or kit | Quantitect Reverse Transcription Kit | QIAGEN | Cat#205314 | N/A |
| Commercial assay or kit | Quantitect SYBR Green PCR Reagent | QIAGEN | Cat#204145 | N/A |
| Chemical compound, drug | Levamisole | MilliporeSigma | Cat#L9756 | N/A |
| Software, algorithm | OASIS2 | Structural Bioinformatics Laboratory, POSTECH | https://sbi.postech.ac.kr/oasis2/surv/ | N/A |
| Software, algorithm | MetaMorph | Molecular Devices | https://www.moleculardevices.com/products/cellular-imaging-systems/acquisition-and-analysis-software/metamorph-microscopy | N/A |
| Software, algorithm | Xcalibur (v4.1.31.9) | Thermo Fisher Scientific | Cat#OPTON-30965 | N/A |
| Software, algorithm | QualBrowser (v4.1.31.9) | Thermo Fisher Scientific | Cat#XCALI-97617 | N/A |
| Software, algorithm | MZmine (v2.36) | Open Source | RRID: SCR_012040, http://mzmine.github.io | N/A |
| Software, algorithm | MetaboAnalyst (v5.0) | N/A | https://www.metaboanalyst.ca | N/A |
| Software, algorithm | CellProfiler (v4.2.1) | Broad Institute | https://cellprofiler.org | N/A |
| Software, algorithm | Prism (v9.0) | GraphPad by Dotmatics | https://www.graphpad.com/ | N/A |
| Software, algorithm | Fiji/ImageJ2 (v2.13.1) | NIH | https://imagej.net/software/fiji/ | N/A |
Additional files
-
Supplementary file 1
Tabular and survival data including three biological replicates (unless otherwise noted) are shown for lifespan experiments related to Figures 1 and 3—5, Figure 1—figure supplement 1, Figure 1—figure supplement 2, Figure 4—figure supplement 1, Figure 5—figure supplement 1, and Figure 6—figure supplement 3.
Data present a summary of the conditions tested which, if applicable, include: (1) drug treatment with vehicle control and 4.5 mM phenformin or 50 mM metformin and/or (2) RNAi treatment to knockdown expression of the specific denoted gene. The C. elegans strain, number of subjects, restricted mean (days), standard error, 95% confidence interval (CI), 95% median CI, and p-values for relevant comparisons are noted among all conditions. ns, not significant; *, p<0.05; **, p<0.01; ***, p<0.001; ****, p<0.0001 by log-rank analysis.
- https://cdn.elifesciences.org/articles/82210/elife-82210-supp1-v1.xlsx
-
MDAR checklist
- https://cdn.elifesciences.org/articles/82210/elife-82210-mdarchecklist1-v1.docx
Download links
A two-part list of links to download the article, or parts of the article, in various formats.
Downloads (link to download the article as PDF)
Open citations (links to open the citations from this article in various online reference manager services)
Cite this article (links to download the citations from this article in formats compatible with various reference manager tools)
Ether lipid biosynthesis promotes lifespan extension and enables diverse pro-longevity paradigms in Caenorhabditis elegans
eLife 12:e82210.
https://doi.org/10.7554/eLife.82210


