Adaptation dynamics between copy-number and point mutations
- Institute of Science and Technology Austria, Austria
Figures
Figure 1 with 1 supplement
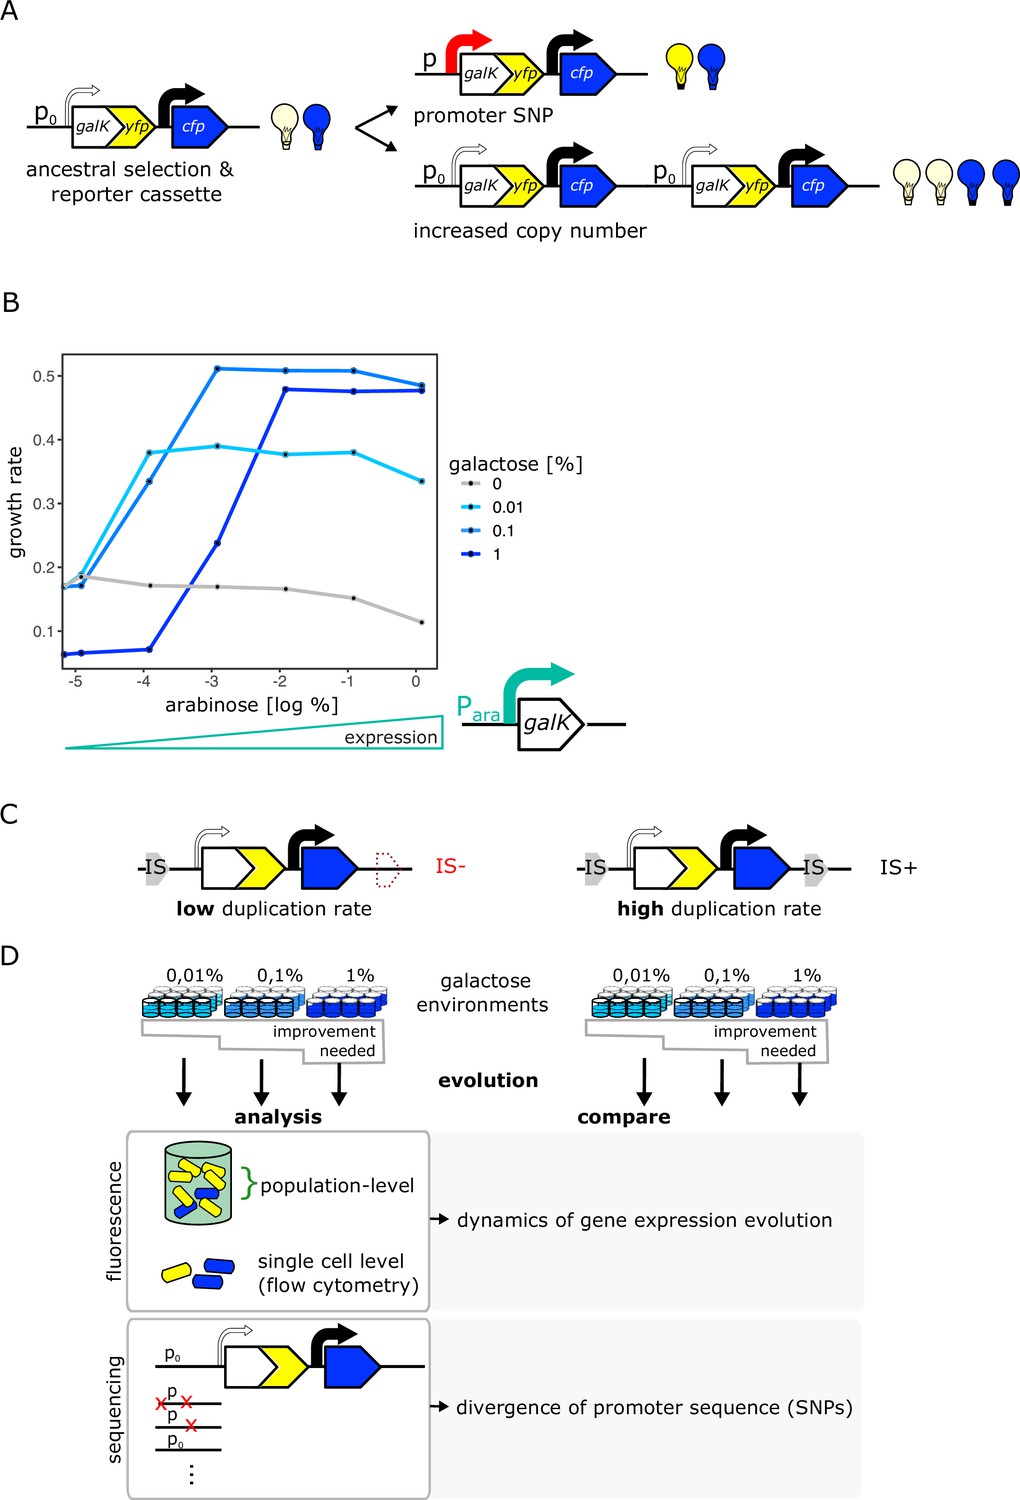
An experimental system to study gene duplication and divergence in strains with different duplication rates.
(A) Cartoon of chromosomal selection and reporter cassette. The galK-yfp gene fusion does not have a functional promoter, but instead a random sequence, P0 (thin arrow), drives very low levels of baseline gene expression. Cfp expression is driven by a constitutive promoter (black arrow). Light bulbs symbolize fluorescence. Two fundamentally different kinds of adaptive mutations are shown on the right: (i) point mutations in P0 lead to increases in GalK-YFP while CFP remains at ancestral single-copy levels (top), (ii) mutations to the copy-number of the whole reporter cassette will increase both YFP and CFP expression (bottom). (B) Growth rate (as a proxy for fitness) as a function of different induction levels of galK expression in four different concentrations of galactose. Expression of a synthetic para-galK cassette (schematic below the figure) is induced by the addition of arabinose. Growth rate increases along with increasing galK expression, but it plateaus at different values for different gene expression levels depending on galactose concentration (low, intermediate, and high gene expression demand). (C–D) Experimental layout. The adaptive dynamics and sequence divergence in P0 is compared between two otherwise isogenic strains (IS- and IS+) that differ in their rate of forming duplications. For IS- the second endogenous copy of IS1C located 12 kb downstream of the selection and reporter cassette has been deleted (C). Ninety-six replicate populations of each strain are evolved in three different levels of galactose, which select for increasing levels of gene expression improvement for 12 days, respectively. Throughout, fluorescence is analysed in bulk and on a single-cell level to analyse evolutionary dynamics, and relevant clones are sequenced (D).
-
Figure 1—source data 1
Contains an R script along with optical density measurments to plot Figure 1B.
- https://cdn.elifesciences.org/articles/82240/elife-82240-fig1-data1-v3.zip
Figure 1—figure supplement 1
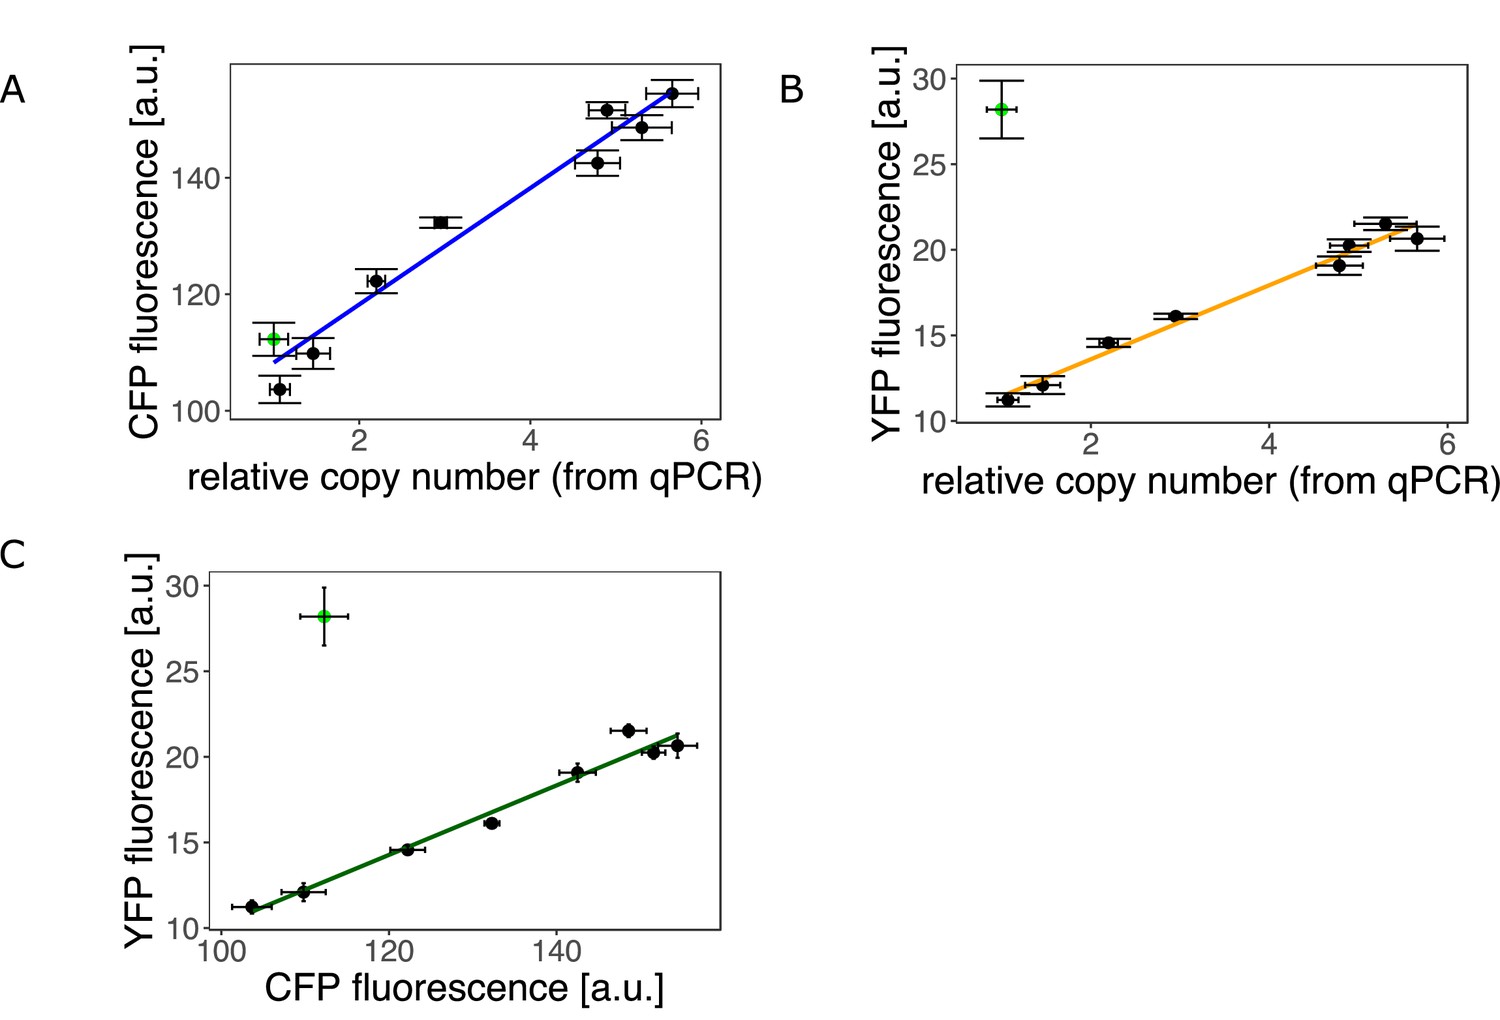
An experimental system to study gene duplication and divergence in strains with different duplication rates.
(A–C) Fluorescence phenotype and copy-number as measured by qPCR of bacterial clones with different levels of galK expression and copy-number grown on LB agar. Point colour indicates P0 sequence of clones (black = ancestral, green = promoter mutation ‘H5’ [–30T>A and –37C>T]). (A) Colony CFP fluorescence plotted against copy-number relative to a single-copy control strain as determined by qPCR. Error bars represent the standard deviation of three and four replicates for copy-number and CFP fluorescence, respectively. Linear fit: Adjusted R-squared=0.956, p-value = 3.35e-06. (B) Colony YFP fluorescence plotted against copy-number relative to a single-copy control strain as determined by qPCR. Linear model fitted to all data points with ancestral P0 sequence. Adjusted R-squared=0.97, p-value = 3.57e-06. (C) Colony YFP fluorescence plotted against CFP fluorescence. Linear model fitted to all data points with ancestral P0 sequence. Adjusted R-squared=0.97, p-value = 7.6e-06.
-
Figure 1—figure supplement 1—source data 1
Contains an R script along with qPCR and fluorescence intensity data to plot Figure 1—figure supplement 1.
- https://cdn.elifesciences.org/articles/82240/elife-82240-fig1-figsupp1-data1-v3.zip
Figure 2 with 3 supplements

Evolutionary dynamics depend on galactose concentration and duplication rate.
(A) Daily measurements of normalized CFP fluorescence as a proxy for gene copy-number of 96 populations of IS+ (black) and IS- (red) strains growing in three different galactose concentrations (% indicated in the plot), respectively, as well as 33 replicates of IS+ and IS- strain, respectively, growing in the absence of galactose (control, black). (B) Logarithmic plots for an overview of fold changes in YFP and CFP fluorescence of populations from (A) (YFP and CFP were normalized to the mean fluorescence of ancestral populations (anc.) evolved in 0% galactose [top panel]). Lines connect measurements of each population. Populations’ fluorescence phenotypes occupy three different areas: increased YFP only (YFP+), increased CFP and YFP (YFP+CFP+ , i.e. amplified) and increased CFP with an additional elevation in YFP above the YFP+CFP+ fraction (mixed). The number of populations for IS- (red) and IS+ (black) in the respective fractions are indicated (see Figure 1—figure supplement 1A and Figure 3A–B). (C) Representative flow cytometry plots showing single-cell YFP and CFP fluorescence for populations from the YFP+ (left), mixed (middle), and YFP+CFP+ (right) fraction (indicated in panel B), respectively.
-
Figure 2—source data 1
Contains an R script along with optical density and fluorescence data to plot Figure 2A-B.
- https://cdn.elifesciences.org/articles/82240/elife-82240-fig2-data1-v3.zip
Figure 2—figure supplement 1
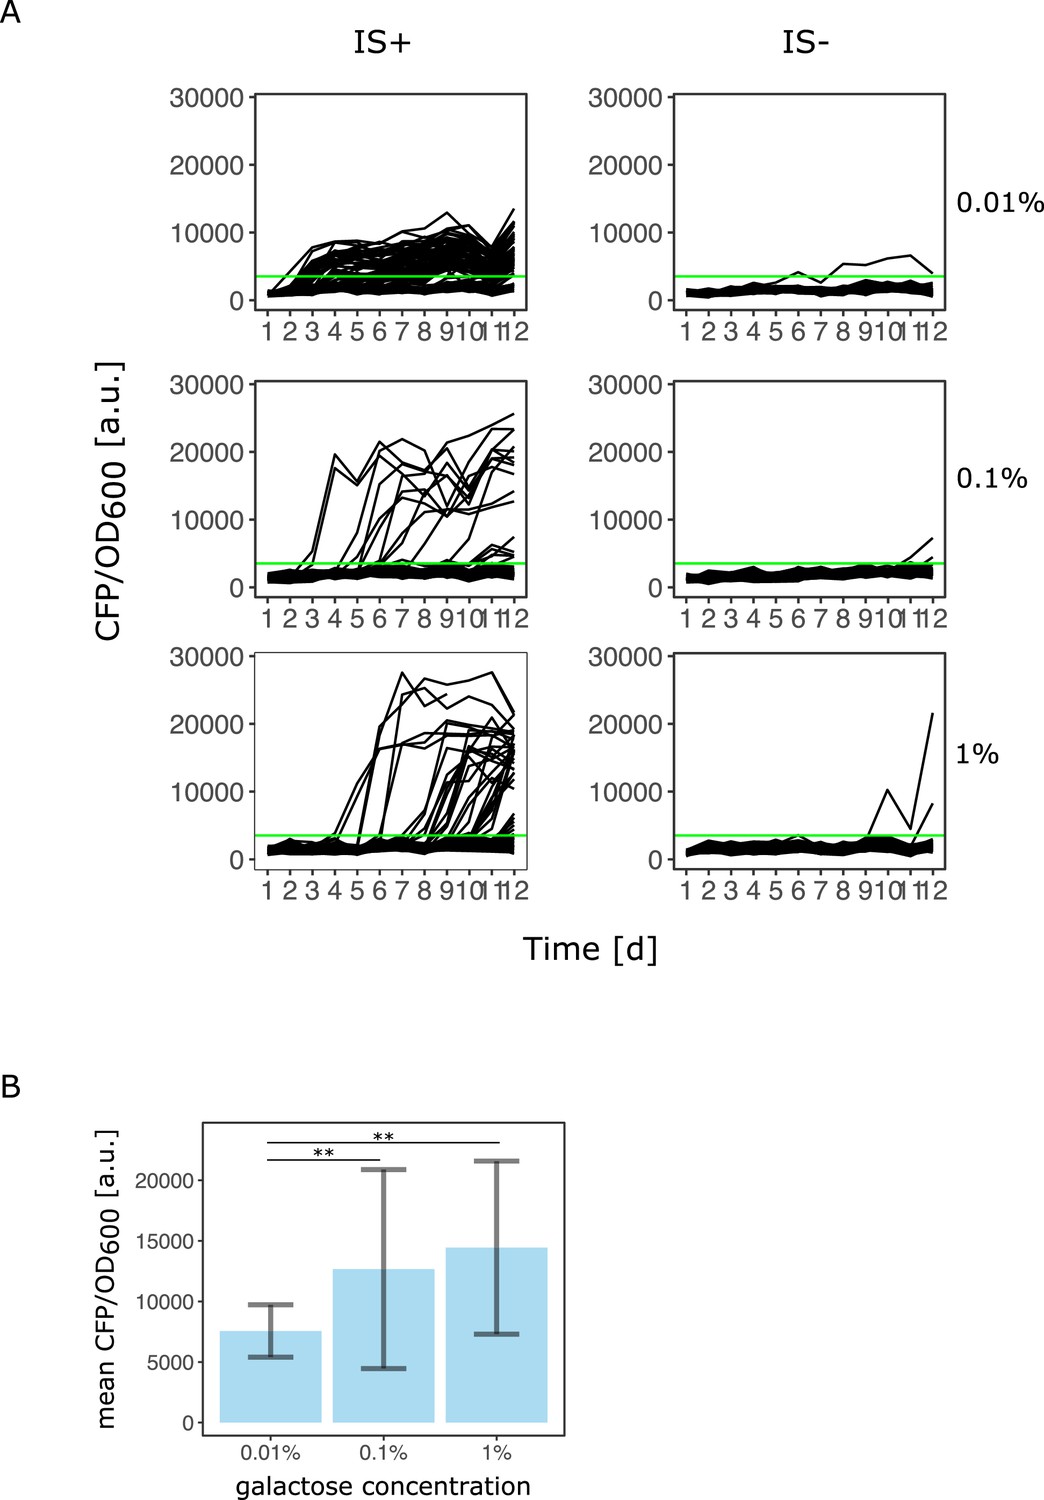
Number of amplified populations and their copy-number depends on the gene expression demand of the environment.
(A) Data replotted from Figure 2A. Green line indicates threshold to classify as population as amplified (CFP/OD600 exceeds the mean ancestral CFP/OD600 by four standard deviations). (B) Using the same threshold, mean CFP/ OD600 fluorescence as a proxy for copy-number of all evolved populations is shown for 0.01%, 0.1%, and 1% galactose (68, 19, and 34 populations for low, intermediate, and high galactose, respectively). p-Values (two-sided t-test): 3.6*10–6 (between 0.01% and 1% gal) and 3*10–2 (between 0.01% and 0.1% galactose).
Figure 2—figure supplement 2
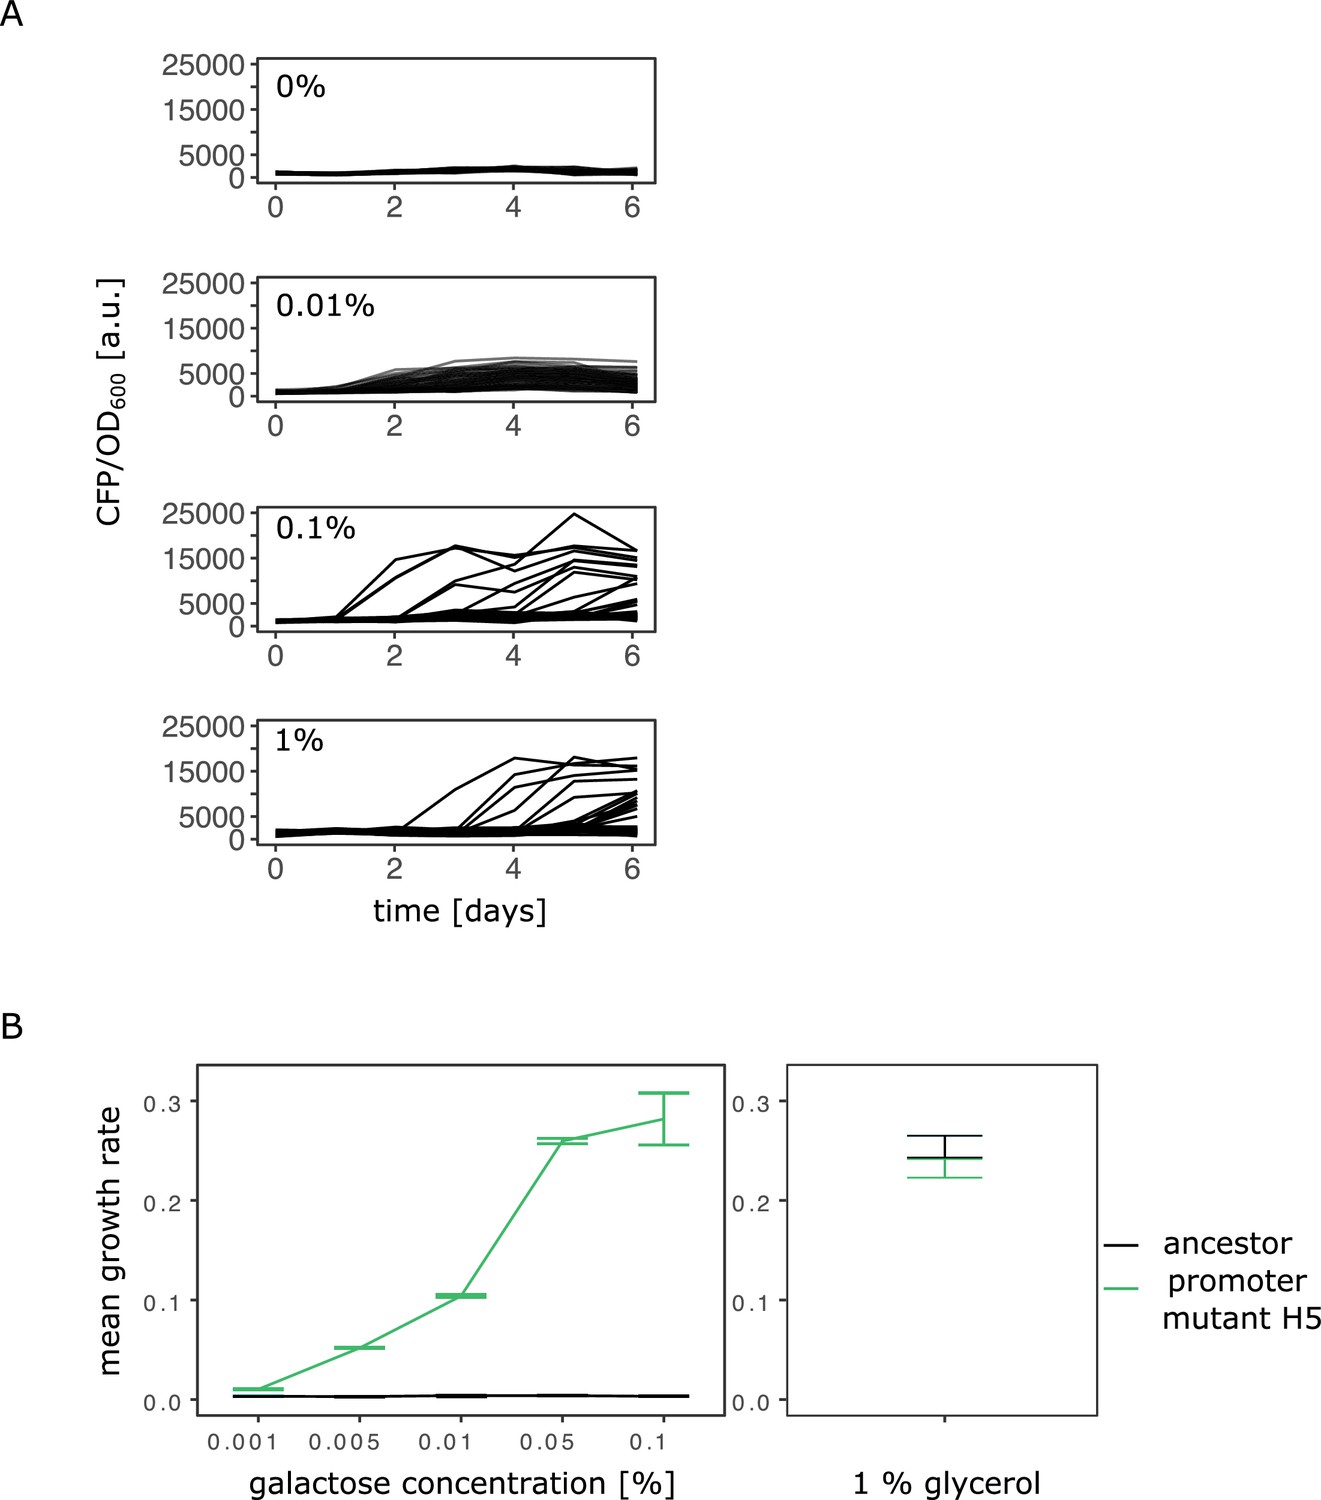
Evolutionary dynamics depend on galactose concentration.
(A) Additional evolution experiment with daily measurements of normalized CFP fluorescence as a proxy for gene copy-number of 96 populations of the IS+ strain growing in three different galactose concentrations (% indicated next to the plots), as well as in the absence of galactose (control). (B) Growth rate in M9 minimal medium with increasing concentrations of galactose (left panel) as well as glycerol (control, right panel) of strain H5 with two SNPs in P0 (–30T>A and –37C>T) and the ancestral strain. Error bars represent the standard deviation of four (galactose) and five (glycerol) replicates, respectively.
-
Figure 2—figure supplement 2—source data 1
Contains an R script along with optical density measurments to plot Figure 2—figure supplement 2B.
- https://cdn.elifesciences.org/articles/82240/elife-82240-fig2-figsupp2-data1-v3.zip
Figure 2—figure supplement 3
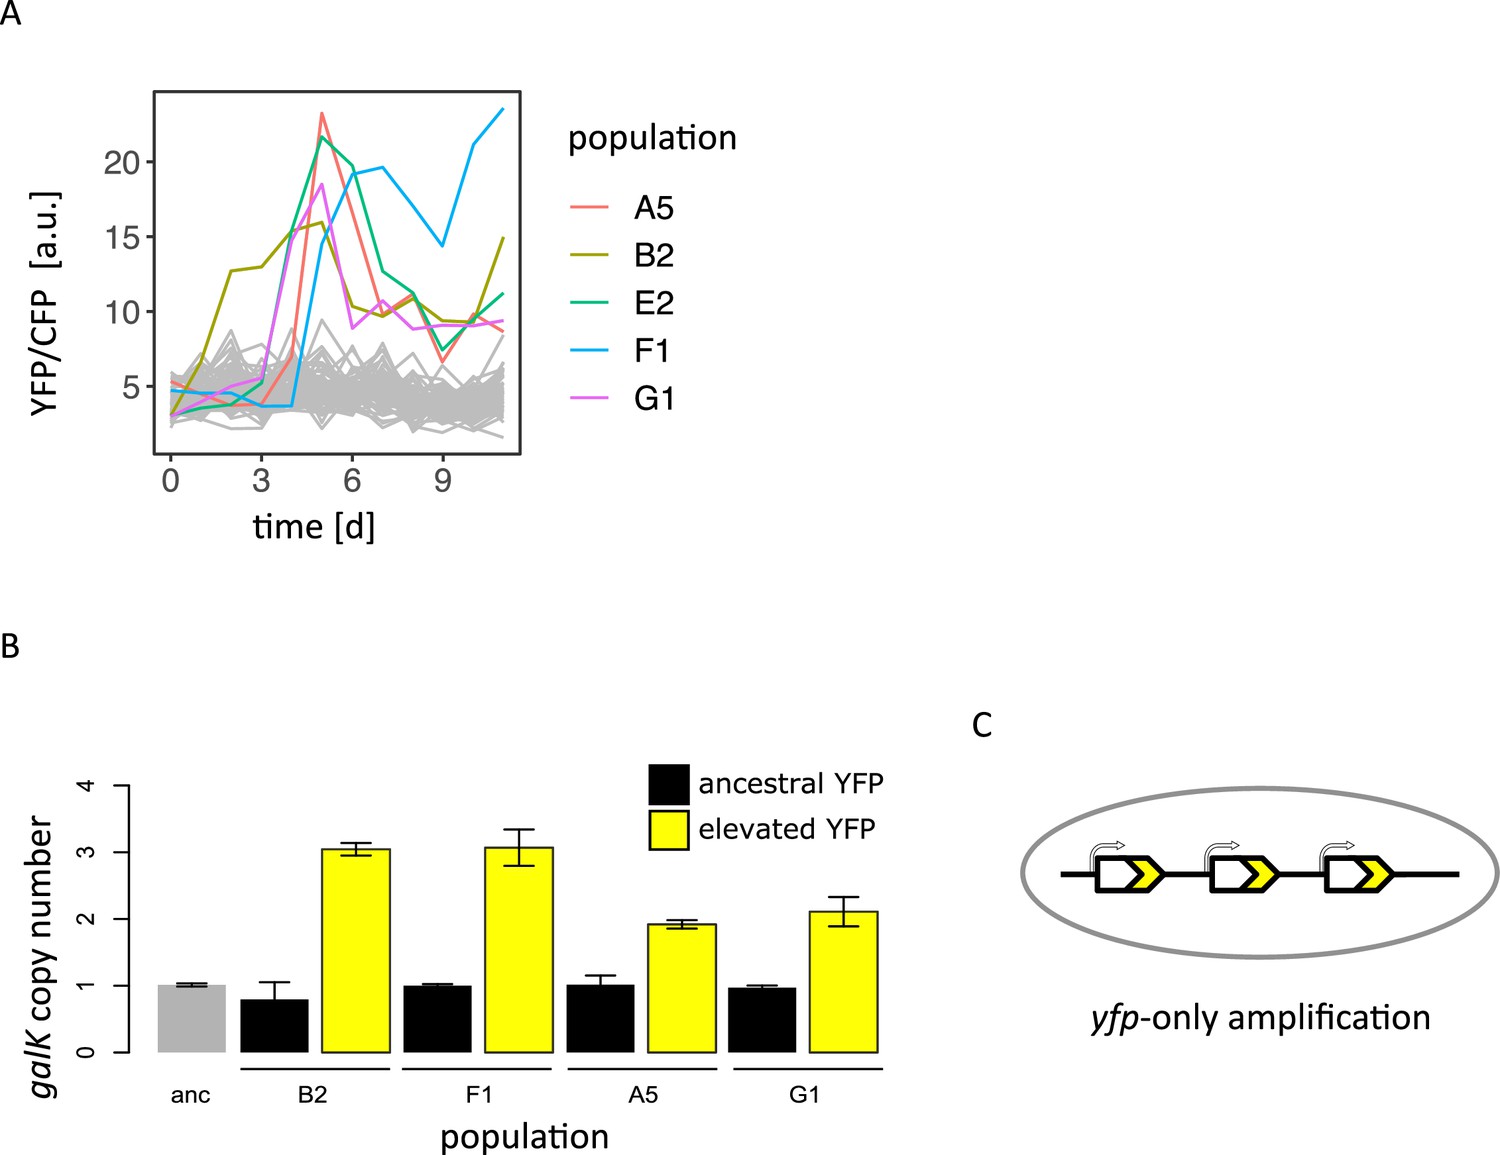
YFP-only amplifications occur in IS- populations evolved in 0.1% galactose.
(A) Normalized YFP fluorescence as a proxy for galK expression of 96 populations in the IS- strain growing in 0.1% galactose. Populations with increased YFP fluorescence are highlighted. (B) GalK copy-number of the YFP+IS- populations evolved in 0.1% galactose shown in (A) as estimated by qPCR. For each population, genomic DNA of one colony with ancestral (black bars) and one with increased YFP (yellow bars) fluorescence was analysed. (C) Scheme of galk-yfp-only amplification with a duplication junction upstream of the cfp gene.
-
Figure 2—figure supplement 3—source data 1
Contains an R script along with qPCR data to plot Figure 2—figure supplement 3B.
- https://cdn.elifesciences.org/articles/82240/elife-82240-fig2-figsupp3-data1-v3.zip
Figure 3

Confirming the presence of a combination of copy-number and point mutations in intermediate and high galactose.
(A–B) Log plot of YFP and CFP fluorescence of all 96 IS+ populations during evolution in 0.1% (A) and 1% (B) galactose (black points), respectively. Data replotted from Figure 2B for an overview of population fluorescence of all mixed fraction populations (coloured points). Time points of measurements are indicated by the degree of shading. (C–D) Single-cell fluorescence phenotypes as measured by flow cytometry of all mixed fraction populations identified in (A–B) after 12 days of evolution, respectively, indicate the presence of combination mutations (an increase of both YFP and CFP within a single cell as opposed to a mixed population of cells with either an increase in YFP or an increase in CFP, compare to Figure 2C). (E) Sanger sequencing of individual colonies allows to determine the genotype of an evolved clone of any fluorescence phenotype. Images of CFP (left) and YFP (right) fluorescence of individual colonies from a representative IS+ population (A10) streaked onto LB agar after having evolved in 0.1% galactose for 12 days. Sanger sequencing of the P0 sequence revealed a T>A point mutation in an amplified (red arrow) but not an ancestral colony (grey arrow). Scalebars: 1cm.
-
Figure 3—source data 1
Contains an alignment of sequencing data for Figure 3E.
- https://cdn.elifesciences.org/articles/82240/elife-82240-fig3-data1-v3.txt
Figure 4 with 2 supplements
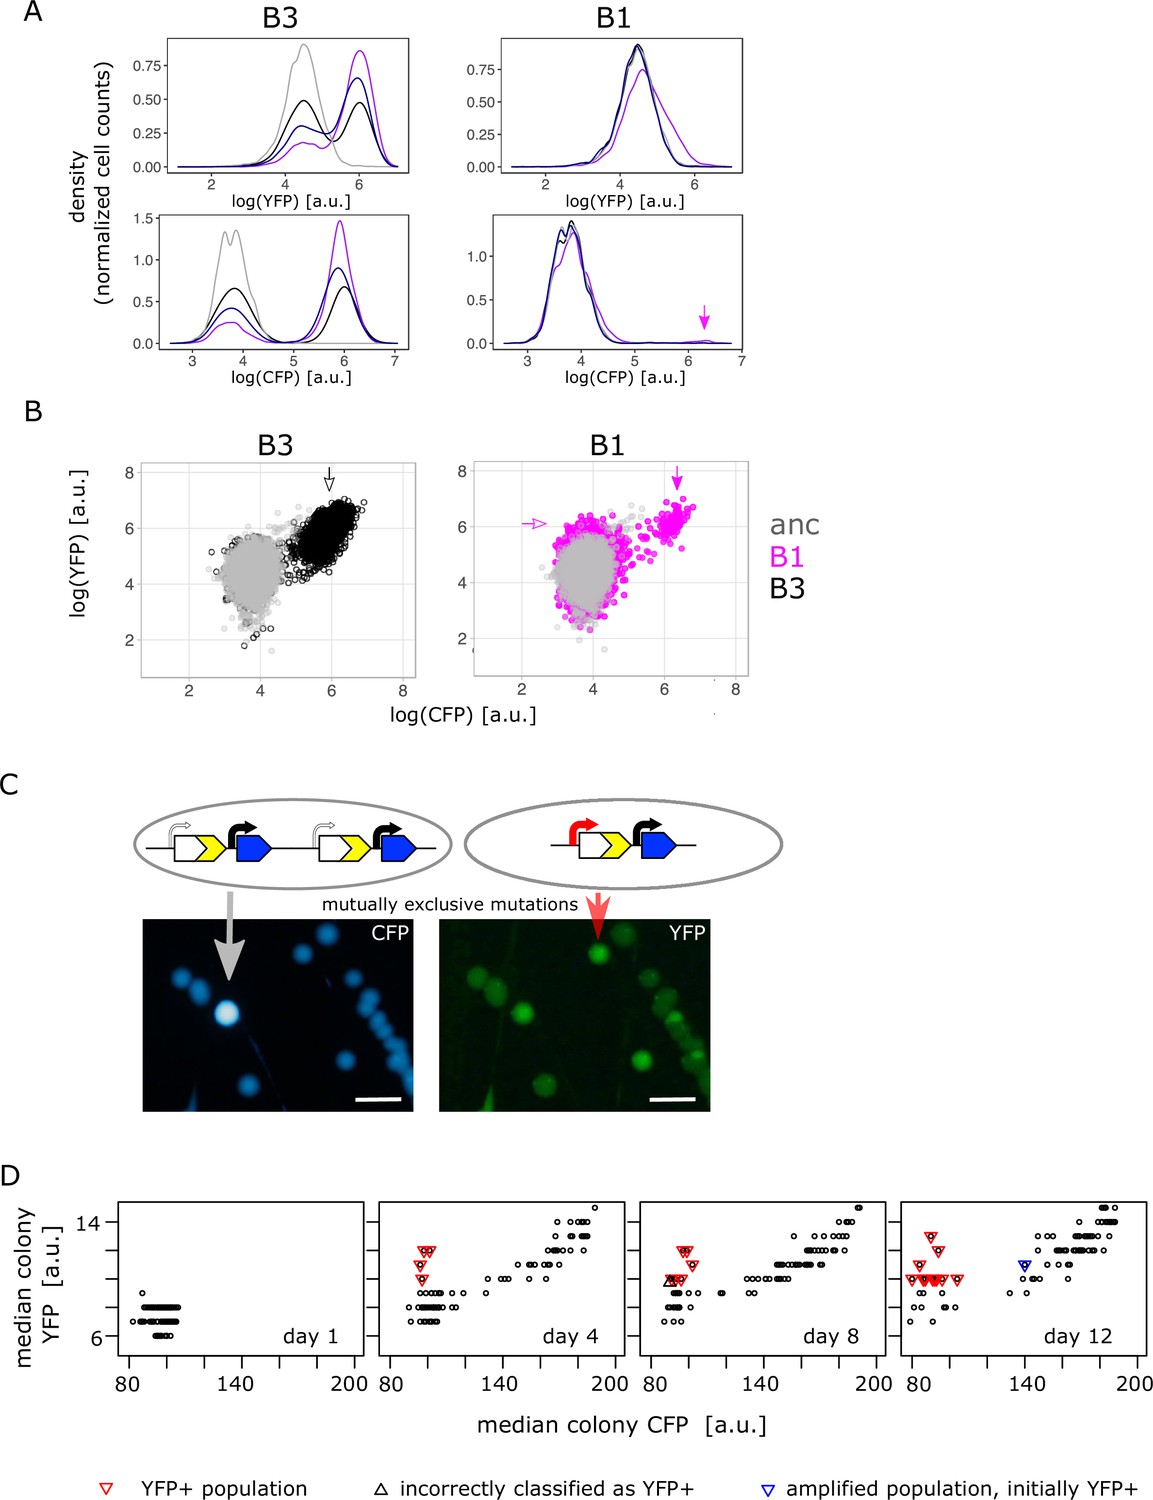
Confirming the presence of mutually exclusive mutations in low galactose.
(A) Representative flow cytometry density plot showing YFP fluorescence (upper left and right panel) and CFP fluorescence (lower left and right panel) of IS+ populations B3 (left panels) and B1 (right panels) over time (grey – ancestral, black – day 4, dark blue – day 8, purple – day 12). The small YFP+CFP+ subpopulation is indicated by a magenta arrow (see corresponding arrow in B – right panel). (B) YFP versus CFP plot of populations B3 (left panel, black) and B1 (right panel, magenta) at day 12 together with an ancestral population (grey) in order to better visualize the two distinct subpopulations in B1 (magenta arrows indicate YFP+ and YFP+CFP+ subpopulation, respectively). Data is replotted from A in order to visualize subpopulations. (C) Images of CFP (left) and YFP (right) fluorescence of individual colonies from IS+ population B1 (shown in B) streaked onto LB agar after 12 days of evolution in 0.01% galactose. The population consists of amplified colonies with increased CFP and YFP fluorescence (grey arrows) and single-copy colonies with a promoter mutation (red arrows). Scalebars: 1cm. (D) Quantitative analysis of patched populations indicates that promoter mutants (YFP+) evolve only in single-copy backgrounds. YFP-CFP plot of median colony fluorescence intensity of populations patched onto agar (as shown in B) on days 1, 4, 8, and 12 of evolution in 0.01% galactose. Populations were classified as YFP+ if their YFP but not CFP fluorescence intensity values exceeded ancestral fluorescence (red triangles, confirmed by flow cytometry). In all these populations, the YFP+ phenotype evolved from an ancestral phenotype. Blue triangle represents an amplified population, which was classified as YFP+ in the previous time point (flow cytometry showed that this population became dominated by copy-number mutations later). Black triangle marks population incorrectly classified as YFP+ (ancestral fluorescence according to flow cytometry). See also Table 1.
-
Figure 4—source data 1
Contains an R script along with colony fluorescence intensity data over time to plot Figure 4D.
- https://cdn.elifesciences.org/articles/82240/elife-82240-fig4-data1-v3.zip
Figure 4—figure supplement 1
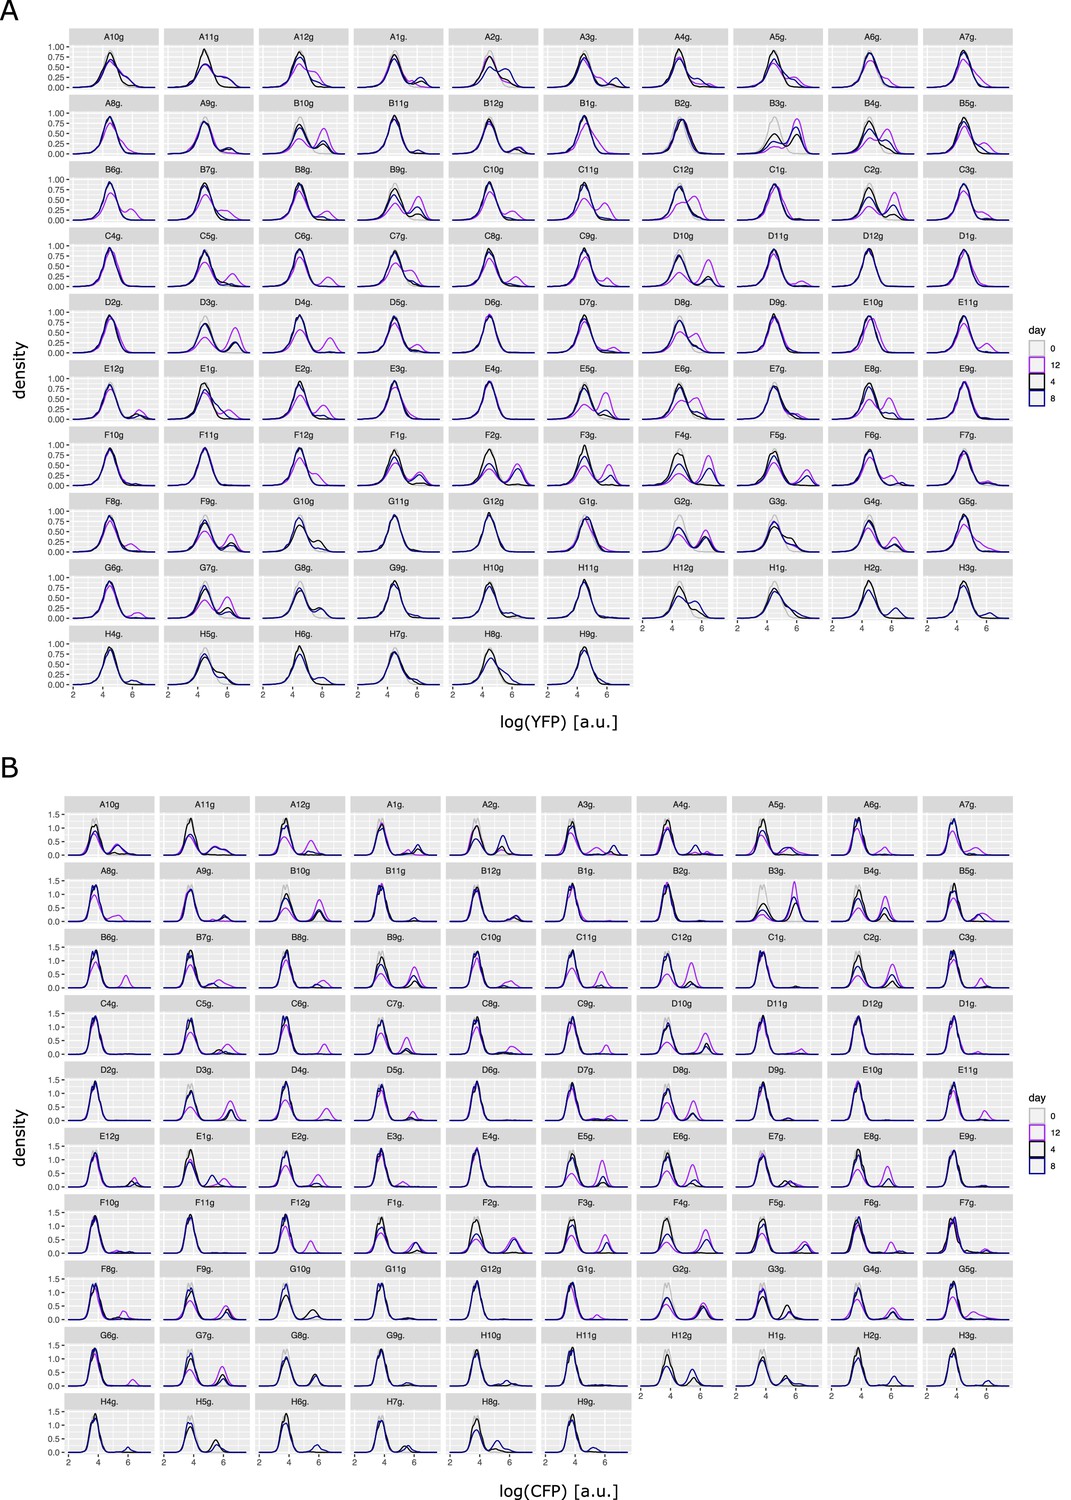
Adaptation to the low galactose environment is dominated by gene amplification.
(A) Flow cytometry density plot showing YFP fluorescence and (B) CFP fluorescence of IS+ populations over time (grey – ancestral, black – day 4, dark blue – day 8, purple – day 12).
Figure 4—figure supplement 2
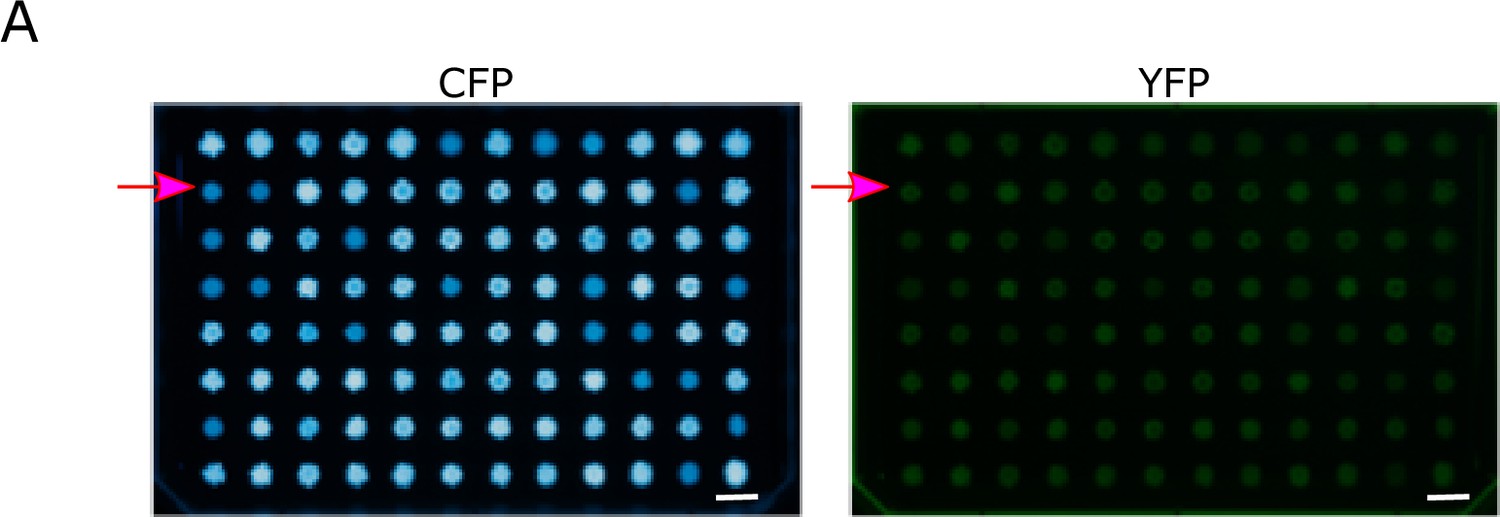
Monitoring population fluorescence under neutral conditions with respect to galK expression reveals small increases in YFP fluorescence in the absence of amplification.
(A) Representative images of CFP (left panel) and YFP (middle panel) fluorescence of populations patched onto LB agar, which allows comparing population fluorescence in the absence of galactose-dependent growth effects. Magenta arrows indicate population B1, which exhibits increased YFP but ancestral CFP fluorescence (quantification of patch fluorescence intensity in Figure 4D). Scalebars: 1cm.
Figure 5 with 1 supplement
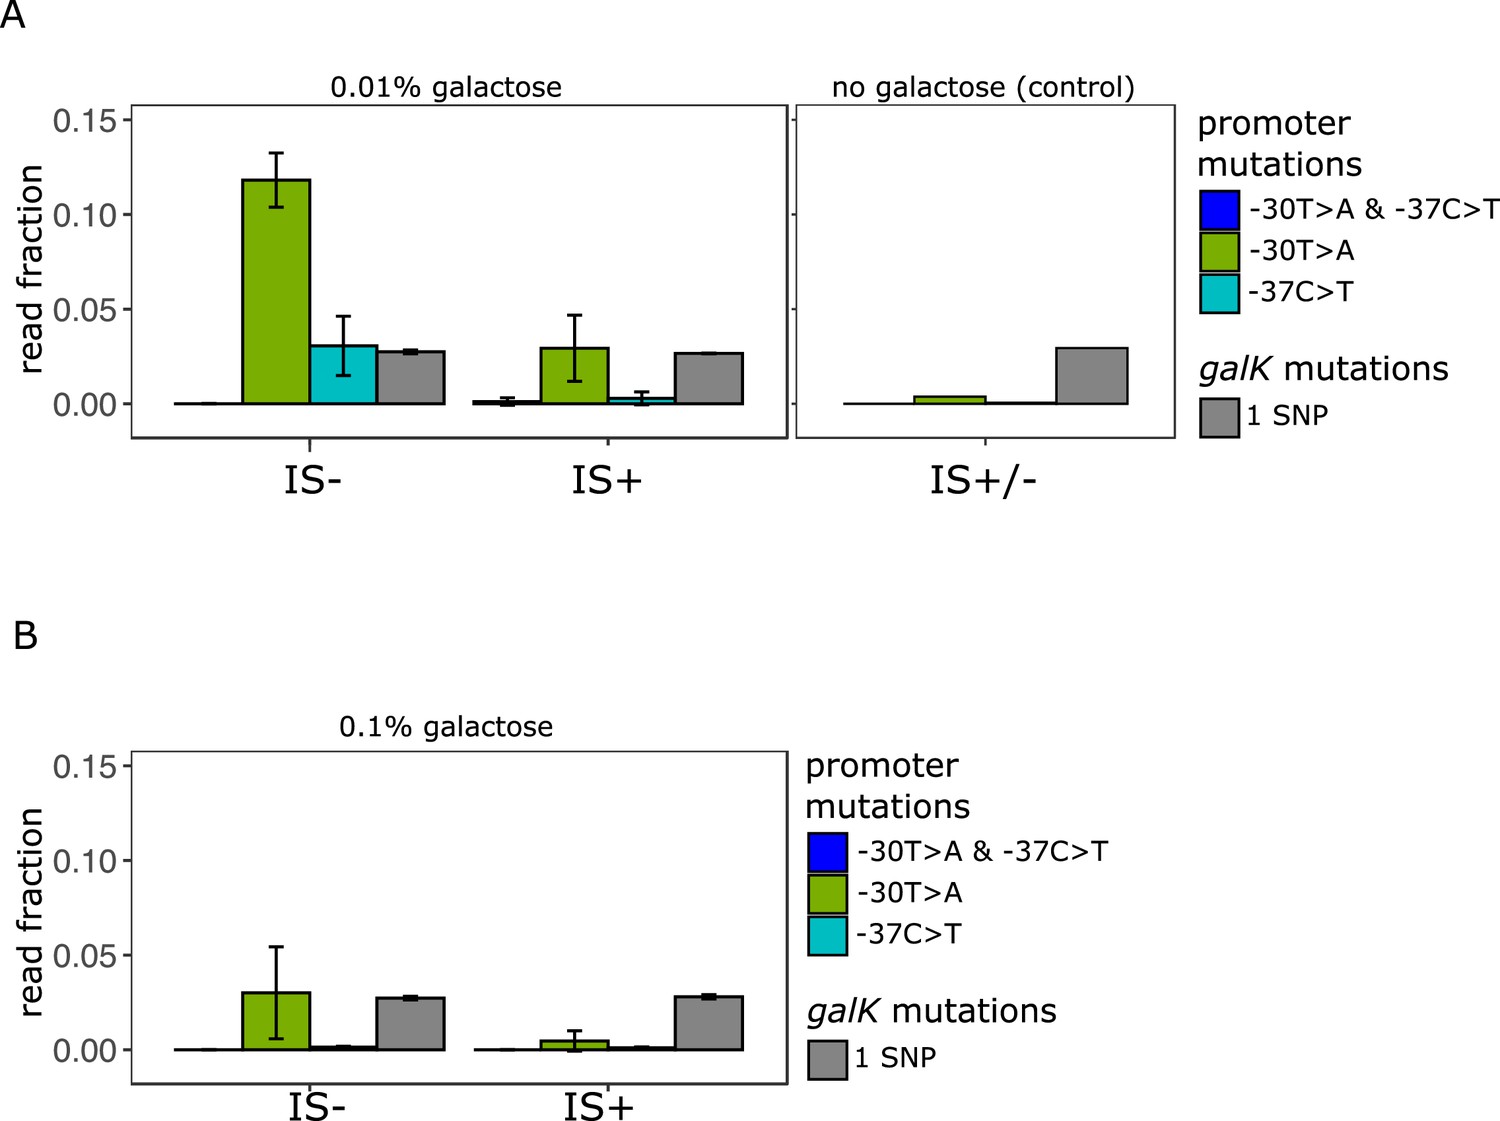
Amplicon deep sequencing of P0 in pooled evolved populations.
(A) (Left panel) Number of reads carrying a P0 sequence with two adaptive SNPs 30 and 37 bp upstream of galK, respectively (‘T>A + C>T’ in blue) or its respective single SNPs (‘T>A’ in green, ‘C>T’ in cyan). Values are normalized to the number of reads with ancestral P0 for IS- and IS+ populations evolved in 0.01% galactose. The mean fraction of reads with any single SNP in galK is shown as a control (grey). Error bars represent the standard deviation of three replicates, consisting each of 32 pooled evolved populations. (Right panel) Read fractions of the same respective SNPs shown for a pool of all 96 IS+ and IS- populations evolved in the absence of galactose. (B) Mean read fractions as in (A) shown for three replicates of each 32 pooled populations evolved in intermediate (0.1%) galactose.
Figure 5—figure supplement 1
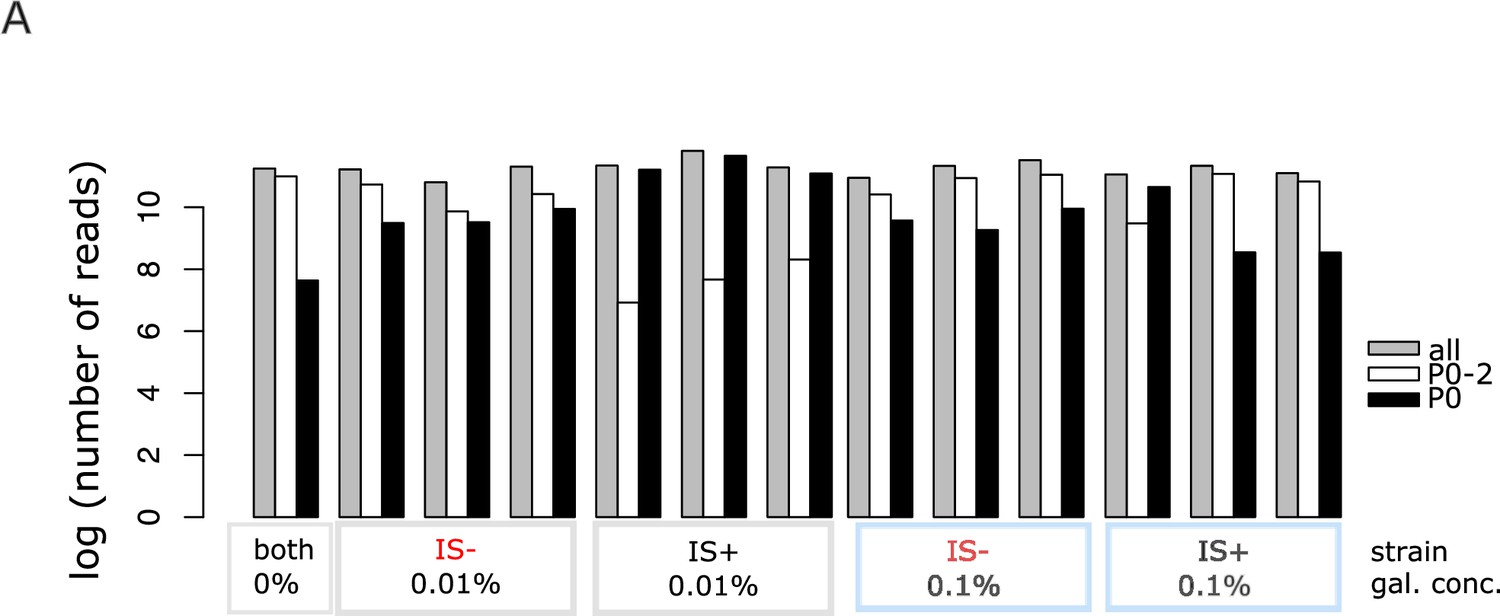
Total number of sequencing reads for all replicates.
(A) Log plot of total read numbers showing contamination of P0 amplicons with P02 amplicons stemming from pooled samples of the 0.1% galactose populations of both promoter sequences (blue rectangles; see Methods).
Figure 6 with 1 supplement
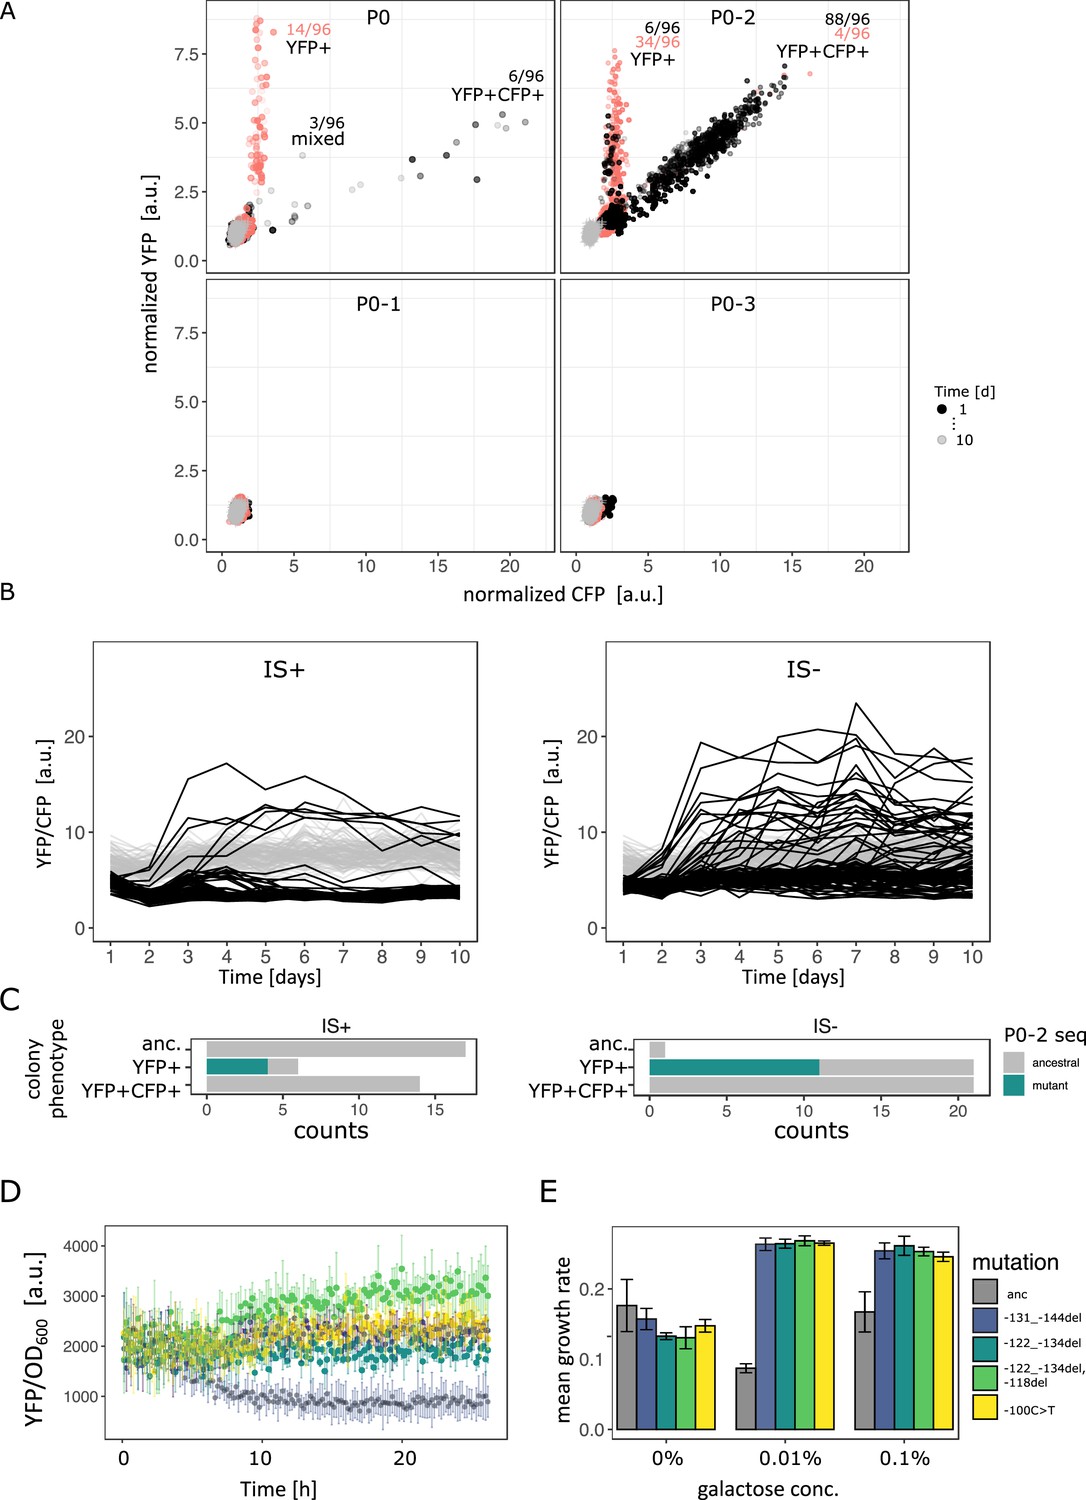
Evolutionary dynamics for different random P0 sequences in 0.1% galactose.
(A) YFP versus CFP fluorescence normalized to the ancestral value of 96 populations of IS+ (black) and IS- (red) strain each harbouring a different random sequence upstream of galK (‘P0’, ‘P0-1’, ‘P0-2’, ‘P0-3’) grown in 0.1% galactose and without galactose (grey lines, control), respectively. Time points are indicated by the degree of shading. The number of populations for IS- (red) and IS+ (black) in the respective fractions are indicated. (B) YFP/CFP fluorescence to visualize increases in galK-YFP expression not caused by copy-number increases plotted for the duration of the evolution experiment for P0-2 populations of IS+ (left panel) and IS- (right panel). Here, gene amplifications (see Figure 6—figure supplement 1A) are visible as slight decrease in YFP/CFP relative to the 0% galactose control (grey), putative promoter mutations are visible as an increase in YFP/CFP. (C) Distribution of P0-2 mutants in IS+ and IS- populations after 12 days of evolution in 0.1% galactose. Mutations in P0-2 are exclusively found in populations with increased YFP and ancestral CFP fluorescence (YFP+). IS+ clones from all six YFP+ populations were sequenced, while IS- clones from a random subsample of 21 YFP+ populations were sequenced. (D) Mean normalized YFP fluorescence of reconstituted P0-2 mutants and the P0-2 ancestor strain (grey) grown in control medium (0% galactose). (E) Mean growth rate of reconstituted P0-2 mutants and the ancestor strain (grey) in 0.01% galactose, 0.1% galactose, and control medium (0% galactose). Error bars represent the standard deviation of four replicates.
-
Figure 6—source data 1
Contains an R script along with optical density and fluorescence intensity measurments to plot Figure 6A-B.
- https://cdn.elifesciences.org/articles/82240/elife-82240-fig6-data1-v3.zip
-
Figure 6—source data 2
Contains an R script along with optical density and fluorescence intensity measurments to plot Figure 6D-E.
- https://cdn.elifesciences.org/articles/82240/elife-82240-fig6-data2-v3.zip
Figure 6—figure supplement 1
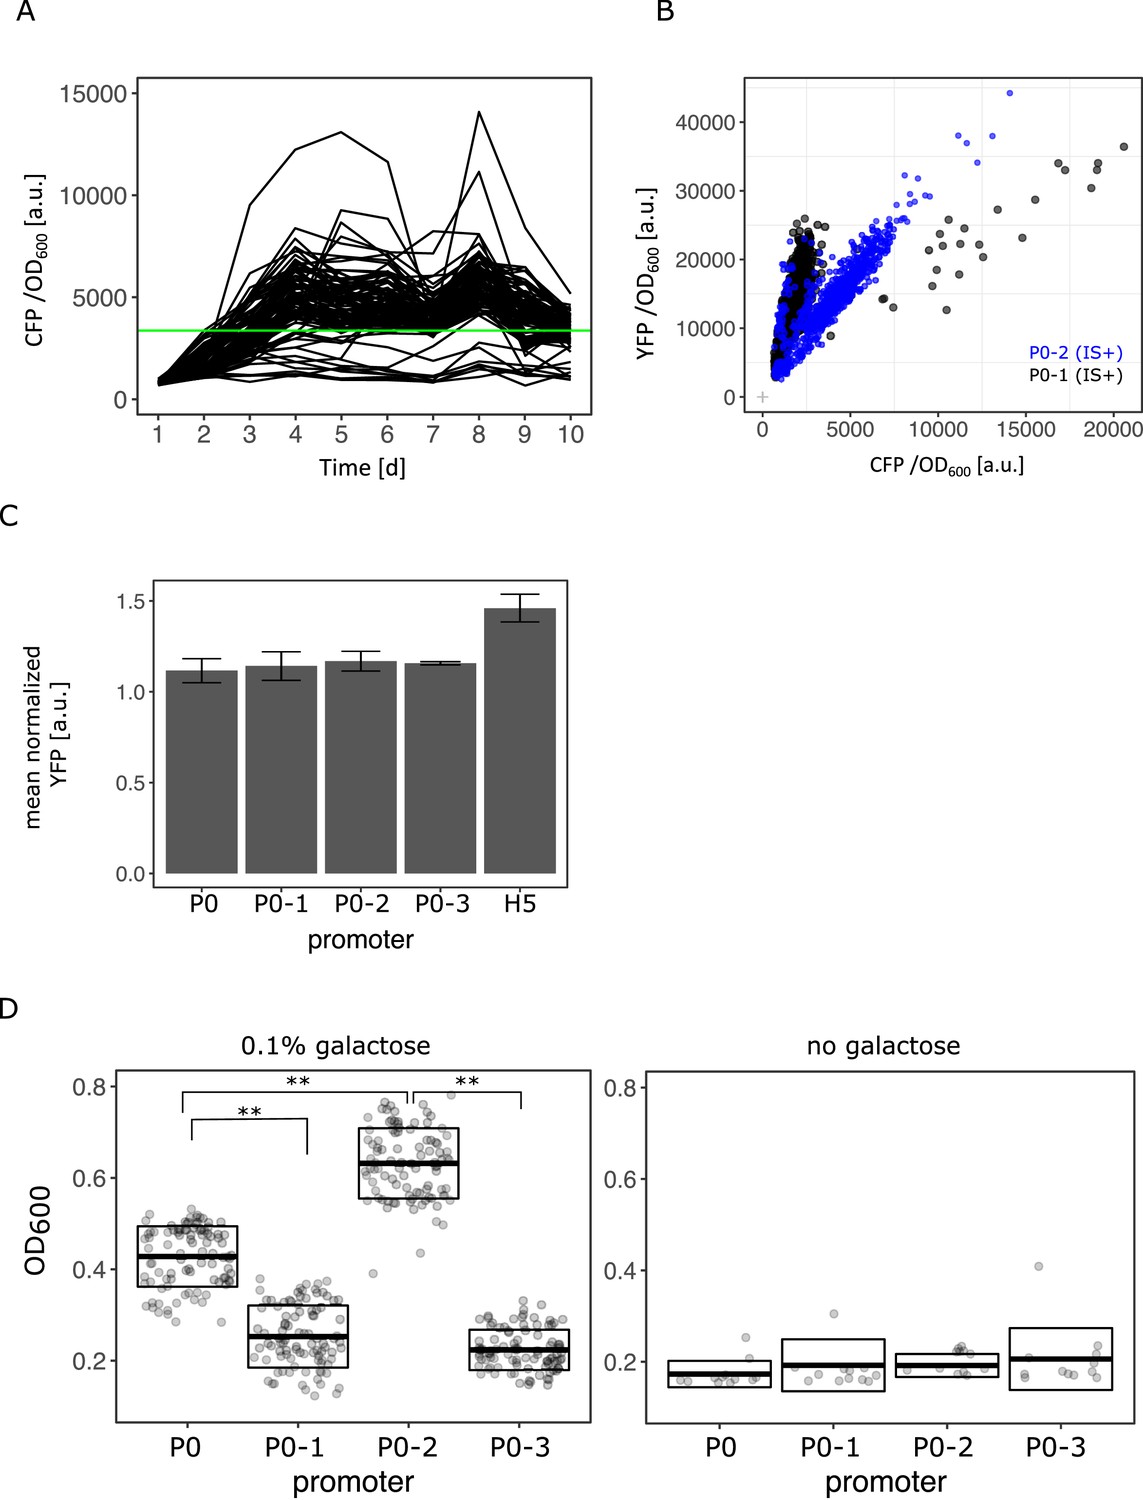
Rapid amplification of IS+ populations with P02.
(A) CFP/OD600 as a proxy for copy-number plotted over the course of the evolution experiment for IS+ with P0-2 populations in 0.1% galactose and control populations in 0% galactose (grey). Green line indicates threshold to classify population as amplified (day 8 CFP/OD600 exceeds the mean ancestral CFP/OD600 by four standard deviations). (B) YFP/OD600 plotted versus CFP/OD600 of evolved IS+ populations with P0 (black) and P0-2 (blue) (data replotted from Figure 6A). (C) Flow cytometry measurement of YFP fluorescence intensity as a proxy for galK expression of IS- strains harbouring the four random promoter sequences as well as a P0 with adaptive SNPs as a comparison (‘H5’; indicated at the bottom of the figure), respectively, normalized to a strain without fluorescence marker. Error bars represent the standard deviation of three biological replicates. (D) End-point OD600 (‘yield’) of IS- populations carrying P0, P0-1, P0-2, and P0-3 after 24 hr of growth in 0.1% galactose (left panel) and in the absence of galactose (right panel). Boxes indicate the mean and standard deviation of 96 populations (left panel) and 12 populations (right panel), respectively. Asterisks indicate a significant difference between mean OD600 (two-sided t-test, p<0.0001).
Figure 7 with 1 supplement
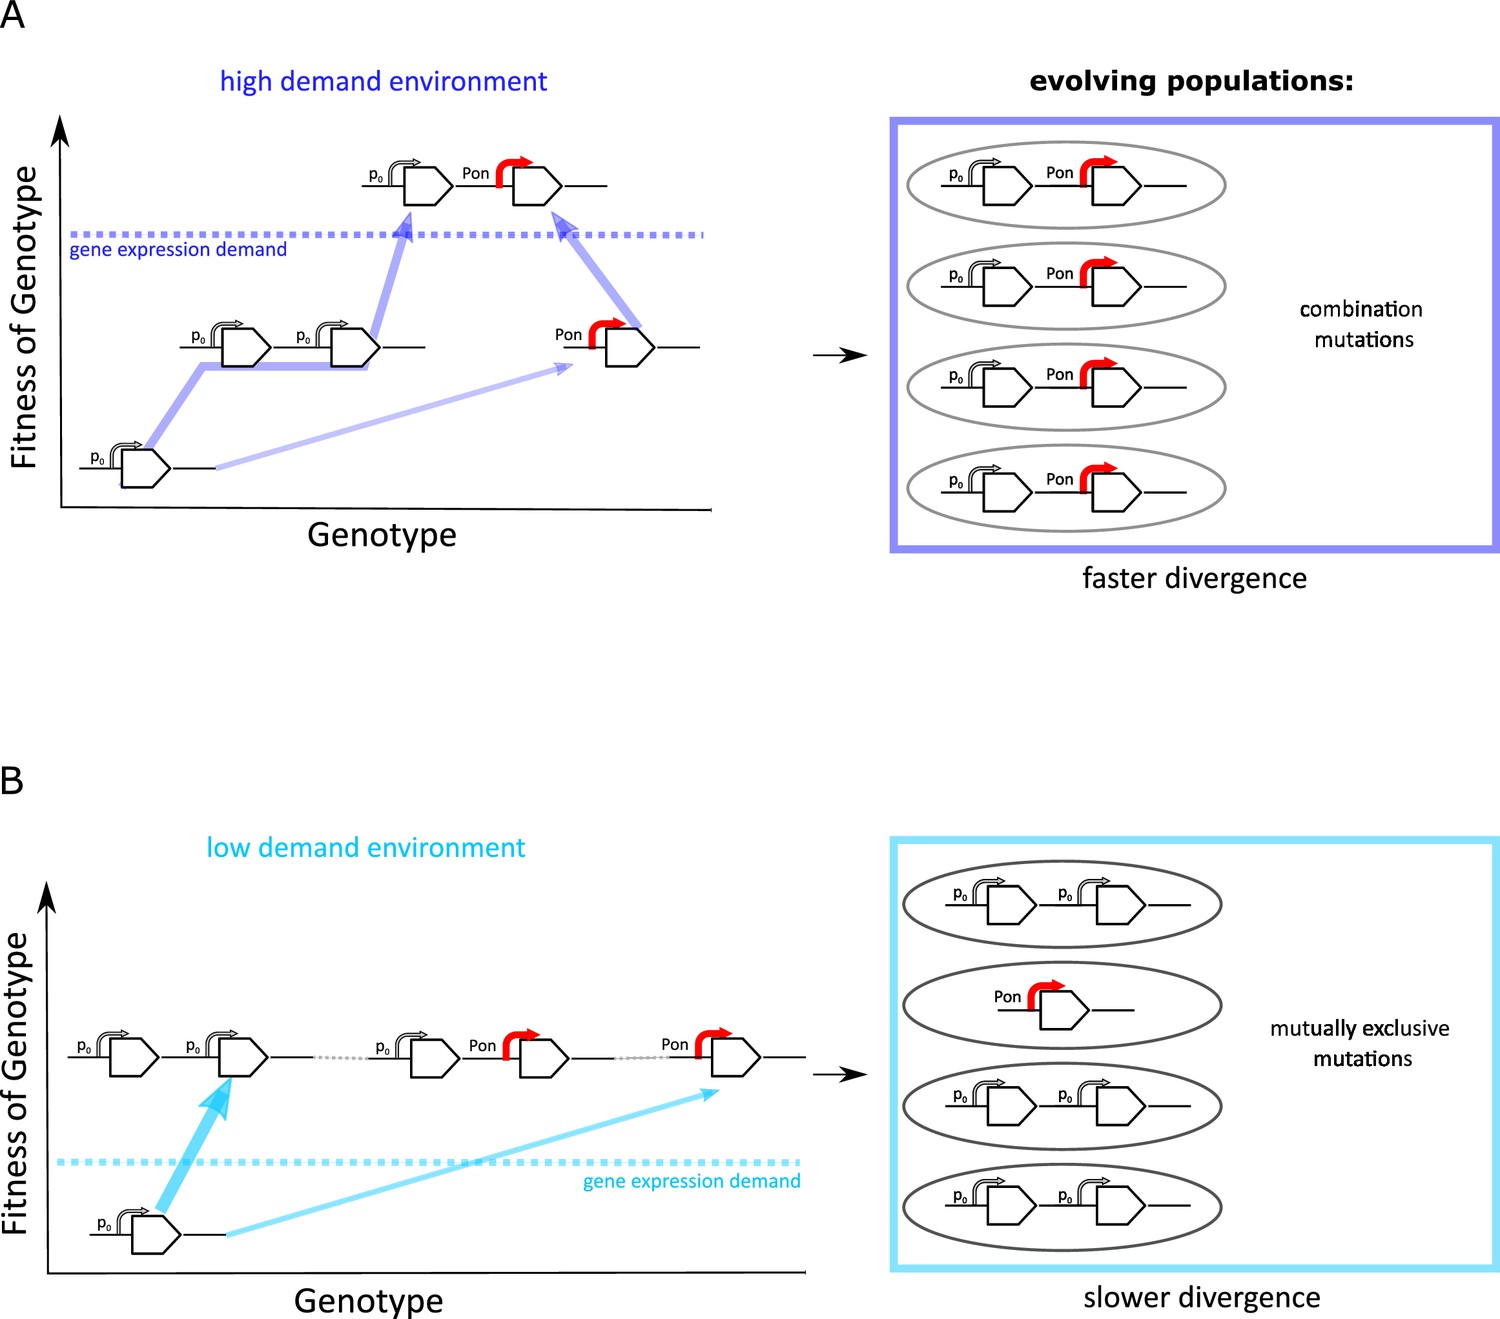
Frequent copy-number mutation can hinder adaptation by point mutations.
Genotype-fitness map (‘fitness landscape’) illustrating the difference between adaptive trajectories of a high demand (A) and low demand (B) environment, which differ solely by the increase in gene expression they select for. The dashed line indicates the level of gene expression sufficient to reach maximal growth rate (‘fitness’) (see also Figure 1B). Right panels show the experimentally observed genotypes for each environment. (A) For an environment selecting for a large increase in gene expression (high demand), more than one adaptive mutation is necessary to reach maximal fitness. If copy-number mutations are frequent (as in the IS+ strain), adaptation by amplification is most likely (bold arrow). Alternatively, at a lower frequency, adaptation occurs via a point mutation in the promoter sequence (thin arrow). Due to an increased mutational target size, cells with gene amplfications are more likely to gain a beneficial point mutation than cells with a single copy of galK. Alternatively, rare promoter mutants can become amplified, in either case leading to the combination mutant observed in experiments. (B) For an environment selecting for only a modest increase in gene expression (low demand), maximal growth rate is attained either by gene amplification (more frequent, bold arrow) or by point mutations (less frequent, thin arrow). Therefore, combination mutants do not provide an additional fitness benefit and would only increase in frequency due to drift (horizontal faint dashed lines), not selection. Combination mutants are not observed in the experiment (right panel).
Figure 7—figure supplement 1
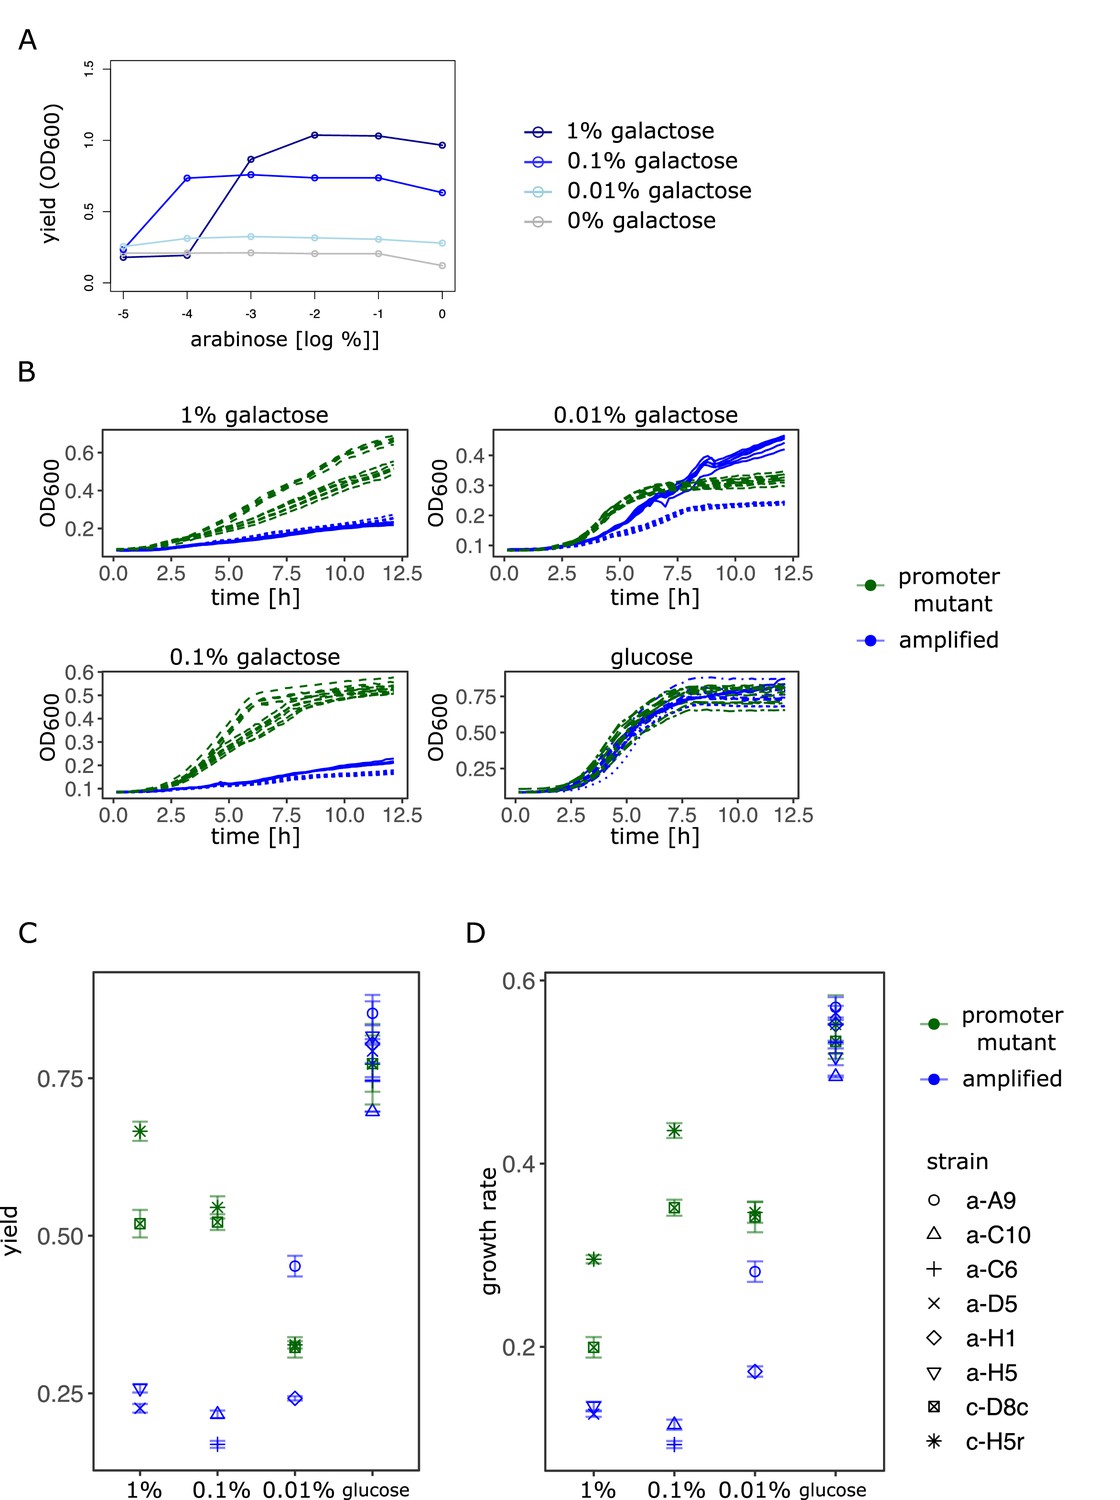
Amplification hindrance is consistent with negative epistasis under conditions of low gene expression demand.
(A). Maximal OD600 (‘yield’) as a function of different induction levels of galK expression in four different concentrations of galactose. Expression of a synthetic para-galK cassette is induced by the addition of arabinose (see Figure 1B for a plot of growth rate data). At the lowest level of galK expression yield as a proxy for population size is similar across all environments. (B) OD600 of evolved strains is plotted over time for the evolution medium supplemented with three different galactose concentrations and glucose (control; indicated on top of figure panels). For each galactose concentration, two amplified strains (blue), which have evolved in this environment for 7 days, respectively, are compared to two strong promoter mutants (‘H5r’, ‘D8c’, green, see Tomanek et al., 2020) grown in the same environment. (C) Yield (max OD600) and (D) maximal growth rate of the data shown in A.
Author response image 1
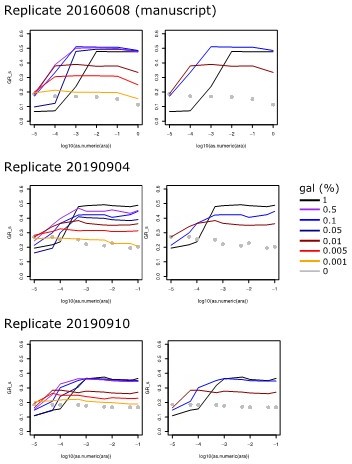
Replicates of the Experiment shown in Figure 1b, where growth rate is plotted against arabinose concentration used to induce galK expression for different galactose concentrations (line colors, see legend).
Left panels show all tested galactose concentrations, while right panels show the relevant galactose concentrations used in the experiments of the manuscript.
Author response image 2
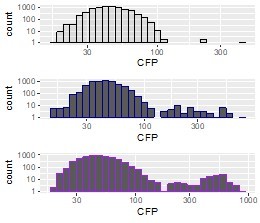
Histogram of population B1 CFP fluorescence intensity [a.u.] plotted on a log scale to visualize the small amplified subpopulation (black=day 4, blue=day 8, purple = day 12).
Author response image 3
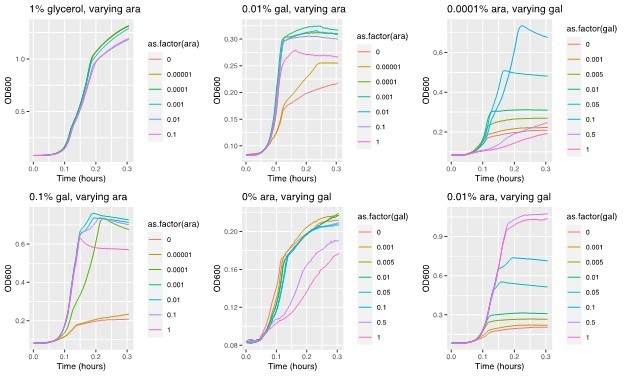
Example growth curves in M9 evolution medium and a 2D gradient of galactose and arabinose (as an inducer of galK expression).
These measurements are the basis for Figure 1b. The top left panel shows growth in 1% glycerol (control) instead of galactose.
Tables
Table 1
Sequencing and phenotypic analysis of all YFP+IS+ populations evolved in 0.01% galactose (Figure 4D – red triangles).
Increase in fluorescence relative to ancestral (anc) phenotype indicated by YFP+ and CFP+. Results shown for day 12 populations unless otherwise noted (d4, d8).
| Population | Seq (all YFP+) | Flow cytometry phenotype | Agar streak | Comment |
|---|---|---|---|---|
| A6 | –30T>A | YFP+, v. few CFP+ (mixed populations) | YFP+, few CFP+ | |
| B1 | –30T>A, –37C>T (“mutation H5”) | YFP+, CFP+ (mixed populations) | Few YFP+, few CFP+, mixed pop | |
| B2 | –30T>A | YFP+ | YFP+, v. few CFP+ | |
| C1 | –30T>A | YFP+ (d12) | YFP+, v. few CFP+ | |
| C9 | – | Ancestral YFP (d8), only CFP+(d12) | Few CFP+ | Incorrectly classified as YFP+ (Figure 4D – grey triangle) |
| D2 | –30T>A | YFP+ (d12) | YFP+ only | |
| D9 | anc | YFP+ (d8, d12) | YFP+ only | |
| E10 | –30T>A | YFP+ (d12) | YFP+ only | |
| F6 | – | YFP+ (d4), CFP+(d12) | CFP+ subpopulation | YFP+ at d8, then amplified population (Figure 5D – blue triangle) |
| F10 | –30T>A | YFP+, CFP+, anc (mixed populations) | YFP+, CFP+, mixed pop | qPCR confirmed |
| G1 | –30T>A | YFP+(d4–8), v. few CFP+ (d12) | YFP+, v. few CFP+ | |
| G12 | –30T>A | YFP+ (d8) | YFP+, no CFP+ (d12) | FACS CFP+ carry over |
Table 2
Mutations of P0-2 underlying increased YFP fluorescence in IS+ and IS- populations evolved in 0.1% galactose.
| IS+ clones | IS- clones | ||
|---|---|---|---|
| P02-A11 | –131_–144del | P02-A7 | –100C>T |
| P02-B10 | –122_–134del | P02-H12 | –100C>T |
| P02-F4 | –100C>T | P02-C3 | –100C>T |
| P02-F4 | –100C>T, poor quality read | P02-H9 | –122_–134del |
| P02-F2 | –122_–134del | ||
| P02-D1 | –100C>T | ||
| P02-E2 | –100C>T | ||
| P02-A1 | Bigger band, maps to insD1 coding sequence | ||
| P02-E5 | –41del | ||
| P02-C5 | 201 bp deletion leaving 20 bp of P02 | ||
| P02-H5 | 201 bp deletion leaving 20 bp of P02 | ||
| (seven different kinds of mutations) | |||
Additional files
Download links
A two-part list of links to download the article, or parts of the article, in various formats.
Downloads (link to download the article as PDF)
Open citations (links to open the citations from this article in various online reference manager services)
Cite this article (links to download the citations from this article in formats compatible with various reference manager tools)
Adaptation dynamics between copy-number and point mutations
eLife 11:e82240.
https://doi.org/10.7554/eLife.82240


