A mouse model of human mitofusin-2-related lipodystrophy exhibits adipose-specific mitochondrial stress and reduced leptin secretion
- Wellcome Trust-MRC Institute of Metabolic Science, University of Cambridge, United Kingdom
- Medical Research Council Mitochondrial Biology Unit, University of Cambridge, United Kingdom
- Centre for Cardiovascular Science, University of Edinburgh, United Kingdom
- New Medicines, UCB Pharma, United Kingdom
- UCB Pharma, Chemin du Foriest, Belgium
- MRC Human Genetics Unit, University of Edinburgh, United Kingdom
Figures
Figure 1 with 4 supplements
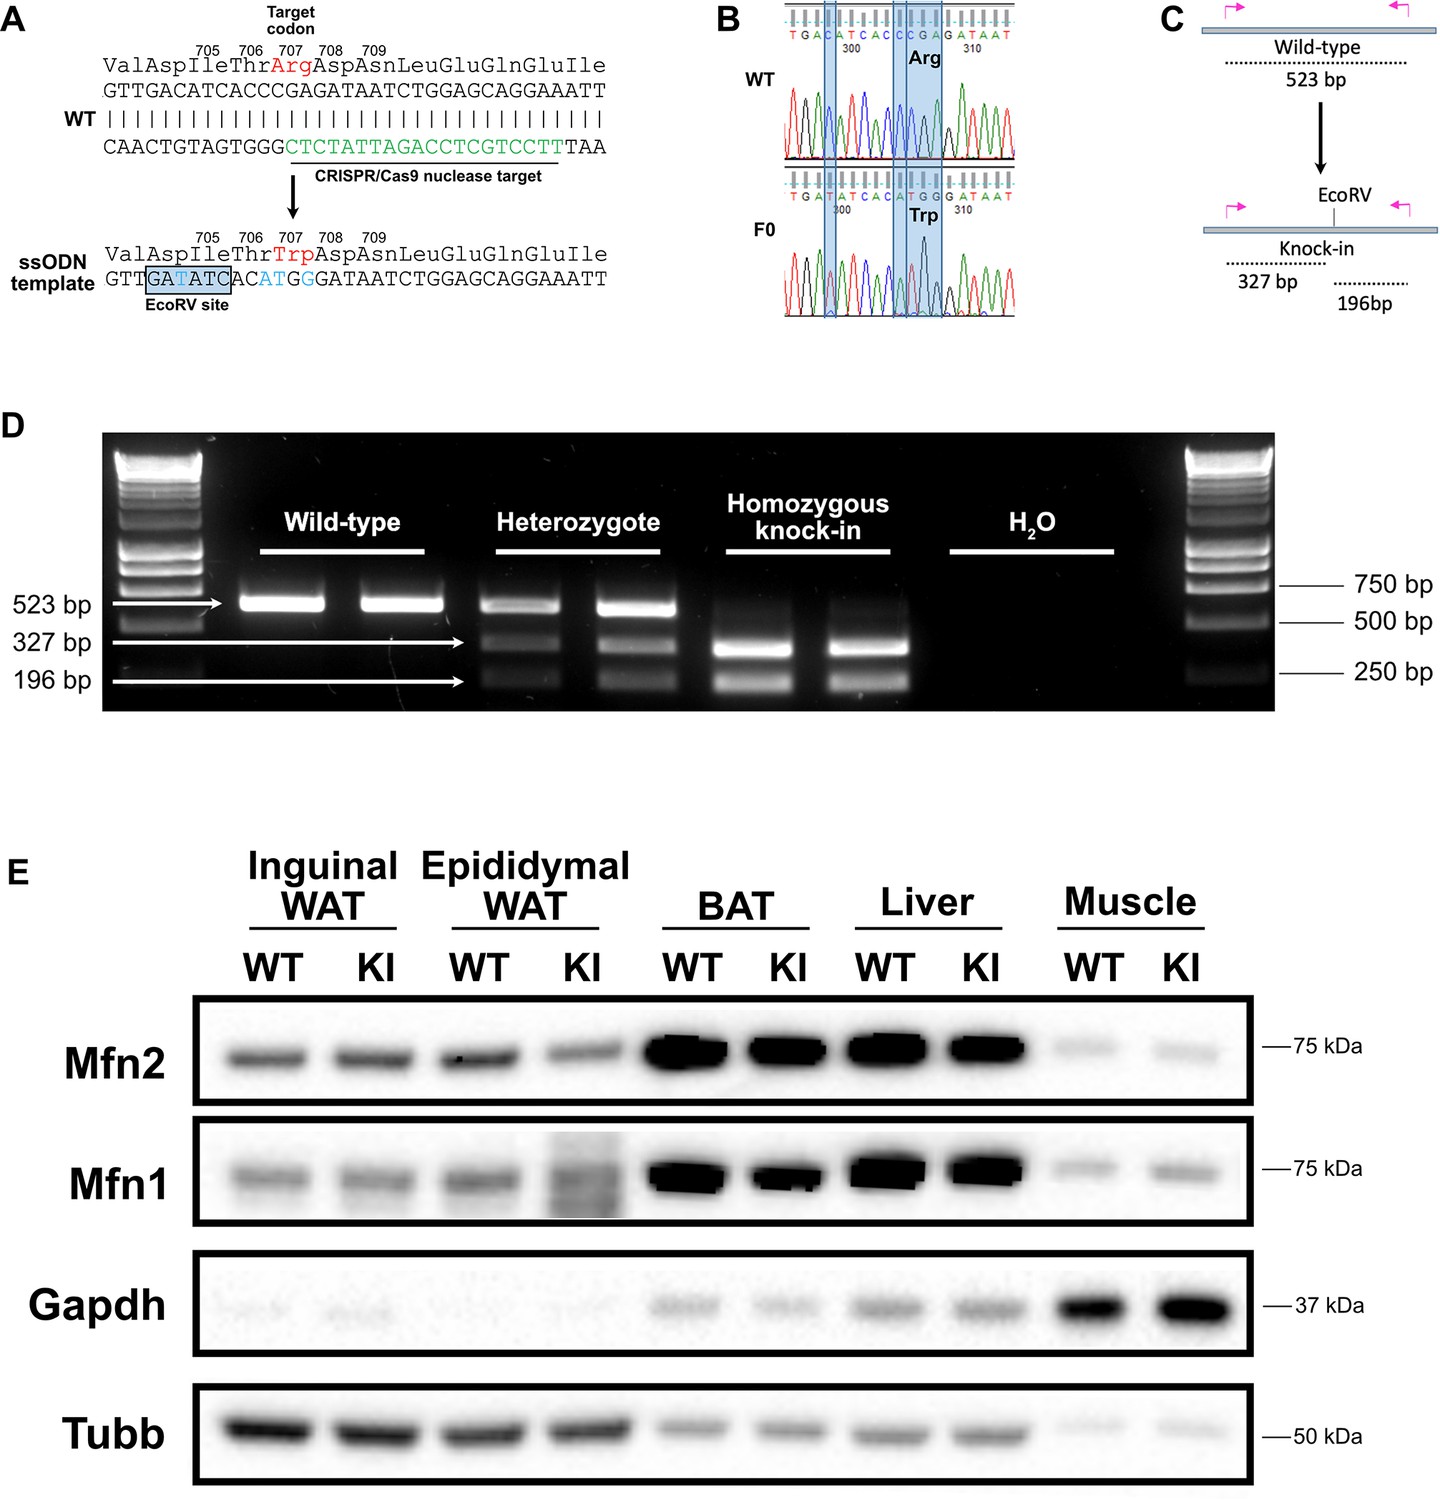
Generation of a Mfn2R707W knock-in mouse.
(A) Wild-type (WT) nucleotide and amino acid sequence around the Arg 707 codon. The CRISPR/Cas9 nuclease target is indicated in green. Below is part of the ssODN template with mutated nucleotides in blue, including the upstream silent mutation (at codon 704–705) to generate an EcoRV restriction site. (B) Sanger sequencing confirmation of the knock-in (KI) with restriction site in a founder (F0). (C) Illustration of the genotyping strategy: mutant alleles will digest into 327 bp and 196 bp fragments in response to EcoRV digestion. (D) Ear biopsies were digested using chelix and Mfn2 amplified by PCR, then digested using EcoRV. Representative SYBR Safe DNA gel demonstrating genotyping for two WT, heterozygous, and homozygous KI mice. Image is representative of other genotyping gels. (E) Western blot from inguinal and epididymal white adipose tissue (WAT), brown adipose tissue (BAT), liver and skeletal muscle for expression of Mfn1 and Mfn2. Tissues are from WT and homozygous Mfn2R707W KI mice fed a 45% kcal high fat diet (HFD) for 6 months. Due to variability across tissues, both Gapdh and Beta-tubulin (Tubb) are given as loading controls. The image is representative of at least three biological replicates.
-
Figure 1—source data 1
Raw and annotated immunoblots from Figure 1E.
- https://cdn.elifesciences.org/articles/82283/elife-82283-fig1-data1-v4.zip
Figure 1—figure supplement 1
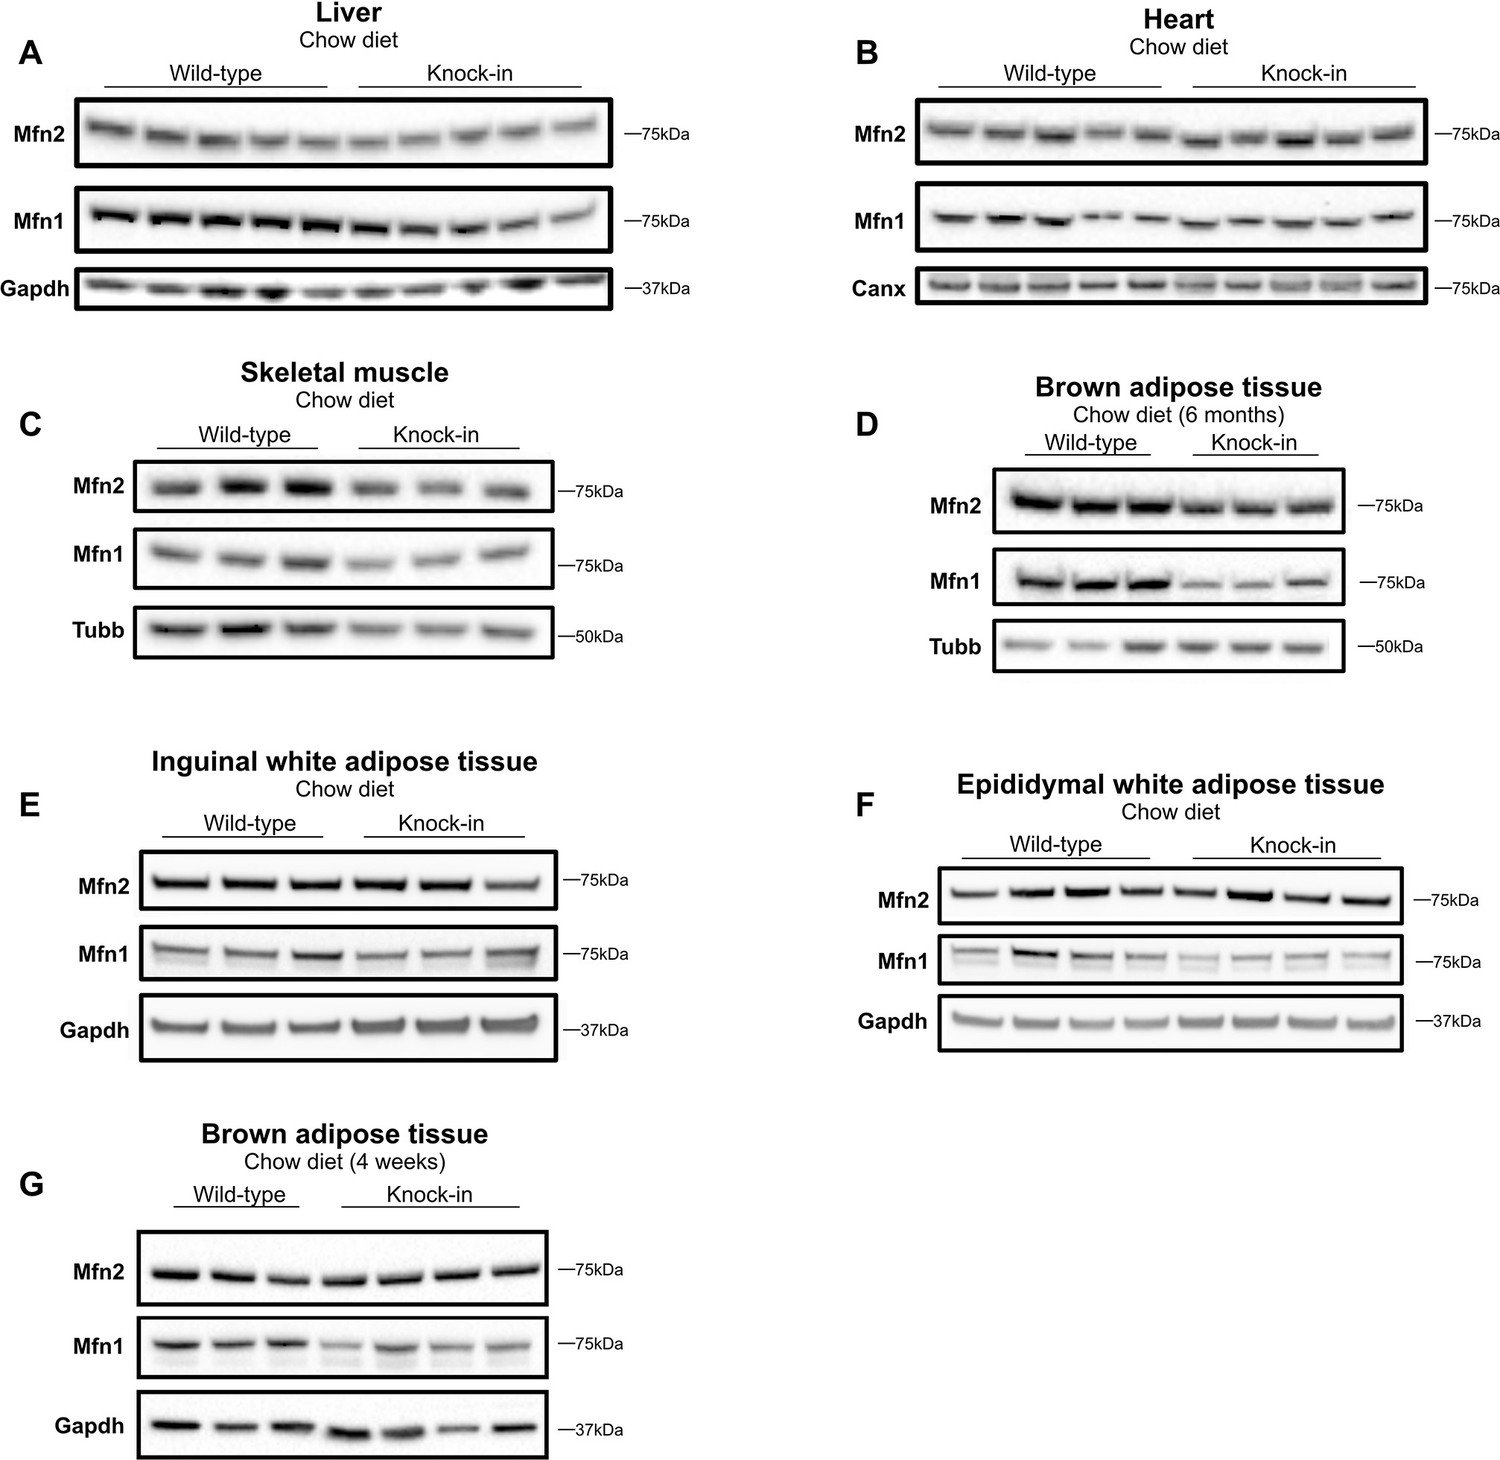
Expression of mitofusins on chow diet.
Western blots showing expression of Mfn2 and Mfn1 in liver (A), heart (B), skeletal muscle (C), BAT (D), inguinal WAT (E), and epididymal WAT (F) in WT and homozygous Mfn2R707W KI mice fed chow diet for 6 months; and (G) expression of Mfn2 and Mfn1 in BAT in mice fed chow for 4 weeks. Each lane contains samples from a separate animal and blots are representative of at least three replicates. Canx (calnexin), Gapdh, and Tubb (β-tubulin) are loading controls.
-
Figure 1—figure supplement 1—source data 1
Raw and annotated immunoblots from Figure 1—figure supplement 1.
- https://cdn.elifesciences.org/articles/82283/elife-82283-fig1-figsupp1-data1-v4.zip
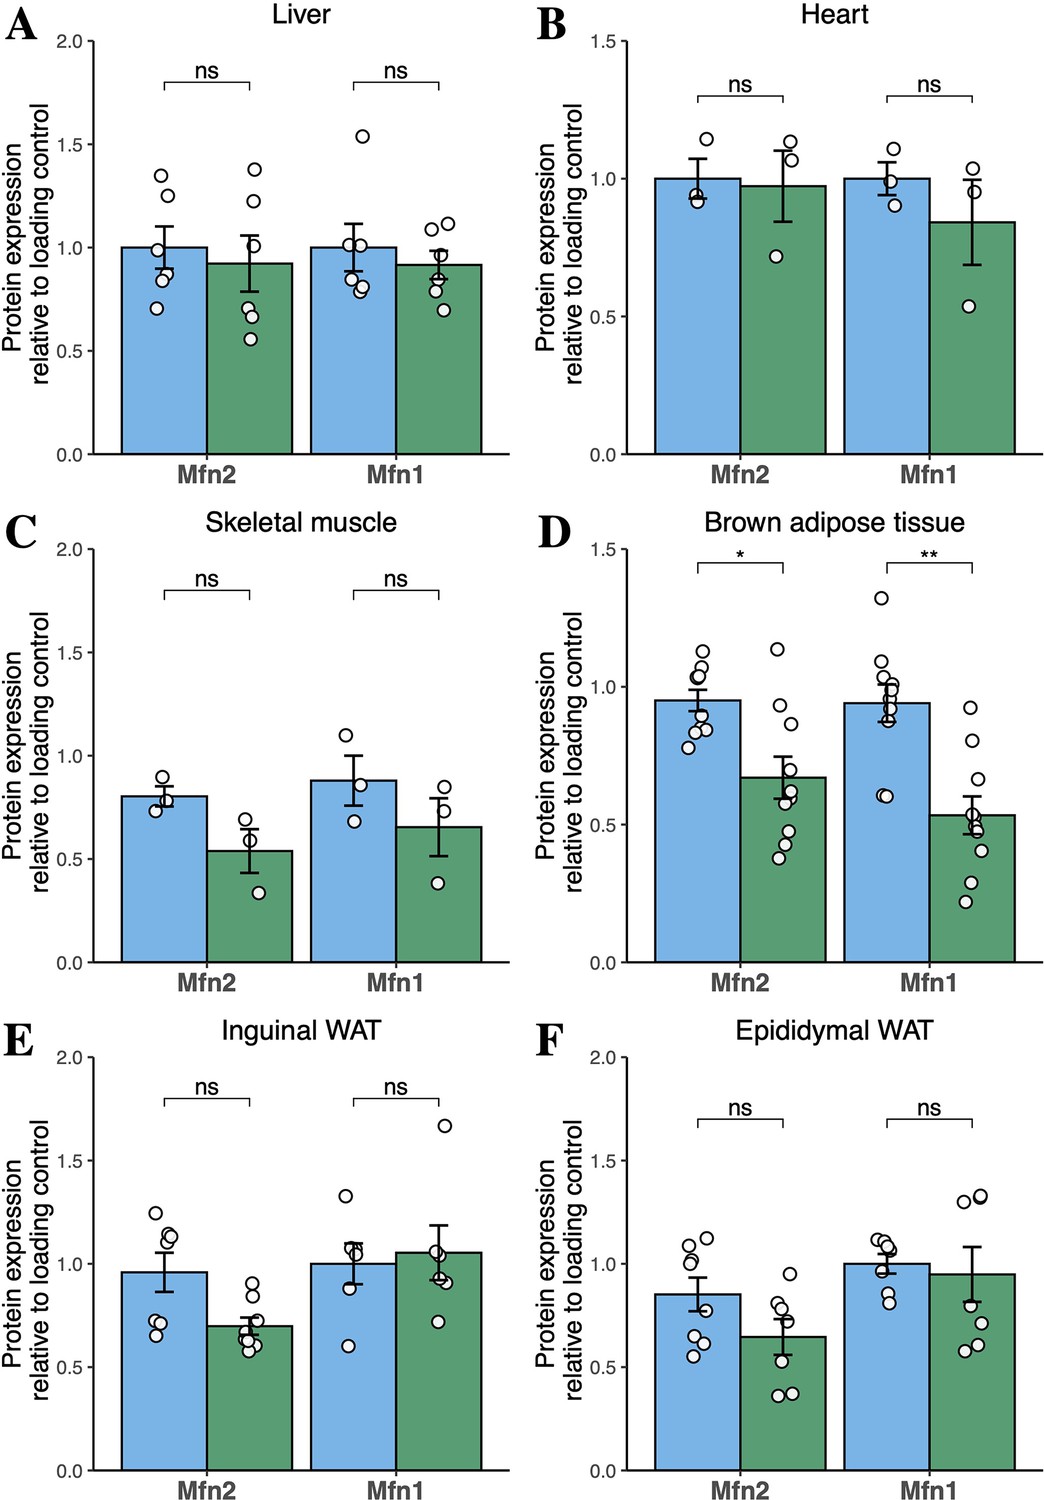
Figure 1—figure supplement 2
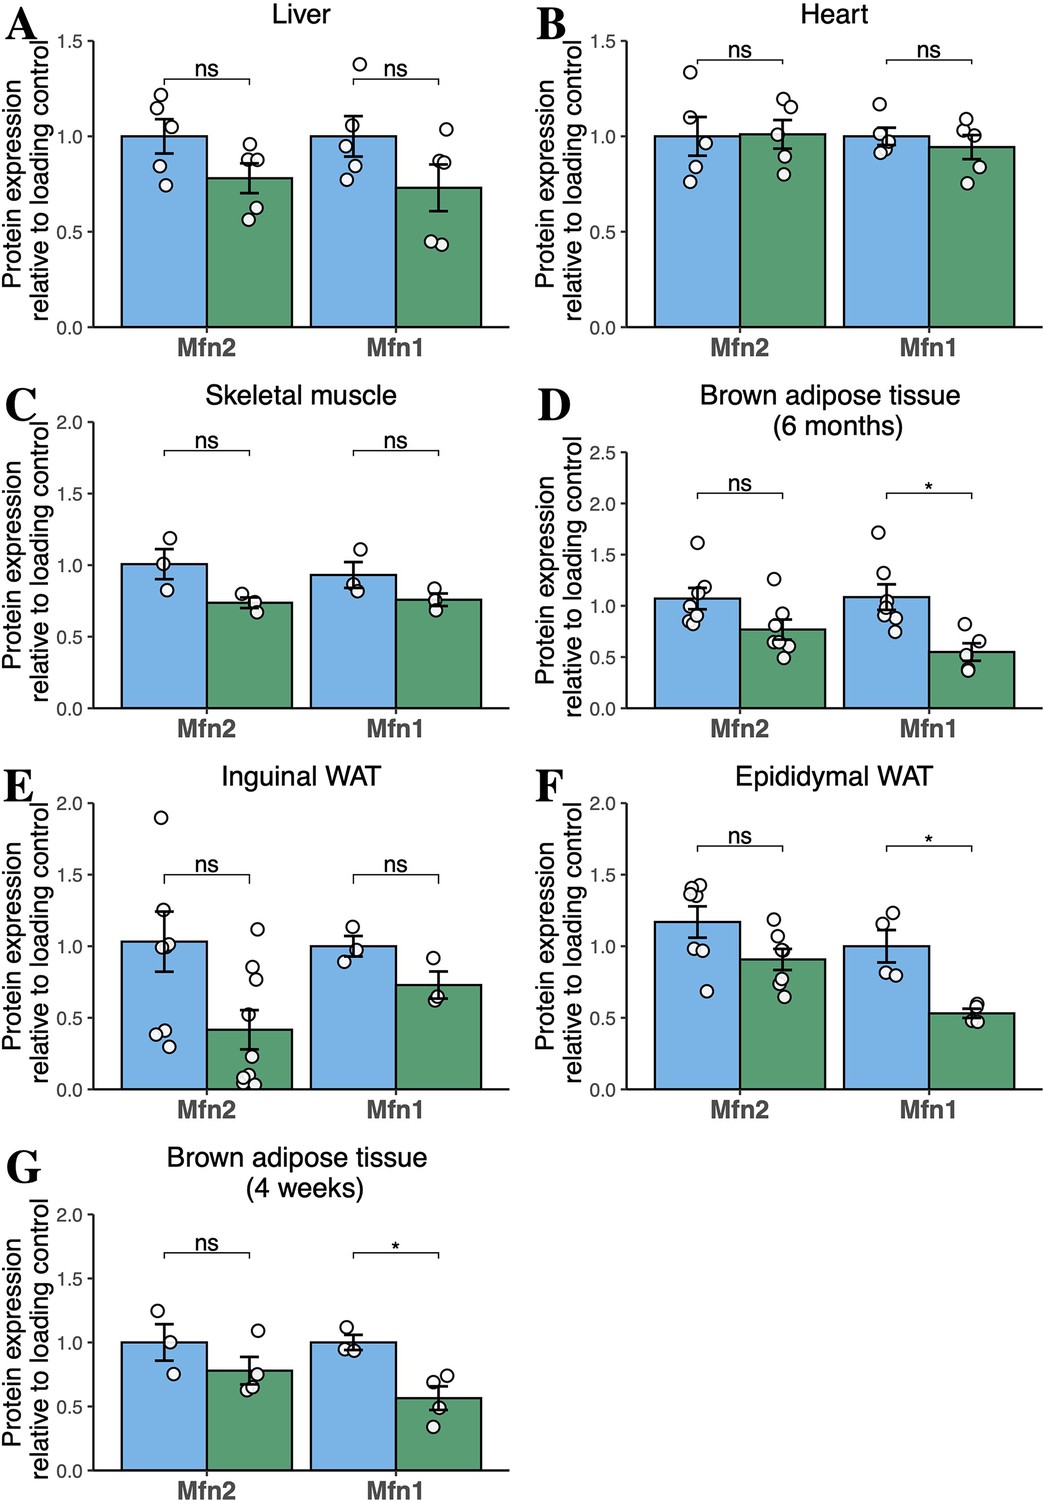
Quantification of western blots for mitofusins in tissues of chow-diet-fed mice.
Densitometric quantification of Mfn1 and Mfn2 bands from liver (A), heart (B), skeletal muscle (C), BAT (D), inguinal WAT (E), and epididymal WAT (F) in male mice fed chow diet for 6 months; and (G) BAT in mice fed chow diet for 4 weeks. Data are from n=3–9 animals. Each point represents data from a separate animal. Asterisks indicate p-values from pairwise comparisons (T-tests) that are false-discovery rate (FDR)-adjusted for multiple tests (* p-FDR <.05). WT in blue, homozygous Mfn2R707W KI in green.
Figure 1—figure supplement 3
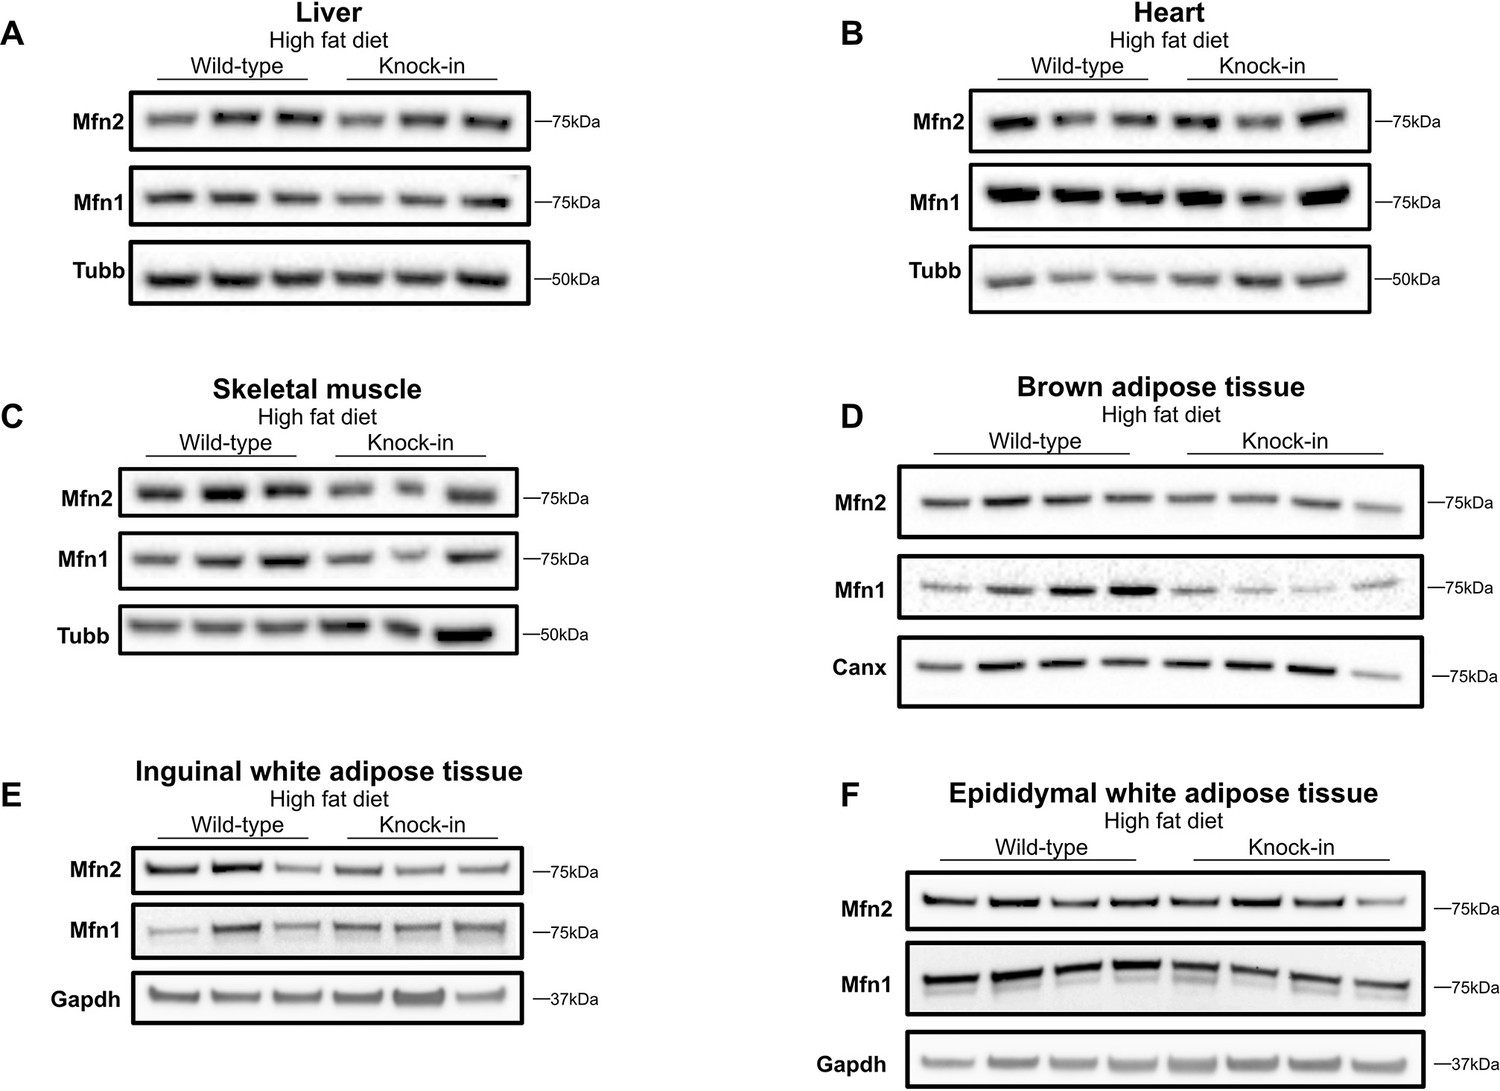
Expression of mitofusins on high-fat diet.
Western blots showing expression of Mfn2 and Mfn1 in liver (A), heart (B), skeletal muscle (C), BAT (D), inguinal WAT (E), and epididymal WAT (F) from WT and homozygous Mfn2R707W KI mice fed a 45% kcal high fat diet (HFD) for 6 months. Each lane contains samples from a separate animal and blots are representative of at least three replicates. Canx (calnexin), Gapdh, and Tubb (β-tubulin) are given as loading controls.
-
Figure 1—figure supplement 3—source data 1
Raw and annotated immunoblots from Figure 1—figure supplement 3.
- https://cdn.elifesciences.org/articles/82283/elife-82283-fig1-figsupp3-data1-v4.zip
Figure 1—figure supplement 4
Quantification of western blots for mitofusins in tissues of high-fat diet-fed mice.
Densitometric quantification of bands for Mfn1 and Mfn2 from male mice fed HFD for 6 months is shown. Data are from liver (A), heart (B), skeletal muscle (C), BAT (D), inguinal WAT (E), and epididymal WAT (F). Data are from n=3–10 animals. Each point represents a separate animal. Asterisks indicate p-values from pairwise comparisons (T-tests) that are FDR-adjusted for multiple tests (* p-FDR <0.05, ** p-FDR <0.01). WT in blue, homozygous Mfn2R707W KI in green.
Figure 2 with 5 supplements
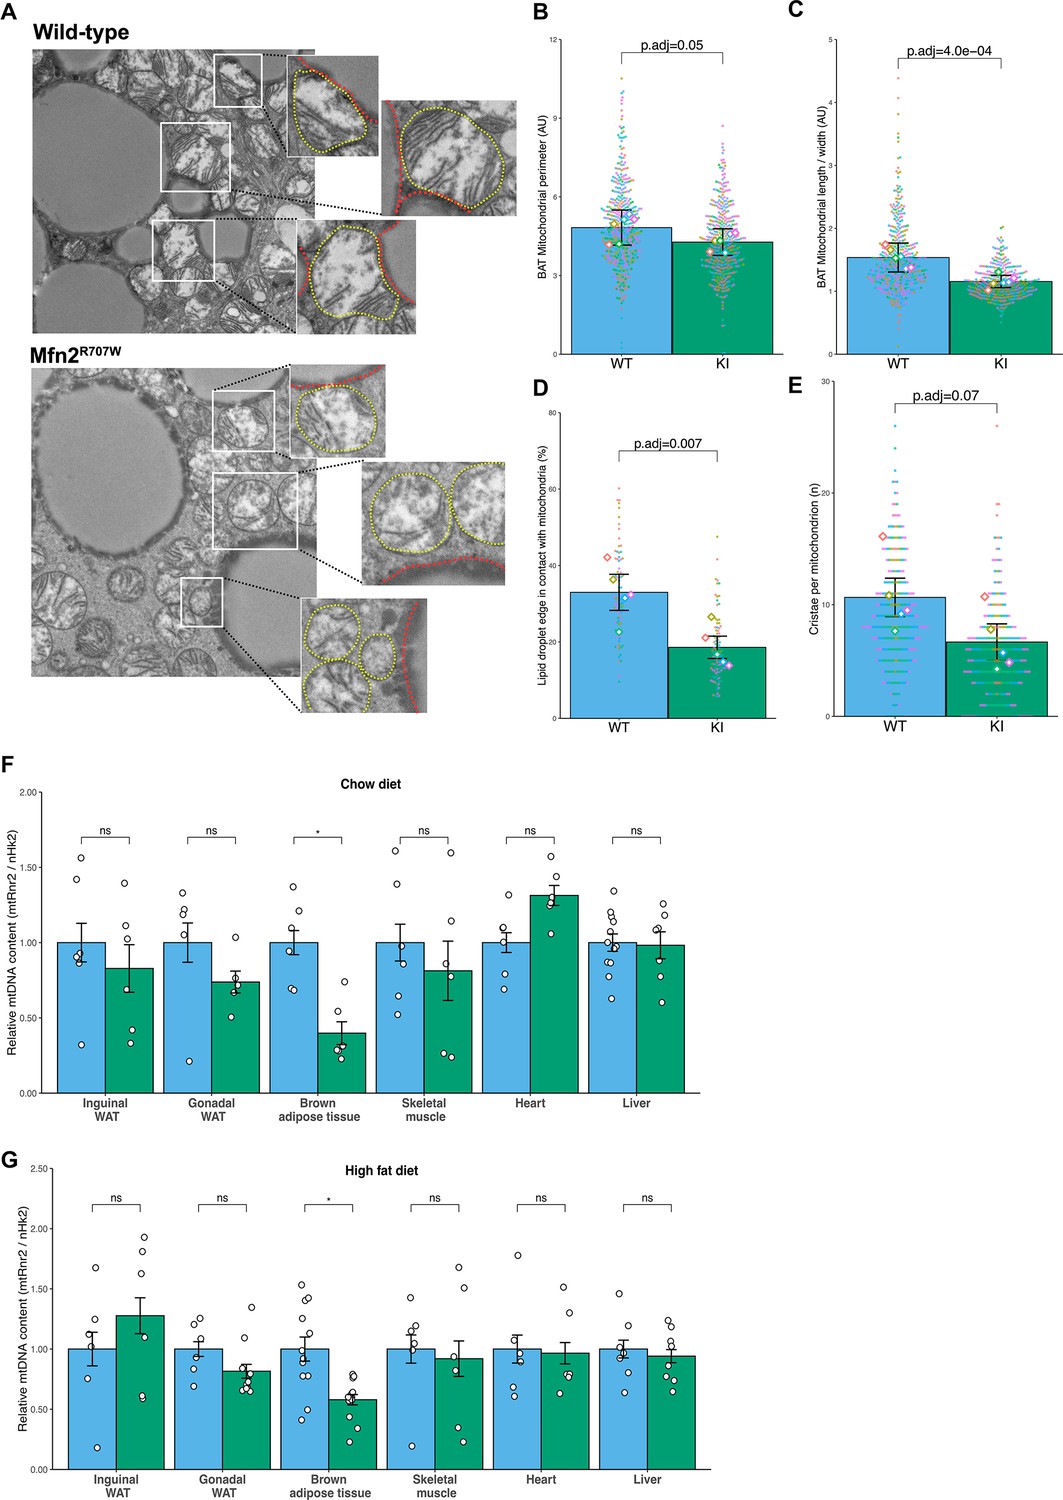
Effect of Mfn2R707W on mitochondrial structure and function.
(A) Representative transmission electron microscopy (TEM) images of BAT with zoomed-in images of mitochondria (highlighted in yellow) bordering lipid droplets (outlined in red). (B) Quantification of mitochondrial perimeter from TEM on BAT. Each dot represents data from an individual mitochondrial cross section with each diamond showing the separate 6 biological replicates. p.adj gives the FDR-adjusted p-value from across all TEM analyses. (C) Quantification of mitochondrial aspect ratio (length/width) from TEM of BAT. (D) Quantification of mitochondrial-lipid droplet contact from TEM, expressed as proportion (%) of lipid droplet in contact with mitochondrial membrane on BAT. (E) Number of cristae per mitochondrion from TEM of BAT. (F–G) Mitochondrial DNA content in tissues from mice fed chow diet (F) or HFD (G) for 6 months. Each data point represents a separate animal. p-values are from pairwise comparisons (T-tests) between WT and Mfn2R707W KI that are FDR-adjusted for multiple tests (* p-FDR <0.05). WT in blue, homozygous Mfn2R707W KI in green. AU, arbitrary units.
Figure 2—figure supplement 1
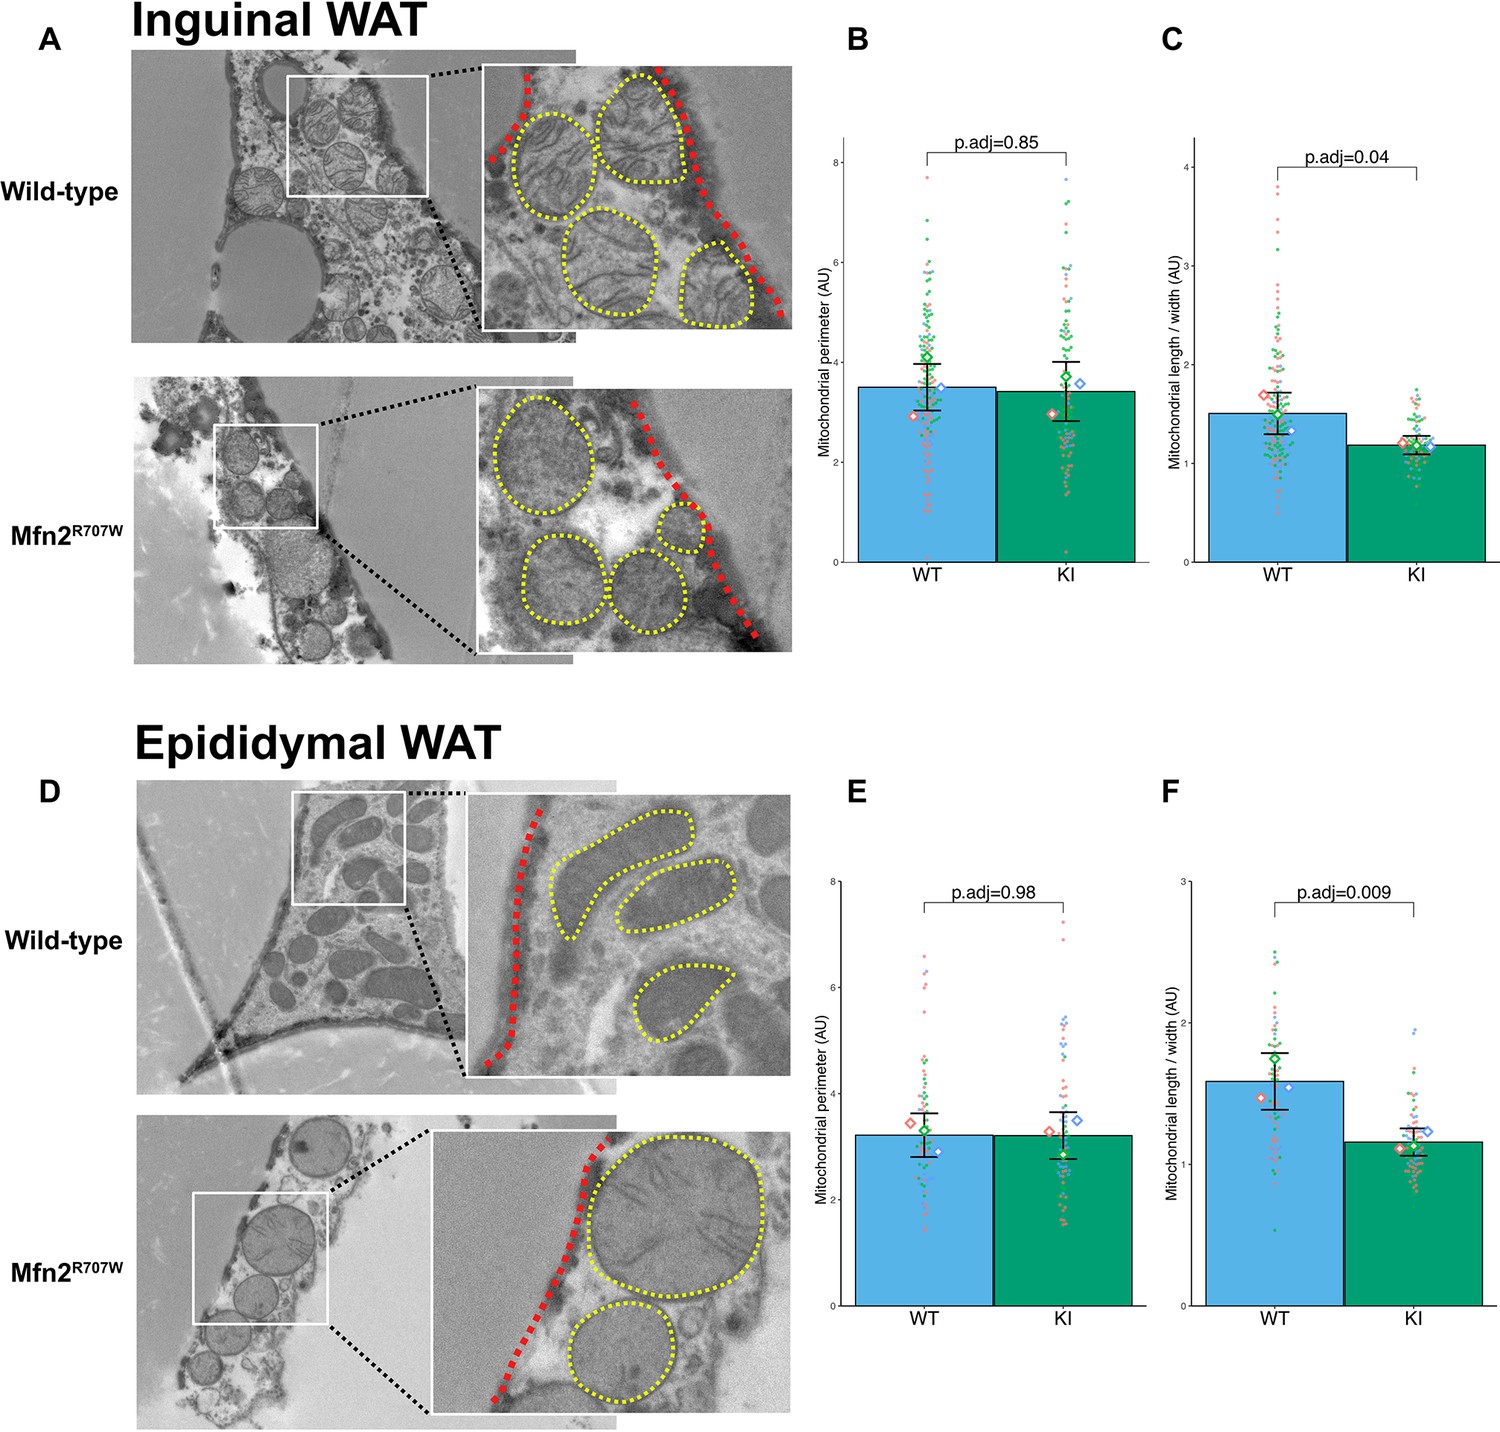
Effect of Mfn2R707W on mitochondrial morphology in white adipose tissue.
(A) Representative TEM images from inguinal WAT with zoomed-in images of mitochondria (highlighted in yellow) bordering lipid droplets (outlined in red). Quantification of mitochondrial perimeter (B) and aspect ratio (length/width) (C) from TEM in inguinal WAT. Each dot represents an individual mitochondrion with diamonds showing biological replicates. p.adj gives the FDR-adjusted p-value from across all TEM analyses. (D) TEM images from epididymal WAT with zoomed-in images of mitochondria (highlighted in yellow) bordering lipid droplets (outlined in red). Quantification of mitochondrial perimeter (E) and aspect ratio (length/width) (F) from TEM on epididymal WAT. FDR-adjusted p-values are from pairwise comparisons (T-tests) between WT and Mfn2R707W KI. WT in blue, homozygous Mfn2R707W KI in green.
Figure 2—figure supplement 2
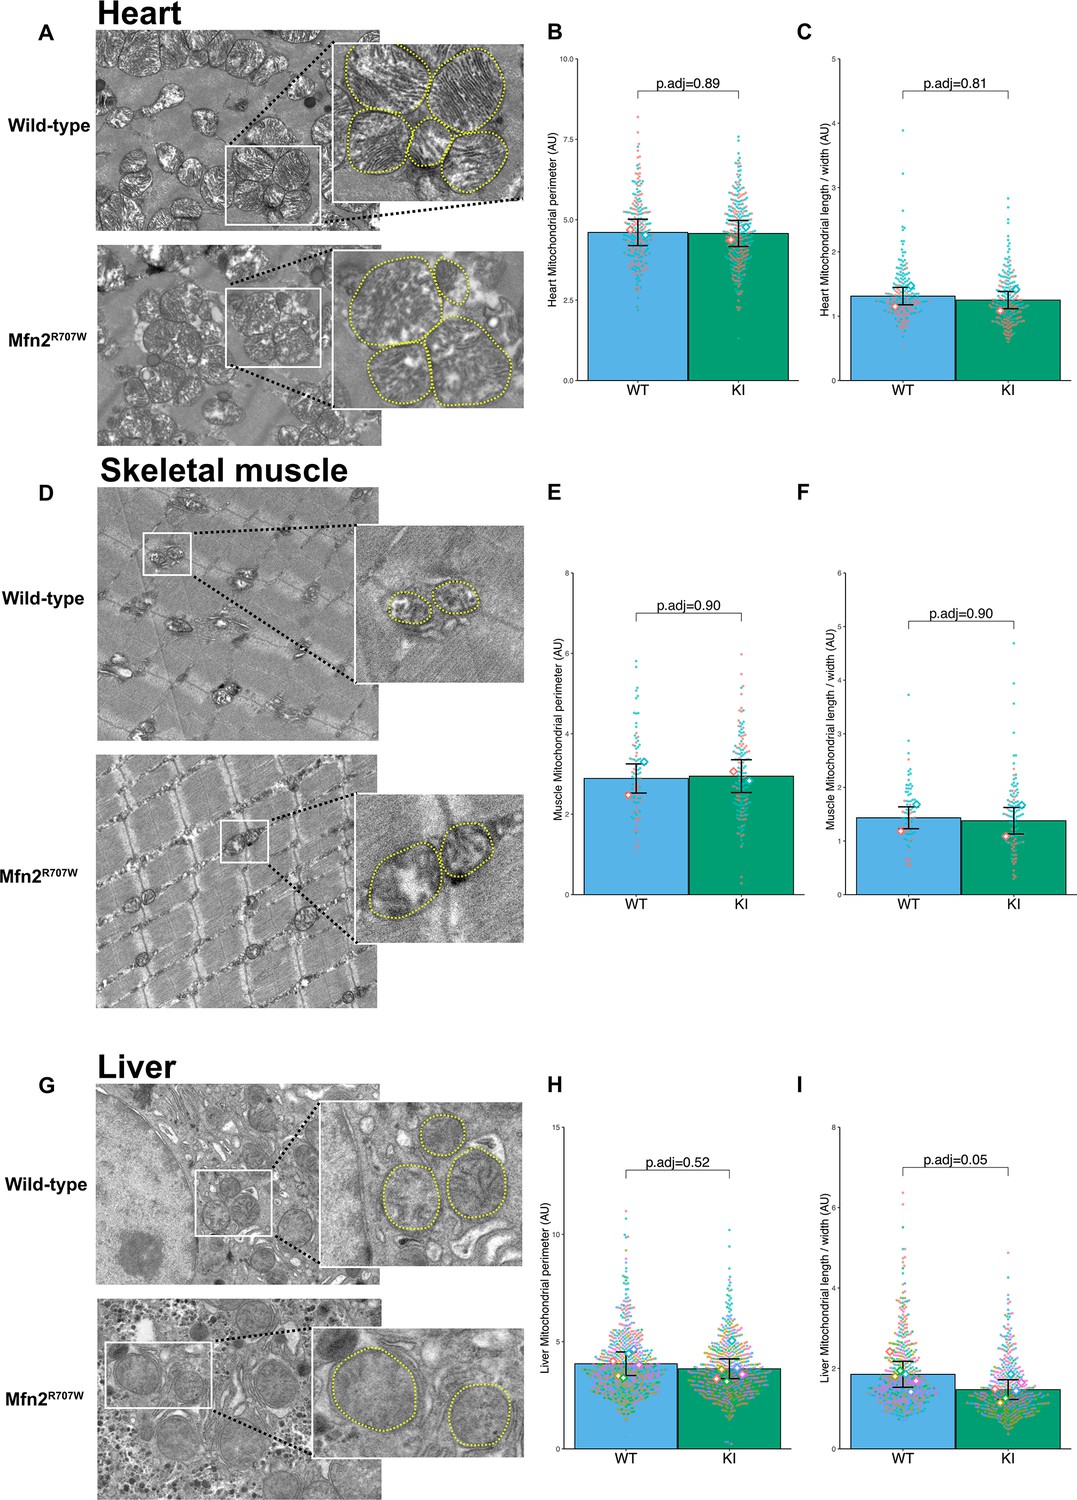
Effect of Mfn2R707W on mitochondrial morphology in liver, heart, and muscle.
(A) Representative TEM images from the heart with zoomed-in images of mitochondria (highlighted in yellow). (B) Quantification of mitochondrial perimeter from TEM on heart. Each dot represents an individual mitochondrion with diamonds showing biological replicates. p.adj gives the FDR-adjusted p-value from across all TEM analyses. (C) Quantification of mitochondrial aspect ratio (length/width) from TEM on heart. (D) TEM images from skeletal muscle with zoomed-in images of mitochondria (highlighted in yellow). Quantification of mitochondrial perimeter (E) and aspect ratio (length/width) (F) from TEM on skeletal muscle. (G) TEM images from liver with zoomed-in images of mitochondria (highlighted in yellow). Quantification of mitochondrial perimeter (H) and aspect ratio (length/width) (I) from TEM on liver. FDR-adjusted p-values are from pairwise comparisons (T-tests) between WT and Mfn2R707W KI. WT in blue, homozygous Mfn2R707W KI in green.
Figure 2—figure supplement 3
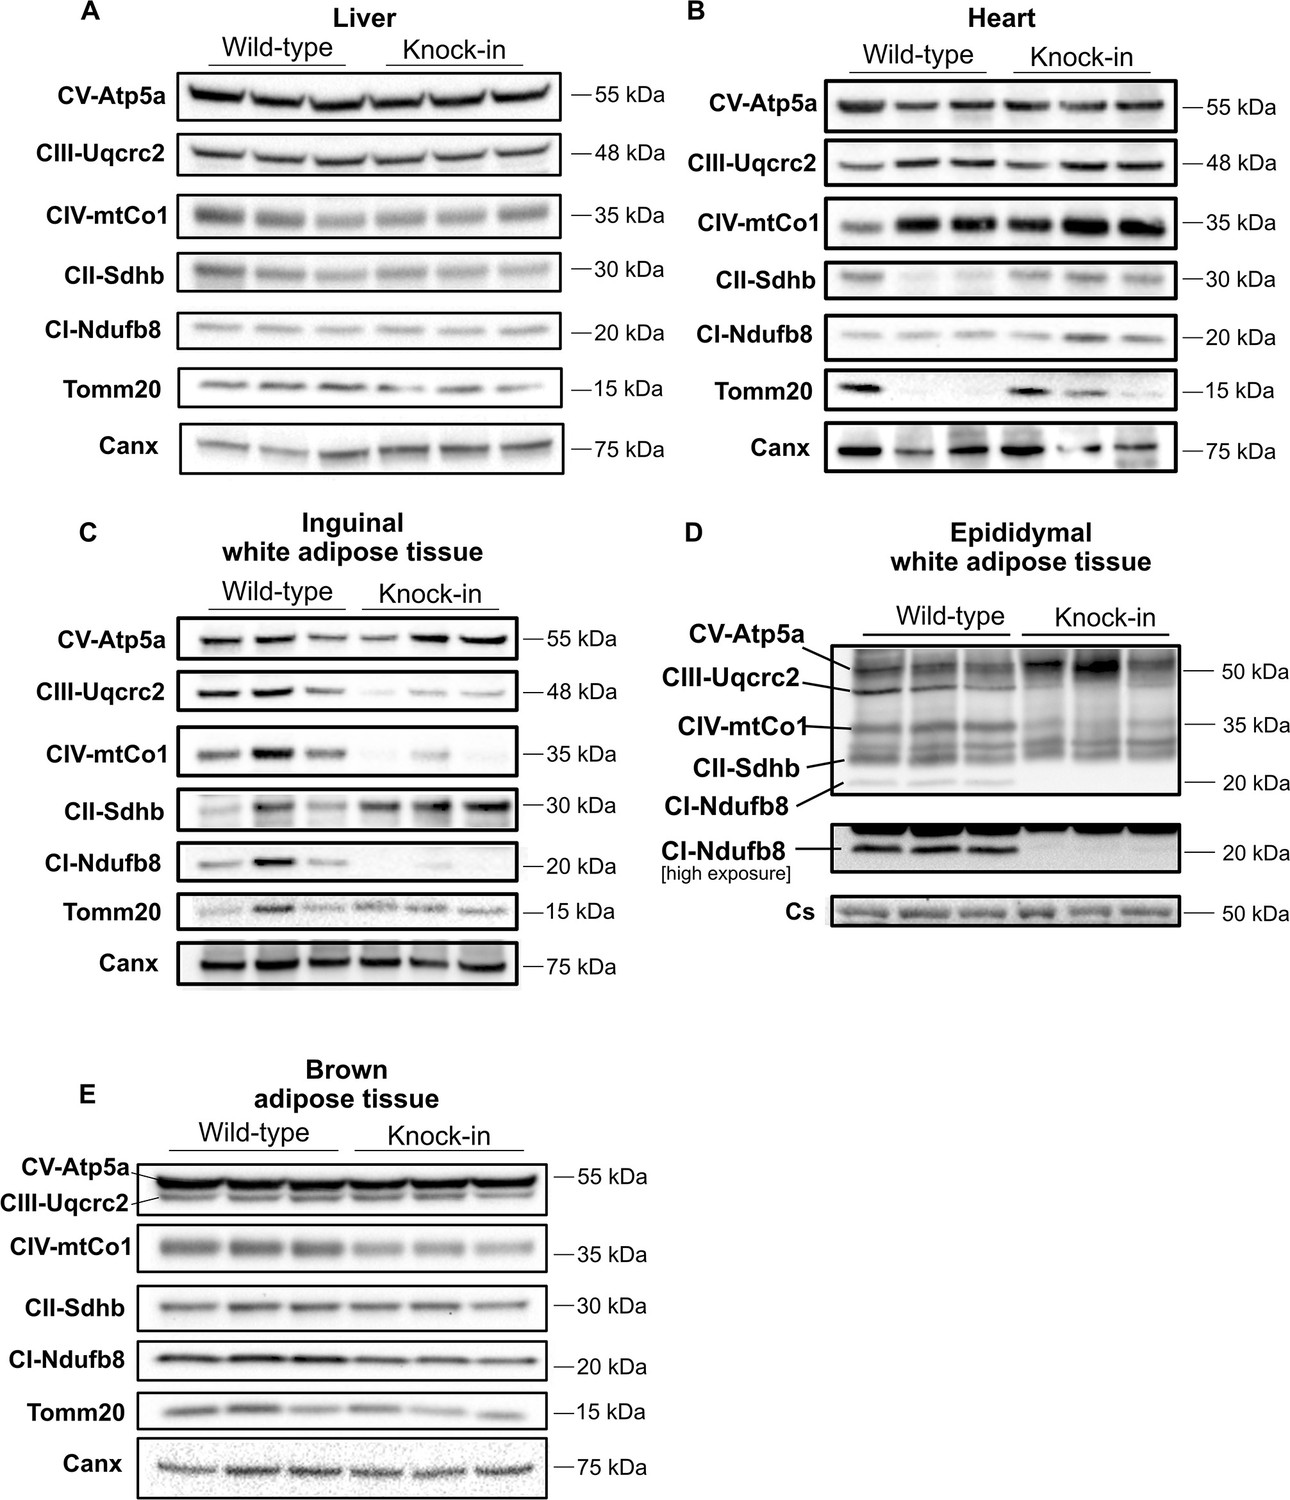
Altered expression of Oxphos protein subunits in adipose tissue.
Western blots showing expression of Oxphos protein subunits in mice fed chow diet for 6 months. Expression is shown from liver (A), heart (B), inguinal WAT (C), epididymal WAT (D), and BAT (E). Each lane contains samples from a separate animal and blots are representative of at least three replicates. Canx (calnexin) is used as total cellular control and Tomm20 (or citrate synthetase (Cs)) is used as mitochondrial mass loading control.
-
Figure 2—figure supplement 3—source data 1
Raw and annotated immunoblots from Figure 2—figure supplement 3.
- https://cdn.elifesciences.org/articles/82283/elife-82283-fig2-figsupp3-data1-v4.zip
Figure 2—figure supplement 4
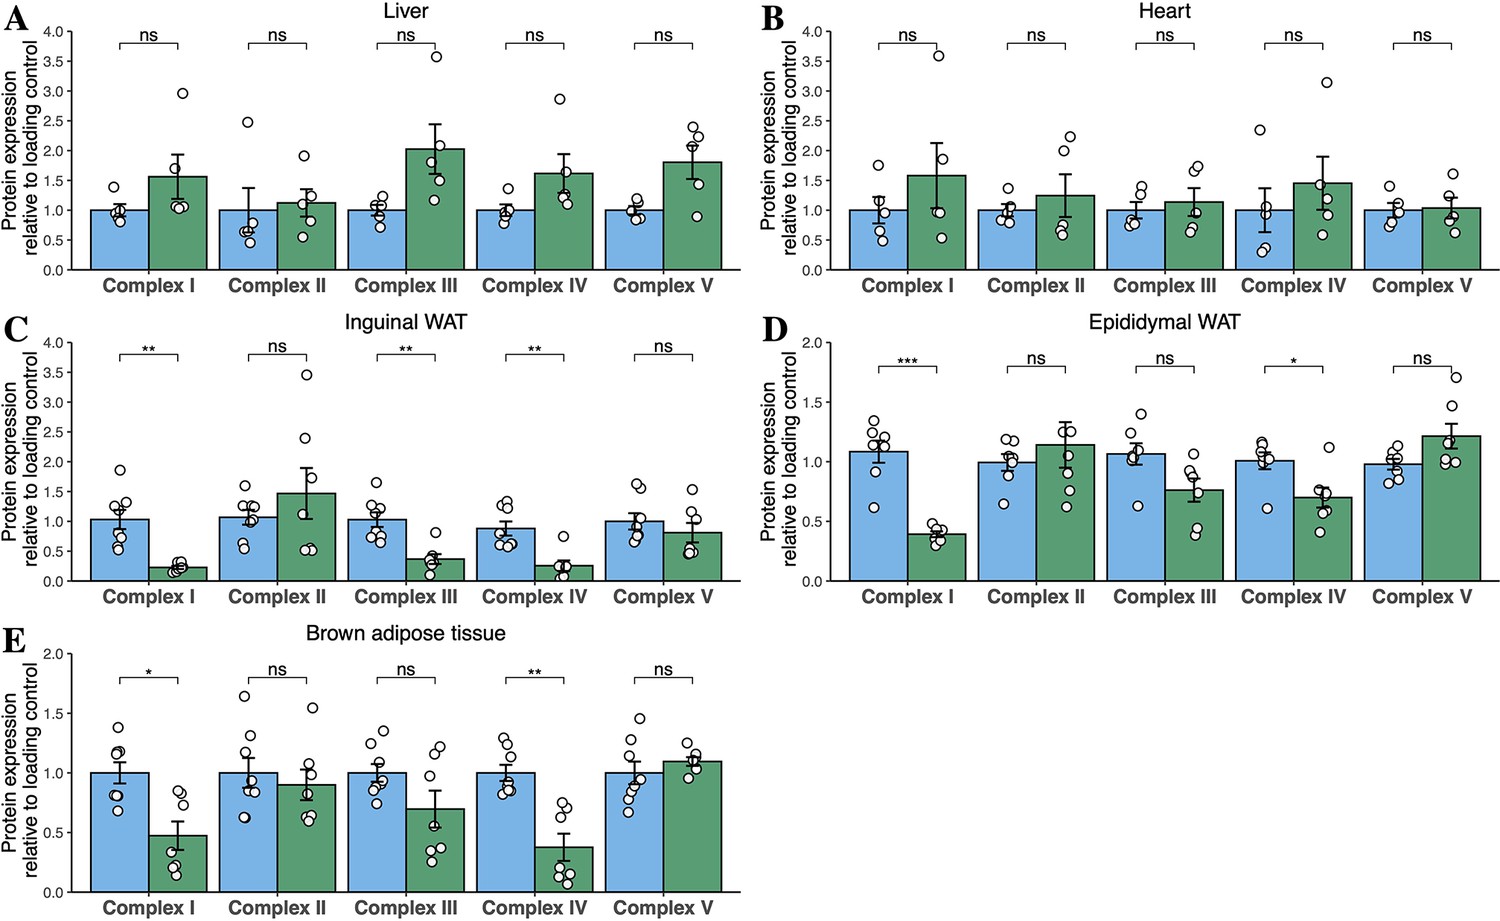
Quantification of western blots for Oxphos subunits from tissues of chow-diet-fed mice.
Densitometric quantification of bands for mitochondrial Oxphos subunits from male mice fed chow diet for 6 months. Data are from liver (A), heart (B), inguinal WAT (C), epididymal WAT (D), and BAT (E). Data are from n=3–8 animals per genotype. Each point represents a separate animal. Asterisks indicate p-values from pairwise comparisons (T-tests) that are FDR-adjusted for multiple tests (* p-FDR <0.05, ** p-FDR <0.01). WT in blue, homozygous Mfn2R707W KI in green.
Figure 2—figure supplement 5
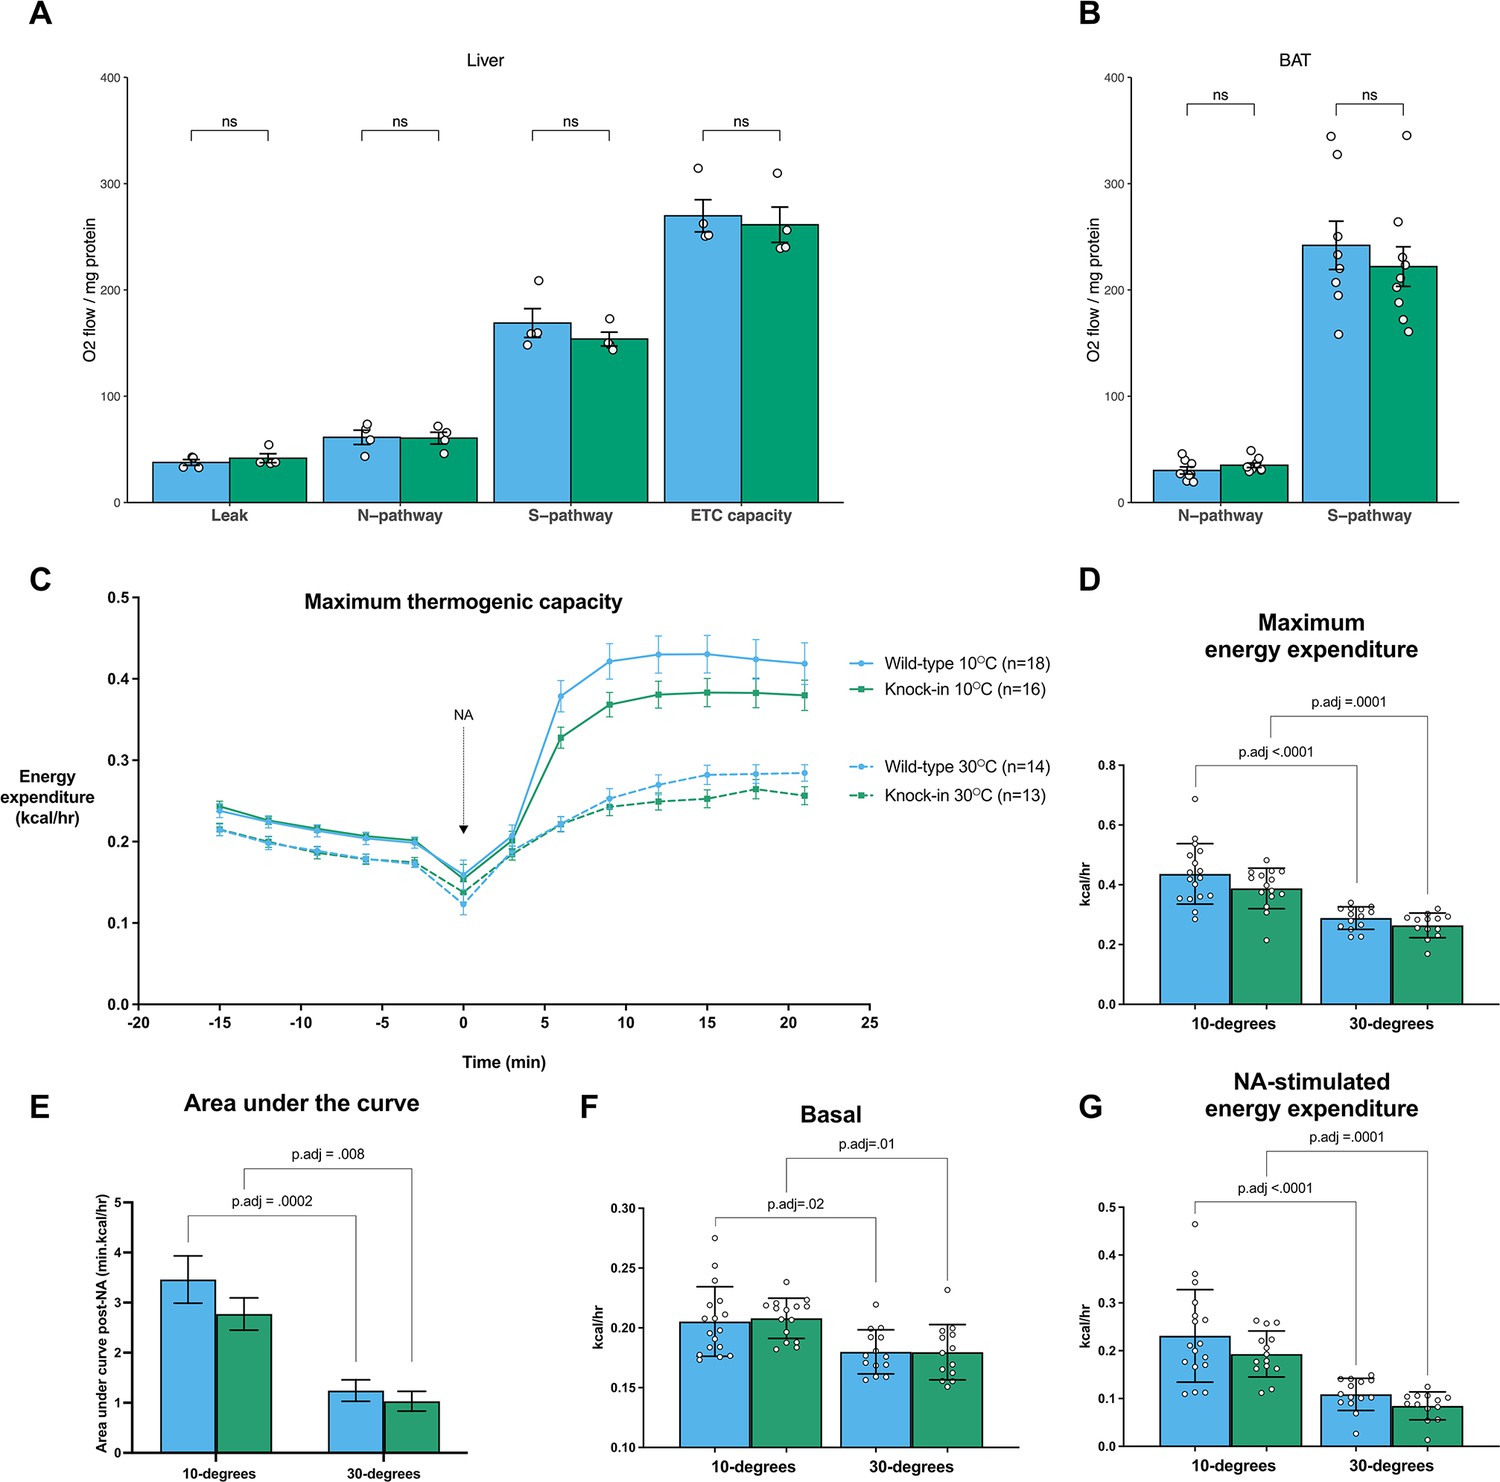
Mfn2R707W does not impair brown adipose tissue thermogenic capacity.
Ex vivo mitochondrial respirometry in liver (A, n=4) and BAT (B, n=9). Each data point represents data from a separate animal. Eight-week-old chow-diet-fed mice were exposed to cold (10 °C, n=16–18) or thermoneutrality (30 °C, n=13–14) for 4 weeks and then maximum thermogenic capacity was tested using noradrenaline (NA) stimulation under anaesthesia. (C) Trend in energy expenditure (kcal/hr) before and after noradrenaline stimulation for cold (solid line) and thermoneutral (dashed line) housed animals. (D) Quantification of maximum (peak) energy expenditure. P-values represent the difference between groups comparing 10°C and 30°C. (E) Area under the curve analysis using the minimum value at the point of noradrenaline (NA) injection at the base of the curve. (F) Basal energy expenditure prior to NA injection. (G) Difference between peak and baseline energy expenditure under both conditions. WT in blue, homozygous Mfn2R707W KI in green. Each data point represents results from an individual animal. FDR-adjusted p-values are from pairwise comparisons (T-tests) between groups as indicated.
Figure 3 with 2 supplements
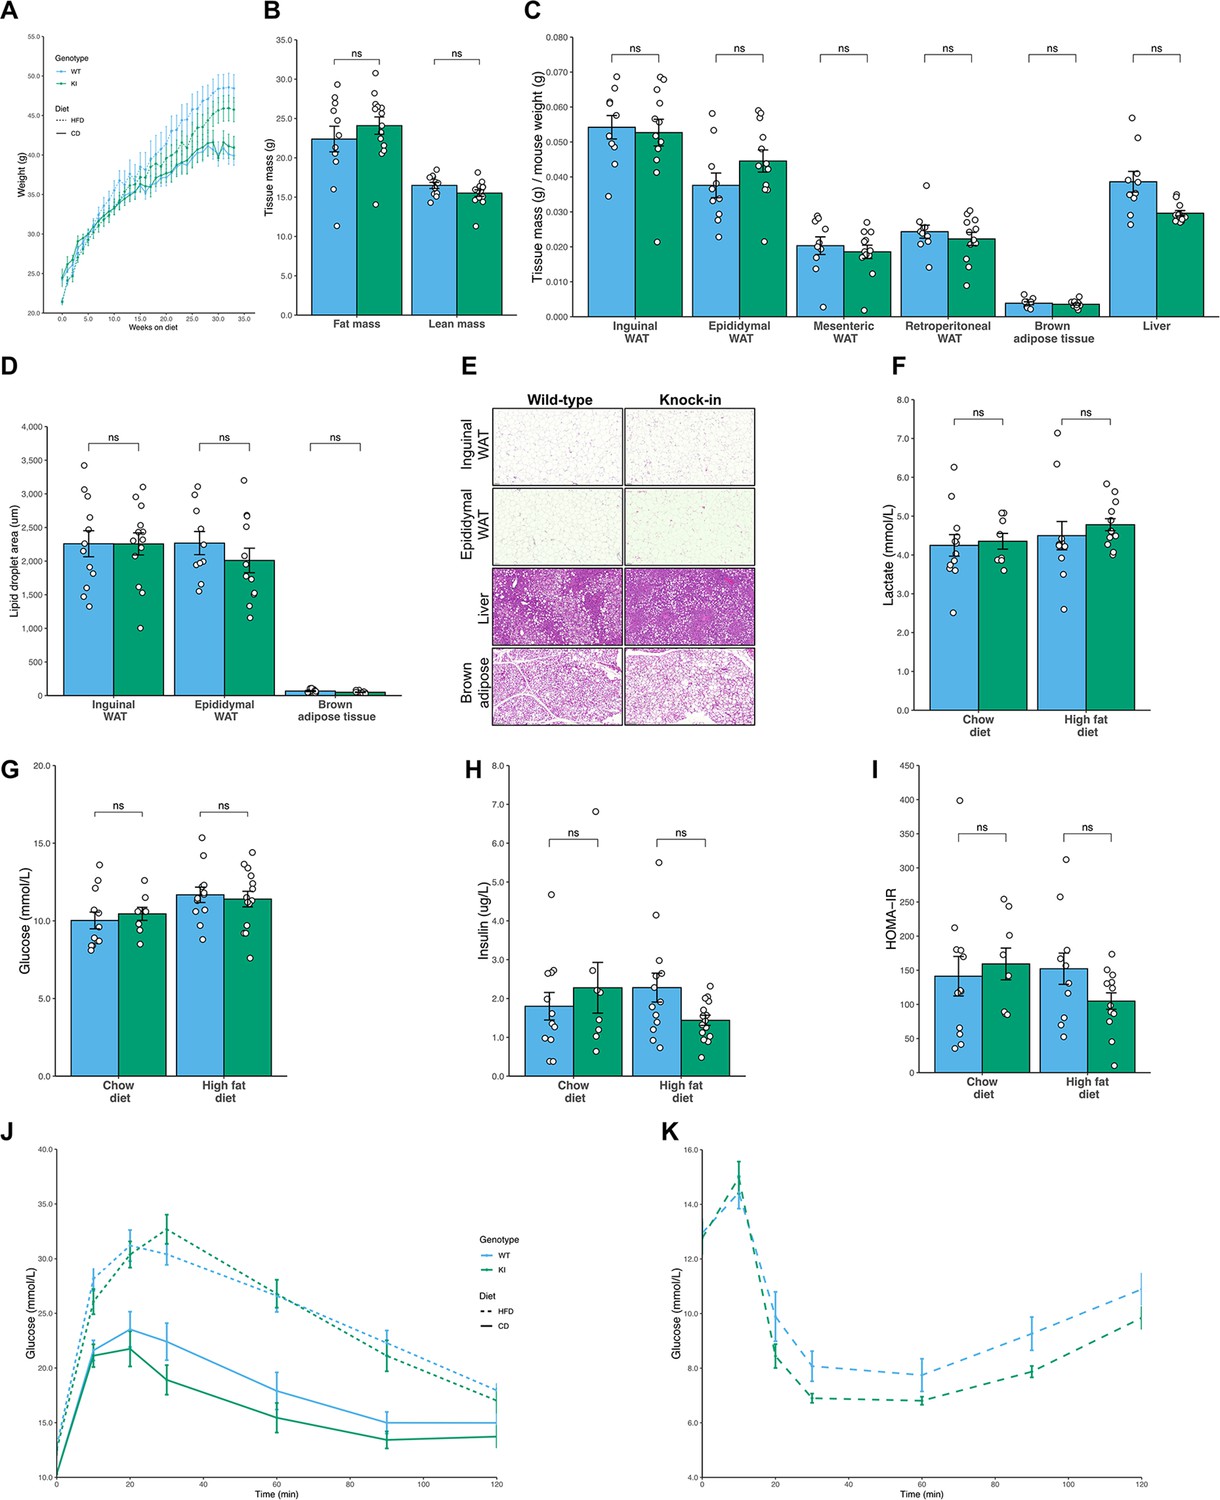
No difference in fat mass or glucose homeostasis in Mfn2R707W mice compared to WT mice on chow or high fat diet.
Seven-week-old mice were fed chow (n=8–12) or 45% kcal HFD (n=13–14) for 6 months. (A) Absolute body mass for mice fed chow (solid line) and HFD (dashed line) over 6 months. (B) Time-domain nuclear magnetic resonance (TD-NMR) measurement of fat and lean mass of mice fed HFD. (C) The ratio of tissue weights versus body mass for multiple tissues, including four WAT depots, from mice fed HFD. (D) Quantification of lipid droplet area from histological specimens of adipose tissue from mice fed HFD for 6 months. (E) Representative histological images from WAT, liver, and BAT from mice fed HFD. Analyses of mouse plasma lactate (F), plasma glucose (G), and insulin (H), homeostatic model of assessment of insulin resistance (HOMA-IR, I) after a 6 hr fast. Change in plasma glucose during intraperitoneal glucose tolerance test (J) and intraperitoneal insulin tolerance test (K). ns, p>0.05 on unpaired T-tests, adjusted for multiple comparisons. WT in blue, homozygous Mfn2R707W KI in green. Each data point represents an individual animal.
Figure 3—figure supplement 1
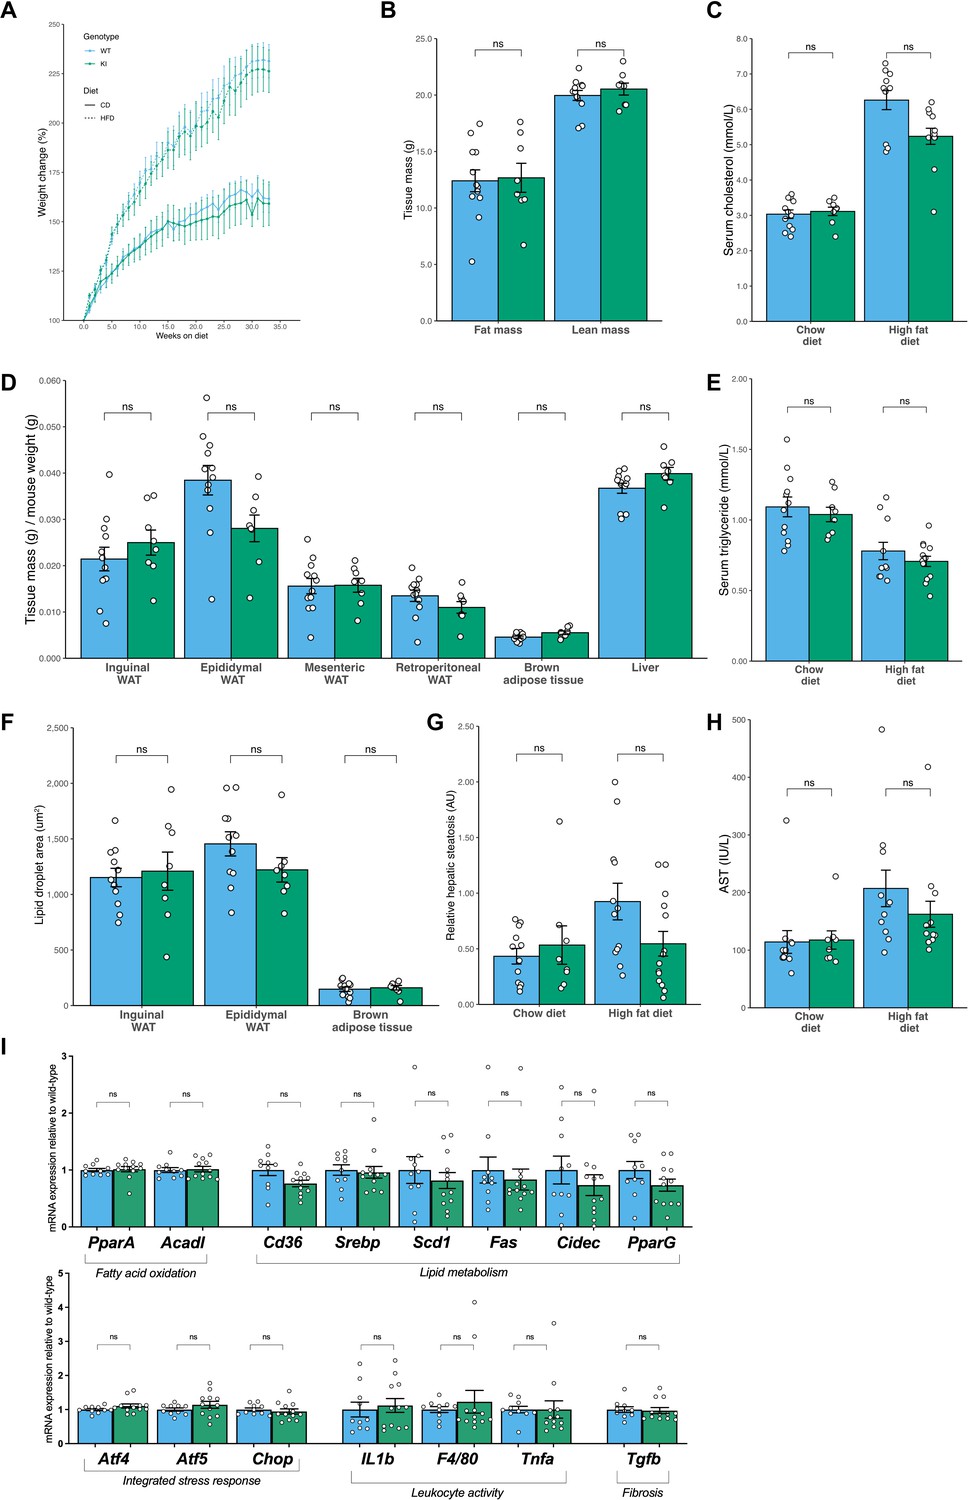
No evidence of altered fat mass or glucose homeostasis in Mfn2R707W compared to WT mice on chow or high fat diet for 6 months.
Seven-week-old mice were fed chow diet (n=8–12) or 45% kcal HFD (n=13–14) for 6 months. (A) Relative (%) change of body mass for mice fed chow diet (solid line) and HFD (dashed line) over 6 months. (B) TD-NMR measurement of fat and lean mass in mice fed a chow diet for 6 months. (C) Analysis of mouse serum biochemistry after 6 months of diet and a 6 hr fast for total cholesterol. (D) The ratio of tissue weights versus body mass for multiple tissues, including four WAT depots, from mice fed chow diet for 6 months. (E) Serum triglycerides. (F) Quantification of lipid droplet area from histological specimens of adipose tissue from mice fed chow diet for 6 months. (G) Quantification of relative hepatic steatosis from histological images of liver. (H) Serum aspartate aminotransferase. (I) qPCR of genes implicated in the integrated stress response, lipid metabolism or inflammation in liver from animals fed HFD for 6 months. Raw expression values for target genes were normalised to three housekeeping genes (36b4, B2m, and Hprt) and expressed relative to WT liver. ns, p>0.05 on unpaired T-tests, adjusted for multiple comparisons. WT in blue, homozygous Mfn2R707W in green. Each data point represents results from an individual animal.
Figure 3—figure supplement 2
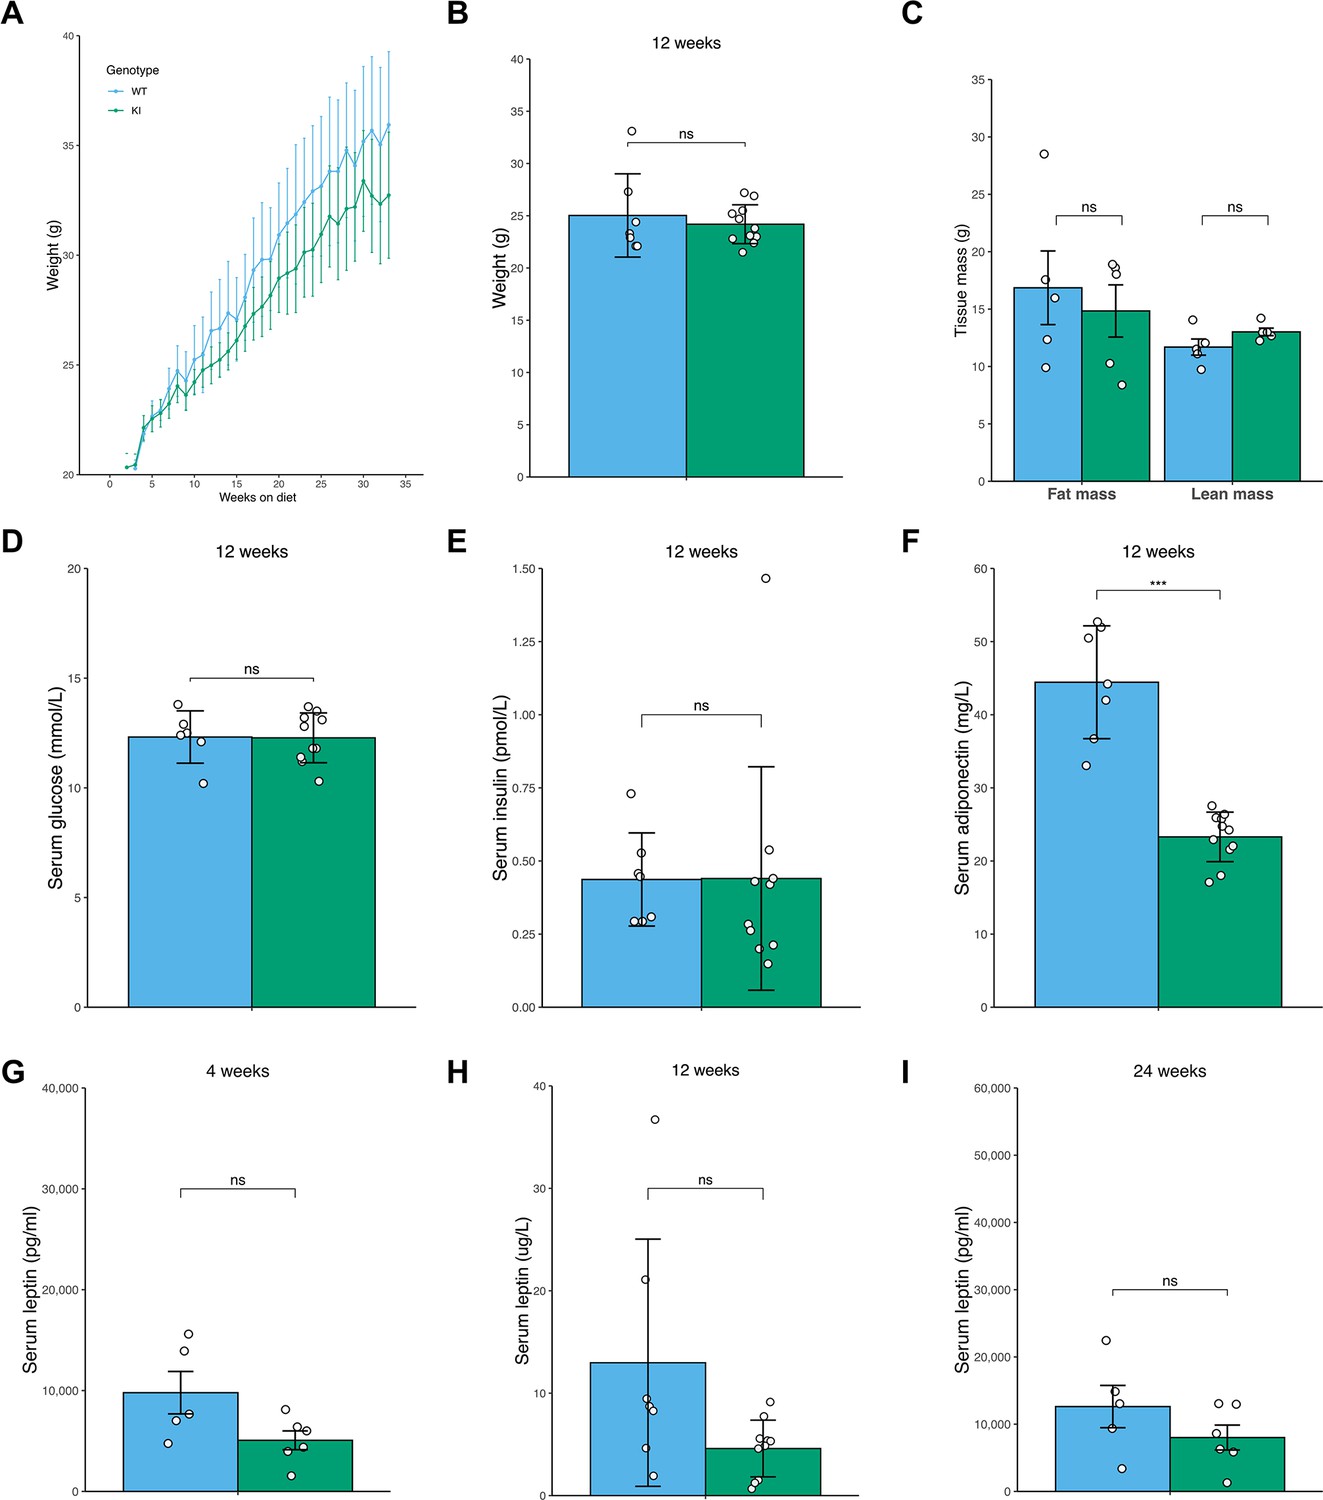
Similar phenotype in female Mfn2R707W knock-in mice fed high fat diet for 6 months.
Seven-week-old female mice were fed 45% kcal HFD (n=5–11) for 6 months. (A) Absolute body mass for over 6 months. (B) Body mass after 12 weeks on HFD. (C) TD-NMR measurement of fat and lean mass of female mice after 12 weeks on HFD. (D–F) Analysis of mouse serum biochemistry after 12 weeks of diet and a 6 hr fast for serum glucose (D), serum insulin (E), and serum adiponectin (F). Analysis of mouse serum leptin at 4 weeks (G), 12 weeks (H), and 24 weeks (I) on HFD after a 6 hr fast. WT in blue, homozygous Mfn2R707W KI in green. Each data point represents an individual animal. Asterisks indicate p-values from pairwise comparisons (T-tests) between WT and Mfn2R707W KI that are FDR-adjusted for multiple tests (*** p-FDR <0.001).
Figure 4 with 5 supplements

Mfn2R707W causes an adipose-tissue-specific induction of the integrated stress response.
qPCR of genes involved in the integrated stress response (ISR) for six tissues from animals fed chow diet for 6 months: Atf4 (A), Ddit3 (Chop, B), and Atf5 (C). Each data point represents one animal. Target gene CT values were normalised to three housekeeping genes (36b4, B2m, and Hprt) and expressed relative to WT liver for each gene. WT in blue, homozygous Mfn2R707W in green. p-values are FDR-adjusted for multiple tests. Western blots from BAT (D), epididymal WAT (E), and liver (F) illustrating Ser51-phosphorylation of eIF2α and expression of Mthfd2 with calnexin (Canx) as loading control. Western blots are representative of at least three biological and technical replicates. (G) Volcano plot from bulk RNA sequencing (n=8 per genotype) of inguinal WAT from mice on HFD. Significantly differentially expressed genes (Log2 fold change >1.5 and p-FDR <0.001) are highlighted in orange. Pathway analysis using significantly differentially expressed genes for upregulated (H) and downregulated (I) Hallmark gene sets. The X-axis depicts a relative gene set enrichment score. All illustrated gene sets are enriched with p-FDR <0.05. Asterisks indicate p-values from pairwise comparisons (T-tests) between WT and Mfn2R707W KI that are FDR-adjusted for multiple tests (* p-FDR <0.05, ** p-FDR <0.01, *** p-FDR <0.001, **** p-FDR <0.0001).
-
Figure 4—source data 1
Raw and annotated immunoblots from Figure 4D–F.
- https://cdn.elifesciences.org/articles/82283/elife-82283-fig4-data1-v4.zip
Figure 4—figure supplement 1
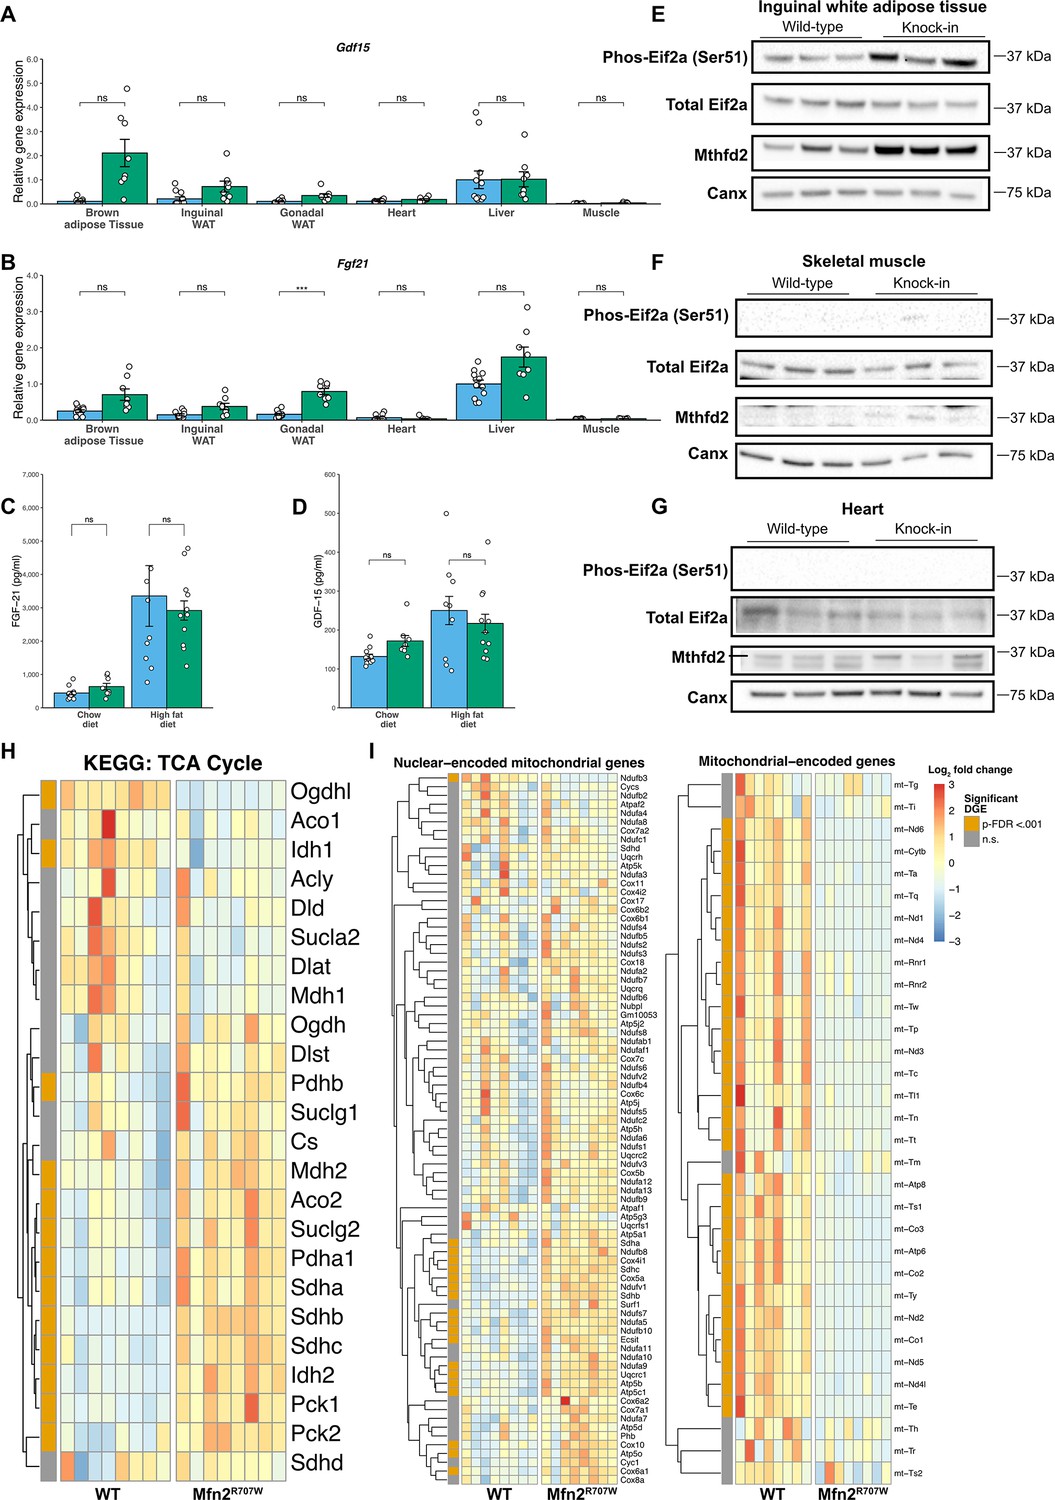
Mfn2R707W causes adipose tissue-specific induction of the integrated stress response with perturbation of mitochondrial gene expression.
qPCR of genes involved in the ISR for six tissues from animals fed a chow diet for 6 months: Gdf15 (A) and Fgf21 (B). Each data point represents data from a separate animal. Target gene CT values were normalised against three housekeeping genes (36b4, B2m, and Hprt) and expressed relative to WT liver for each gene. p-Values are FDR-adjusted for multiple tests. Serum FGF-21 (C) and GDF-15 (D) after 6 months of chow diet or HFD. Western blots from inguinal WAT (E), skeletal muscle (F), and heart (G) illustrating Ser51-phosphorylation of eIF2α and expression of Mthfd2 with calnexin (Canx) as loading control. Western blots are representative of at least three biological replicates. Mthfd2 in heart (G) is the upper band within the box, as indicated by a horizontal line. (H) Heatmap of all genes from the citrate acid (tricarboxylic acid (TCA)) cycle KEGG pathway. Colour illustrates the Log2 fold change normalised per gene. Those annotated with orange in the leftmost column had significant differential gene expression (DGE) with p-FDR <0.001. (I) Heatmaps comparing mRNA expression of mitochondrial- and nuclear-encoded mitochondrial genes from inguinal WAT from HFD-fed animals. Asterisks indicate p-values from pairwise comparisons (T-tests) between WT and Mfn2R707W KI that are FDR-adjusted for multiple tests (*** p-FDR <0.001).
-
Figure 4—figure supplement 1—source data 1
Raw and annotated immunoblots from Figure 4—figure supplement 1E–G.
- https://cdn.elifesciences.org/articles/82283/elife-82283-fig4-figsupp1-data1-v4.zip
Figure 4—figure supplement 2
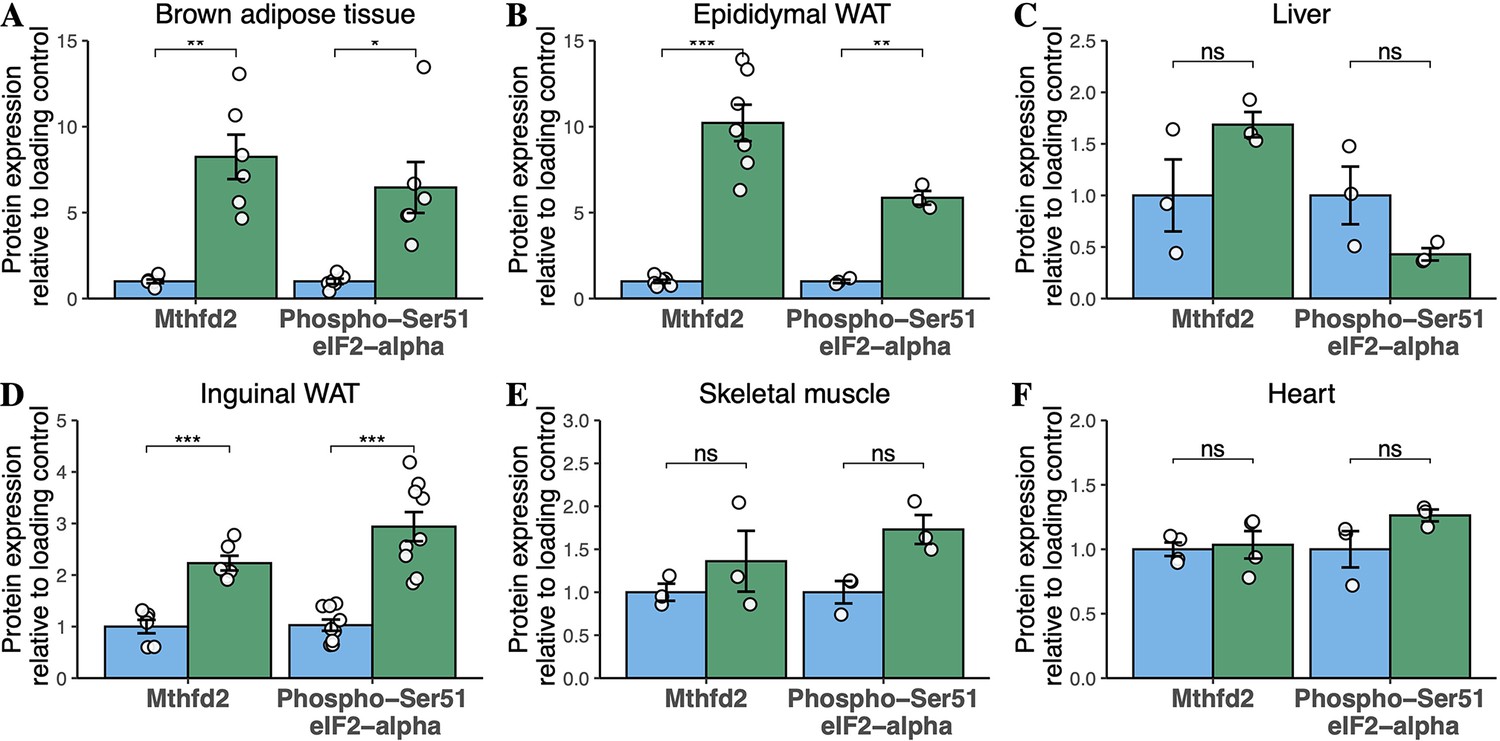
Quantification of western blots for components of the integrated stress response in high-fat diet-fed mice.
Densitometric quantification of bands for Mthfd2 and phosphorylated Ser-51 eIF2α from male mice fed HFD for 6 months. (A) BAT, (B) epididymal WAT, (C) liver, (D) inguinal WAT, (E) skeletal muscle, and (F) heart. Data are from three to nine animals. Each point represents a separate animal. Asterisks indicate p-values from pairwise comparisons (T-tests) between WT and Mfn2R707W KI that are FDR-adjusted for multiple tests (* p-FDR <0.05, ** p-FDR <0.01, *** p-FDR <0.001). WT in blue, homozygous Mfn2R707W KI in green.
Figure 4—figure supplement 3
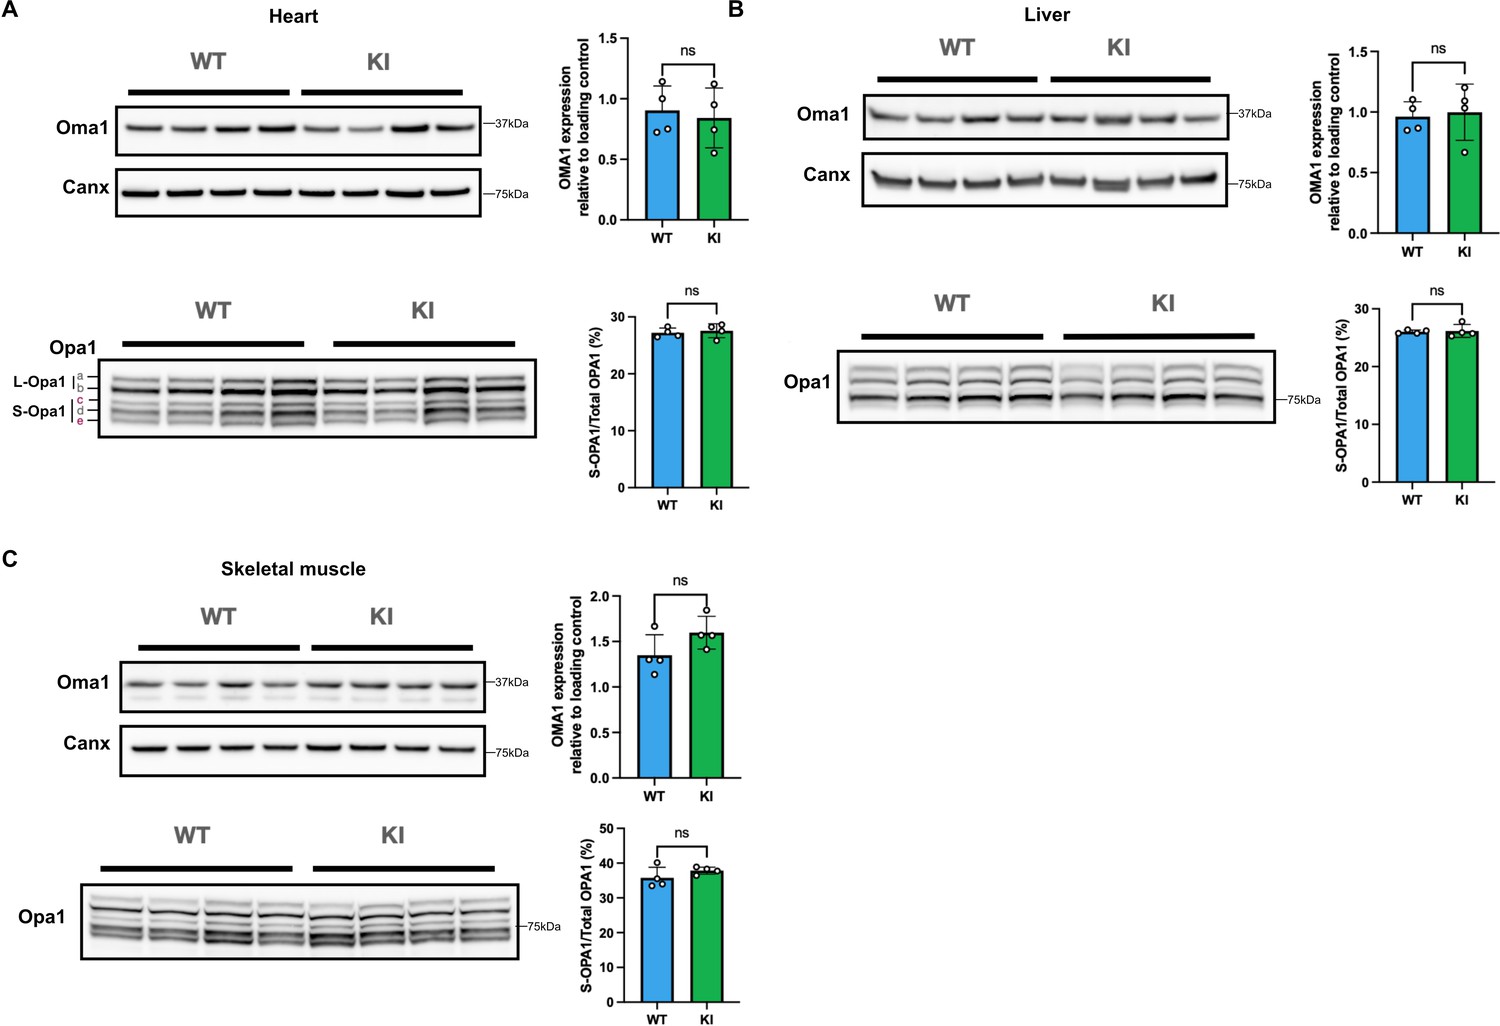
Mfn2R707W does not affect Oma1 or Opa1 processing in heart, liver, and muscle.
Western blots of heart (A), liver (B), and skeletal muscle (C) for Opa1 and Oma1 are shown. Tissues are from male mice fed chow diet for 6 months. Each lane contains samples from a separate animal, with band intensity quantified densitometrically. Opa1 is quantified as percentage of the short form of Opa1 (bands c and e of S-Opa1) to total Opa1 (long and short forms, bands a-e). ns, p>0.05 on unpaired T-tests, adjusted for multiple comparisons. WT in blue, homozygous Mfn2R707W KI in green.
-
Figure 4—figure supplement 3—source data 1
Raw and annotated immunoblots from Figure 4—figure supplement 3.
- https://cdn.elifesciences.org/articles/82283/elife-82283-fig4-figsupp3-data1-v4.zip
Figure 4—figure supplement 4
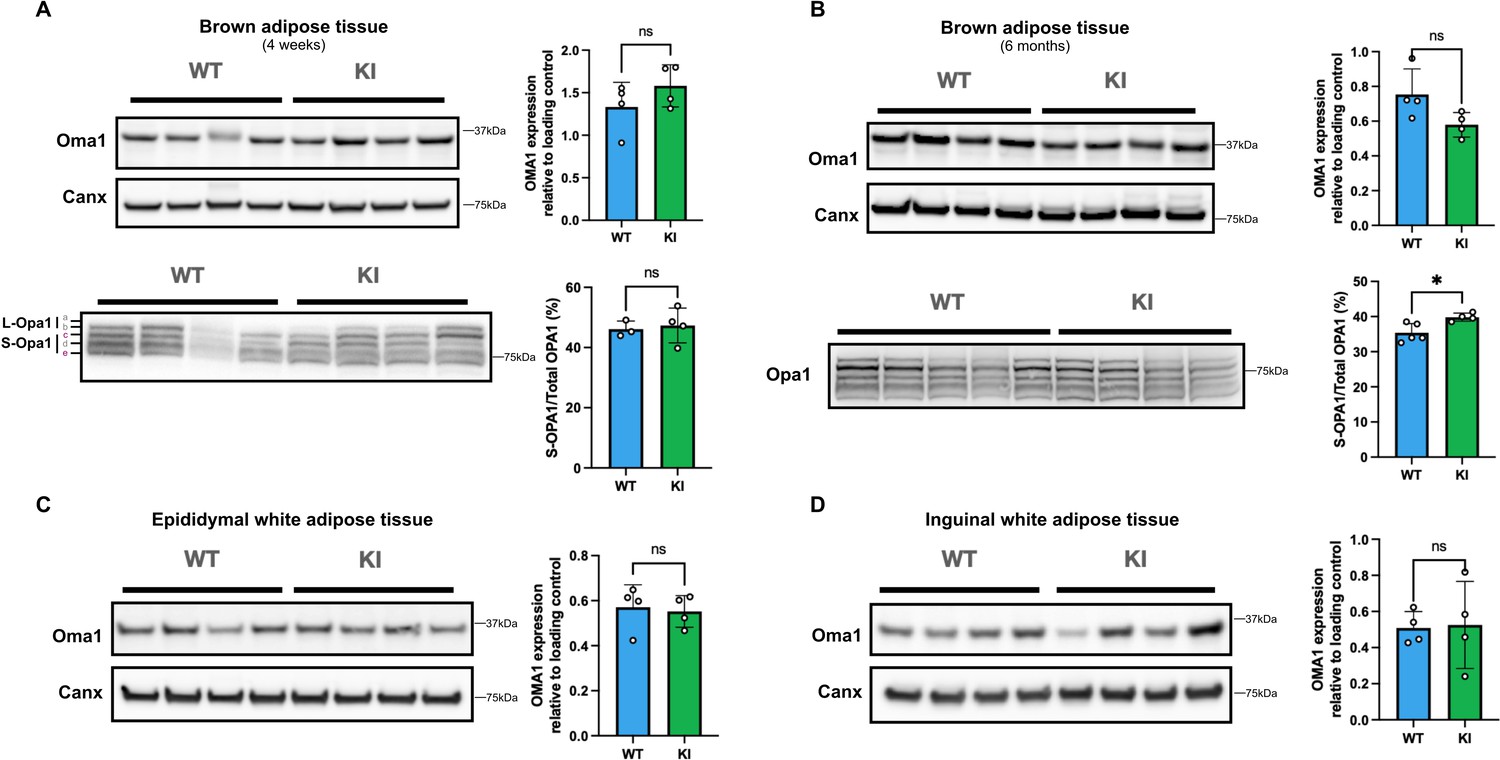
Evidence of modest activation of the Oma1-Opa1 pathway in brown adipose tissue from Mfn2R707W mice.
Western blots of BAT and WAT for Opa1 and Oma1 are shown. Tissues are from male mice fed chow diet. (A) BAT (chow diet for 4 weeks), (B) BAT (chow diet for 6 months), (C) Epididymal WAT (chow diet for 6 months), and inguindal WAT (chow diet for 6 months). Each lane contains samples from a separate animal with band intensity quantified densitometrically. Opa1 is quantified as percentage of the short form of Opa1 (bands c and e of S-Opa1) to total Opa1 (long and short forms, bands a-e). ns, p>0.05 on unpaired T-tests, adjusted for multiple comparisons. WT in blue, homozygous Mfn2R707W KI in green. * p-FDR <0.05.
-
Figure 4—figure supplement 4—source data 1
Raw and annotated immunoblots from Figure 4—figure supplement 4.
- https://cdn.elifesciences.org/articles/82283/elife-82283-fig4-figsupp4-data1-v4.zip
Figure 4—figure supplement 5
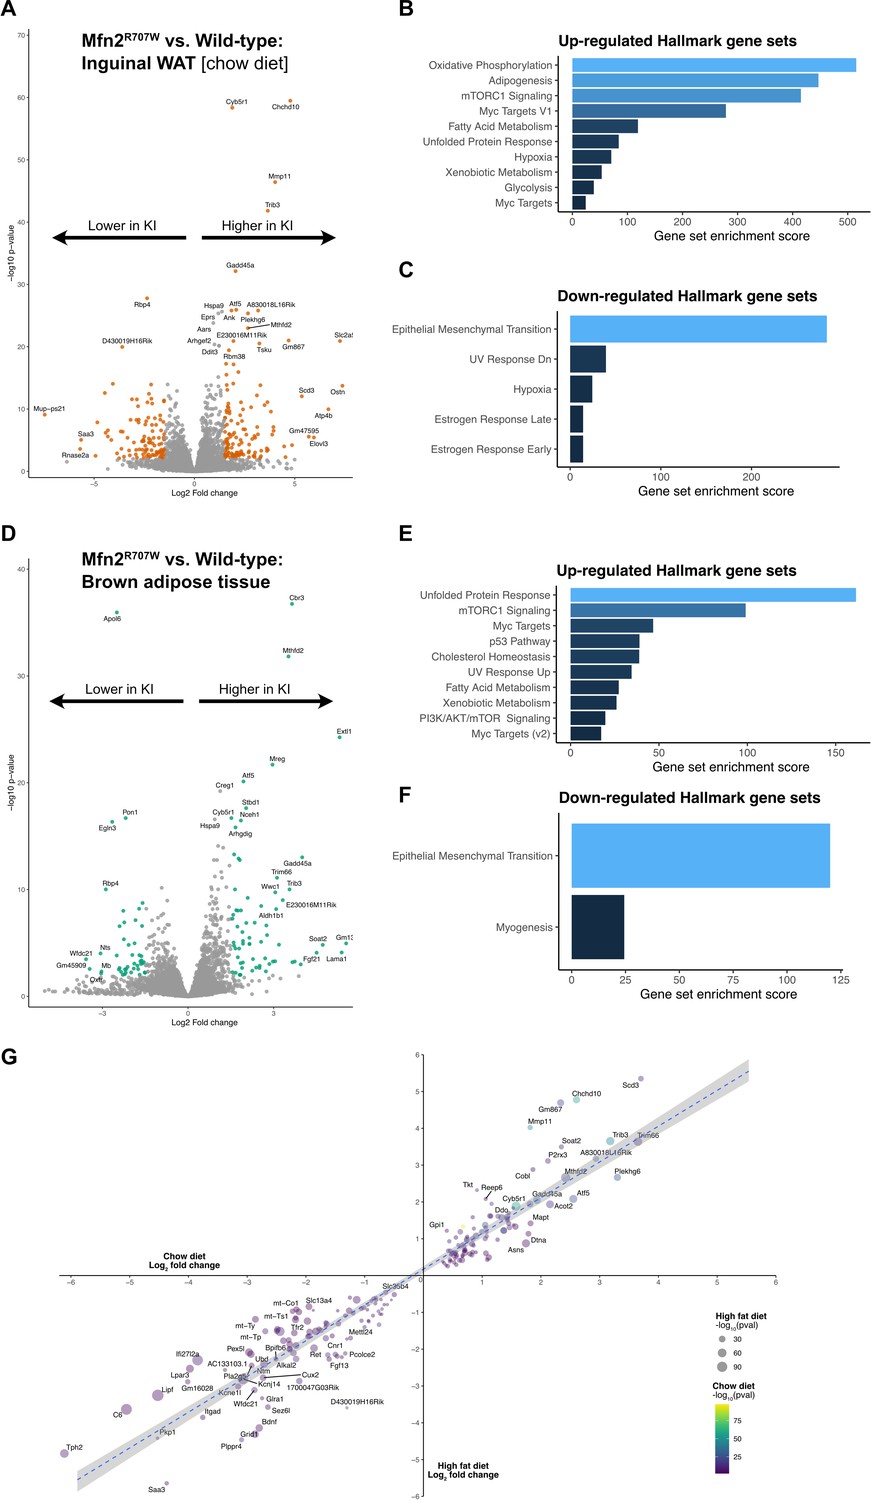
Transcriptional evidence of upregulation of the unfolded protein response and mTorc1 pathways in adipose tissue.
(A) Volcano plot from bulk RNA sequencing (n=7 WT and n=6 KI) of inguinal WAT from mice on chow diet, where significantly differentially expressed genes (Log2 fold change >1.5 and p-FDR <0.001) are highlighted in orange. Pathway analysis using significantly differentially expressed genes for upregulated (B) and downregulated (C) Hallmark gene sets. X-axis depicts a relative gene set enrichment score. (D) Volcano plot from bulk RNA sequencing (n=6 per genotype) of BAT from mice on HFD, where significantly differentially expressed genes (Log2 fold change >1.5 and p-FDR <0.001) are highlighted in green. Pathway analysis using significantly differentially expressed genes for upregulated (E) and downregulated (F) Hallmark gene sets. X-axis depicts a relative gene set enrichment score. All illustrated gene sets are enriched with p-FDR <0.05. (G) Scatter plot of the top 100 up-/down-regulated genes from bulk RNA sequencing from inguinal WAT. For each gene, the fold change observed under HFD is plotted on the x-axis and fold change under chow diet is shown on the y-axis. P-values for each dietary condition are shown using size (HFD) and color (chow diet).
Figure 5 with 2 supplements

Mfn2R707W decreases adipose secretion of leptin and adiponectin.
Fasting serum leptin (A) and adiponectin (B) from mice after 6 months on chow diet or HFD. Asterisks indicate t-tests comparing WT and Mfn2R707W KI with p-values adjusted for multiple testing. (C) Relationship between leptin and body weight for animals fed HFD. Each data point represents one measurement of leptin, with multiple measurements per animal. Shaded area represents the 95% confidence interval. Data are from n=13–14 animals. qPCR of Lep (D) and Adipoq (E) from WAT depots. Each data point represents data from a separate animal. Target gene CT values were normalised against three housekeeping genes (36b4, B2m, and Hprt) and expressed relative to WT for each condition. (F–I) mRNA expression of Atf4, Chop, Lep, and Adipoq in primary adipocytes treated with either DMSO control or Thapsigargin (TG, 150 nM) or Tunicamycin (TN, 5 μg/mL) for 6 hr. Each data point represents an individual well from a separate biological experiment (n=5). Asterisks indicate significance on one-way ANOVA with correction for multiple comparisons. (J) Leptin and (K) Adiponectin secretion from primary adipocytes treated with either DMSO control or Thapsigargin (TG, 150 nM) or Tunicamycin (TN, 5 μg/mL) over 6 hr. Asterisks indicate significance on one-way ANOVA with correction for multiple comparisons. (L) Representative western blots of primary adipocytes treated with either DMSO control or Thapsigargin (TG, 150 nM) or Tunicamycin (TN, 5 μg/mL) for 6 hr. (M) Fasting serum adipsin (complement factor D) from mice after 6 months on chow diet or HFD. Asterisks indicate p-values from pairwise comparisons (T-tests) between indicated groups that are FDR-adjusted for multiple tests (* p-FDR <0.05, ** p-FDR <0.01, *** p-FDR <0.001, **** p-FDR <0.0001).
-
Figure 5—source data 1
Raw and annotated immunoblots from Figure 5L.
- https://cdn.elifesciences.org/articles/82283/elife-82283-fig5-data1-v4.zip
Figure 5—figure supplement 1
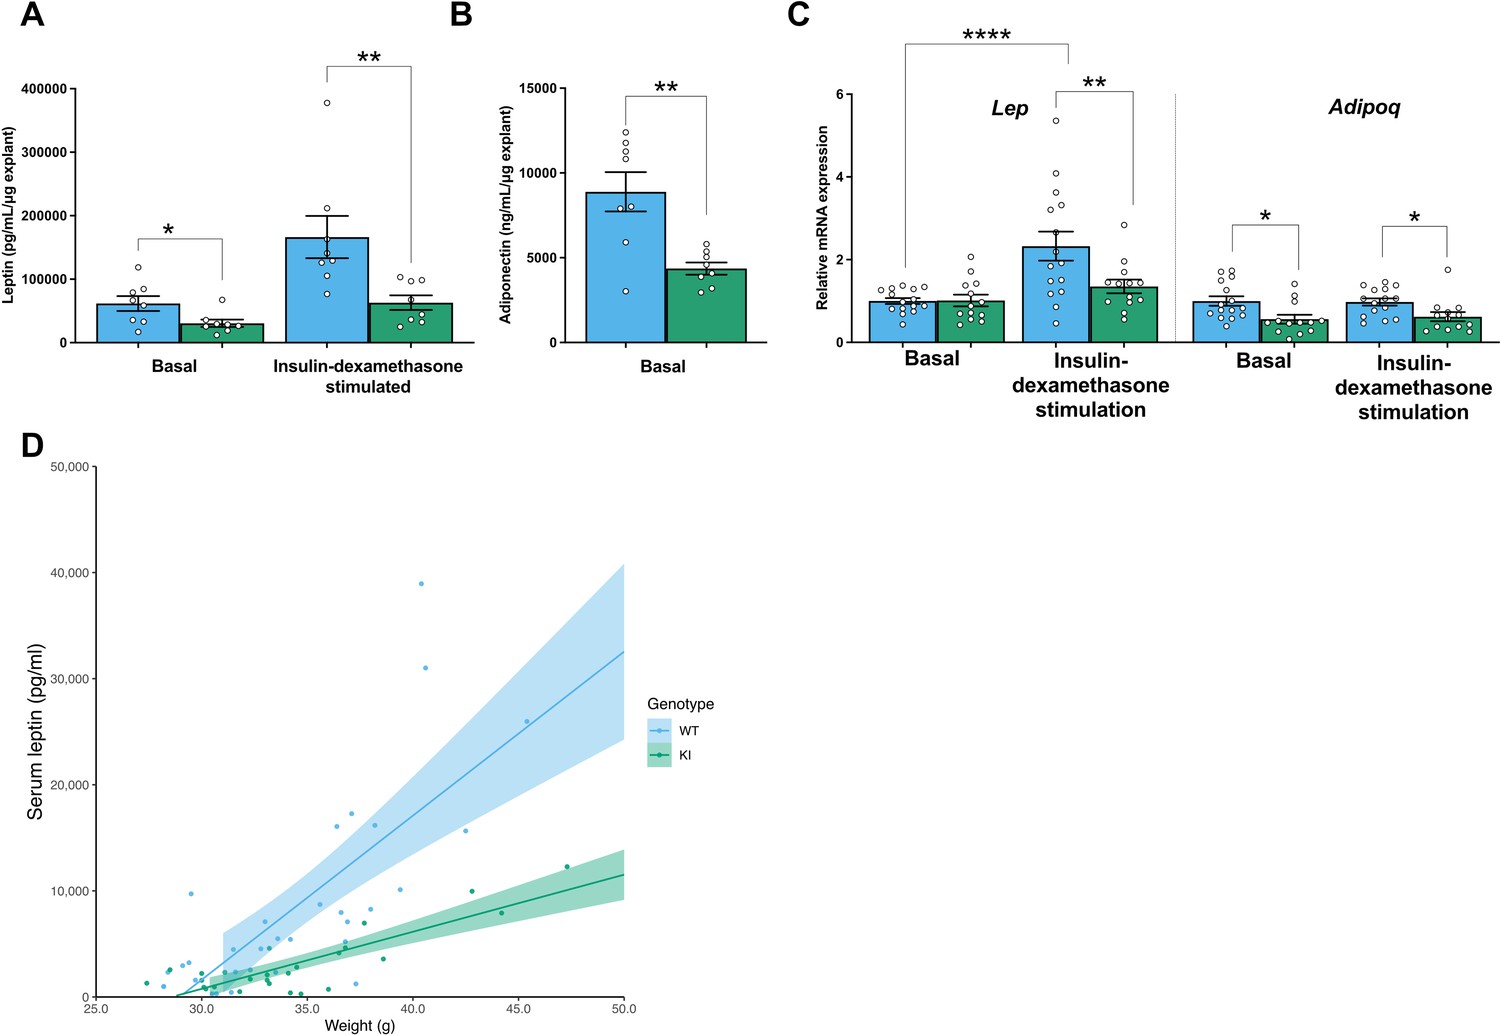
Mfn2R707W decreases adipose leptin and adiponectin secretion from multiple adipose depots and in different dietary conditions.
(A) Leptin secretion from explants of epididymal WAT in basal conditions and after insulin-dexamethasone stimulation. (B) Adiponectin secretion from epididymal WAT explants. (C) qPCR of Lep and Adipoq from epididymal explants from animals fed a HFD, where each data point represents an explant from a separate animal (n=11–13). (D) Relationship between leptin and body weight for animals on chow diet. Each data point represents one measurement of leptin, with multiple measurements per animal. Shaded area represents the 95% confidence interval. Data are from n=8–12 animals. Asterisks indicate p-values from pairwise comparisons (T-tests) between indicated groups that are FDR-adjusted for multiple tests (* p-FDR <0.05, ** p-FDR <0.01, **** p-FDR <0.0001).
Figure 5—figure supplement 2
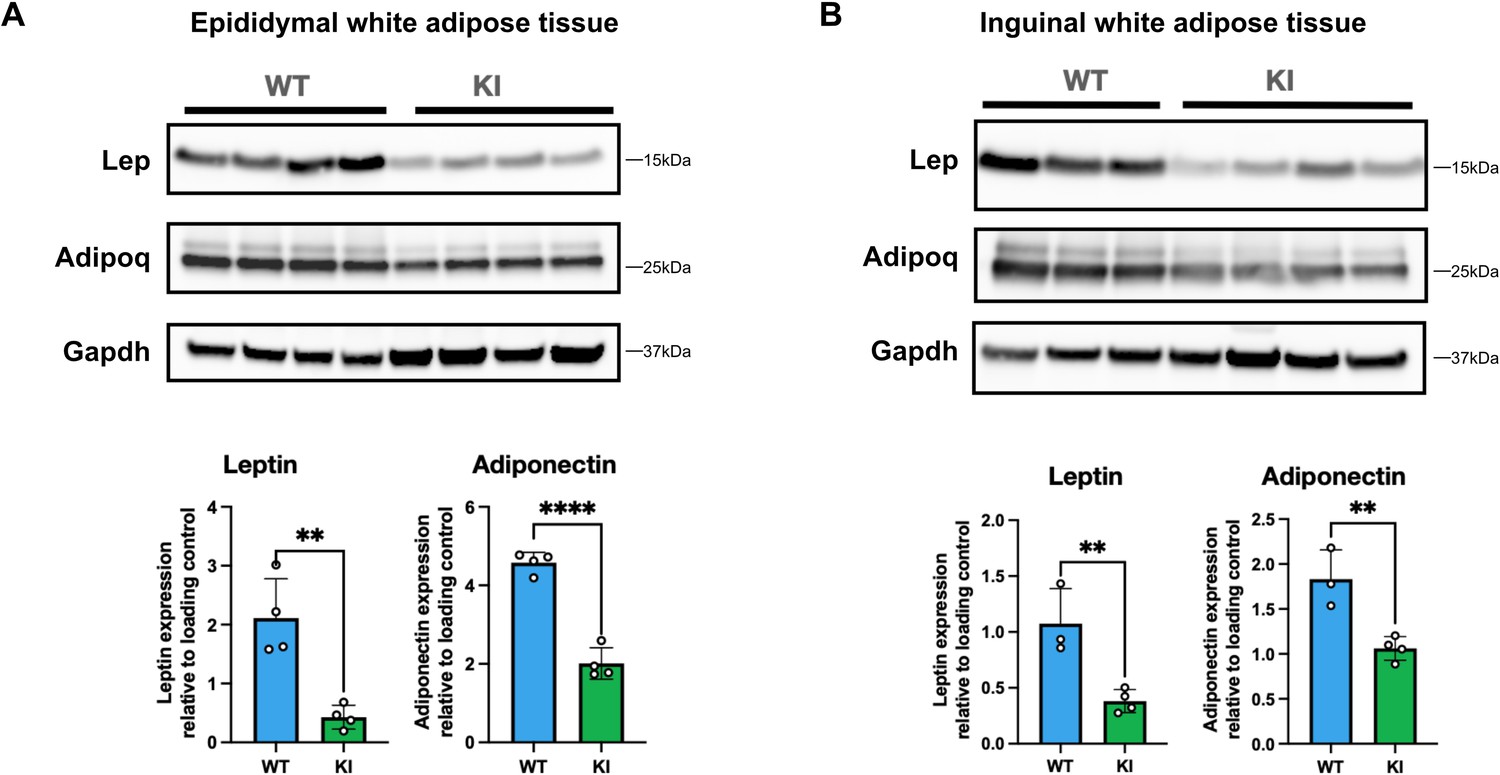
Mfn2R707W decreases leptin and adiponectin protein expression in white adipose tissue.
Western blots showing expression of leptin and adiponectin in male mice fed 45% kcal HFD for 6 months from epididymal (A) and inguinal (B) WAT. Expression is shown from epididymal and inguinal WAT with Gapdh used as a loading control. Each lane contains samples from a separate animal with band intensity quantified densitometrically. Asterisks indicate p-values from pairwise comparisons (T-tests) between WT and Mfn2R707W KI that are FDR-adjusted for multiple tests (** p-FDR <0.01, **** p-FDR <0.0001). WT in blue, homozygous Mfn2R707W KI in green.
Author response image 1

Representative images from transmission electron microscopy on liver and brown adipose tissue from wild-type and Mfn2-R707W knock-in mice.
Endoplasmic reticulum (ER) could be clearly identified and mitochondrial-ER contacts quantified in liver (top), with no difference by genotype. In white and brown adipose tissue there was poor preservation of ER with very infrequent mitochondrial-ER contacts, such that a formal assessment was not possible. Data representative from n=4 (liver) and n=8 (adipose tissue) mice.
Tables
Table 1
Weights and serum biochemistry for mice on chow or high fat diet for 6 months.
Seven-week-old mice were fed chow (n=8–12) or 45% kcal HFD (n=13–14) for 6 months. Blood was taken 4 weekly with 6 hr fasting blood taken on week 24. p-FDR are false-discovery rate adjusted p-values derived from unpaired T-tests. Values in brackets referred to standard error of the mean. ALT, alanine aminotransferase; AST, aspartate aminotransferase; FGF21, fibroblast growth factor 21; Gdf15, Growth and differentiation factor 15; HOMA-IR, Homeostatic Model Assessment for Insulin Resistance; NEFA, non-esterified fatty acids.
| Chow diet | High-fat diet | |||||
|---|---|---|---|---|---|---|
| WT | Knock-in | p-FDR | WT | Knock-in | p-FDR | |
| Weight (g) | 39.9 (1.2) | 40.9 (1.4) | 1 | 48.4 (1.7) | 45.7 (1.5) | 0.51 |
| Lean mass (g) | 19.97 (0.44) | 20.53 (0.53) | 0.85 | 16.50 (0.39) | 15.51 (0.42) | 0.2 |
| Fat mass (g) | 12.41 (0.97) | 12.67 (1.29) | 1 | 22.39 (1.63) | 24.09 (1.10) | 0.79 |
| Leptin (ug/L) 4 weeks 8 weeks 12 weeks 24 weeks (fasting) | 3.6 (0.9) 4.5 (0.8) 7.6 (0.4) 15.4 (3.4) | 1.3 (0.2) 1.6 (0.3) 2.3 (0.5) 6.0 (1.3) | 0.17 0.056 0.045 0.047 | 14.3 (2.6) 20.8 (3.3) 19.3 (4.0) 57.0 (8.9) | 4.8 (0.5) 8.6 (0.9) 11.4 (1.5) 15.6 (1.5) | 0.01 0.007 0.31 0.003 |
| Adiponectin (mg/L) 4 weeks 8 weeks 12 weeks 24 weeks (fasting) | 24.8 (1.0) 20.0 (0.7) 29.0 (1.4) 29.0 (2.3) | 16.4 (2.3) 11.0 (0.7) 14.7 (0.7) 15.4 (2.3) | 0.068 1.50E-05 4.50E-05 0 | 21.0 (0.4) 29.4 (1.4) 33.0 (0.8) 27.9 (0.9) | 11.0 (3.3) 16.0 (0.7) 18.2 (0.9) 15.5 (0.6) | 4.20E-10 5.30E-07 7.20E-09 4.30E-09 |
| Fgf21 (ng/L) 20 weeks 28 weeks | 238 (26) 444 (51) | 292 (22) 638 (96) | 0.50 0.24 | 2,655 (203) 3,355 (911) | 2,475 (268) 2,919 (289) | 1 1 |
| Gdf15 (ng/L) (28 weeks) | 132 (6) | 172 (14) | 0.067 | 250 (36) | 217 (23) | 1 |
| Glucose (mmol/L) | 10.0 (0.5) | 10.4 (0.4) | 1 | 11.7 (0.5) | 11.4 (0.5) | 1 |
| Insulin (µg/L) (33 weeks) | 1.8 (0.3) | 2.0 (0.3) | 1 | 1.7 (0.2) | 1.2 (0.1) | 0.17 |
| HOMA-IR | 141.3 (29.0) | 159.2 (23.3) | 1 | 152.2 (22.9) | 104.8 (12.1) | 0.26 |
| Insulin (µg/L) (GTT baseline) | 1.8 (0.4) | 2.3 (0.7) | 1 | 2.3 (0.4) | 1.4 (0.1) | 0.1 |
| Lactate (mmol/L) | 4.2 (0.3) | 4.4 (0.2) | 1 | 4.5 (0.4) | 4.8 (0.2) | 1 |
| NEFA (µmol/L) | 1,688 (78) | 1,564 (46) | 0.39 | 922 (87) | 1030 (90) | 0.90 |
| TG (mmol/L) | 1.1 (0.1) | 1.0 (0.1) | 1 | 0.8 (0.1) | 0.7 (0.0) | 0.76 |
| Total cholesterol (mmol/L) | 3.0 (0.1) | 3.1 (0.1) | 1 | 6.3 (0.3) | 5.2 (0.2) | 0.042 |
| ALT (IU/L) | 64 (6) | 68 (5) | 1 | 144 (33) | 45 (9) | 0.076 |
| AST (IU/L) | 114 (20) | 118 (16) | 1 | 207 (32) | 162 (22) | 0.65 |
Table 2
Comparison of human MFN2R707W-associated lipodystrophy with phenotype of Mfn2R707W/R7007W mice.
BAT, brown adipose tissue; GTT, glucose tolerance test; HFD, high-fat diet; ISR, integrated stress response; MFN2, mitofusin 2; mRNA, messenger ribose nucleic acid; mtDNA, mitochondrial DNA; PLIN1, perilipin 1; TEM, transmission electron microscope; WAT, white adipose tissue.
| Human | Phenocopy? | Mouse |
|---|---|---|
| Upper body adipose overgrowth | No | No difference in weight of any adipose depots |
| Lower limb lipoatrophy | No | |
| Insulin resistance | No | No difference on GTT or fasting insulin |
| Lower serum leptin concentration | Yes | Seen on chow or HFD; lower secretion seen from adipose explants |
| Severely reduced adipose leptin mRNA expression | Partial | Modest decrease only; only significant in some analyses |
| Lower serum adiponectin concentration | Yes | Seen on chow or HFD; lower secretion seen from adipose explants |
| Severely reduced adipose adiponectin mRNA expression | Yes | Seen on chow or HFD and in adipose explants |
| No change in WAT MFN2 protein expression (only over-grown WAT studied) | Yes | No difference in any tissue studied, though variable in WAT and BAT. |
| No difference in adipocyte size | Yes | True on both chow and HFD |
| Disorganised, fragmented WAT mitochondria on TEM | Partial | More circular mitochondria with trend towards reduced cristae |
| Upregulation of nuclear and down regulation of mitochondrial Oxphos transcriptional pathway | Yes | True in inguinal and epididymal WAT, and BAT |
| Lower Oxphos complex II and III but preserved complex I and IV protein | Partial | Lower complex I and IV protein in WAT |
| Lower WAT mtDNA | Partial | Lower mtDNA in BAT but not WAT |
| Transcriptional activation of ISR | Yes | Seen in inguinal and epididymal WAT, and BAT |
Key resources table
| Reagent type (species) or resource | Designation | Source or reference | Identifiers | Additional information |
|---|---|---|---|---|
| Strain, strain background (Mus musculus, C57BL/6 J) | Mfn2R707W | This paper | See “Generation of the Mfn2R707W/R707W knock-in mouse” | |
| Antibody | Mouse monoclonal anti-Adiponectin | GeneTex | Cat# GTX80683 | WB (1:1000) |
| Antibody | Rabit polyclonal anti-Leptin | Abcam | Cat# ab9749 | WB (1:1000) |
| Antibody | Mouse monoclonal anti-Mfn1 | Abcam | Cat# Ab126575 | WB (1:250) |
| Antibody | Rabbit monoclonal anti-Mfn2 | Cell signalling | Cat# D2D10 | WB (1:1000) |
| Antibody | Rabit polyclonal anti-Mthfd2 | Proteintech | Cat# 12270–1-AP | WB (1:1000) |
| Antibody | Rabit polyclonal anti-Oma1 | Proteintech | Cat# 17116–1-AP | WB (1:1000) |
| Antibody | Mouse monoclonal anti-Opa1 | BD Biosciences | Cat# 612606 | WB (1:1000) |
| Antibody | Mouse monoclonal OXPHOS cocktail | Abcam | Cat# Ab110413 | WB (1:1000) |
| Antibody | Rabbit monoclonal anti-Phos-Eif2a | Epitomics | Cat# 10901 | WB (1:1000) |
Additional files
-
Supplementary file 1
Antibodies used in this study.
- https://cdn.elifesciences.org/articles/82283/elife-82283-supp1-v4.docx
-
Supplementary file 2
Primer sequences used in this study.
Fwd, forward primer; Rv, reverse primer.
- https://cdn.elifesciences.org/articles/82283/elife-82283-supp2-v4.docx
-
MDAR checklist
- https://cdn.elifesciences.org/articles/82283/elife-82283-mdarchecklist1-v4.docx
Download links
A two-part list of links to download the article, or parts of the article, in various formats.
Downloads (link to download the article as PDF)
Open citations (links to open the citations from this article in various online reference manager services)
Cite this article (links to download the citations from this article in formats compatible with various reference manager tools)
A mouse model of human mitofusin-2-related lipodystrophy exhibits adipose-specific mitochondrial stress and reduced leptin secretion
eLife 12:e82283.
https://doi.org/10.7554/eLife.82283


