Environment- and epigenome-wide association study of obesity in ‘Children of 1997’ birth cohort
- School of Public Health, Li Ka Shing Faculty of Medicine, The University of Hong Kong, Hong Kong
- Singapore Institute for Clinical Sciences (SICS), Agency for Science, Technology and Research (A*STAR), Singapore
- Mailman School of Public Health, Columbia University, United States
- City University of New York, School of Public Health and Health policy, United States
Figures
Figure 1 with 1 supplement
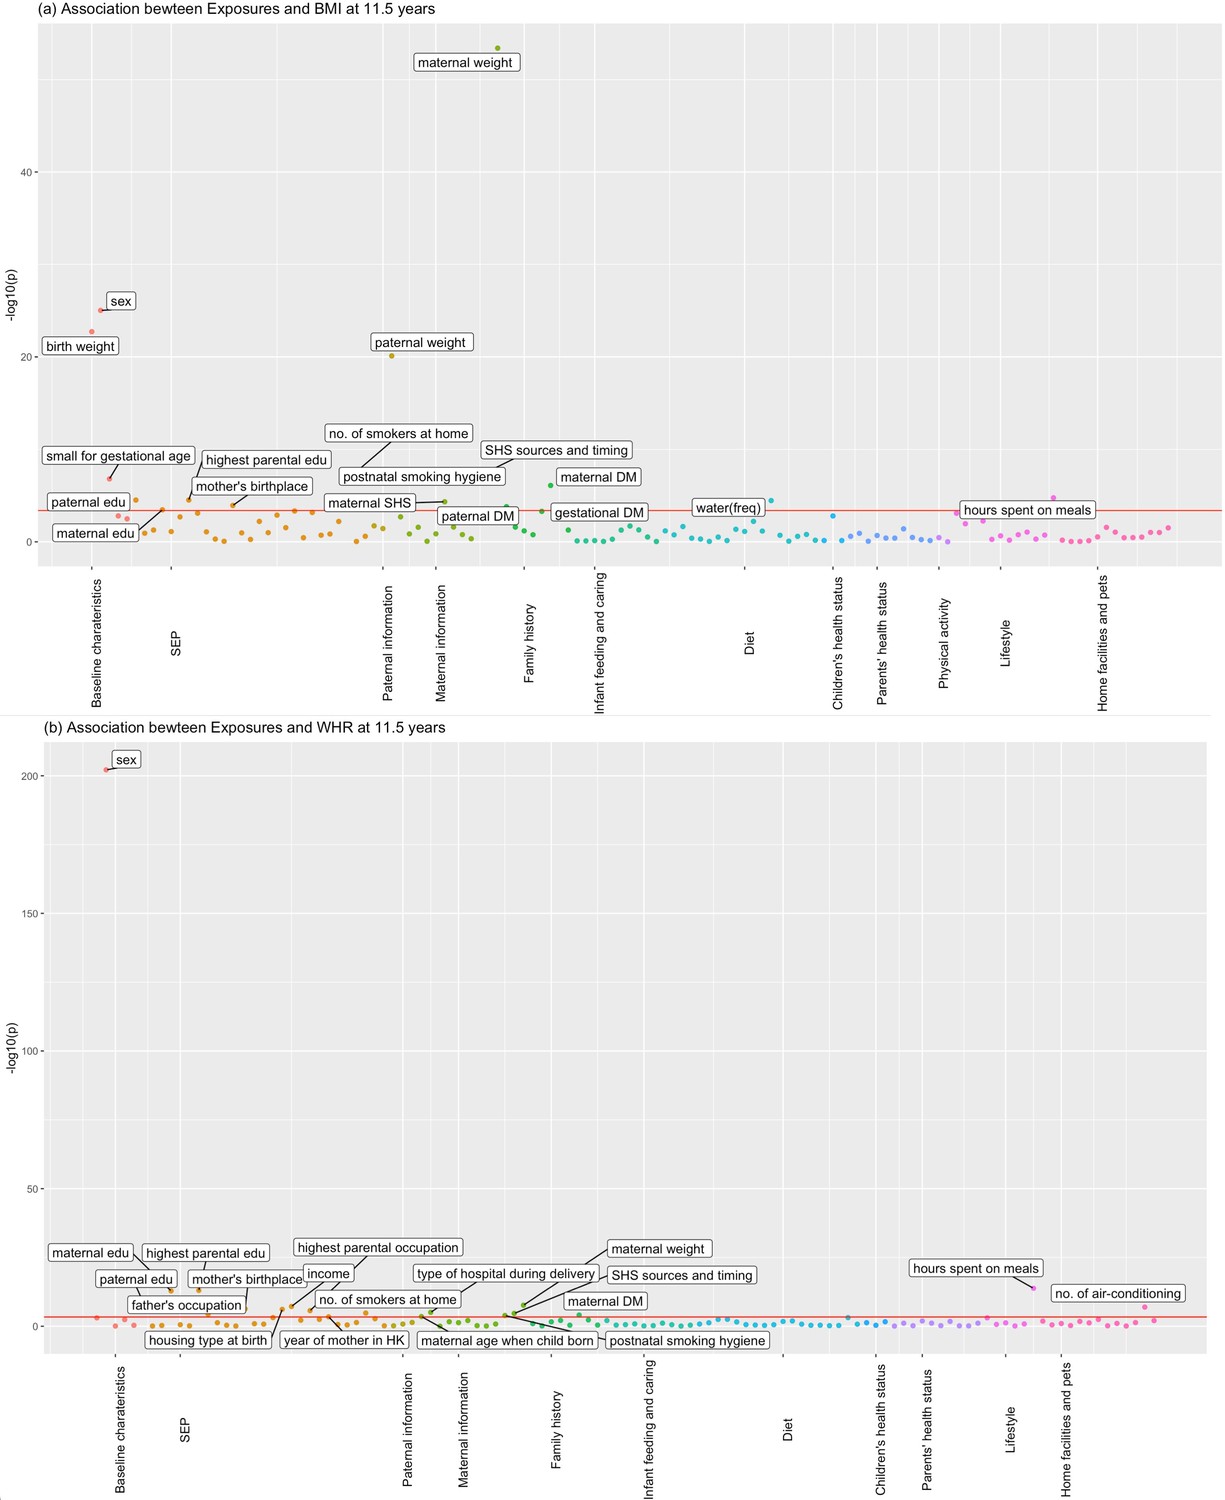
Associations of all exposures with body mass index (BMI) and waist–hip ratio (WHR) at age ~11.5 years in the univariable regression in Hong Kong’s ‘Children of 1997’ birth cohort.
(a) Associations of all exposures with body mass index (BMI) at age ~11.5 years in the univariable regression in Hong Kong’s ‘Children of 1997’ birth cohort. (b) Associations of all exposures with waist–hip ratio (WHR) at age ~11.5 years in the univariable regression in Hong Kong’s ‘Children of 1997’ birth cohort. DM, diabetes; edu, education; ASB, artificially sweetened beverages; PA, physical activity; SHS, second-hand smoking; freq, frequency. In total, we included 123 exposures for BMI at 11.5 years and 115 exposures for WHR at 11.5 years. The cut-off lines indicate Bonferroni-corrected p thresholds (p < 0.05/123 = 4.07 × 10⁻⁴ for BMI, p < 0.05/115 = 4.35 × 10⁻⁴ for WHR).
-
Figure 1—source data 1
The associations for depicting Figure 1a in the study.
- https://cdn.elifesciences.org/articles/82377/elife-82377-fig1-data1-v1.csv
-
Figure 1—source data 2
The associations for depicting Figure 1b in the study.
- https://cdn.elifesciences.org/articles/82377/elife-82377-fig1-data2-v1.csv
Figure 1—figure supplement 1
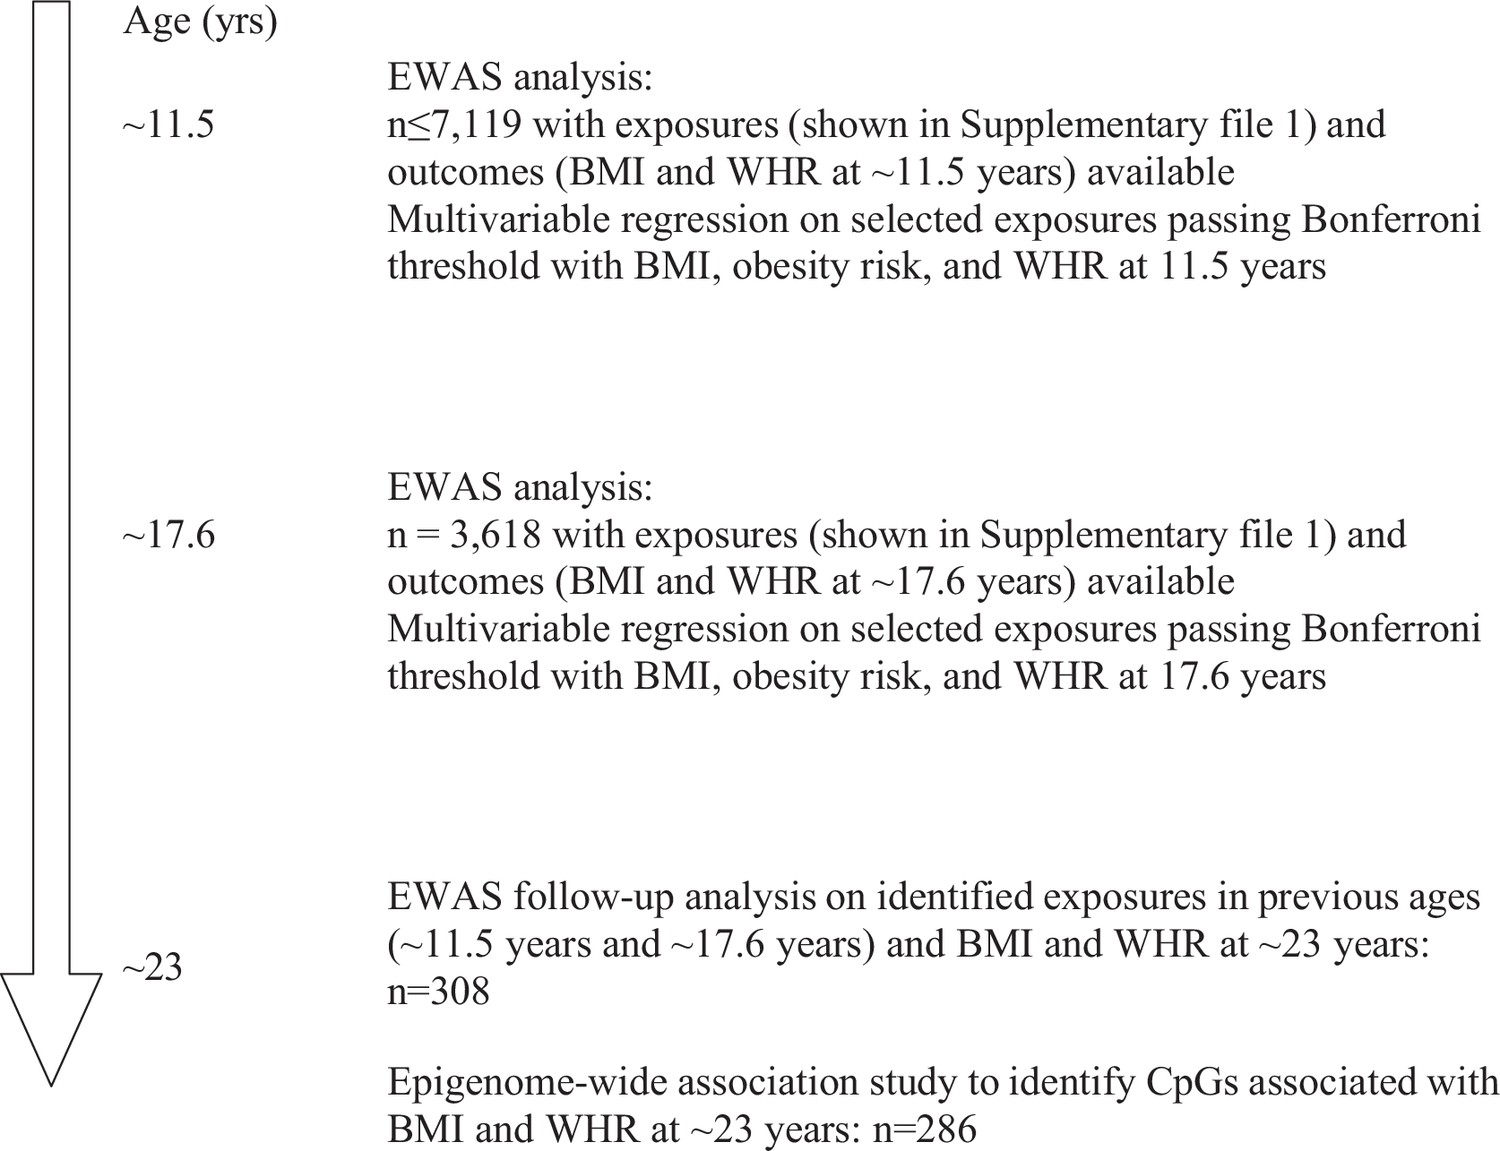
Number of participants in the environment-wide (EWAS) and epigenome-wide association study of adiposity in ’Children of 1997’ birth cohort.
Figure 2
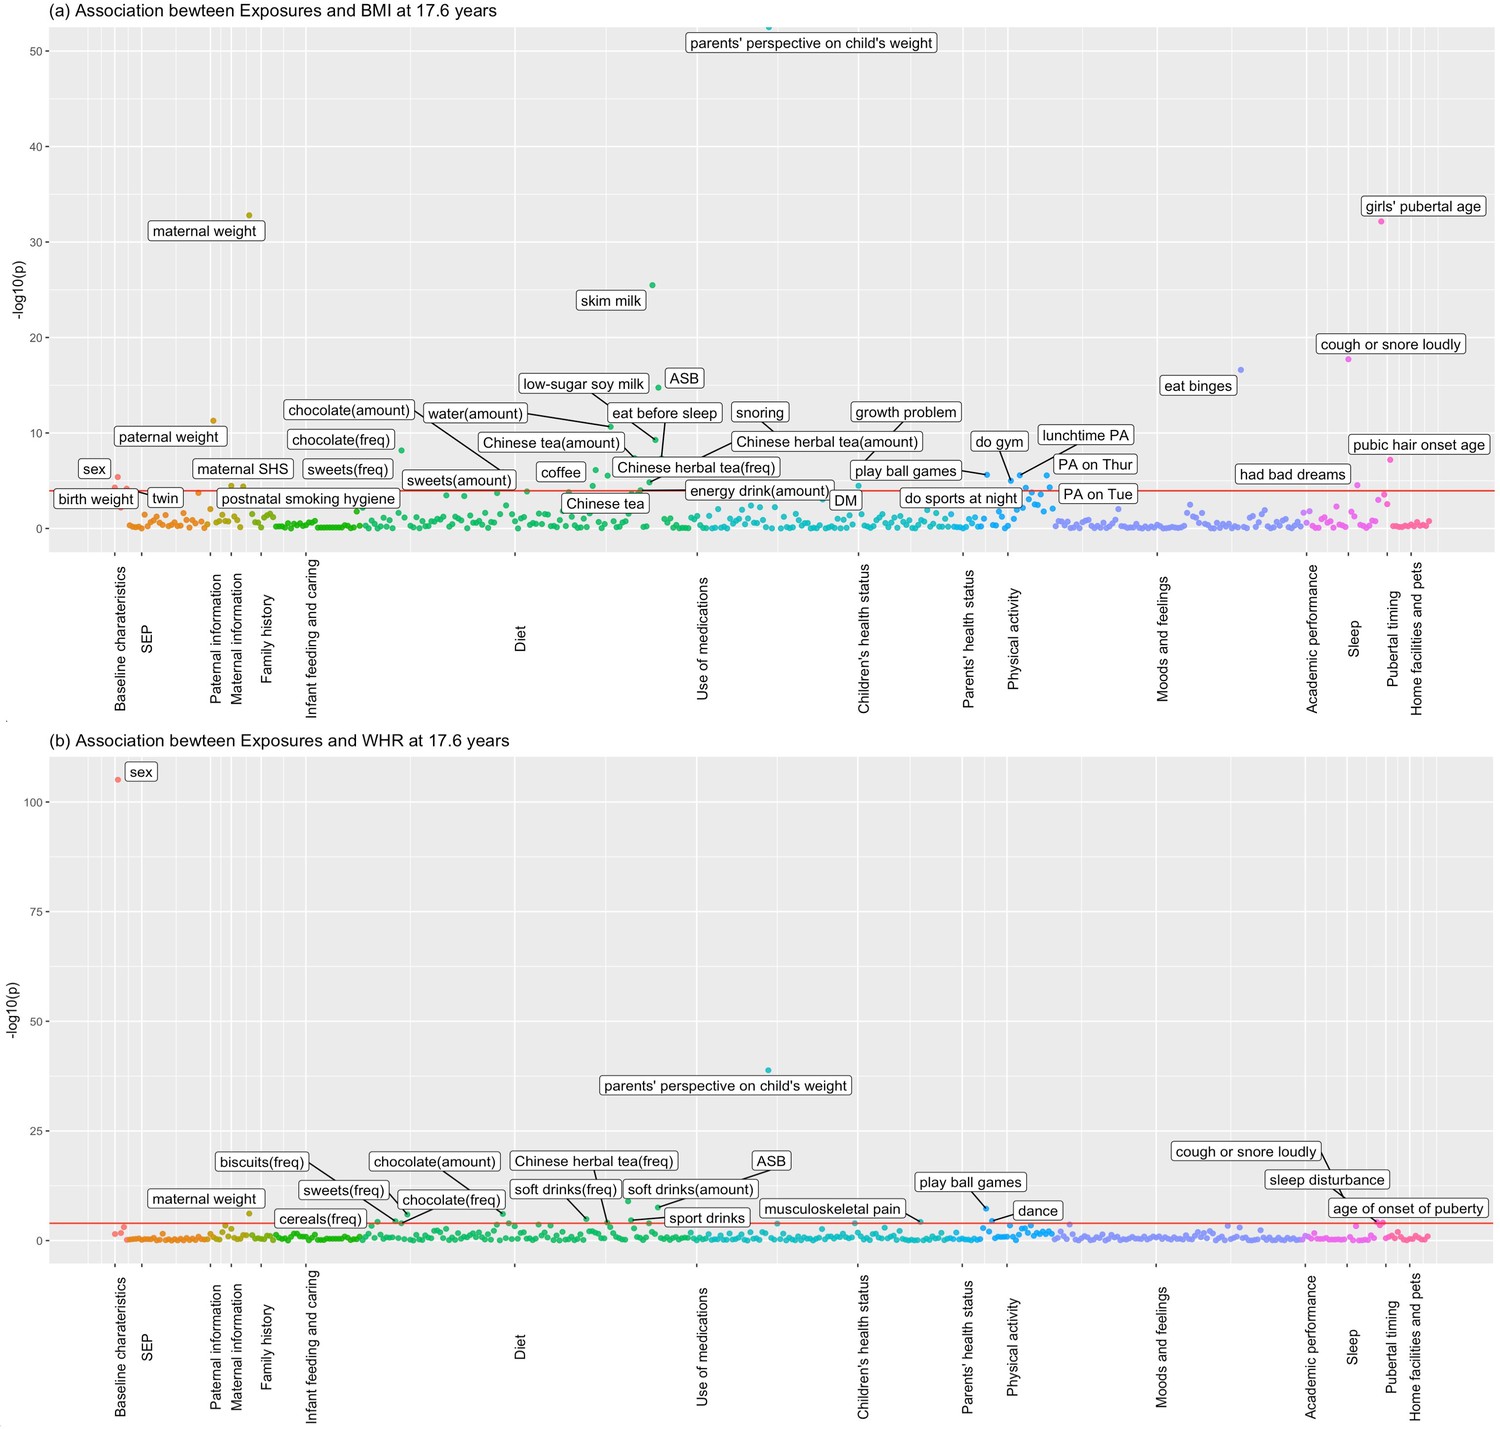
Associations of all exposures with body mass index (BMI) and waist–hip ratio (WHR) at age ~17.6 years in the univariable regression in 3618 participants of Hong Kong’s ‘Children of 1997’ birth cohort in the Biobank Clinical follow-up.
(a) Associations of all exposures with body mass index (BMI) at age ~17.6 years in the univariable regression in 3618 participants of Hong Kong’s ‘Children of 1997’ birth cohort in the Biobank Clinical follow-up. (b) Associations of all exposures with waist–hip ratio (WHR) at age ~17.6 years in the univariable regression in 3618 participants of Hong Kong’s ‘Children of 1997’ birth cohort in the Biobank Clinical follow-up. DM, diabetes; ASB, artificially sweetened beverages; PA, physical activity; SHS, second-hand smoking; freq, frequency. The cut-off lines indicate Bonferroni-corrected p thresholds (p < 0.05/441 exposures = 1.2 × 10⁻⁴ for BMI and WHR).
-
Figure 2—source data 1
The associations for depicting Figure 2a in the study.
- https://cdn.elifesciences.org/articles/82377/elife-82377-fig2-data1-v1.csv
-
Figure 2—source data 2
The associations for depicting Figure 2b in the study.
- https://cdn.elifesciences.org/articles/82377/elife-82377-fig2-data2-v1.csv
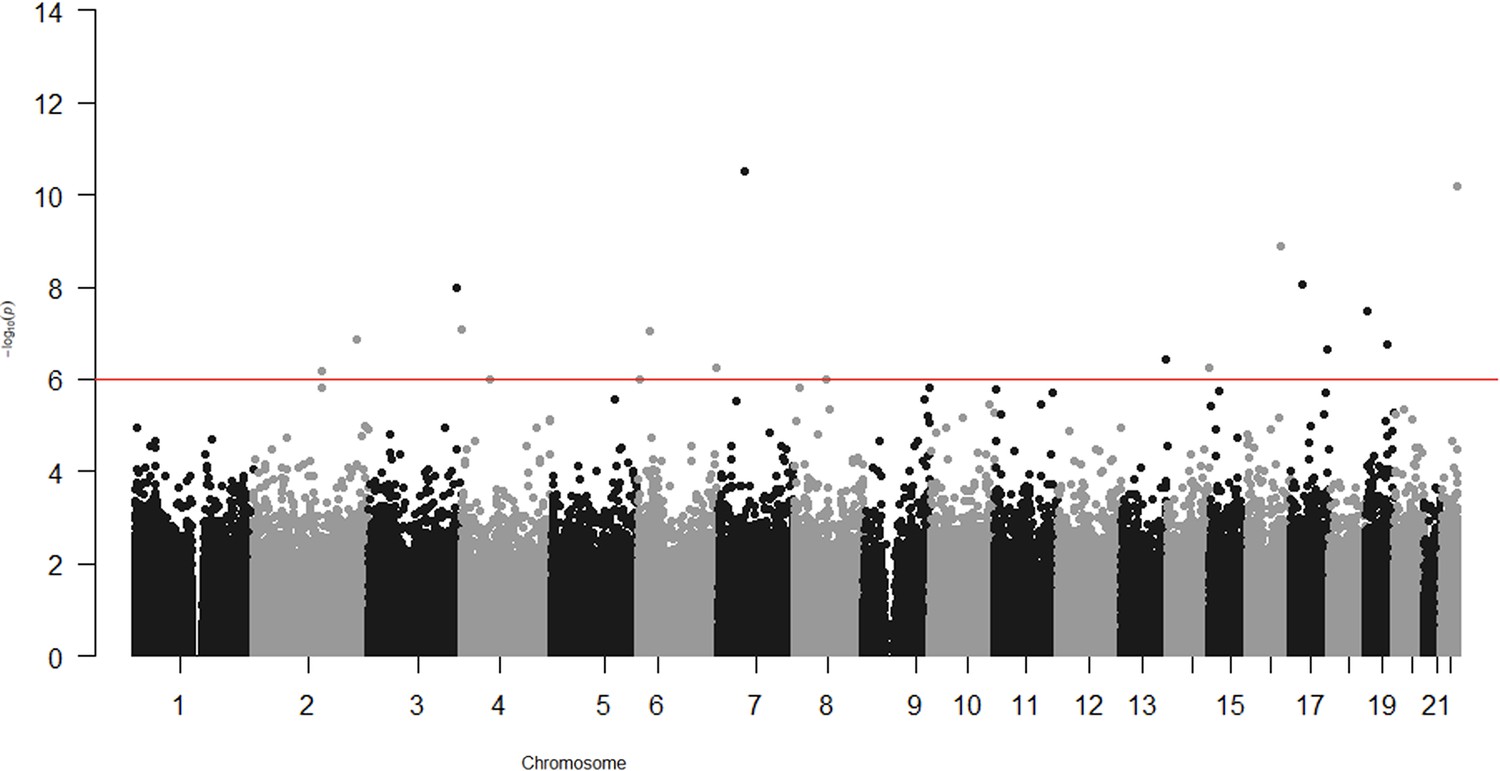
Figure 3
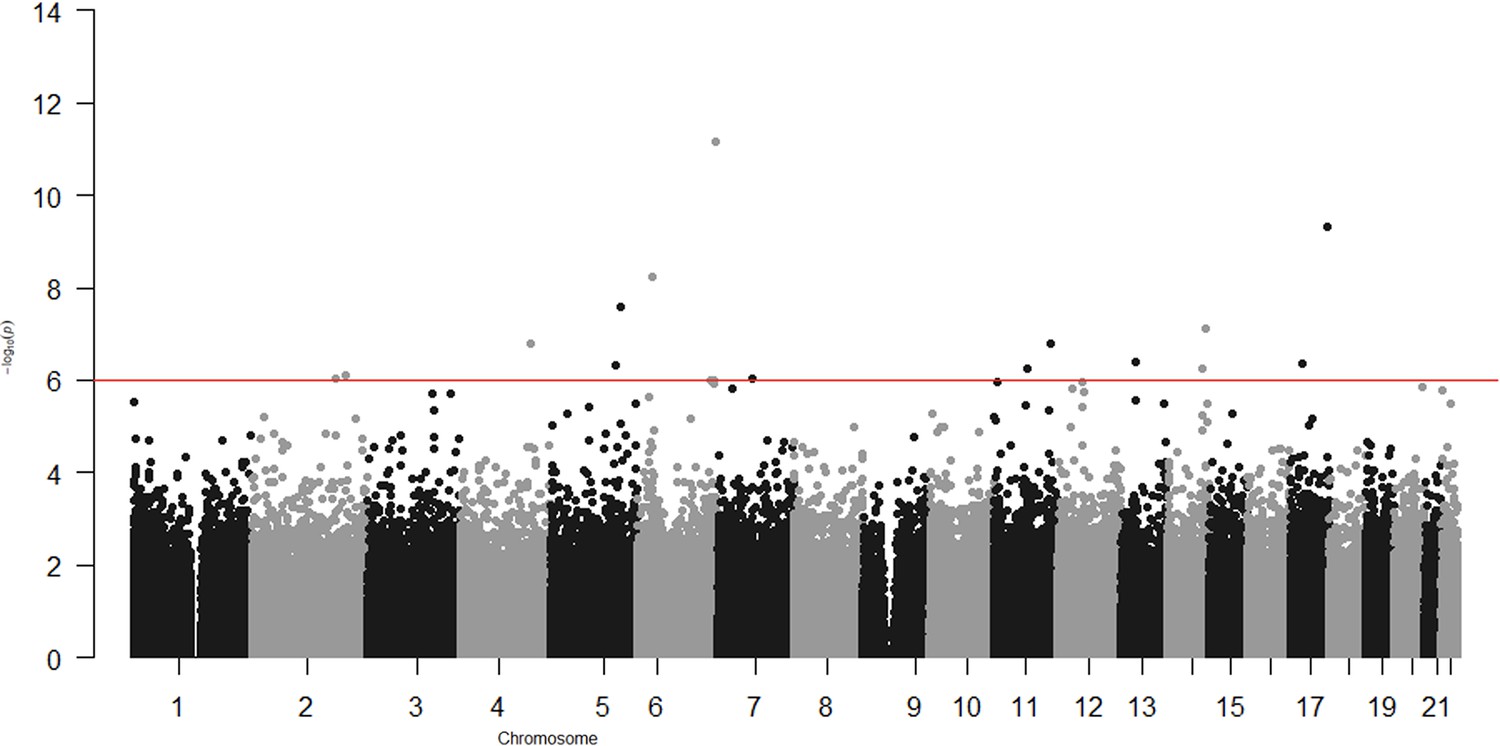
Epigenome-wide association with body mass index (BMI) at age ~23 years in 286 participants from Hong Kong’s ‘Children of 1997’ birth cohort in the follow-up survey.
-
Figure 3—source data 1
The associations for depicting Figure 3 in the study.
- https://cdn.elifesciences.org/articles/82377/elife-82377-fig3-data1-v1.csv
Figure 4
Epigenome-wide association with waist–hip ratio (WHR) at age ~23 years in 286 participants from Hong Kong’s ‘Children of 1997’ birth cohort in the follow-up survey.
Source code file: source code for the environment- and epigenome-wide association study analyses.
-
Figure 4—source data 1
The associations for depicting Figure 4 in the study.
- https://cdn.elifesciences.org/articles/82377/elife-82377-fig4-data1-v1.csv
Tables
Table 1
Baseline characteristics of Hong Kong’s ‘Children of 1997’ birth cohort included in the environment-wide association study (EWAS) of obesity at 11.5, 17.6, and 23 years.
| Characteristics | At ~11.5 years(n ≤ 7119) | At ~17.6 years(n = 3618) | At ~23 years(n = 308) | |
|---|---|---|---|---|
| Socio-demographics | ||||
| Sex | Boys | 3732 | 1825 | 123 |
| Girls | 3387 | 1793 | 185 | |
| Maternal birthplace | Not Hong Kong (migrant) | 2707 | 1509 | 128 |
| Hong Kong | 4185 | 2089 | 179 | |
| Highest maternal education | Grade 9 or below | 2873 | 1421 | 124 |
| Grade 10–11 | 3060 | 1575 | 127 | |
| Grade 12 or above | 1064 | 600 | 57 | |
| Household income per head in quintiles at recruitment | 1st quintile (HK$ 1746 ± 419) | 1260 | 599 | 45 |
| 2nd quintile (HK$ 2853 ± 325) | 1288 | 647 | 49 | |
| 3rd quintile (HK$ 4365 ± 557) | 1269 | 646 | 58 | |
| 4th quintile (HK$ 6826 ± 883) | 1243 | 654 | 65 | |
| 5th quintile (HK$ 14,945 ± 15,620) | 1240 | 674 | 67 | |
| Maternal age at delivery (mean [SD]) | 30.2 (4.7) | 30.5 (4.6) | 30.8 (4.4) | |
| Anthropometrics | ||||
| Mean height in cm (SD) | Boys | 166.4 (7.5) | 171.8 (6.0) | 173.1 (6.3) |
| Girls | 158.3 (5.9) | 159.5 (5.4) | 160.6 (5.2) | |
| Mean weight in kg (SD) | Boys | 54.6 (11.3) | 62.7 (11.8) | 67.3 (15.0) |
| Girls | 48.5 (8.0) | 52.6 (8.9) | 56.0 (30.5) | |
| Mean BMI (SD) | Boys | 19.2 (3.7) | 21.1 (3.7) | 22.4 (4.8) |
| Girls | 18.3 (3.1) | 20.6 (3.3) | 21.7 (11.5) | |
| Mean WHR (SD) | Boys | 0.84 (0.07) | 0.79 (0.07) | 0.87 (0.07) |
| Girls | 0.79 (0.06) | 0.75 (0.05) | 0.78 (0.07) |
Table 2
Associations of selected exposures with body mass index (BMI) and obesity risk at ~11.5 years, and associations of those exposures with BMI at ~17.6 years and with BMI at ~23 years in participants of Hong Kong’s ‘Children of 1997’ birth cohort.
| Group names | Variable description | With BMI at ~11.5 years* | With obesity risk at ~11.5 years* | With BMI at ~17.6 years† | With BMI at ~23 years† | |||
|---|---|---|---|---|---|---|---|---|
| Beta | p value | OR (95% CI) | Beta | p value | Beta | p value | ||
| Baseline characteristics | Sex | 0.85 | 5.65E−22 | 2.06 (1.82, 2.32) | 0.23 | 1.99E−03 | 0.25 | 8.44E−01 |
| Baseline characteristics | Birth weight | 0.40 | 5.40E−15 | 1.23 (1.15, 1.32) | 0.56 | 7.84E−06 | 0.61 | 3.78E−01 |
| Baseline characteristics | Small for gestational age: birth weight <10% by sex and gestational week distribution in singletons | −0.68 | 9.93E−06 | 0.71 (0.56, 0.89) | −0.42 | 5.65E−02 | −0.97 | 6.46E−01 |
| SEP | No. of smokers at home | 0.15 | 2.83E−02 | 1.15 (1.06, 1.25) | 0.20 | 4.26E−02 | 1.07 | 3.06E−01 |
| Paternal information | Paternal weight | 0.05 | 1.58E−18 | 1.03 (1.02, 1.04) | 0.04 | 1.73E−09 | 0.04 | 5.68E−01 |
| Maternal information | Maternal weight | 0.09 | 1.84E−49 | 1.06 (1.05, 1.07) | 0.09 | 1.30E−28 | 0.18 | 5.23E−02 |
| Maternal information | Postnatal smoking hygiene (i.e. second-hand smoking by timing [pre- and/or postnatal]) | 0.10 | 7.79E−05 | 1.06 (1.02, 1.10) | 0.14 | 2.51E−04 | 0.36 | 3.67E−01 |
| Maternal information | Second-hand smoke by sources and timing | 0.08 | 2.69E−05 | 1.05 (1.02, 1.08) | 0.10 | 3.31E−04 | 0.23 | 4.54E−01 |
| Maternal information | Mother exposed to second-hand smoke during pregnancy | 0.15 | 4.07E−03 | 1.08 (1.01, 1.16) | 0.23 | 9.70E−05 | 0.32 | 5.85E−01 |
| Family history | Paternal diabetes | 0.69 | 5.82E−03 | 1.31 (0.93, 1.86) | 0.31 | 2.10E−01 | 8.74 | 2.08E−04 |
| Family history | Maternal diabetes | 1.45 | 2.47E−05 | 2.21 (1.42, 3.44) | 0.36 | 2.23E−01 | −0.89 | 7.67E−01 |
| Family history | Gestational diabetes | 0.68 | 2.28E−04 | 1.51 (1.18, 1.93) | 0.57 | 1.84E−01 | −0.83 | 9.37E−01 |
| Diet | Water: frequency of consumption in the last week | 0.32 | 9.45E−06 | 1.20 (1.06, 1.36) | 0.37 | 1.89E−04 | 1.27 | 2.38E−01 |
| Lifestyle | Having meals: hours spent yesterday | −0.40 | 2.06E−03 | 0.80 (0.65, 0.99) | −0.42 | 1.65E−02 | 1.71 | 3.59E−01 |
-
*
Association of selected exposures with BMI and obesity risk at age ~11.5 years in up to 7119 participants after controlling for confounders.
-
†
Association of selected exposures for BMI at age ~11.5 years with BMI at age ~17.6 years (n = 3618) and ~23 years (n = 308) after controlling for confounders.
Table 3
Associations of selected exposures with waist–hip ratio (WHR) at ~11.5 years, and associations of those exposures with WHR at ~17.6 years and with WHR at ~23 years in participants of Hong Kong’s ‘Children of 1997’ birth cohort.
| Group names | Variable description | With WHR at ~11.5 years* | With WHR at ~17.6 years† | With WHR at ~23 years† | |||
|---|---|---|---|---|---|---|---|
| Beta | p value | Beta | p value | Beta | p value | ||
| Baseline characteristics | Sex | 0.05 | 6.58E−171 | 0.04 | 1.28E−88 | 0.082 | 4.30E−18 |
| SEP | Housing type at birth (home ownership) | −0.01 | 2.70E−02 | −0.001 | 8.51E−01 | −0.01 | 4.20E−01 |
| SEP | Maternal education level | −0.01 | 4.90E−05 | −0.004 | 2.03E−01 | −0.001 | 9.02E−01 |
| SEP | Mother’s birthplace | −0.01 | 1.18E−01 | −0.01 | 2.76E−01 | −0.006 | 7.97E−01 |
| Maternal information | Maternal weight | 0.00 | 7.98E−10 | 0.001 | 1.13E−06 | 0.001 | 6.58E−02 |
| Family history | Maternal diabetes | 0.03 | 2.30E−05 | 0.01 | 1.27E−01 | −0.017 | 7.82E−01 |
| Lifestyle | Having meals: hours spent yesterday | −0.01 | 8.15E−09 | −4.73E−03 | 1.30E−01 | −0.002 | 8.11E−01 |
-
*
Association of selected exposures with WHR at age ~11.5 years in up to 7119 participants after controlling for confounders.
-
†
Association of selected exposures for WHR at age ~11.5 years with BMI at age ~17.6 years (n = 3618) and ~23 years (n = 308) after controlling for confounders.
Table 4
Associations of selected exposures with body mass index (BMI) and obesity risk at ~17.6 years, and associations of those exposures with BMI at ~23 years in participants from Hong Kong’s ‘Children of 1997’ birth cohort.
| Group names | Variable description | With BMI at ~17.6 years* | With obesity risk at ~17.6 years* | With BMI at ~23 years† | ||
|---|---|---|---|---|---|---|
| Beta | p value | OR (95% CI) | Beta | p value | ||
| Baseline characteristics | Sex | 0.56 | 7.84E−06 | 1.72 (1.38, 2.14) | 0.25 | 8.44E−01 |
| Baseline characteristics | Birth weight | 0.23 | 1.99E−03 | 1.1 (0.97, 1.25) | 0.61 | 3.78E−01 |
| Baseline characteristics | Twin | −1.77 | 1.05E−03 | 0.17 (0.02, 1.27) | −3.73 | 5.28E−01 |
| Paternal information | Paternal weight | 0.04 | 1.73E−09 | 1.03 (1.02, 1.04) | 0.04 | 5.68E−01 |
| Maternal information | Maternal weight | 0.09 | 1.30E−28 | 1.05 (1.03, 1.06) | 0.18 | 5.23E−02 |
| Maternal information | Mother exposed to second-hand smoke during pregnancy | 0.23 | 9.70E−05 | 1.12 (0.99, 1.27) | 0.02 | 9.78E−01 |
| Maternal information | Postnatal smoking hygiene (i.e. second-hand smoking by timing [pre- and/or postnatal]) | 0.09 | 6.88E−02 | 1.72 (1.38, 2.14) | 0.78 | 1.57E−01 |
| Diet | Chocolate: frequency of consumption in the past week | −0.34 | 9.02E−06 | 0.73 (0.63, 0.84) | 0.29 | 6.92E−01 |
| Diet | Chocolate: no. of servings/time | −0.19 | 1.09E−04 | 0.83 (0.73, 0.95) | 0.08 | 8.69E−01 |
| Diet | Sweets: frequency of consumption in the past week | −0.25 | 4.18E−04 | 0.83 (0.73, 0.95) | −0.14 | 8.25E−01 |
| Diet | Sweets: no. of servings/time | −0.17 | 5.42E−05 | 0.85 (0.77, 0.94) | −0.17 | 6.85E−01 |
| Diet | Chinese tea: frequency of consumption in the past week | 0.27 | 1.69E−05 | 1.25 (1.13, 1.38) | 0.29 | 6.30E−01 |
| Diet | Chinese tea: no. of cup/time | 0.17 | 2.08E−07 | 1.14 (1.08, 1.2) | 0.18 | 5.74E−01 |
| Diet | Chinese herbal tea: frequency of consumption in the past week | 0.32 | 3.16E−04 | 1.18 (1.02, 1.36) | 1.11 | 1.82E−01 |
| Diet | Chinese herbal tea: no. of cup/time | 0.12 | 9.17E−04 | 1.13 (1.05, 1.22) | 0.26 | 5.01E−01 |
| Diet | Coffee: frequency of consumption in the past week | 0.30 | 2.90E−05 | 1.17 (1.04, 1.32) | 0.38 | 6.05E−01 |
| Diet | Water: no. of cup/time | 0.25 | 1.07E−09 | 1.13 (1.05, 1.22) | 0.51 | 1.97E−01 |
| Diet | Energy drinks: no. of cup/time | 0.14 | 1.21E−04 | 1.13 (0.99, 1.3) | 0.66 | 4.84E−01 |
| Diet | When consume milk, how often reduced-fat/skim milk | 0.60 | 2.56E−24 | 0.7 (0.63, 0.77) | 1.64 | 5.35E−03 |
| Diet | When consume soy milk/flavored drinks, how often lower sugar | 0.48 | 5.14E−11 | 0.73 (0.64, 0.82) | 0.78 | 2.55E−01 |
| Diet | When consume soft drinks, how often diet/artificially sweetened drinks | 0.50 | 1.75E−10 | 0.7 (0.62, 0.8) | 0.62 | 3.61E−01 |
| Diet | Eating: 1 hr before sleeping | −0.76 | 2.85E−06 | 0.65 (0.47, 0.9) | −1.04 | 5.04E−01 |
| Children’s Health | Parents’ questionnaire: do you consider your child now to be: very thin/underweight; a little bit thin/underweight; about the right weight; a little bit fat/overweight; very fat/overweight; don’t know | 2.51 | 0.00E+00 | 7.45 (6.09, 9.12) | 2.13 | 4.12E−04 |
| Children’s Health | Snoring in the past 4 weeks (child) | 0.76 | 9.72E−08 | 0.51 (0.4, 0.65) | 1.30 | 3.18E−01 |
| Children’s Health | Growth problem (child) | 0.36 | 7.41E−08 | 1.5 (1.37, 1.64) | −0.02 | 9.76E−01 |
| Children’s Health | Diabetes (child) | 0.32 | 4.62E−04 | 1.29 (1.15, 1.45) | 0.01 | 9.94E−01 |
| Physical activity | Ball games: no. of times you done past week | 0.22 | 4.04E−03 | 1.03 (0.92, 1.17) | 1.29 | 9.89E−02 |
| Physical activity | Gymnasium: no. of times you done past week | 0.44 | 3.10E−05 | 1.14 (0.97, 1.34) | 0.25 | 8.18E−01 |
| Physical activity | What did you normally do at lunch in the past 7 days | 0.34 | 5.50E−05 | 1.22 (1.06, 1.39) | −0.22 | 8.12E−01 |
| Physical activity | How many nights did you do sports in the past 7 days | 0.16 | 1.13E−02 | 0.98 (0.88, 1.08) | 0.65 | 3.43E−01 |
| Physical activity | Tuesday: how often you did physical activity | 0.18 | 2.15E−03 | 1.01 (0.92, 1.11) | −0.04 | 9.48E−01 |
| Physical activity | Thursday: how often you did physical activity | 0.21 | 2.86E−04 | 1.08 (0.98, 1.2) | 1.50 | 9.65E−03 |
| Moods and feelings | Has he/she gone on eating binges | 3.22 | 5.23E−15 | 5.19 (3.18, 8.46) | 3.37 | 3.06E−01 |
| Sleep | Cough or snore loudly | 0.67 | 1.62E−13 | 1.43 (1.25, 1.63) | 1.15 | 2.15E−01 |
| Sleep | Have bad dreams | −0.27 | 1.87E−03 | 0.77 (0.64, 0.91) | −0.99 | 2.31E−01 |
| Pubertal timing | Age of onset of pubic hair | −0.56 | 2.41E−10 | 0.78 (0.67, 0.92) | −0.85 | 1.24E−03 |
| Pubertal timing | Age of menarche (girls) | −0.81 | 2.46E−27 | 0.54 (0.45, 0.64) | −1.11 | 2.18E−01 |
-
*
Association of selected exposures with BMI and obesity risk at age ~17.6 years in 3618 participants after controlling for confounders.
-
†
Association of selected exposures for BMI at age ~17.6 years with BMI at ~23 years (n = 308) after controlling for confounders.
Table 5
Associations of selected exposures with waist–hip ratio (WHR) at ~17.6 years, and associations of those exposures with WHR at ~23 years in participants from Hong Kong’s ‘Children of 1997’ birth cohort.
| Group names | Variable description | With WHR at ~17.6 years* | With WHR at ~23 years† | ||
|---|---|---|---|---|---|
| Beta | p value | Beta | p value | ||
| Baseline characteristics | Sex | 0.045 | 1.28E−88 | 0.083 | 5.71E−18 |
| Maternal information | Maternal weight | 0.001 | 1.13E−06 | 0.001 | 9.38E−02 |
| SEP | Housing type at birth (home ownership) | −0.006 | 2.70E−02 | −0.006 | 6.10E−01 |
| Diet | Biscuits: frequency of consumption in the past week | −0.003 | 2.60E−02 | 0.000 | 9.36E−01 |
| Diet | Chocolate: frequency of consumption in the past week | −0.004 | 1.86E−03 | −0.003 | 5.20E−01 |
| Diet | Chocolate: no. of servings/time | −0.003 | 5.03E−05 | 0.000 | 9.11E−01 |
| Diet | Sweets: frequency of consumption in the past week | −0.003 | 1.07E−02 | 0.000 | 9.80E−01 |
| Diet | When consume soft drinks, how often diet/artificially sweetened drinks | 0.005 | 1.04E−04 | –0.008 | 9.36E−02 |
| Children’s Health | Parents’ questionnaire: do you consider your child now to be: very thin/underweight; a little bit thin/underweight; about the right weight; a little bit fat/overweight; very fat/overweight; don’t know | 0.021 | 3.55E−59 | 0.015 | 3.02E−04 |
| Children’s Health | Whether experienced musculoskeletal pain in past 4 weeks | 0.006 | 1.57E−02 | −0.001 | 8.94E−01 |
| Sleep | Cough or snore loudly | 0.007 | 2.30E−06 | 0.013 | 4.76E−02 |
| Sleep | Sleep disturbance (child) | 0.005 | 1.93E−03 | 0.003 | 6.28E−01 |
-
*
Association of selected exposures with WHR at age ~17.6 years in 3618 participants after controlling for confounders.
-
†
Association of selected exposures for WHR at age ~17.6 years with WHR at ~23 years (n = 308) after controlling for confounders.
Table 6
Evidence from published systematic reviews, randomized controlled trials (RCTs) and Mendelian randomization (MR) studies regarding the role of exposures selected in our environment-wide association study (EWAS) in obesity.
| Exposure | Published RCTs studies | Published MR studies |
|---|---|---|
| Water consumption | Intervention on promoting water consumption showed no effect on body mass index (BMI; Muckelbauer et al., 2009). | NA |
| Reduced-fat/skim milk consumption | NA | MR study on different types of milk consumption (i.e. reduced-fat, skimmed, reduced-sugar milk) among children is lacking. Nevertheless, two MR studies suggested higher dairy intake was associated with higher adult’s BMI (Huang et al., 2018b; Yang et al., 2017). |
| Coffee consumption | NA | Genetically predicted more coffee intake was not associated with obesity, BMI, or waist circumference in two large adult population cohorts (Nordestgaard et al., 2015). Also, most MR studies do not support a role of caffeine consumption on BMI or waist circumstance (Nordestgaard et al., 2015; Cornelis and Munafo, 2018). |
| Chocolate consumption | Meta-analysis of RCTs did not support a significant effect of cocoa/dark chocolate supplementation on body weight or BMI (Kord-Varkaneh et al., 2019). | NA |
| Diabetes | NA | MR study supported genetic predisposition to higher childhood BMI was associated with risk of type 2 diabetes (Geng et al., 2018). |
| Binge eating | NA | The MR study suggests a bi-directional association, that is, more binge eating and overeating are associated with higher BMI in later life, and higher children’s BMI is associated with more binge eating (Reed et al., 2017). |
| Physical exercises | A systematic review shows school based RCTs targeting physical activity, or physical activity combined with diet interventions, were effective in reducing BMI among children (Bleich et al., 2018). | Genetically predicted more physical activity was associated with lower BMI (Carrasquilla et al., 2022). |
| Snoring | NA | MR study suggests genetically predicted BMI is related to snoring (Campos et al., 2020). |
| Pubertal timing | NA | Genetically predicted earlier age at puberty was related to higher BMI (Gill et al., 2018), but pleiotropy might exist (Gill et al., 2018). The association attenuated towards the null after controlling for prior BMI (Bell et al., 2018). It is also possible that genetically predicted BMI was associated with earlier age at puberty (Chen et al., 2019). |
| Birth weight | NA | MR analyses indicated positive causal associations of birthweight with BMI in the UKB (Zanetti et al., 2018). |
| Maternal adiposity during pregnancy | NA | Using BMI polygenic risk scores calculated from maternal non-transmitted alleles, previous MR studies using mother–offspring pairs from two large UK cohorts did not support causal associations between maternal pre/early pregnancy BMI and offspring adolescent adiposity (Bond et al., 2022; Richmond et al., 2017). |
Table 7
Associations of CpGs with body mass index (BMI) at age ~23 years in 286 participants from Hong Kong’s ‘Children of 1997’ birth cohort in the follow-up survey.
| CpG | Gene | Beta | p value |
|---|---|---|---|
| cg00379266 | RBM16 | −69.7 | 9.8E−07 |
| cg01525498 | RPTOR | −40.2 | 4.6E−10 |
| cg02200725 | - | −18.9 | 4.2E−07 |
| cg04563671 | SCN2B | 14.8 | 1.6E−07 |
| cg07243141 | - | 24.6 | 9.0E−07 |
| cg08205320 | - | −21.9 | 2.6E−08 |
| cg09639369 | SLC24A4 | −15.7 | 5.7E−07 |
| cg11937362 | - | 109 | 9.5E−07 |
| cg12484266 | C2 | 83 | 5.7E−09 |
| cg14630200 | RPS6KA2 | −45.1 | 7.1E−12 |
| cg14850190 | KSR1 | 103.2 | 4.3E−07 |
| cg18681028 | - | −48.5 | 7.6E−16 |
| cg18893311 | - | 30.8 | 7.5E−08 |
| cg22197830 | TXNDC15 | −68.8 | 4.9E−07 |
| cg25356423 | ZNF827 | −14 | 1.6E−07 |
| cg25903177 | - | −31.4 | 5.8E−07 |
| cg26347007 | GTF3C3 | −45.8 | 8.0E−07 |
-
CpGs reaching significance of p < 1 × 10⁻⁶ were shown in the table.
Table 8
Associations of CpGs with waist–hip ratio (WHR) at age ~23 years in 286 participants from Hong Kong’s ‘Children of 1997’ birth cohort in the follow-up survey.
| CpG | Gene | Beta | p value |
|---|---|---|---|
| cg00952960 | LANCL2 | −0.54 | 3.0E−11 |
| cg04405211 | C6orf195 | 0.35 | 9.7E−07 |
| cg05059349 | - | 0.26 | 3.7E−07 |
| cg07416310 | DCDC2 | −0.45 | 8.8E−08 |
| cg09422806 | NFIC | 0.5 | 3.4E−08 |
| cg09684856 | DIRC3 | −0.79 | 1.4E−07 |
| cg09907395 | RNF213 | 1.09 | 2.2E−07 |
| cg11344771 | LPP | −0.79 | 1.0E−08 |
| cg14630200 | RPS6KA2 | −0.46 | 5.4E−07 |
| cg17007012 | MIR4535 | −0.35 | 6.6E−11 |
| cg17043713 | ZNF141 | 0.55 | 8.1E−08 |
| cg17769811 | CTRL | −0.76 | 1.3E−09 |
| cg19481727 | MIR7641-2 | −0.36 | 5.4E−07 |
| cg19579176 | - | −0.35 | 9.9E−07 |
| cg22364817 | - | −1.46 | 6.7E−07 |
| cg25097095 | LYRM9 | −0.41 | 8.8E−09 |
| cg27384074 | OPA3 | 0.55 | 1.7E−07 |
-
CpGs reaching significance of p < 1 × 10⁻⁶ were shown in the table.
Additional files
-
MDAR checklist
- https://cdn.elifesciences.org/articles/82377/elife-82377-mdarchecklist1-v1.docx
-
Supplementary file 1
Categorization and data sources for exposures.
- https://cdn.elifesciences.org/articles/82377/elife-82377-supp1-v1.xls
-
Supplementary file 2
Associations of selected exposures with BMI after adjusting for time difference in participants of Hong Kong’s “Children of 1997” birth cohort.
- https://cdn.elifesciences.org/articles/82377/elife-82377-supp2-v1.docx
-
Source code 1
Main analysis code.
- https://cdn.elifesciences.org/articles/82377/elife-82377-code1-v1.zip
Download links
A two-part list of links to download the article, or parts of the article, in various formats.
Downloads (link to download the article as PDF)
Open citations (links to open the citations from this article in various online reference manager services)
Cite this article (links to download the citations from this article in formats compatible with various reference manager tools)
Environment- and epigenome-wide association study of obesity in ‘Children of 1997’ birth cohort
eLife 12:e82377.
https://doi.org/10.7554/eLife.82377


