Glutamine synthetase mRNA releases sRNA from its 3′UTR to regulate carbon/nitrogen metabolic balance in Enterobacteriaceae
- Department of Infection Biology, Faculty of Medicine, University of Tsukuba, Japan
- Transborder Medical Research Center, University of Tsukuba, Japan
- International Joint Degree Master’s Program in Agro-Biomedical Science in Food and Health (GIP-TRIAD), University of Tsukuba, Japan
- Institute for Advanced Biosciences, Keio University, Japan
- Graduate School of Media and Governance, Keio University, Japan
- Medical Mycology Research Center, Chiba University, Japan
- Department of Bacteriology, Faculty of Medical Sciences, Kyushu University, Japan
- Laboratory for Chemistry and Life Science, Institute of Innovative Research, Tokyo Institute of Technology, Japan
Figures
Figure 1
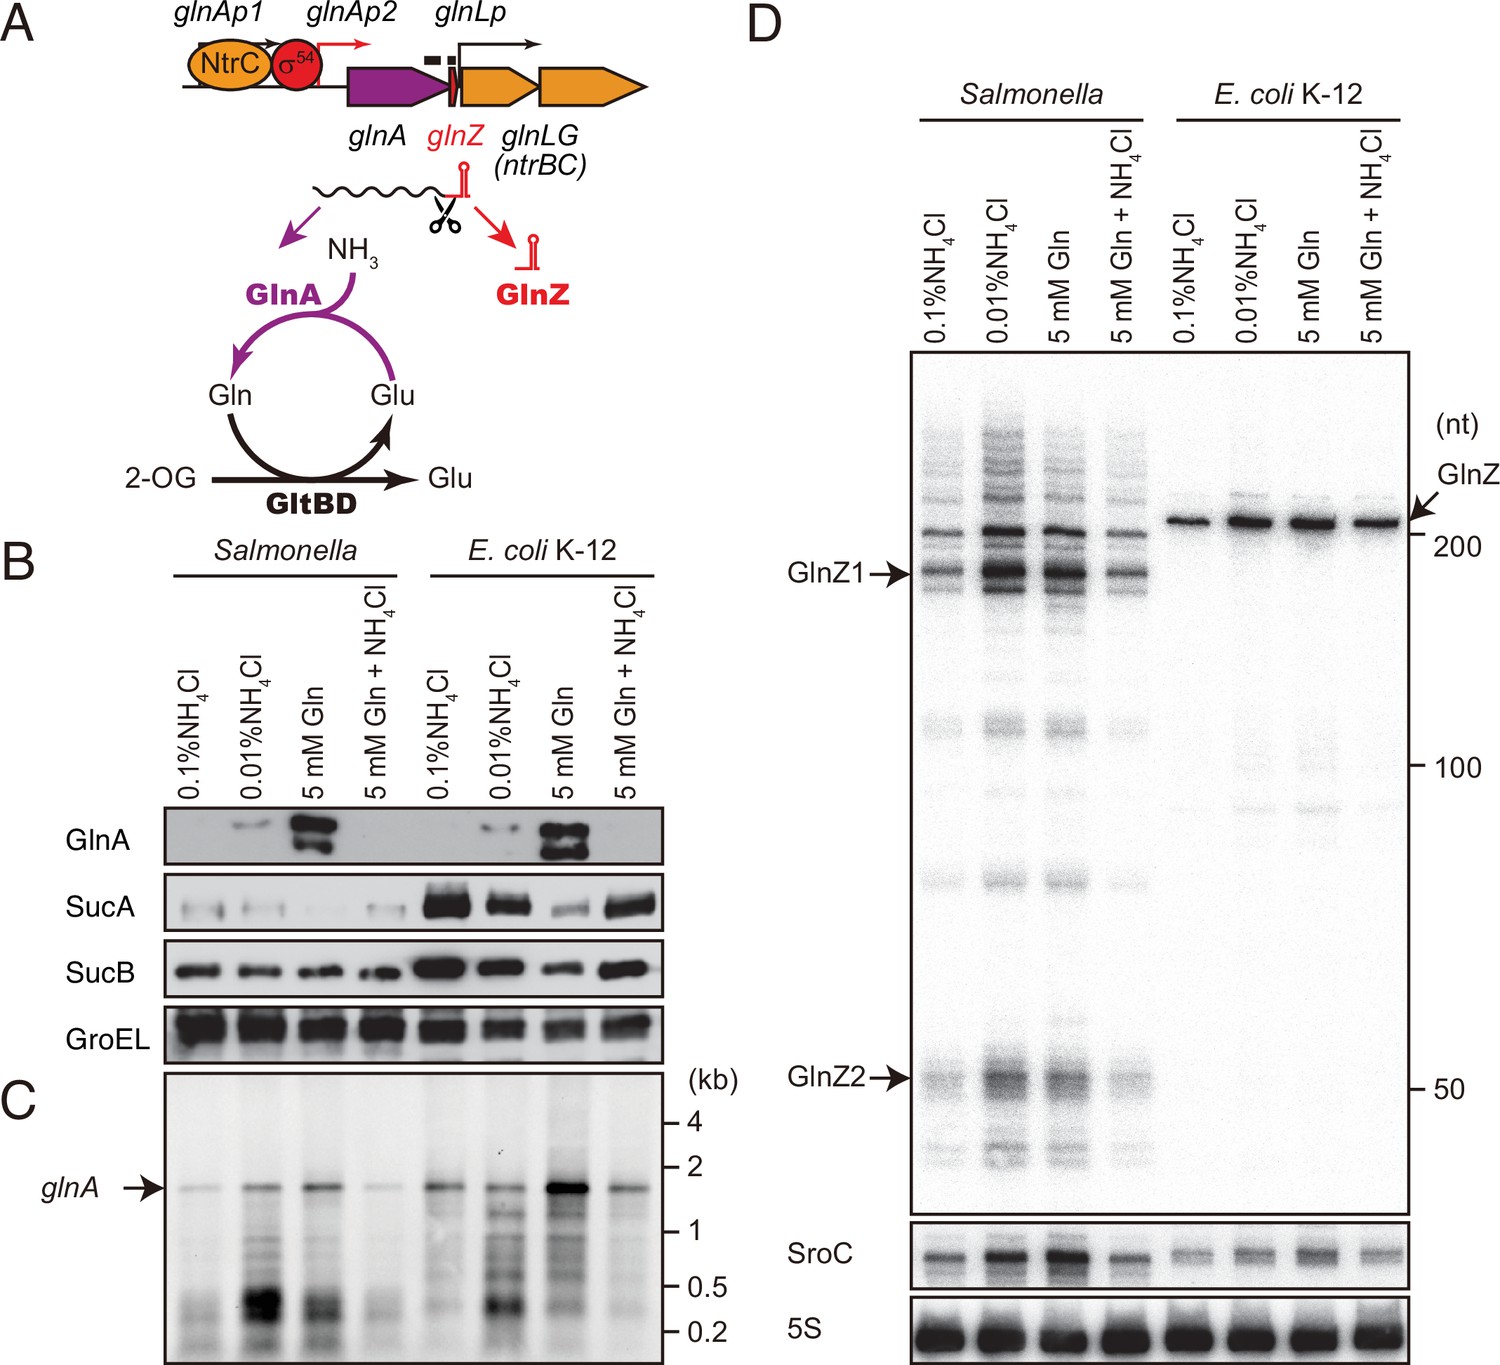
glnA mRNA expresses both GlnA protein and GlnZ sRNA.
(A) The genetic structure of glnALG operon and nitrogen assimilation pathway. The transcription of glnA mRNA from σ54-dependent promoter glnAp2 is activated by the NtrB/NtrC two-component system, which is encoded downstream of glnA. GlnA (glutamine synthetase [GS]) catalyzes the amidation of glutamate (Glu) to form glutamine (Gln) using one molecule of ATP, and GltBD (glutamine 2-oxoglutarate amidotransferase [GOGAT]) transfers the amide group of Gln to 2-oxoglutarate (2-OG) to generate two Glu molecules. GlnZ is processed from the 3′UTR of glnA mRNA. The black bars above the genes indicate the location of probes used for northern blots. (B) Expression profiles of 2-oxoglutarate dehydrogenase (OGDH) subunits (SucA and SucB) and GlnA in Salmonella enterica and Escherichia coli during growth on different nitrogen sources. S. Typhimurium SL1344 and E. coli BW25113 were grown to exponential phase (OD600 ~0.5) in MOPS media containing 0.2% glucose as the carbon source and the following nitrogen sources: 0.1% ammonium, 0.01% ammonium, 5 mM Gln, or 5 mM Gln plus 0.01% ammonium. SucA and SucB were detected by antibodies raised against purified E. coli proteins. GlnA was detected by an antibody raised against a synthetic peptide. GroEL served as a loading control. (C and D) Expression profiles of glnA mRNA and GlnZ sRNA. The glnA mRNA was detected by an equimolar mixture of two RNA probes specific for Salmonella and E. coli. GlnZ was detected by a common oligonucleotide probe MMO-0416. SroC sRNA was detected by an equimolar mixture of oligonucleotide probes JVO-2907 and JVO-5622. 5S rRNA detected by MMO-1056 served as a loading control.
-
Figure 1—source data 1
Figure with the uncropped blots.
- https://cdn.elifesciences.org/articles/82411/elife-82411-fig1-data1-v3.pdf
-
Figure 1—source data 2
The original files of the full raw unedited northern blots.
- https://cdn.elifesciences.org/articles/82411/elife-82411-fig1-data2-v3.zip
-
Figure 1—source data 3
The original files of the full raw unedited westen blots.
- https://cdn.elifesciences.org/articles/82411/elife-82411-fig1-data3-v3.zip
Figure 2
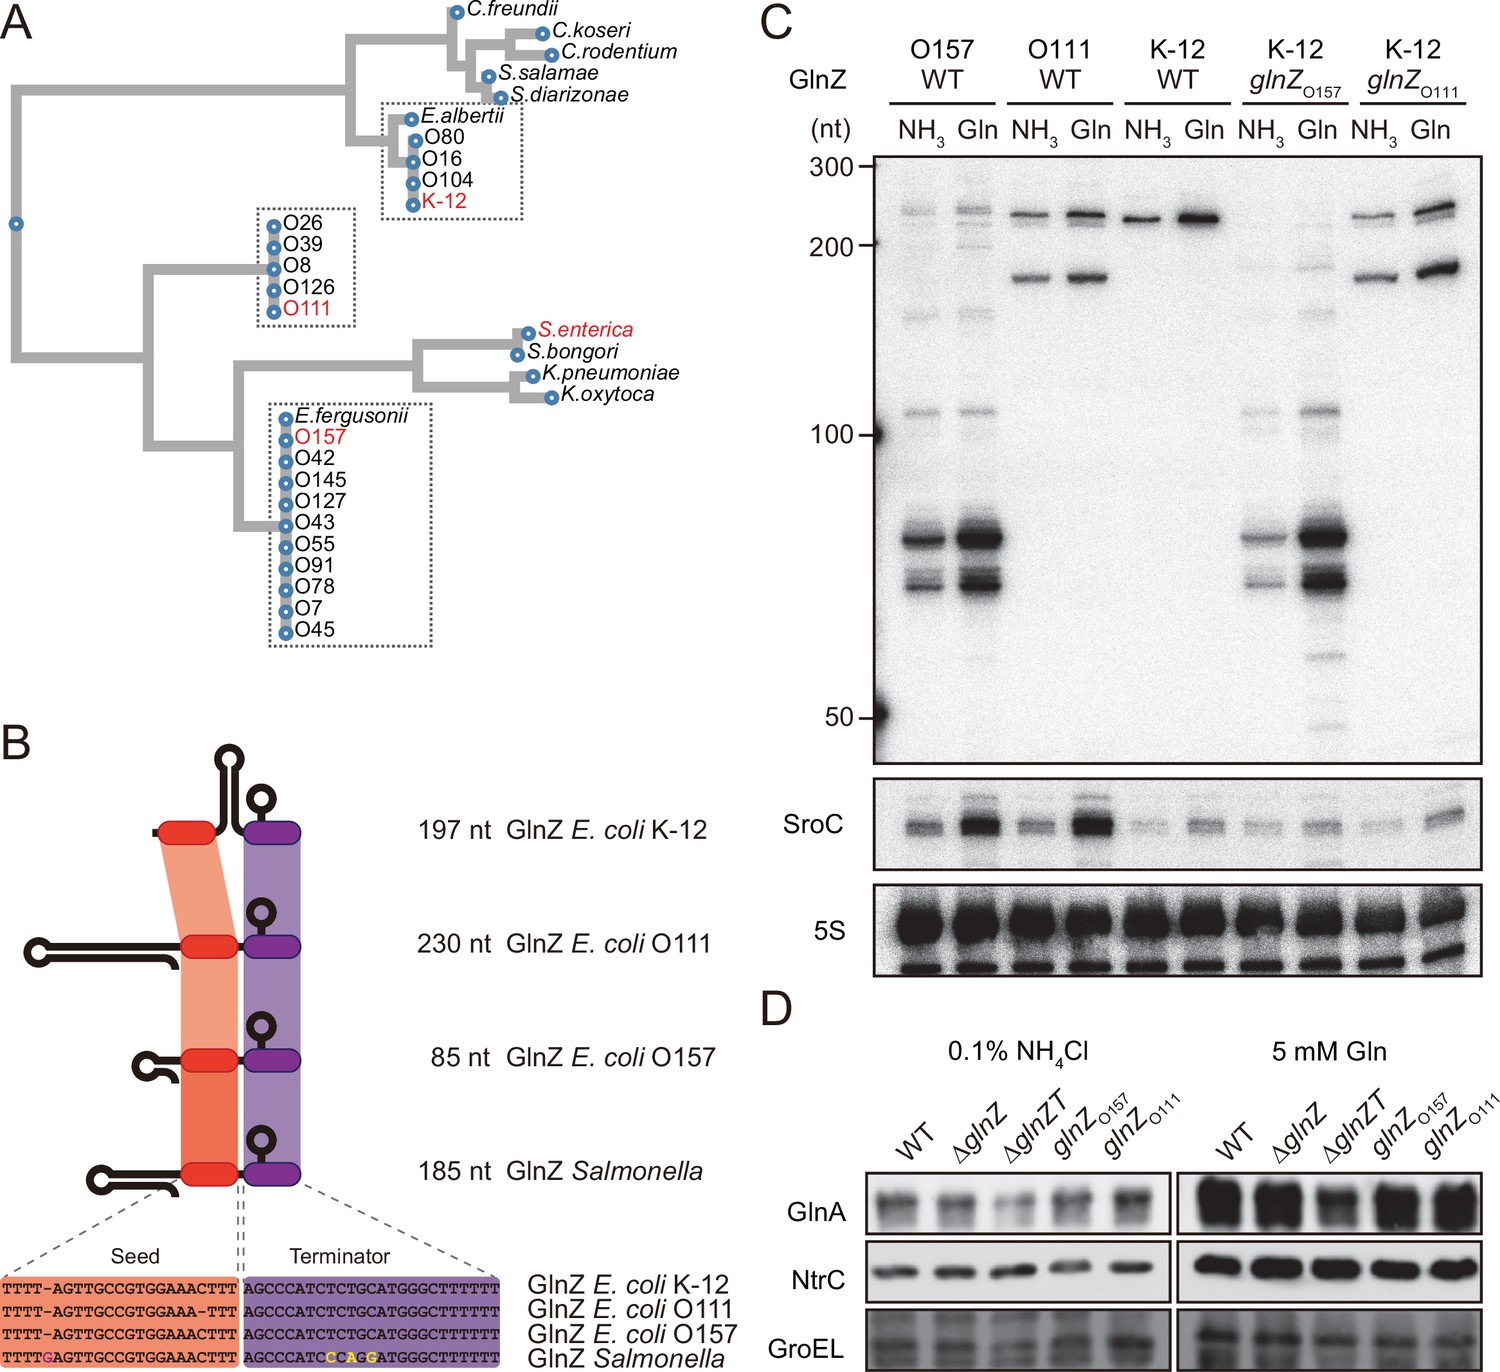
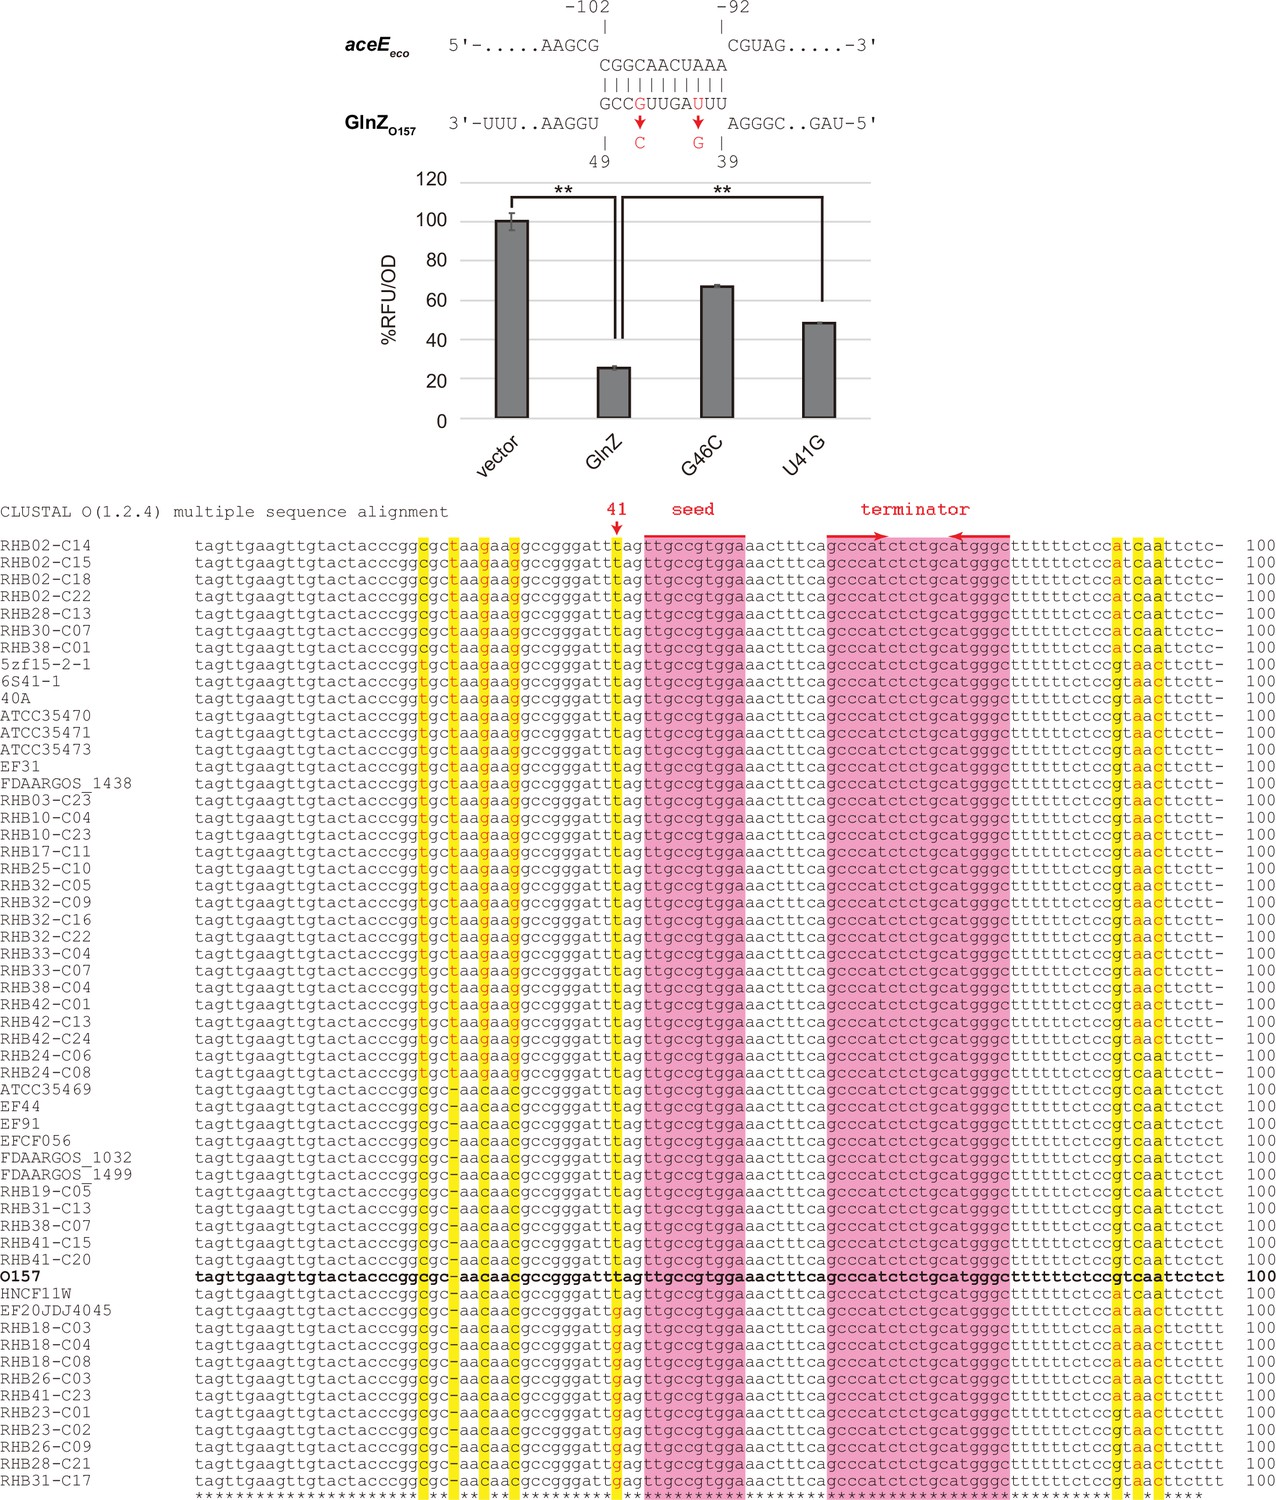
Variation of GlnZ sRNAs in the Enterobacteriaceae family.
(A) Multiple sequence alignment of glnA 3′UTRs using CLUSTALW program (https://www.genome.jp/tools-bin/clustalw). (B) The location of conserved seed region and Rho-independent terminator in different types of GlnZ sRNAs. The extra G nucleotide and variable nucleotides found in the terminator of Salmonella GlnZ are indicated in purple and yellow letters. (C) Escherichia coli strains express different types of GlnZ sRNAs. E. coli O157, O111, and K-12 strains were grown to exponential phase (OD600 ~0.5) in MOPS media containing 0.2% glucose as the carbon source and either 0.1% ammonium or 5 mM glutamine (Gln) as the nitrogen source. GlnZ and SroC sRNAs were detected by MMO-0416 and JVO-5622, respectively. 5S rRNA detected by MMO-1056 served as a loading control. (D) The difference in 3′UTR sequence does not affect the expression of downstream NtrC. E. coli K-12 strains, wild type (WT), ΔglnZ, ΔglnZT, glnZO157, and glnZO111, were grown to exponential phase (OD600 ~0.5) in MOPS media containing 0.2% glucose as the carbon source and either 0.1% ammonium or 5 mM Gln as the nitrogen source. GlnA was detected by an antibody raised against a synthetic peptide. NtrC was chromosomally tagged with 3xFLAG and detected by α-FLAG antibody. GroEL served as a loading control.
-
Figure 2—source data 1
Figure with the uncropped blots.
- https://cdn.elifesciences.org/articles/82411/elife-82411-fig2-data1-v3.pdf
-
Figure 2—source data 2
The original files of the full raw unedited northern blots.
- https://cdn.elifesciences.org/articles/82411/elife-82411-fig2-data2-v3.zip
-
Figure 2—source data 3
The original files of the full raw unedited western blots.
- https://cdn.elifesciences.org/articles/82411/elife-82411-fig2-data3-v3.zip
Figure 3 with 2 supplements
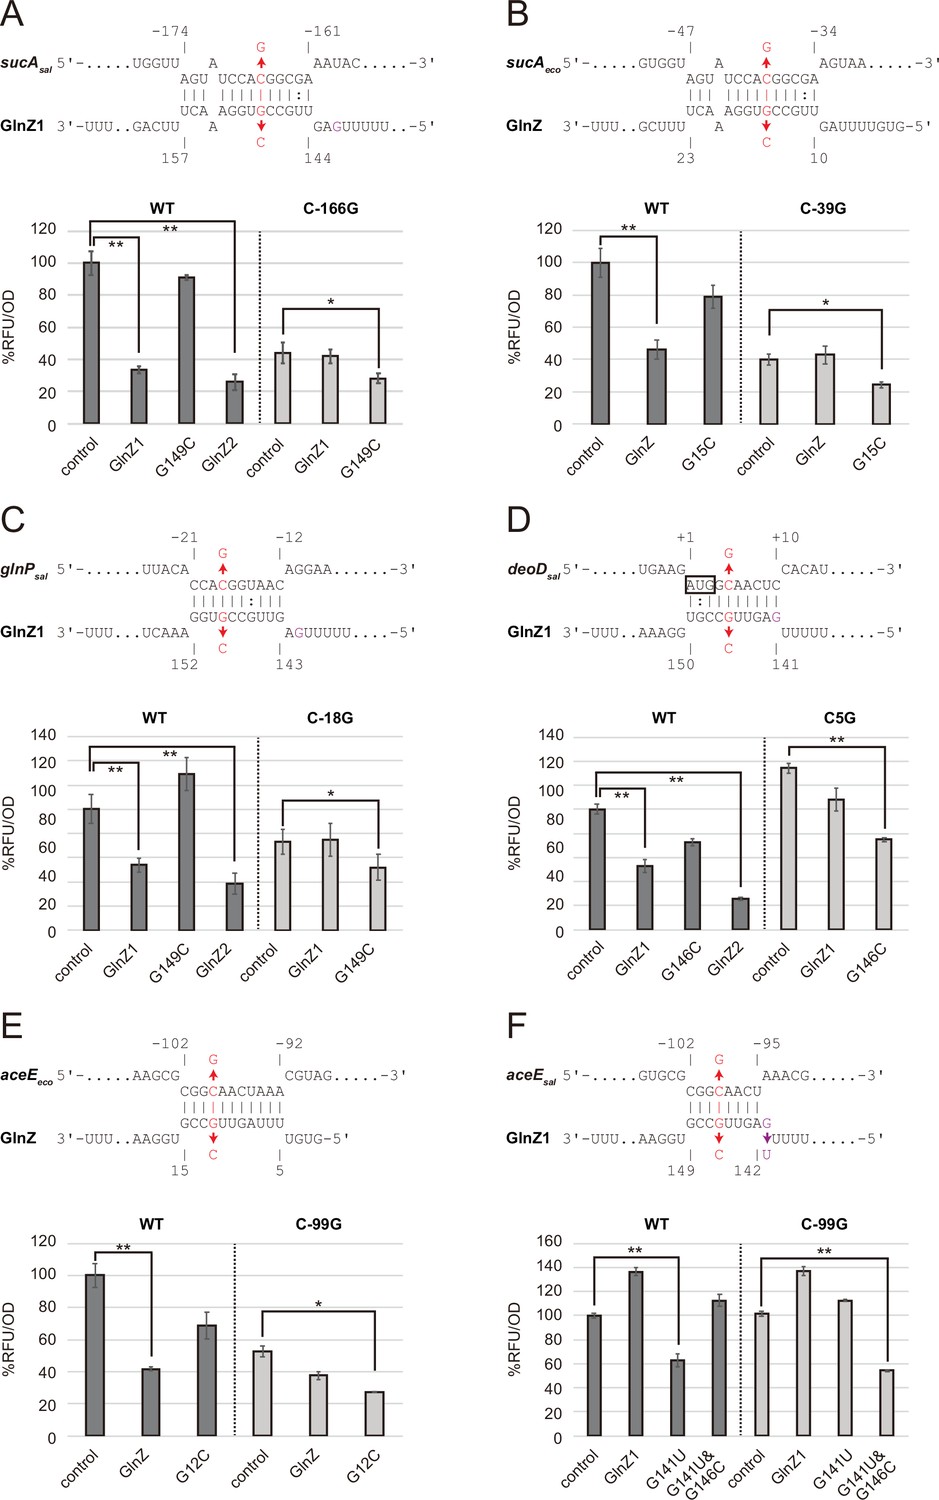
Post-transcriptional regulation mediated by Salmonella enterica and Escherichia coli GlnZ.
Predicted interactions of GlnZ with the target mRNAs are shown in the panels, (A) S. enterica sucA, (B) E. coli sucA, (C) S. enterica glnP, (D) S. enterica deoD, (E) E. coli aceE, and (F) S. enterica aceE. The nucleotide numbers relative to the start codon of the target mRNA and the stop codon of glnA are shown above and below the nucleotide sequences, respectively. The mutated nucleotides are indicated in red, and the extra G nucleotide found in Salmonella GlnZ1 is shown in purple. E. coli ΔglnZ strain was transformed by GFP translational fusion plasmids along with pJV300 control vector or GlnZ expression plasmids (Supplementary file 5-7). Mean relative fluorescence units (RFU) normalized by OD600 calculated from biological replicates (n>3) are presented with standard deviation in percentage relative to the vector control. Statistical significance was calculated using one-way ANOVA and denoted as follows: **p<0.005, *p<0.05.
Figure 3—figure supplement 1
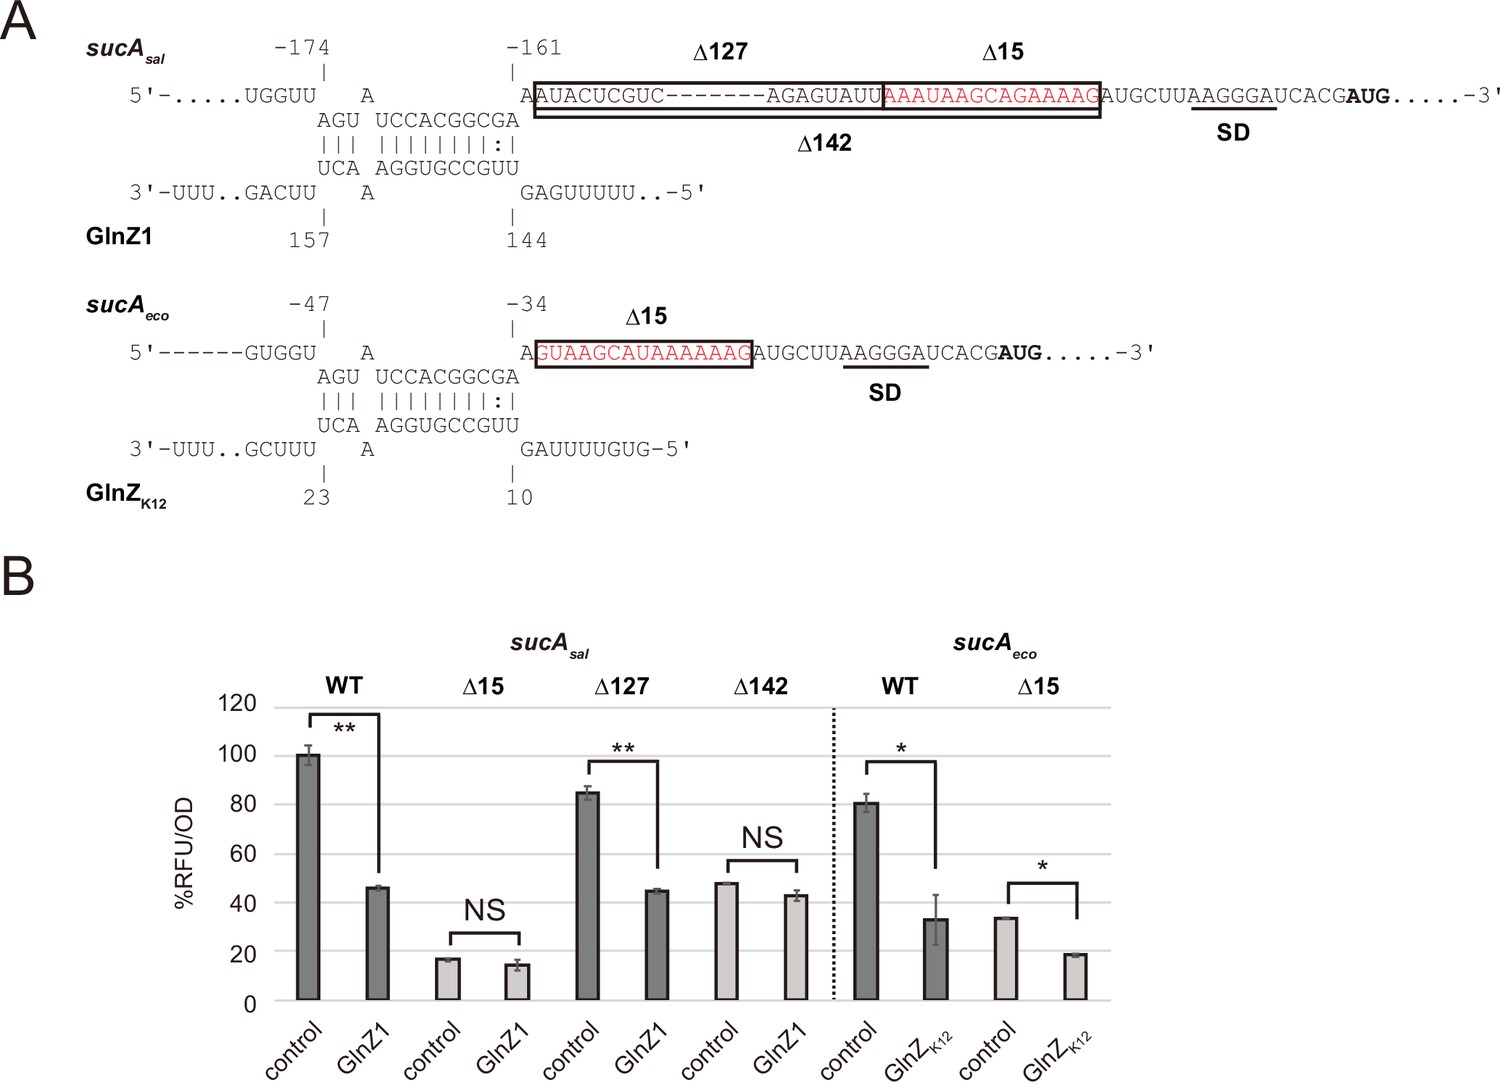
Post-transcriptional regulation of sucA involves a purine-rich sequence.
(A) Predicted interaction of GlnZ with sucA mRNA in Salmonella and Escherichia coli. The nucleotide numbers relative to the start codon of sucA (bold) and the stop codon of glnA are shown above and below the nucleotide sequences, respectively. Putative SD sequence of sucA is underlined. The deleted regions in the pXG30-sf sucA reporter plasmids, Δ15, Δ127, and Δ142 are boxed. (B) E. coli ΔglnZ strain was transformed by GFP translational fusion plasmids along with pJV300 control vector or GlnZ expression plasmids (Supplementary file 5-7). Mean relative fluorescence units (RFU) normalized by OD600 calculated from biological replicates (n>3) are presented with standard deviation in percentage relative to the vector control of sucAsal. Statistical significance was calculated using one-way ANOVA and denoted as follows: **p<0.005, *p<0.05, NS: not significant.
Figure 3—figure supplement 2
Post-transcriptional regulation of aceE by GlnZO157.
(A) Escherichia coli ΔglnZ strain was transformed by pXG30sf-aceEeco along with pJV300 vector control or GlnZO157 expression plasmids (Supplementary file 5-7). Mean relative fluorescence units (RFU) normalized by OD600 calculated from biological replicates (n>3) are presented with standard deviation in percentage relative to the vector control. Statistical significance was calculated using one-way ANOVA and denoted as follows: **p<0.005. (B) Alignment of Escherichia fergusonii GlnZ from 55 strains along with GlnZO157. GlnZO157 is shown in bold font. Nucleotides of E. fergusonii GlnZ different from those of GlnZO157 are highlighted in yellow and indicated in red font.
Figure 4
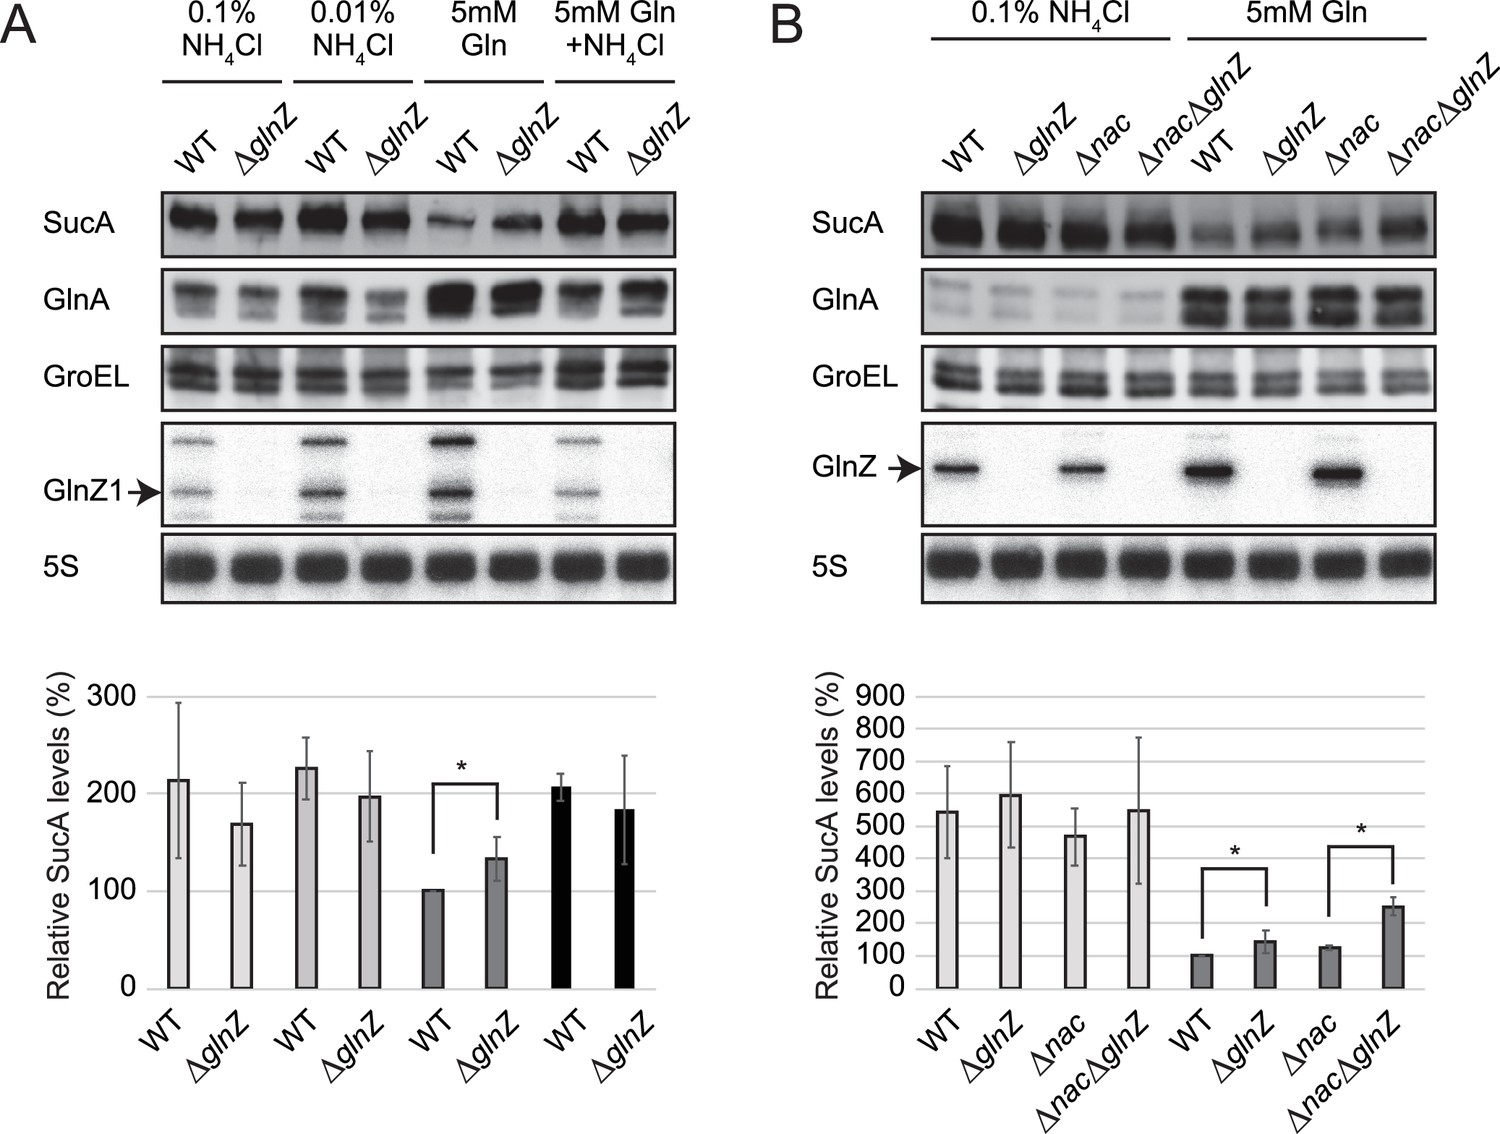
Repression of SucA by endogenous GlnZ.
(A) GlnZ post-transcriptionally represses the expression of SucA in Salmonella during growth on glutamine (Gln) as the nitrogen source. Salmonella wild-type (WT) and ΔglnZ strains were grown to exponential phase (OD600 ~0.5) in MOPS minimal medium containing 0.2% glucose as the carbon source and different nitrogen sources; 0.1% ammonium, 0.01% ammonium, 5 mM Gln, and 5 mM Gln plus 0.01% ammonium. (B) GlnZ and Nac independently repress the expression of SucA in Escherichia coli during growth on Gln as the nitrogen source. E. coli WT, ΔglnZ, Δnac, and ΔglnZΔnac strains were grown to exponential phase (OD600 ~0.5) in MOPS minimal medium containing 0.2% glucose as the carbon source and either 0.1% ammonium or 5 mM Gln as the nitrogen source. The expression of SucA and glutamine synthetase (GS) was analyzed by western blots (upper panels), and that of GlnZ was analyzed by northern blots (bottom panels). GroEL served as a loading control for western blots; 5S rRNA for northern blots. The expression levels of SucA relative to GroEL were normalized to that of WT strain grown on Gln, and the standard deviation was calculated from biological replicates (n>3). Statistical significance was calculated using one-way ANOVA and denoted as *p<0.05.
-
Figure 4—source data 1
Figure with the uncropped blots.
- https://cdn.elifesciences.org/articles/82411/elife-82411-fig4-data1-v3.pdf
-
Figure 4—source data 2
The original files of the full raw unedited northern blots.
- https://cdn.elifesciences.org/articles/82411/elife-82411-fig4-data2-v3.zip
Figure 5

Hfq is essential for GlnZ biogenesis and target regulation.
(A) Expression profiles of glnA gene products in Escherichia coli and its hfq mutant during growth on different nitrogen sources. E. coli BW25113 and its hfq mutant were grown to exponential phase (OD600 ~0.5) in MOPS media containing 0.2% glucose as the carbon source and the following nitrogen sources: 0.1% ammonium, 0.01% ammonium, 5 mM Gln, or 5 mM Gln plus 0.01% ammonium. The protein and RNA levels were analyzed as in Figure 1BCD except E. coli GlnZ detection by a specific oligonucleotide probe MMO-0419. (B) Target regulation by ectopic expression of GlnZ and its derivatives. E. coli ΔglnZ and ΔglnZΔhfq strains harboring the constitutive GlnZ expression plasmids (Supplementary file 5) were grown to exponential phase (OD600 ~1.0) in LB medium. The expression of AceE, SucA, and SucB was analyzed by western blots (upper panels), and that of GlnZ was analyzed by northern blots (bottom panels). GroEL served as a loading control for western blots; 5S rRNA for northern blots. (C) GlnZ is generated primarily from the glnA mRNA. E. coli ΔglnZ and ΔglnZΔhfq strains harboring pBAD-glnAsal, pBAD-glnAeco, or pBAD-GlnZeco were grown to exponential phase (OD600 ~1.0) at 37°C and further incubated for 10 min in the presence (+) or absence (-) of 0.2% l-arabinose.
-
Figure 5—source data 1
Figure with the uncropped blots.
- https://cdn.elifesciences.org/articles/82411/elife-82411-fig5-data1-v3.pdf
-
Figure 5—source data 2
The original files of the full raw unedited western blots.
- https://cdn.elifesciences.org/articles/82411/elife-82411-fig5-data2-v3.zip
-
Figure 5—source data 3
Figure with the uncropped blots.
- https://cdn.elifesciences.org/articles/82411/elife-82411-fig5-data3-v3.pdf
-
Figure 5—source data 4
The original files of the full raw unedited northern blots.
- https://cdn.elifesciences.org/articles/82411/elife-82411-fig5-data4-v3.zip
-
Figure 5—source data 5
Figure with the uncropped blots.
- https://cdn.elifesciences.org/articles/82411/elife-82411-fig5-data5-v3.pdf
-
Figure 5—source data 6
The original files of the full raw unedited western blots.
- https://cdn.elifesciences.org/articles/82411/elife-82411-fig5-data6-v3.zip
-
Figure 5—source data 7
Figure with the uncropped blots.
- https://cdn.elifesciences.org/articles/82411/elife-82411-fig5-data7-v3.pdf
-
Figure 5—source data 8
The original files of the full raw unedited western blots.
- https://cdn.elifesciences.org/articles/82411/elife-82411-fig5-data8-v3.zip
Figure 6 with 1 supplement
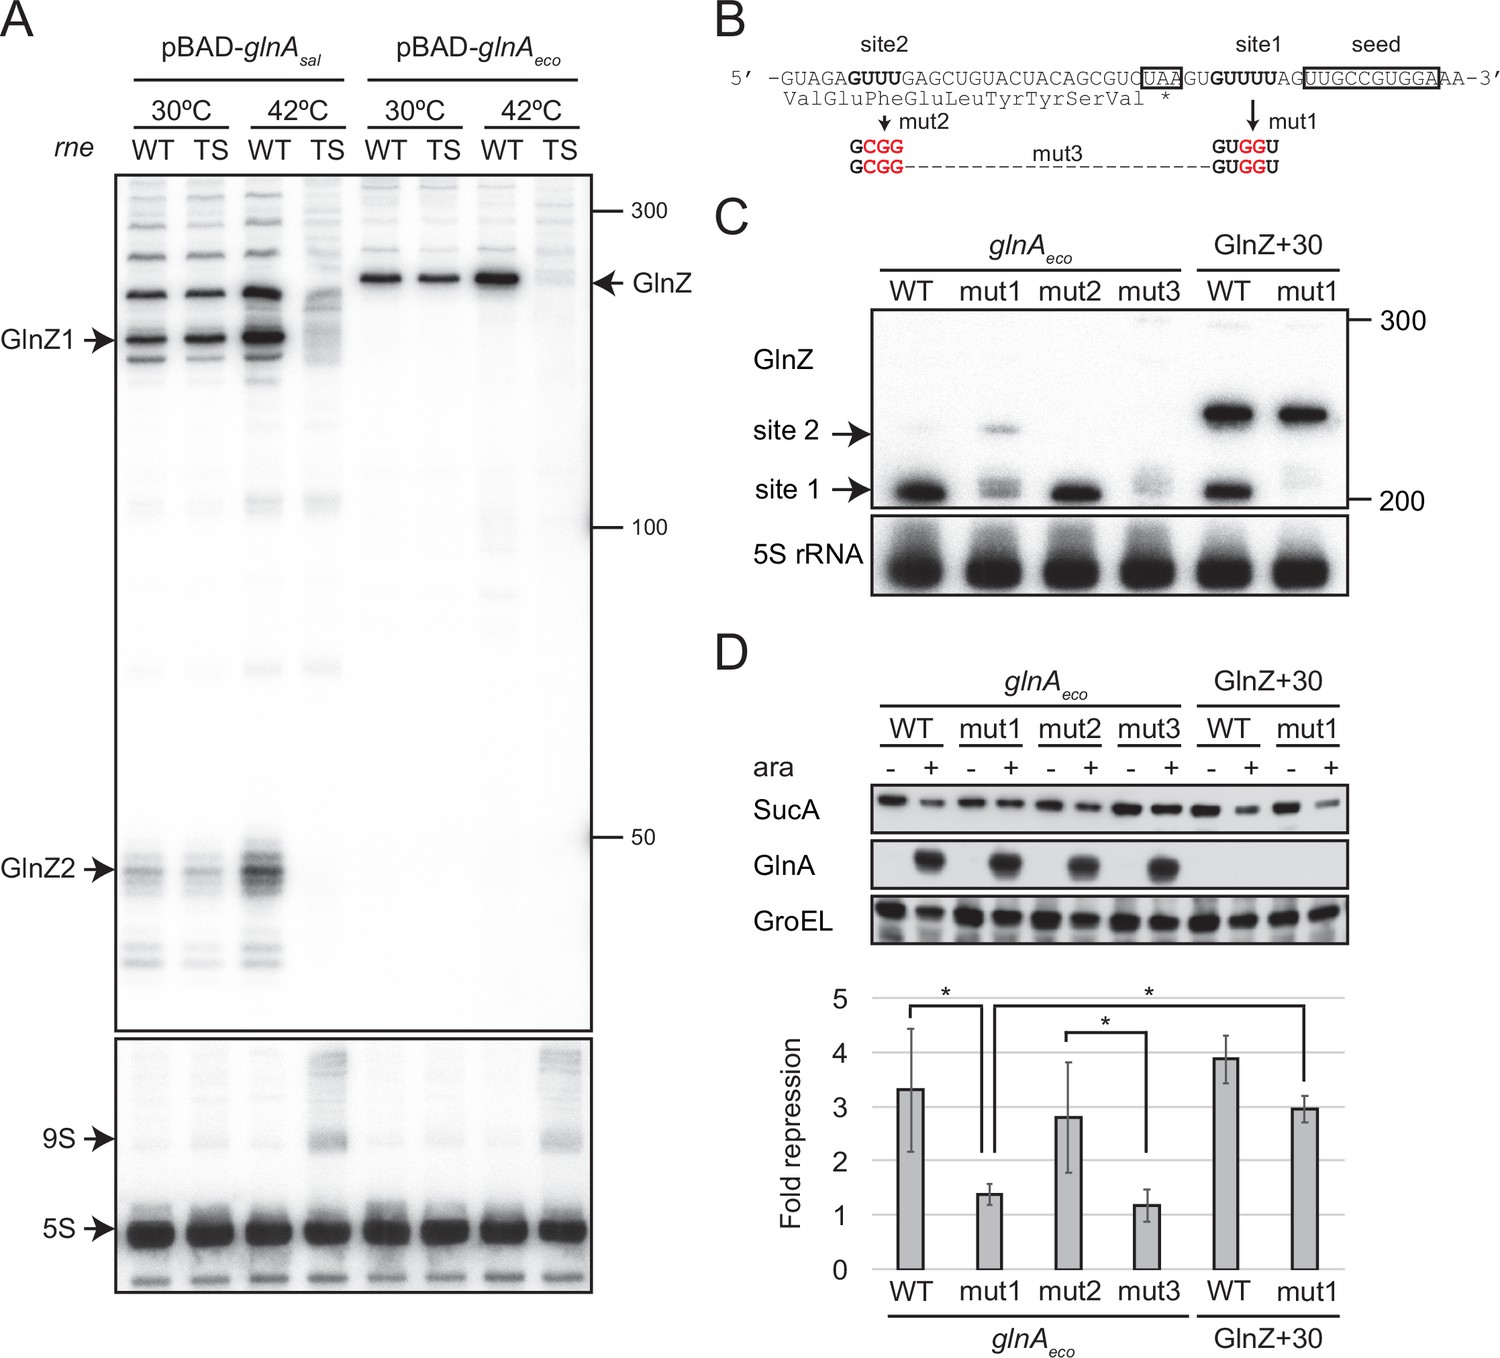
GlnZ release from the glnA mRNA is necessary for target repression.
(A) RNase E is essential for the processing of glnA mRNA. Escherichia coli ΔglnZ (wild-type [WT]) and ΔglnZ ams-1 (TS) strains harboring pBAD-glnAsal or pBAD-glnAeco were grown to OD600 ~0.5 at 30°C and split into two flasks. The flasks were incubated at either 30°C or 42°C for 30 min and further incubated for 10 min after adding 0.2% l-arabinose. The size is estimated by DynaMarker RNA Low II ssRNA fragment. (B) The nucleotide sequence of RNase E cleavage sites in E. coli K-12 glnA mRNA. The C-terminal amino acid sequence of GlnA is shown below the nucleotide sequence. The glnA stop codon and the GlnZ seed region are boxed. The mutated nucleotides are indicated in red. (C) The processing of GlnZ is abrogated by the mutations in RNase E cleavage sites. GlnZ processed from either the glnA mRNA or the GlnZ precursor sRNA was analyzed by northern blot. 5S rRNA served as a loading control. (D) The processing of GlnZ is required for the repression of SucA in the form of mRNA but not the precursor sRNA. Expression levels of SucA and GlnA were analyzed by western blot. GroEL served as a loading control. E. coli ΔglnZ strains harboring pBAD expression plasmids were grown to exponential phase (OD600 ~1.0) in LB medium in the absence (-) or presence of 0.01% l-arabinose (+). Bar graph represents the fold change of SucA repression by the glnA mRNA induced by arabinose calculated from biological replicates (n>5) with standard deviation. Statistical significance was calculated using one-way ANOVA and denoted as *p<0.05.
-
Figure 6—source data 1
Figure with the uncropped blots.
- https://cdn.elifesciences.org/articles/82411/elife-82411-fig6-data1-v3.pdf
-
Figure 6—source data 2
The original files of the full raw unedited northern blots.
- https://cdn.elifesciences.org/articles/82411/elife-82411-fig6-data2-v3.zip
-
Figure 6—source data 3
Figure with the uncropped blots.
- https://cdn.elifesciences.org/articles/82411/elife-82411-fig6-data3-v3.pdf
-
Figure 6—source data 4
The original files of the full raw unedited northern and western blots.
- https://cdn.elifesciences.org/articles/82411/elife-82411-fig6-data4-v3.zip
Figure 6—figure supplement 1
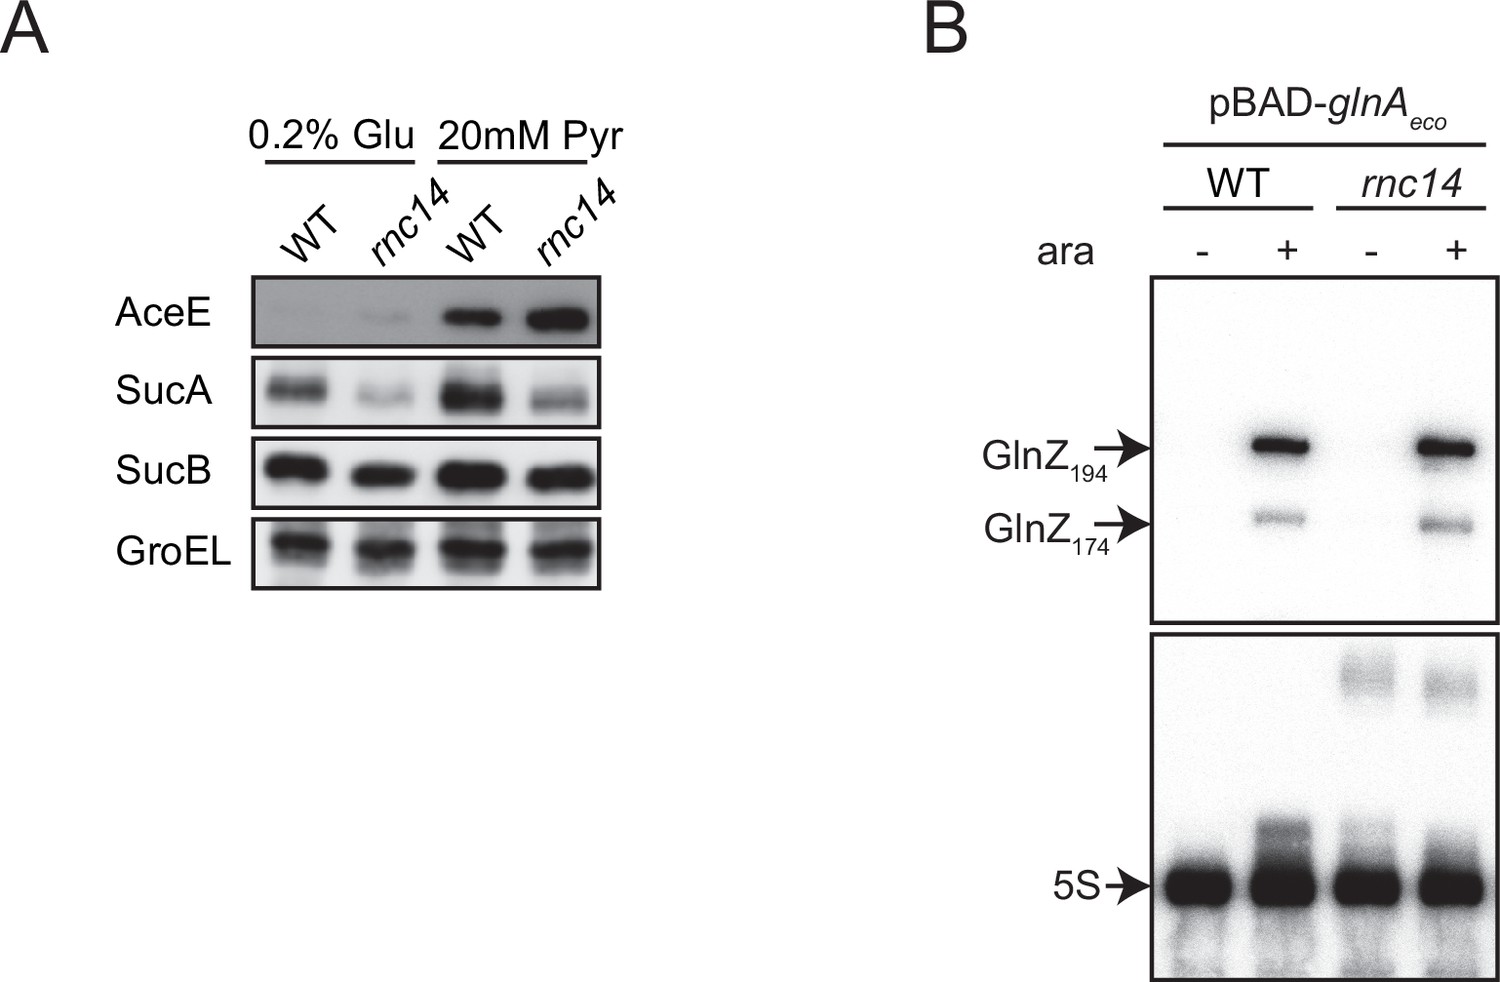
Expression of GlnZ and its targets in Escherichia coli rnc14 mutant.
(A) E. coli wild-type (WT) and rnc14 strains were grown to exponential phase (OD600 ~0.5) in MOPS minimal medium containing 0.2% glucose or 20 mM pyruvate as the carbon source and 0.1% ammonium as the nitrogen source. The expression of AceE, SucA, and SucB, and GroEL was analyzed by western blot. (B) E. coli ΔglnZ (WT) and ΔglnZ rnc14 (rnc14) strains harboring pBAD-glnAeco were grown in LB medium to OD600 ~1.0 at 37°C in the presence or absence of 0.2% l-arabinose. GlnZ was detected by a specific oligonucleotide probe MMO-0419. 5S rRNA was detected by MMO-1056 served as a loading control.
Figure 7
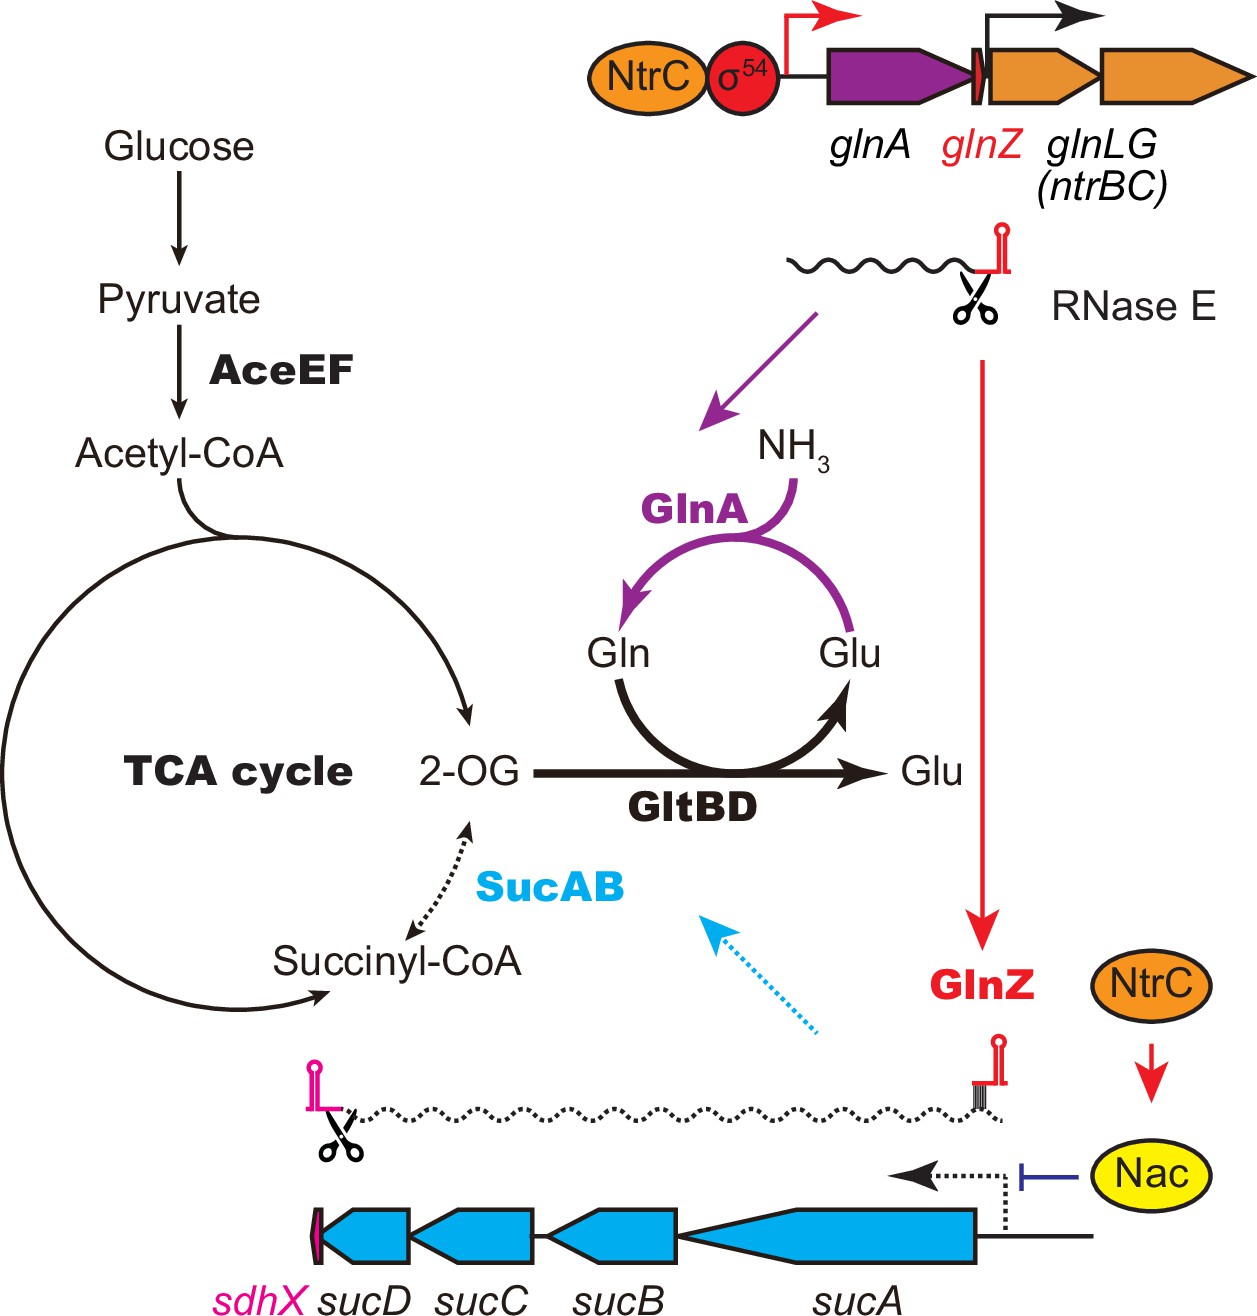
GlnA and GlnZ expressed from glnA mRNA facilitate nitrogen assimilation independently.
The expression of GlnA and GlnZ is induced by the two-component system NtrBC upon nitrogen limitation. The glutamine synthetase (GS)-glutamine 2-oxoglutarate amidotransferase (GOGAT) (GlnA-GlnBD) pathway assimilates ammonia using 2-oxoglutarate (2-OG) as the carbon skeleton. GlnZ sRNA is released from the 3′UTR of glnA mRNA by RNase E to repress the expression of SucA at the post-transcriptional level. In Escherichia coli, the transcriptional regulator nitrogen assimilation control (Nac), whose expression is activated by NtrC, represses the transcription of sucABCD operon in parallel. The repression of 2-oxoglutarate dehydrogenase (OGDH) (SucAB) upon nitrogen limitation results in the accumulation of 2-OG and redirects the carbon flow from the TCA cycle to the GS-GOGAT pathway.
Additional files
-
Supplementary file 1
Genes downregulated upon GlnZ1 overexpression in Salmonella Typhimurium SL1344.
- https://cdn.elifesciences.org/articles/82411/elife-82411-supp1-v3.docx
-
Supplementary file 2
Bacterial strains used in this study.
- https://cdn.elifesciences.org/articles/82411/elife-82411-supp2-v3.docx
-
Supplementary file 3
Plasmids used in this study.
- https://cdn.elifesciences.org/articles/82411/elife-82411-supp3-v3.docx
-
Supplementary file 4
DNA oligonucleotides used in this study.
- https://cdn.elifesciences.org/articles/82411/elife-82411-supp4-v3.docx
-
Supplementary file 5
Inserts of GlnZ mutant plasmids.
- https://cdn.elifesciences.org/articles/82411/elife-82411-supp5-v3.docx
-
Supplementary file 6
Details of GFP fusion plasmids.
- https://cdn.elifesciences.org/articles/82411/elife-82411-supp6-v3.docx
-
Supplementary file 7
Inserts of GFP fusion plasmids.
- https://cdn.elifesciences.org/articles/82411/elife-82411-supp7-v3.docx
-
MDAR checklist
- https://cdn.elifesciences.org/articles/82411/elife-82411-mdarchecklist1-v3.docx
Download links
A two-part list of links to download the article, or parts of the article, in various formats.
Downloads (link to download the article as PDF)
Open citations (links to open the citations from this article in various online reference manager services)
Cite this article (links to download the citations from this article in formats compatible with various reference manager tools)
Glutamine synthetase mRNA releases sRNA from its 3′UTR to regulate carbon/nitrogen metabolic balance in Enterobacteriaceae
eLife 11:e82411.
https://doi.org/10.7554/eLife.82411


