Ultrafast (400 Hz) network oscillations induced in mouse barrel cortex by optogenetic activation of thalamocortical axons
- Department of Neuroscience, West Virginia University School of Medicine, Rockefeller Neuroscience Institute, United States
Figures
Figure 1 with 2 supplements

Local field potential oscillations (ripplets) induced by optogenetic thalamocortical activation.
(A) Averaged ripplets evoked in an example slice; light pulses (1 and 5 ms duration for left and right traces, respectively) represented by cyan bars above traces, and apply to (A–C). Solid arrowhead indicates the early presynaptic TC volley; hollow arrowheads indicate the peaks of the postsynaptic components; the arrow points to the hump on the rising phase of the first postsynaptic transient. (B) The iGluR-independent (i.e. presynaptic) component: same stimuli as in (A) but in the presence of CNQX + APV. Arrowheads indicate a single presynaptic volley in response to a 1 ms stimulus and three volleys (of decreasing amplitude and coherence) with a 5 ms stimulus. (C) The difference between (A) and (B), revealing the purely postsynaptic component of the ripplet. Symbols as in (A). (D) Superposition of the presynaptic (blue, left) and postsynaptic (red, right) components of the ripplets at three stimulus durations. (E) Superposition of presynaptic components (blue, left) and ripplets (red, right) from slices from four different animals, normalized to the same maximal amplitudes to facilitate comparison of their time course. (F) Histogram of peak times (from light onset) of presynaptic volleys (left) and of ripplet transients (right) in slices from 8 and 11 animals, respectively (5 animals are included in both plots). Presynaptic volleys peaked at 2.3 ± 0.07, 6.0 ± 0.22, and 10.8 ± 0.24 ms from light onset. Ripplet transients peaked at 4.4 ± 0.11, 6.5 ± 0.26, 8.9 ± 0.30, and 11.9 ± 0.38 ms. (G) The histograms from (F) modeled as normal distributions, with the same mean, SD and integral as the corresponding component. Left, presynaptic volleys; right, ripplet transients (red) with presynaptic volleys overlaid as gray outlines for comparison.
-
Figure 1—source data 1
Counts of Cre-expressing neurons in the KN282 mouse.
Four male mice (4–6 weeks old) were deeply anesthetized with 2.5% Avertin and transcardially perfused with saline followed by 50 ml 4% paraformaldehyde (PFA). Brains were removed, post-fixed in 4% PFA at room temperature for 4 hr, stored for at least 72 hr in 30% sucrose solution in phosphate buffered saline (PBS) at 4°C, and sectioned coronally on a freezing stage sliding microtome. For imaging, five 60 μm sections were sampled per brain at 240 μm intervals, in total extending 800–2000 μm posterior to bregma, as determined by comparison with the Paxinos and Franklin atlas (Paxinos and Franklin, The Mouse Brain in Stereotaxic Coordinates, 4th edition, Academic Press 2012). Confocal image stacks were taken with a ×10 objective at 2.5 μm Z-steps on a Zeiss LSM 710 or a Nikon A1R confocal microscope. Labeled cells were counted by visual inspection of the full stack and summed per area over the five sections from each animal; counts thus represent the number of cells in a composite 300 μm section. Areal boundaries follow the designations in the Paxinos and Franklin atlas.
- https://cdn.elifesciences.org/articles/82412/elife-82412-fig1-data1-v2.xlsx
Figure 1—figure supplement 1
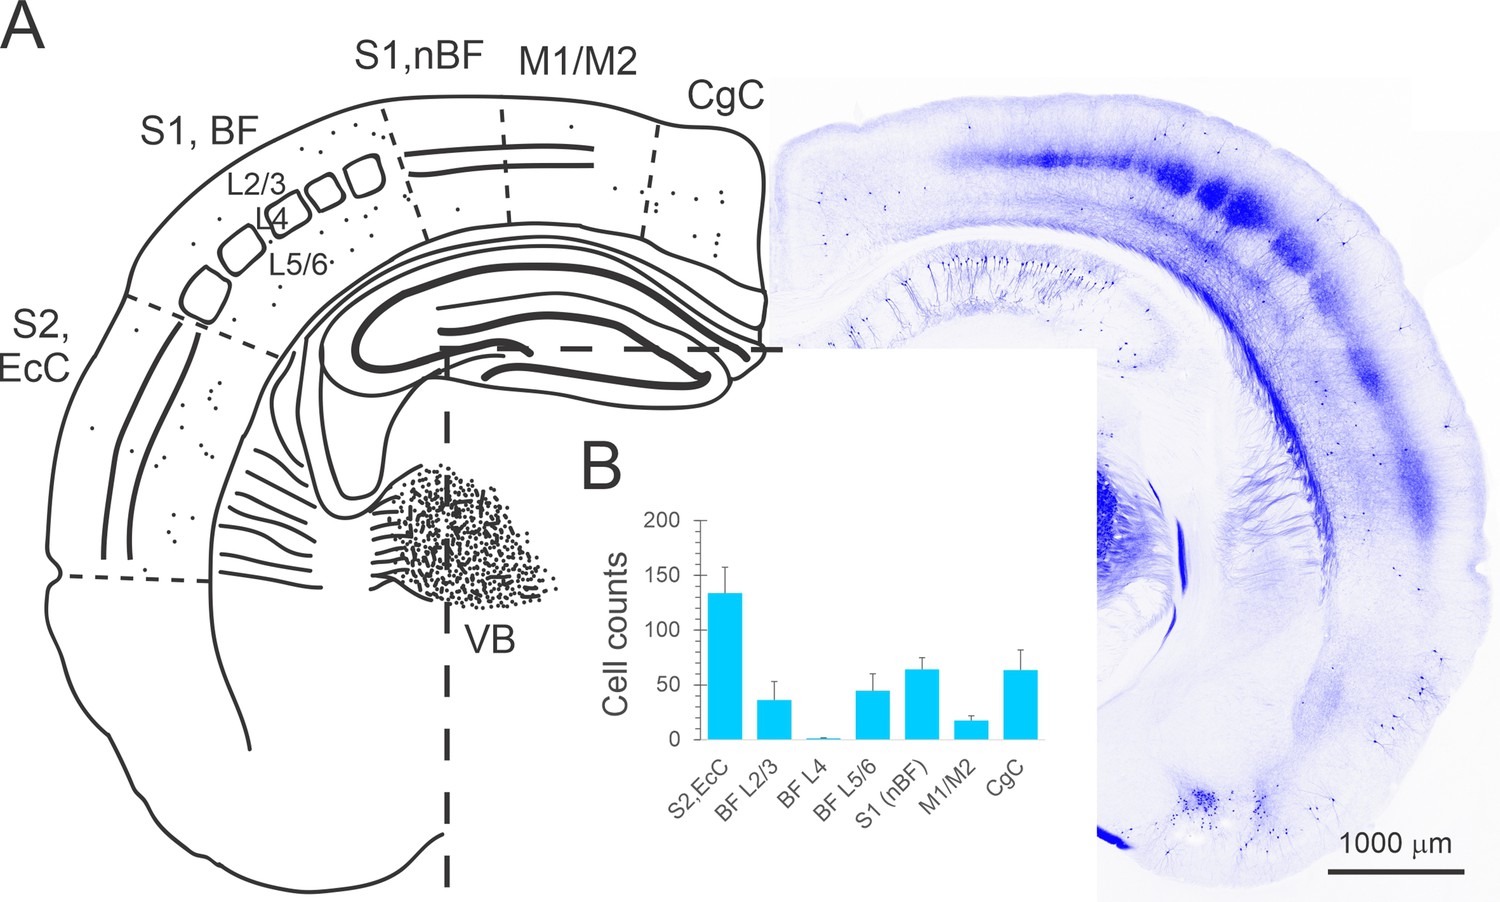
Cre-expressing neurons in the KN282 mouse.
(A) Right: a confocal projection of a representative 60 μm section through a KN282 × Ai9 brain, in which Cre-expressing neurons were detected by their tdTomato fluorescence. Left: an outline sketch of the same section with counted cells indicated as dots, and with the different areas and layers counted indicated. CgC, cingulate cortex. M1/M2, primary/secondary motor cortex (also including parietal association areas in some anteroposterior levels). S1, nBF, primary somatosensory cortex, non-barrel field areas (e.g. forelimb and trunk areas). BF, barrel field. S2, EcC, secondary somatosensory cortex and ectorhinal cortex (also including temporal association areas and secondary auditory cortex in some anteroposterior levels). VB, ventrobasal thalamus. (B) Average cell counts from four animals, summed over five 60 μm sections per animal, sampled at 240 μm intervals through the barrel cortex (for methods see Figure 1—source data 1). Error bars represent sample standard deviation. Raw counts data are provided in Figure 1—source data 1.
Figure 1—figure supplement 2
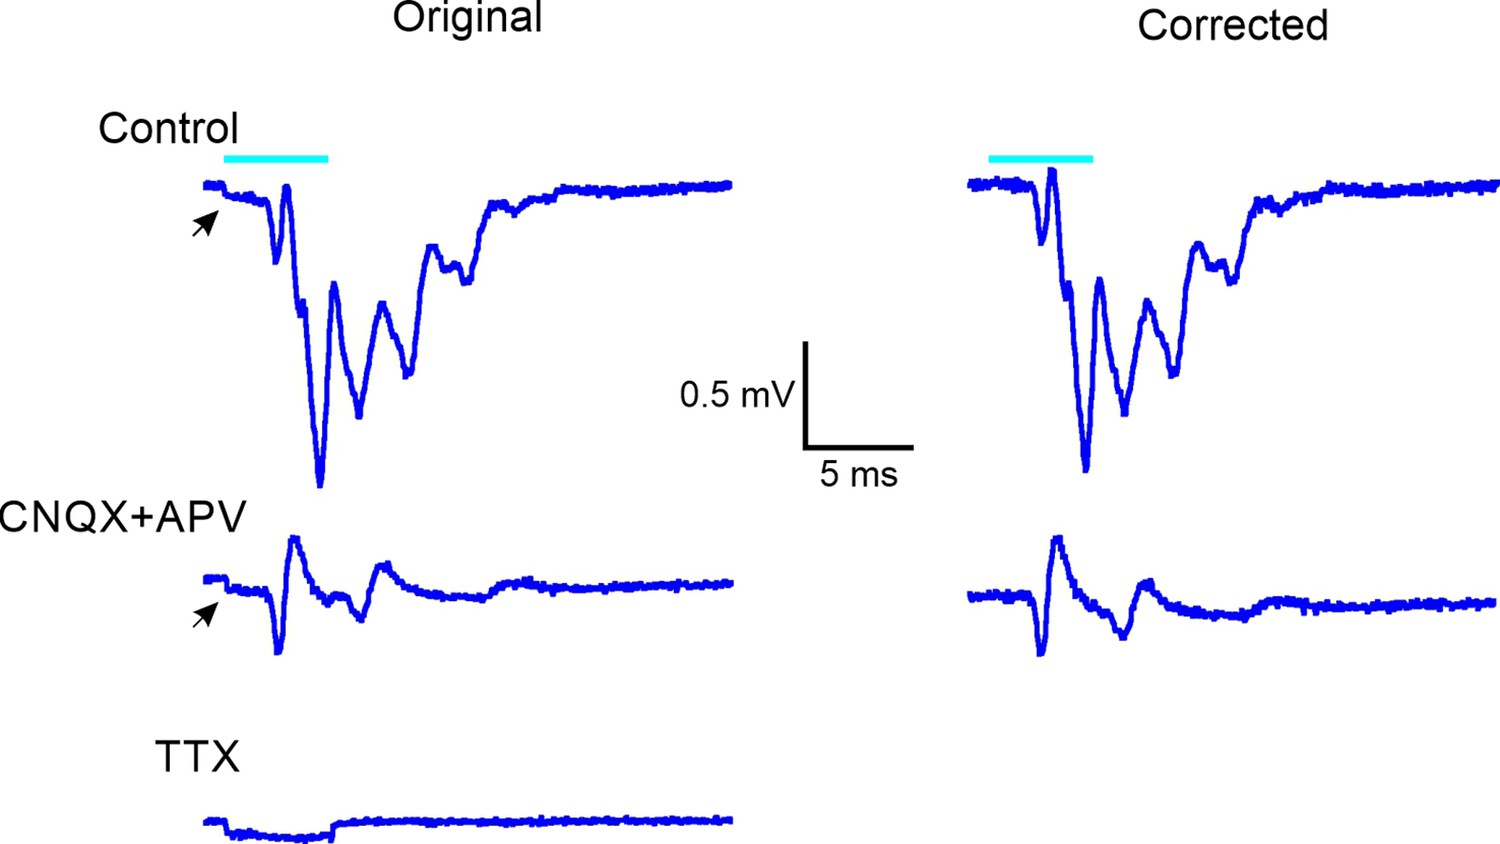
TTX blocks the extracellular thalamocortical volleys.
Left: averaged local field potential (LFP) in response to a 5 ms light pulse (cyan bar), (top) ripplets in control artificial cerebrospinal fluid (ACSF), (center) presynaptic thalamocortical volleys in the presence of blockers of fast glutamatergic excitation, and (bottom) stimulus artifact remaining in the presence of TTX. Right: the traces on the left after digital subtraction of the stimulus artifact.
Figure 2 with 2 supplements
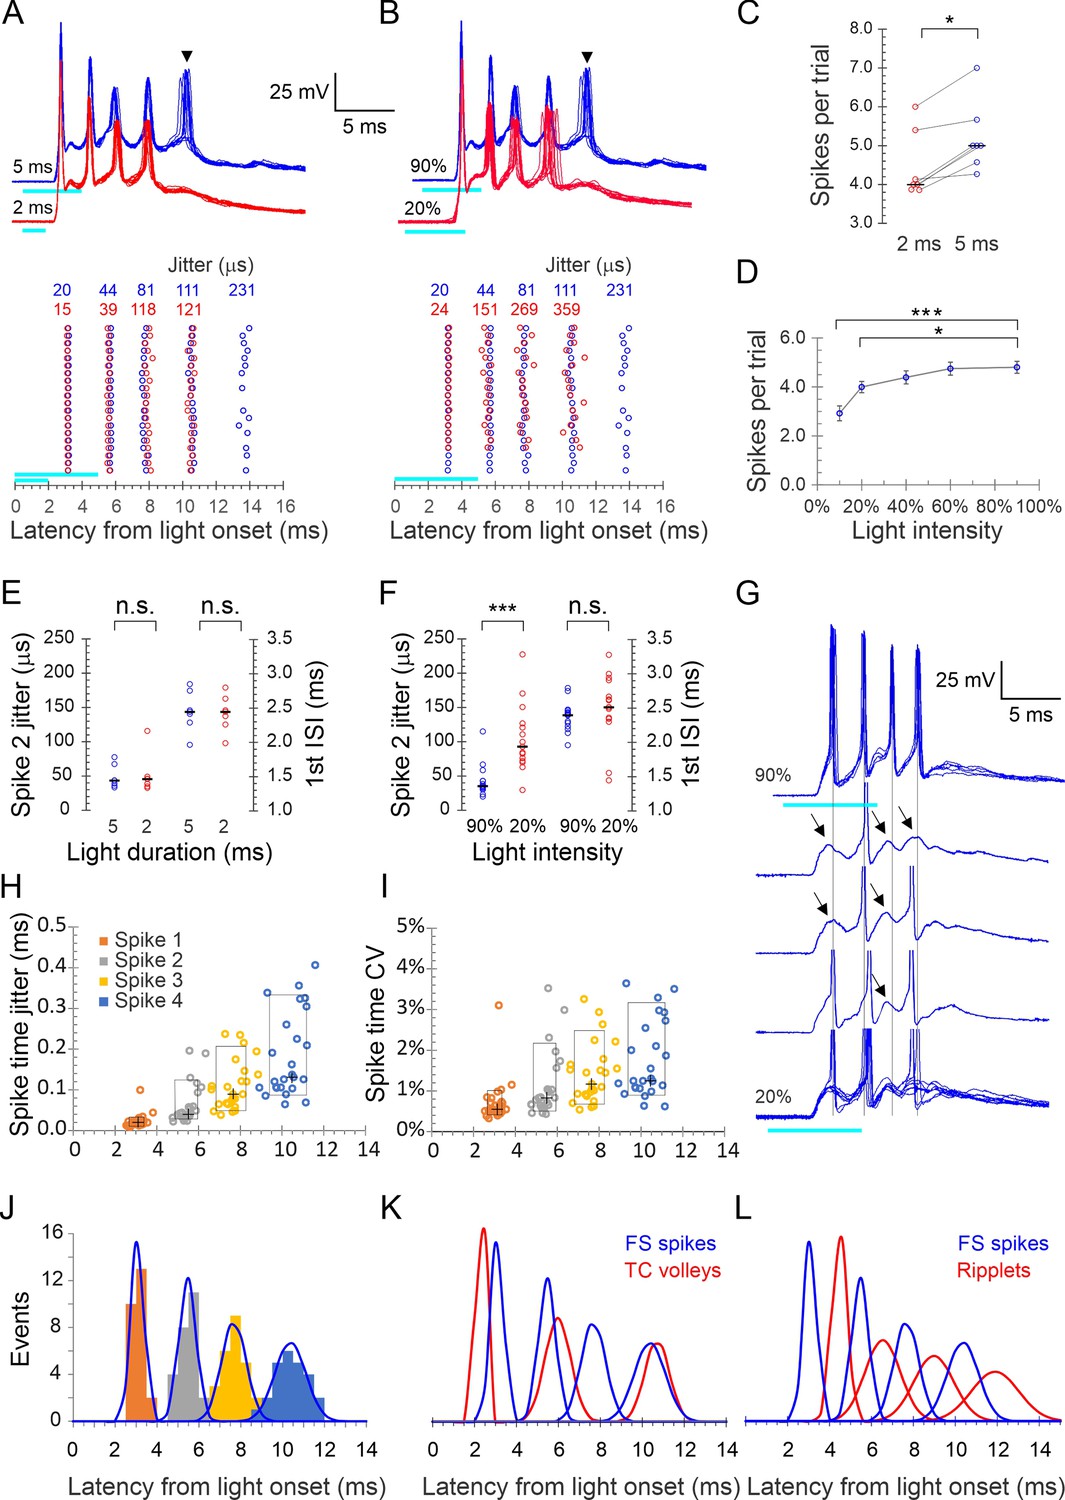
Precise light-induced spike bursts in fast-spiking (FS) interneurons.
(A) Upper panel: spike bursts evoked in an example L4 FS interneuron by 5 ms (blue traces) and 2 ms (red traces) light pulses (cyan bars) at 90% intensity; 10 consecutive sweeps repeated at 8 s intervals at each duration. Arrowhead indicates a late, low-reliability spike evoked by the longer light pulse. Lower panel: raster plots of 20 consecutive bursts from the same neuron, evoked by 2 and 5 ms pulses (red and blue symbols, respectively). Spike time jitters (SD of spike peak times), in μs, are indicated above the raster, in the respective colors. (B) As in (A) but for bursts evoked by 5ms light pulses at 20 and 90% intensities (red and blue traces and symbols, respectively). (C) Average number of spikes/stimulus in seven FS interneurons tested with both 2 and 5 ms light pulses. Medians indicated by horizontal black lines. *p=0.016, sign test. (D) The number of spikes/stimulus fired by 14 FS interneurons tested at 4–5 different light intensities. Error bars indicate SEM. ***p<0.0001; *p=0.02. (E) Jitter of the second spike in the burst, and the first interspike interval (ISI), compared between 5 and 2 ms light pulses, from the dataset of panel (C); n.s., not significant. (F) Same as (E), but comparing the lowest and highest light intensities from the dataset of panel (D). Note significant difference in spike jitter (***p<0.0001) but not ISI. (G) Another example cell stimulated at 90% intensity (upper trace, five superimposed sweeps) and at 20% intensity (lower traces, three single traces and eight superimposed sweeps). Note that at 20% intensity, spikes drop out sporadically and reveal subthreshold excitatory postsynaptic currents (EPSPs) (arrows), with little change in the temporal structure of the burst (vertical guidelines are aligned with the spikes at 90% intensity). (H) Spike times in all 25 FS cells with each spike order in a different color, plotted by its mean time measured from light onset (X axis) and by its jitter (Y axis); crosses indicate medians, boxes indicate 10–90th percentile range. (I) As in (H) but plotted along the Y axis by CV (jitter/mean spike time). (J) Histogram of all average spike times using the same color scheme as in (H); each peak in the histogram is overlaid by a Gaussian with the same mean, SD, and integral (blue curves). (K) The Gaussians from panel (J), representing FS spike bursts, superimposed with the Gaussian from Figure 1G representing thalamocortical spike volleys (blue and red curves, respectively). (L) The Gaussians representing FS spike bursts (blue) and those from Figure 1G representing ripplets (red) are superimposed; note the antiphase relationship between FS spikes and ripplets.
-
Figure 2—source data 1
Electrophysiological parameters of fast-spiking (FS) and regular-spiking (RS) neurons.
Analysis was done on a subset of 32 FS interneurons and 25 RS cells in slices from 25 and 22 animals, respectively, 3–6.5 weeks old (14 animals were common to both subsets). A total of eight electrophysiological parameters were analyzed per cell. Single-spike parameters were measured at rheobase (minimal current evoking an action potential). All current steps were 600 ms long.
Electrophysiological parameters definitions:
Vrest: resting potential upon break-in, with no holding current applied.
Vthreshold: the voltage where dv/dt = 5 V/s.
Spike height: Spike peak-Vthreshold.
Spike width at half-height (SWHH): spike width measured half-way between Vthreshold and spike peak.
After Hyperpolarization (AHP): Vthreshold -spike trough.
Input Resistance (Rin): the slope of the I-V plot, calculated from 4 to 6 positive and negative subthreshold current steps, at membrane potentials up to ±15 mV from rest.
Imax: the maximal current step applied before a noticeable reduction in spike height.
Fmax: the maximal steady-state firing frequency, computed as the reciprocal of the average of the last five interspike intervals (ISIs) in a spike train elicited by Imax.
- https://cdn.elifesciences.org/articles/82412/elife-82412-fig2-data1-v2.xlsx
Figure 2—figure supplement 1

Comparison of electrophysiological parameters of fast-spiking (FS) and regular-spiking (RS) neurons.
(A) Sub- and suprathreshold intracellular voltage responses (top and middle panels) to three levels of intracellular current steps (lower panel) in example FS and RS neurons. Note that FS cells achieved much higher steady-state firing frequencies, and that they required higher current steps compared with RS neurons reflecting their lower input resistance. (B) Single spikes plotted at an expanded timescale, revealing the pronounced difference is spike width and shape. (C) Input resistance (Rin) plotted against spike width at half-height (SWHH) in the analyzed subset of animals (for electrophysiological parameter definitions see Figure 2—source data 1). (D) Maximal firing frequency (Fmax) plotted against the current step (Imax) that was used to elicit it, in the same neurons as (C). The electrophysiological parameters of all neurons used for this figure are provided in Figure 2—source data 1.
Figure 2—figure supplement 2
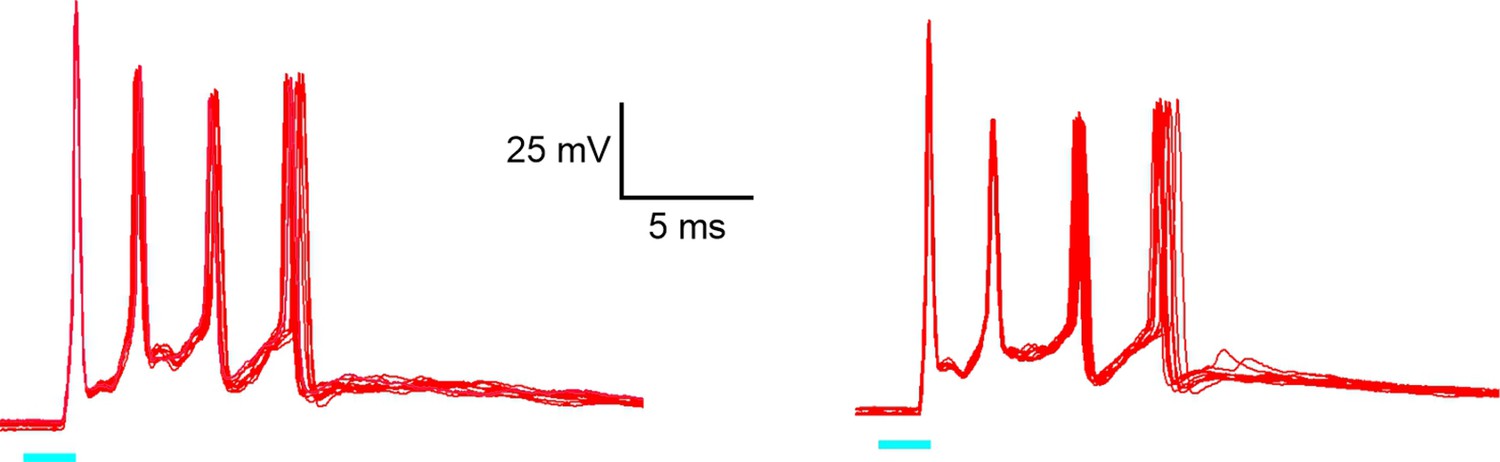
400 Hz spike bursts in infragranular fast-spiking (FS) interneurons.
Two example responses of two L5B FS interneurons to 2 ms, 90% intensity light pulses. Each trace consists of 10 superimposed consecutive sweeps. Light pulses are indicated by cyan bars below traces.
Figure 3
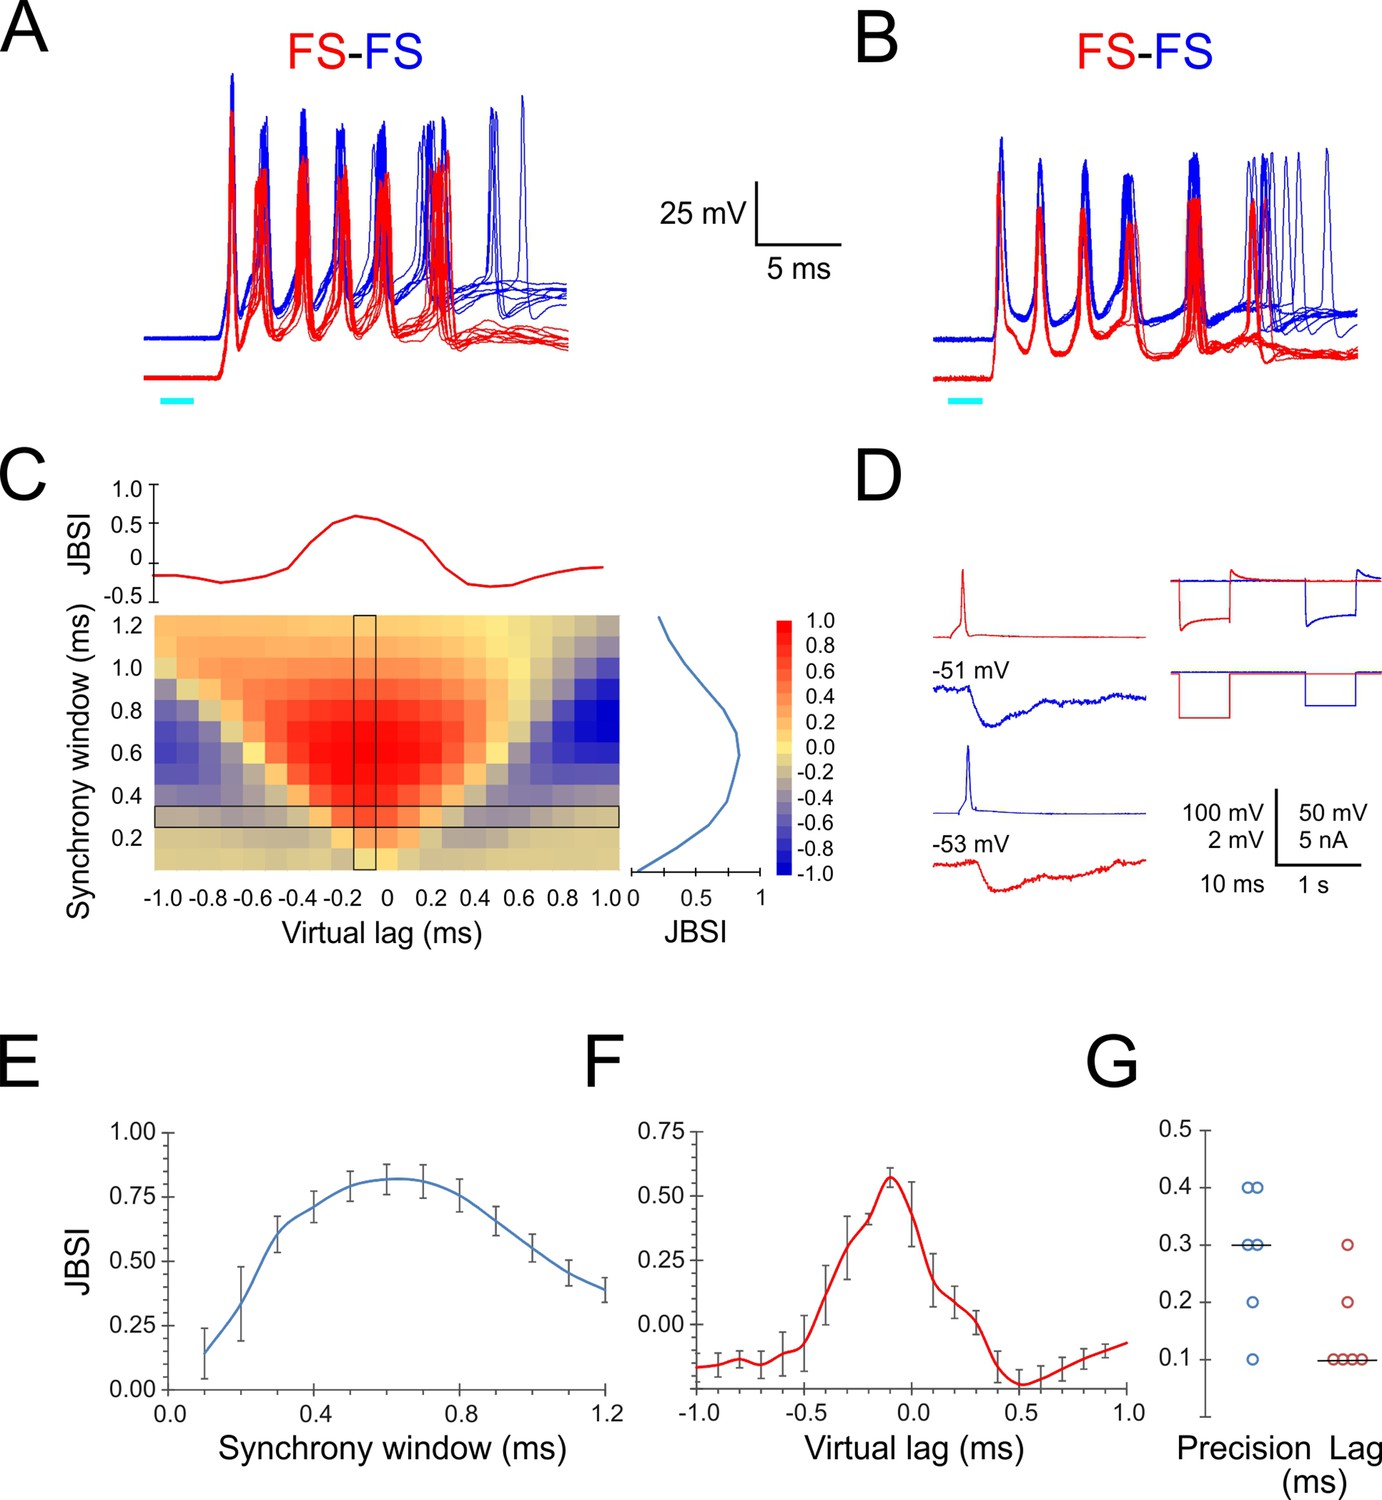
Precise firing synchrony between L4 fast-spiking (FS) cells.
(A, B) Simultaneously recorded spike bursts (eight superimposed sweeps each) from two example FS-FS pairs. Traces from the two cells are displaced vertically for clarity. (C) Heat map-coded matrix of Jitter-Based Synchrony Index (JBSI) values calculated from ~300 spikes from each FS cell in (A), for a range of synchrony windows (vertical axis) and virtual lags (horizontal axis) in 0.1 ms increments. The plots to the right and above the matrix are cross-sections along the column and row, respectively, indicated by a black border. The matrix element at the intersection corresponds to the smallest synchrony window with JBSI > 0.5 and the highest JBSI value along that row and was used to define the pairwise precision and lag of this pair. (D) Averaged traces of reciprocal unitary inhibitory postsynaptic potentials (IPSPs) between the two FS cells in (B, left), with holding potentials indicated, and a test for electrical coupling (right); coupling coefficient was 0.8%. (E) Average ± SEM of vertical cross-sections (as illustrated in C) through the JBSI matrices of 6 FS-FS pairs. (F) Same for horizontal cross sections. (G) Summary of pairwise precision and lag for the six FS-FS pairs; horizontal lines indicate medians.
Figure 4
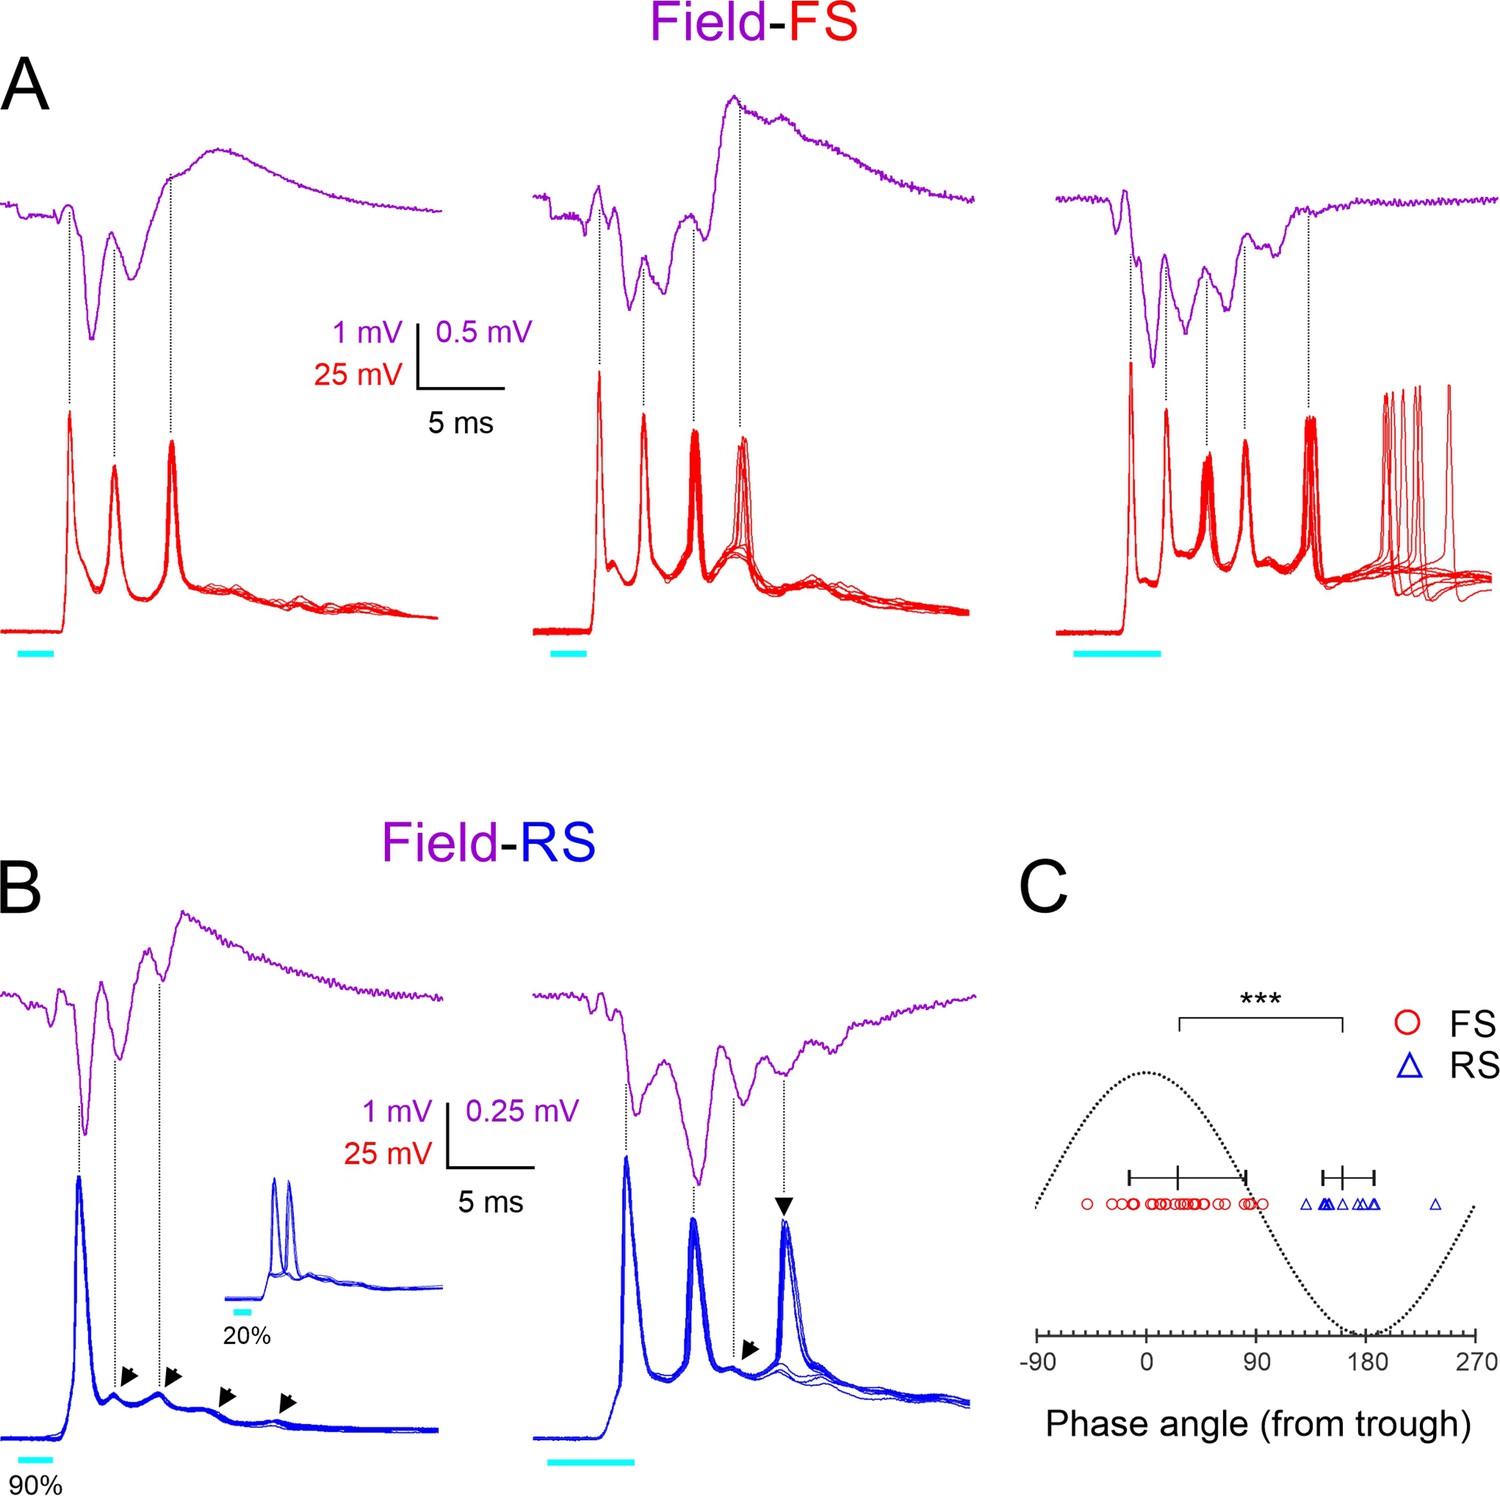
Phase-locking of fast-spiking (FS) and regular-spiking (RS) spikes to ripplets.
(A) Averaged ripplets (upper traces, magenta) and simultaneously recorded FS spike bursts (lower traces, superimposed consecutive sweeps, red) in response to 2 or 5 ms light pulses (cyan bars) in slices from three different animals. Vertical guidelines are aligned with FS spike peaks; note that FS spikes aligned with ripplet troughs. The leftmost two slices were not tested in TTX, and therefore the square-wave stimulus artifact is not subtracted and partially occludes the presynaptic volley. (B) As (A) but lower traces are from two RS cells. Slanted arrowheads in left panel point to subthreshold excitatory postsynaptic currents (EPSPs). Note that both RS spikes and EPSPs were aligned with ripplet peaks. Inset in left panel illustrates the same cell stimulated at a weaker light intensity, with the spike ‘hopping’ between the first and second EPSPs. Vertical arrowhead in right panel points to a late, low-reliability spike. (C) A phase plot with ripplet troughs and peaks designated as 00 and ±1800, respectively. FS and RS spike peaks are indicated by red circles and blue triangles, respectively. Horizontal lines with tick marks indicate medians and 10–90th percentile ranges, respectively. ***p<0.0001.
Figure 5 with 2 supplements
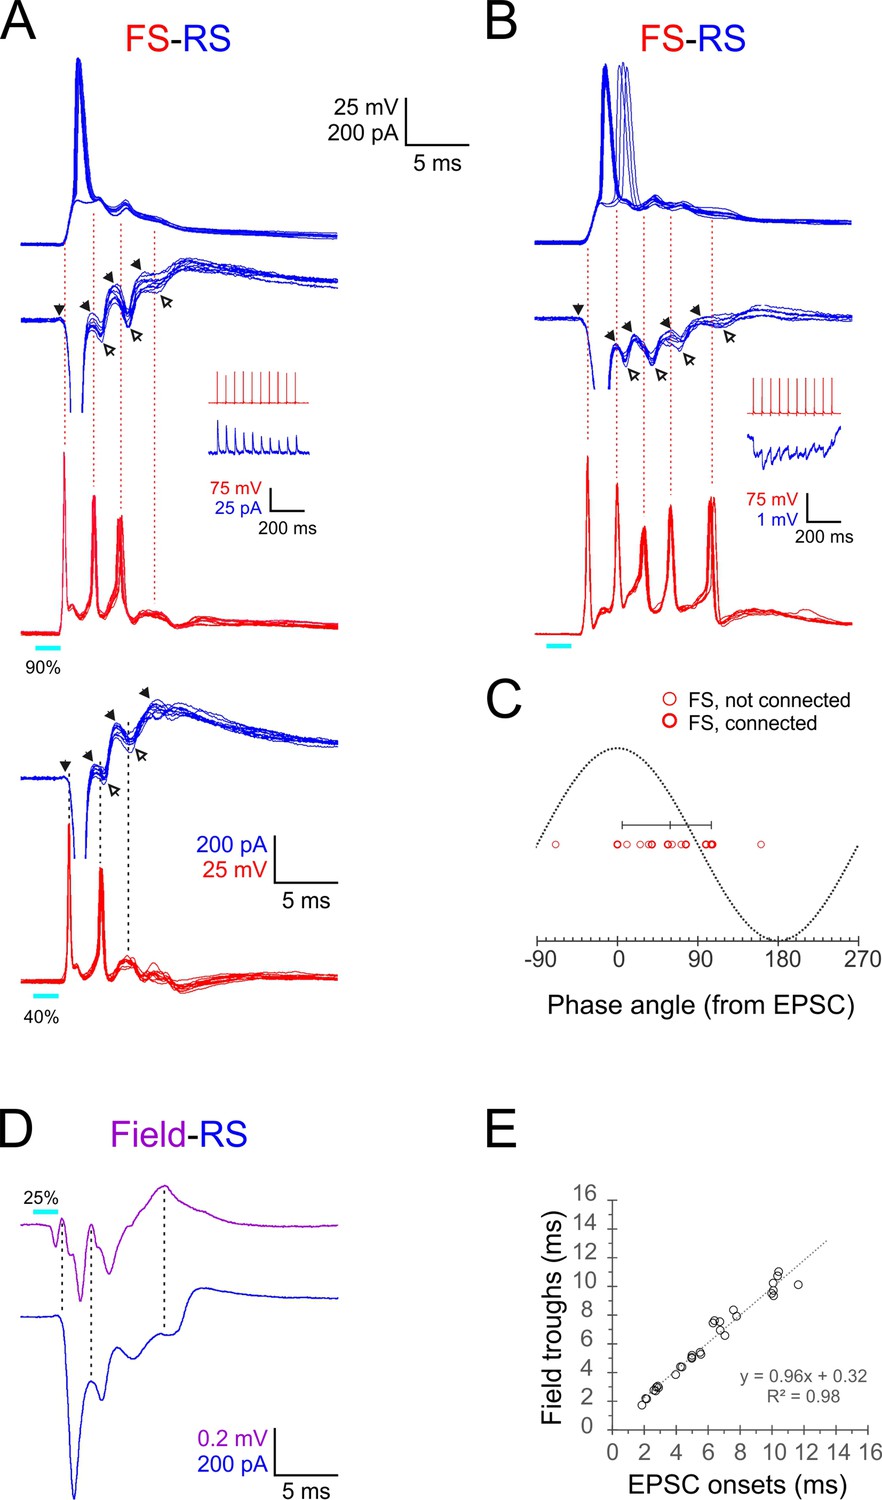
Phase-locking of E-I alternations in regular-spiking (RS) cells to fast-spiking (FS) spikes and ripplets.
(A, B) Superimposed FS spike bursts (red), simultaneously recorded voltage-clamped excitatory postsynaptic currents–inhibitory postsynaptic currents (EPSC-IPSC) alternations (middle traces, blue) and sequentially recorded current-clamp responses from paired RS cells (upper traces, blue), evoked by 2 ms light pulses (cyan bars under red traces) in two example FS-RS pairs. Note that the spike in the right RS cell ‘hops’ between the first and second EPSPs. Solid and empty arrowheads point to EPSC and IPSC onsets, respectively. The first IPSC in both RS cells is occluded by an unclamped spike. Vertical guidelines are aligned with FS spike peaks and illustrate that each FS spike immediately followed an EPSC and preceded an IPSC in the RS cell. Pair in (A) was also stimulated at a lower intensity (lower pair of traces), showing that IPSCs persisted even when FS spikes dropped out. Insets illustrate unitary IPSCs (A) and IPSPs (B) evoked in each RS cell by a 20 Hz train of spikes in the paired FS cell. (C) A phase plot of FS spikes relative to the EPSC-IPSC alternations in RS cells, with EPSC and IPSC onsets mapped to 00 and 1800, respectively. Phase angles of FS spikes (16 spikes from six pairs) are indicated by red circles, with heavier symbols corresponding to pairs with a direct FS→RS connection; vertical bar indicates median and 10–90th percentile range. (D) Averaged voltage-clamped response (blue) of an example RS cell recorded simultaneously with the averaged ripplet in the same barrel (magenta). Vertical guidelines illustrate the correspondence between ripplet troughs and EPSC onsets in the RS cell. (E) EPSC onset times plotted against ripplet trough time for eight RS cells in eight slices; equation and R2 value of regression line indicated.
Figure 5—figure supplement 1
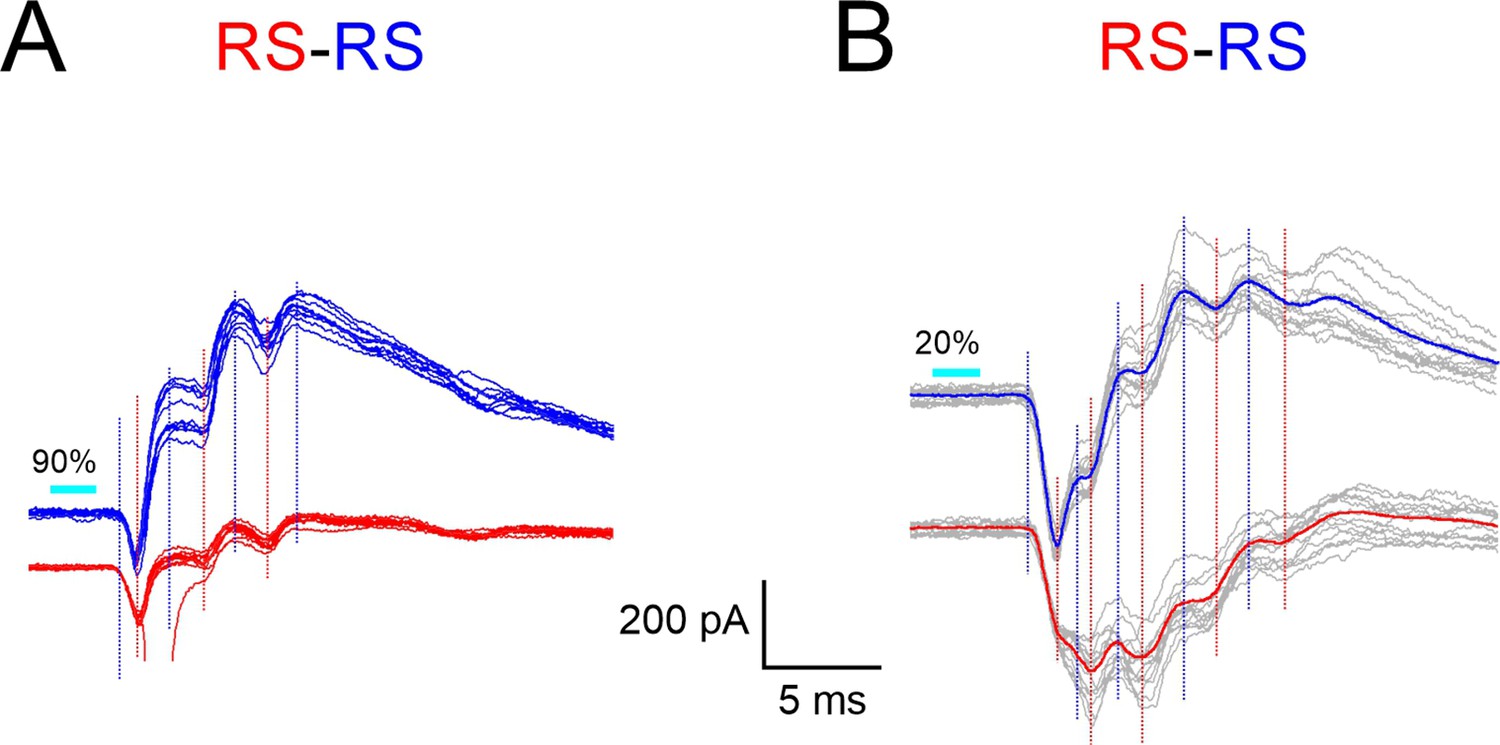
Synchronous E-I sequences in neighboring regular-spiking (RS) cells.
Example responses of RS-RS pairs to 2 ms light pulses, recorded in voltage-clamp mode at a holding potential of –50 mV. (A) 10 superimposed traces; note unclamped spike on one red trace. (B) Superimposed traces (in gray) overlaid with their averages (blue and red traces); stimulation intensity in this pair was reduced to minimize unclamped spikes. In both pairs, note regular alternations of synchronous excitatory postsynaptic currents (EPSCs) (negative deflections) and inhibitory postsynaptic currents (IPSCs) (positive deflections). Vertical blue and red guidelines indicate EPSC and IPSC onsets, respectively.
Figure 5—figure supplement 2
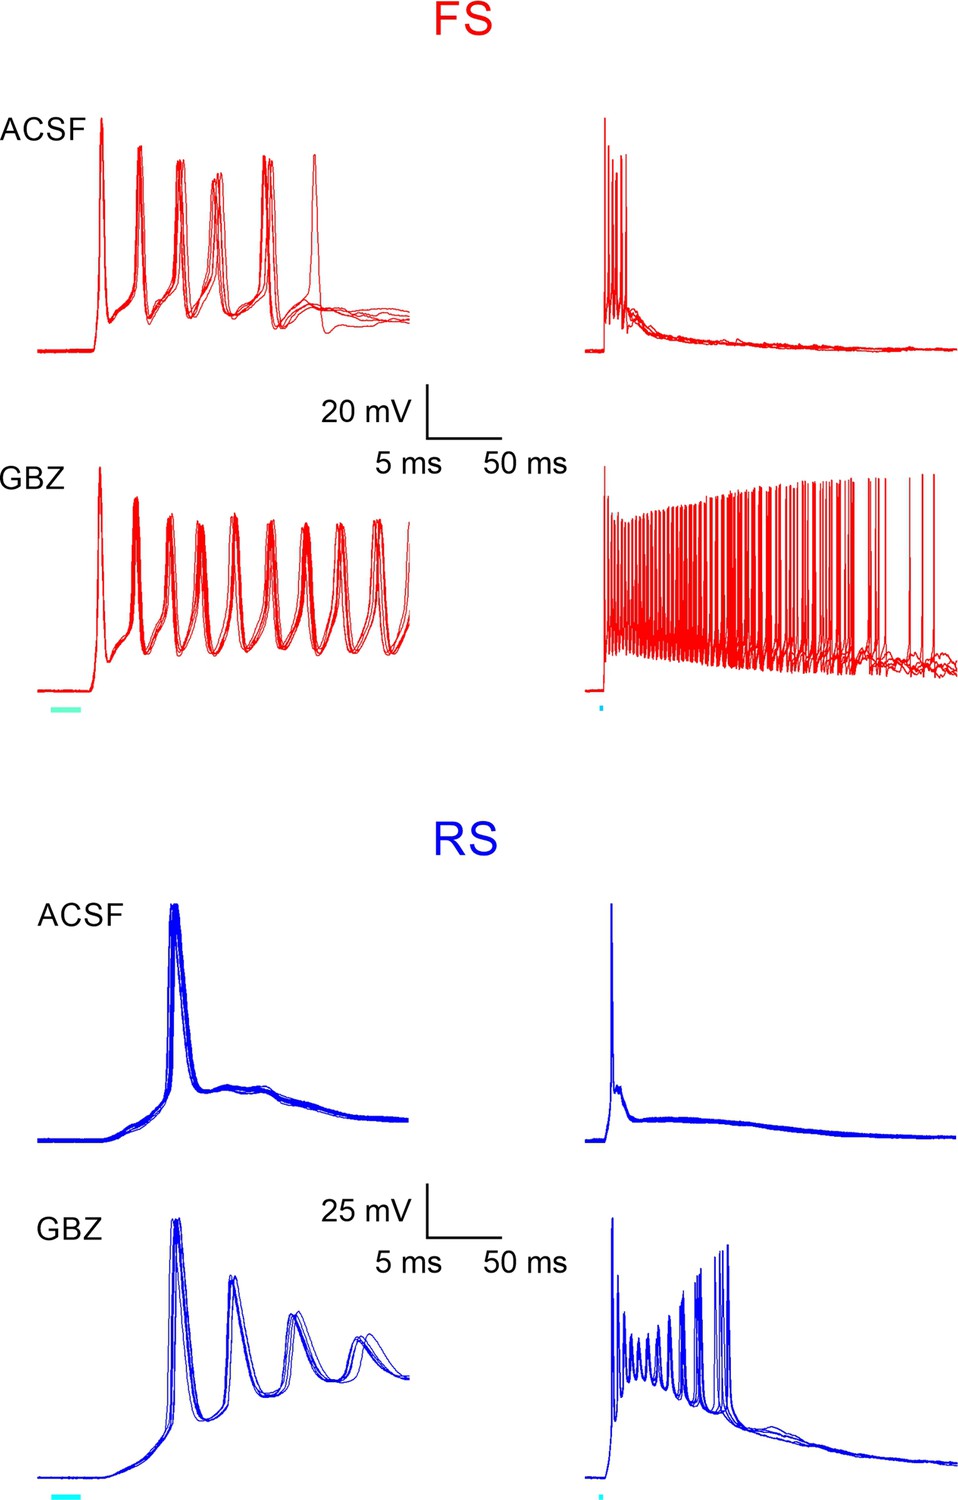
Ripplets convert to paroxysmal discharges under GABAA receptor block.
Responses to brief light pulses in an fast-spiking (FS) and regular-spiking (RS) cell, before and after local infusion of the competitive GABAA receptor antagonist gabazine (GBZ, 10 μM solution infused by positive pressure from an extracellular patch pipette). Each trace is an overlay of five consecutive responses, shown at a fast (left) and 10x slower (right) time base. Note that upon infusion of GBZ, ripplet-locked bursts were immediately converted to prolonged, high-frequency paroxysmal discharges. Similar responses were observed in a total of four FS and two RS cells tested in GBZ.
Figure 6
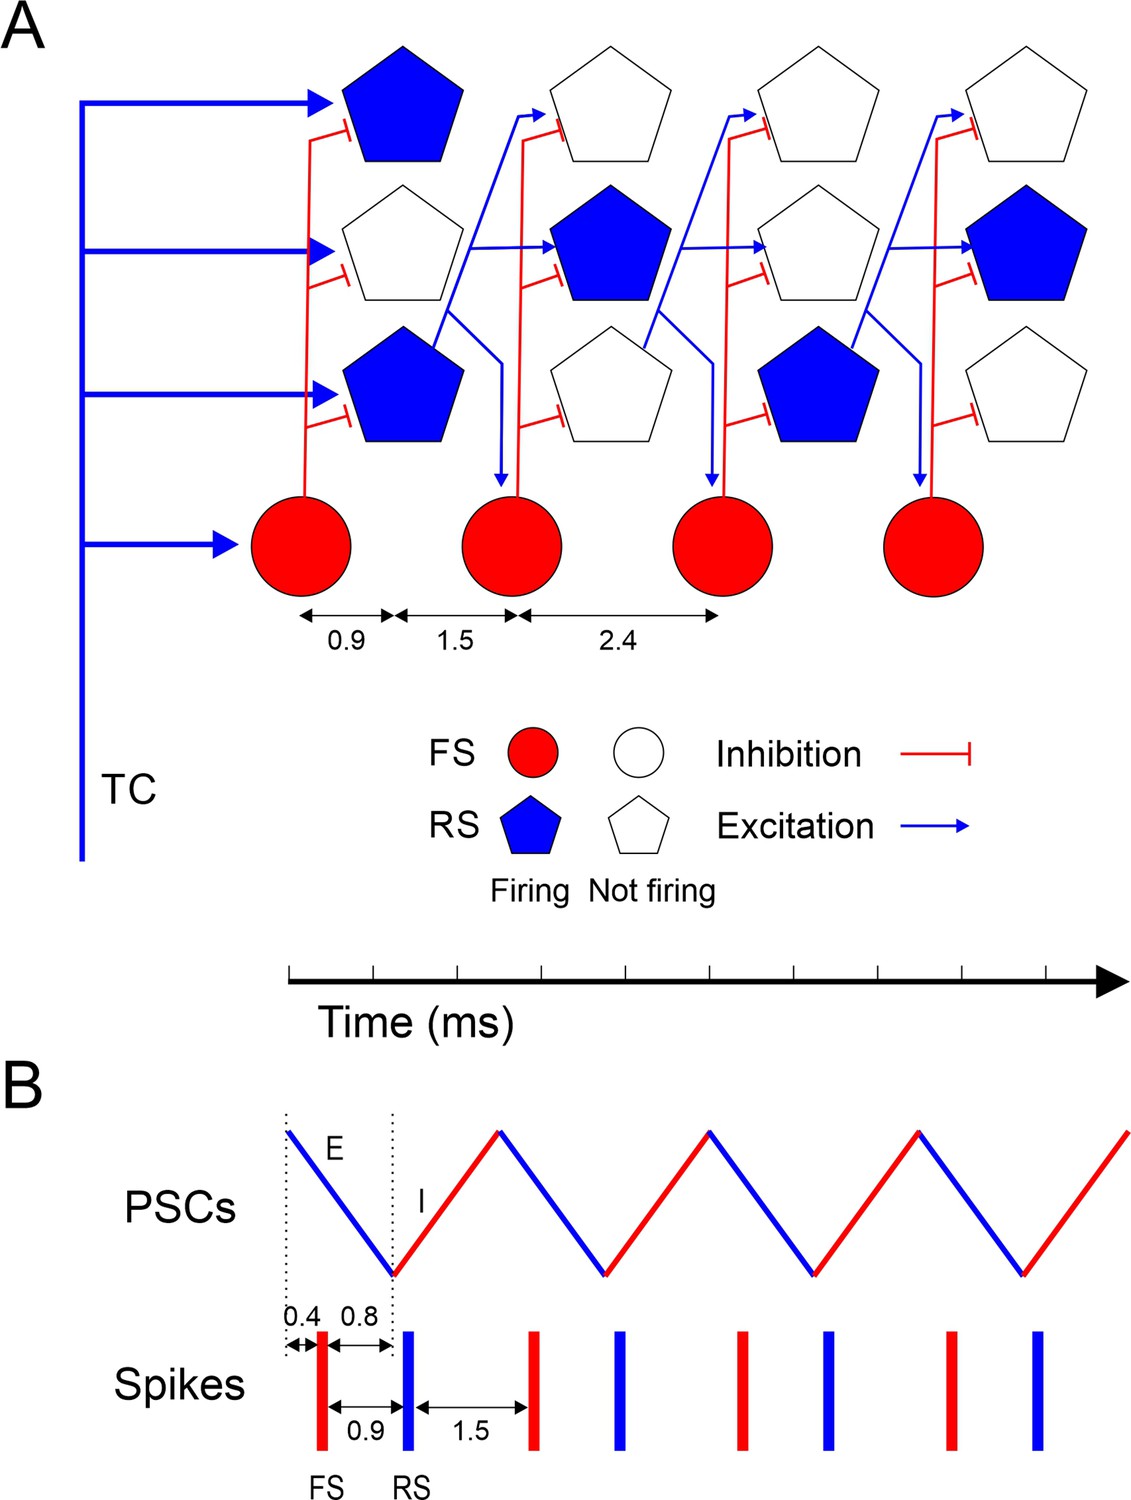
Model of ripplet generation.
(A) Diagram of the layer 4 circuit, illustrating one representative fast-spiking (FS) interneuron and three regular spiking (RS) cells at four successive time points, from left to right, representing the four cycles of the oscillation. Filled symbols represent cells firing, and their position along the horizontal axis represent spike time; hollow symbols represent cells that remain subthreshold. For clarity, only connections from one RS cell are depicted. A synchronous thalamocortical (TC) volley excites FS and RS cells in parallel; FS cells fire ~0.9 ms earlier because of the faster kinetics of their excitatory postsynaptic currents (EPSCs) and spikes. RS cells generate an excitatory feedforward cascade of successive spike volleys that elicit additional FS spike volleys. While FS cells fire on every cycle, RS cells typically fire on only 1–2 cycles per ripplet. The cycle period (2.4 ms) is the sum of the synaptic delay and the postsynaptic time-to-spike in RS cells. (B) A schematic timeline of the major events during a ripplet, including FS spikes (red bars), RS spikes (blue bars), and EPSC-IPSC sequences in RS cells (zig-zag line, E’s and I’s represented by blue and red segments, respectively.) FS cells receive EPSPs shared with RS cells; they fire 0.4 ms after EPSP onset and, in turn, elicit IPSPs in RS cells after a 0.8 ms delay, resulting in coincidence of IPSP arrival with onset of spikes in RS cells, enforcing firing synchrony on RS cells.
Tables
Key resources table
| Reagent type (species) or resource | Designation | Source or reference | Identifiers | Additional information |
|---|---|---|---|---|
| Strain, strain background (mouse, Mus musculus, both sexes) | KN282 | Mutant Mouse Resource and Research Center (MMRRC) | 036680-UCD | http://www.gensat.org/cre.jsp |
| Strain, strain background (mouse, M. musculus, both sexes) | Ai32 | The Jackson Laboratory | RRID:IMSR_JAX: 024109 | https://www.jax.org/strain/024109 |
| Strain, strain background (mouse, M. musculus, both sexes) | Ai9 | The Jackson Laboratory | RRID:IMSR_JAX: 007909 | https://www.jax.org/strain/007909 |
| Chemical compound, drug | CNQX | Tocris | Cat. no. 1045/1 | 20 μM |
| Chemical compound, drug | D-AP5 (APV) | Tocris | Cat. no. 0106/1 | 30 μM |
| Chemical compound, drug | Gabazine (SR 95531 hydrobromide) | Tocris | Cat. no. 1262/10 | 20 μM |
Additional files
Download links
A two-part list of links to download the article, or parts of the article, in various formats.
Downloads (link to download the article as PDF)
Open citations (links to open the citations from this article in various online reference manager services)
Cite this article (links to download the citations from this article in formats compatible with various reference manager tools)
Ultrafast (400 Hz) network oscillations induced in mouse barrel cortex by optogenetic activation of thalamocortical axons
eLife 12:e82412.
https://doi.org/10.7554/eLife.82412


