Mec1-independent activation of the Rad53 checkpoint kinase revealed by quantitative analysis of protein localization dynamics
- Department of Biochemistry, University of Toronto, Canada
- Donnelly Centre for Cellular and Biomolecular Research, University of Toronto, Canada
- The Weill Institute for Cell & Molecular Biology, Cornell University, United States
Figures
Figure 1
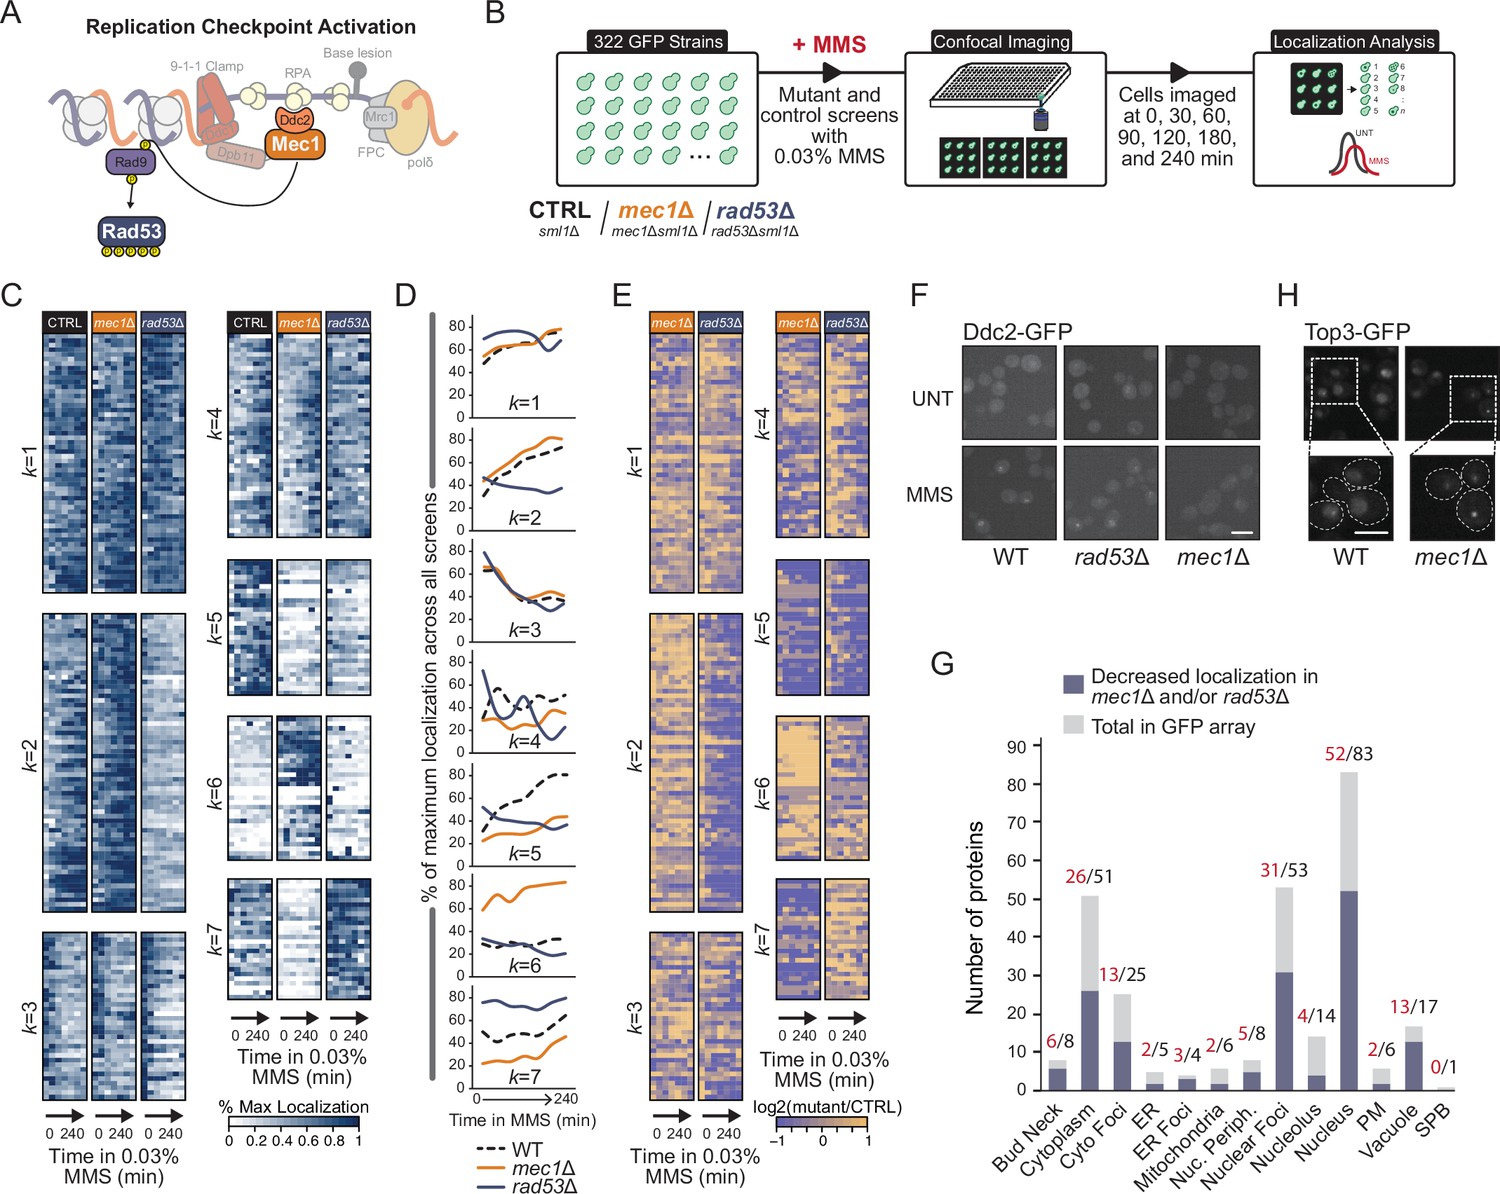
Checkpoint kinases Mec1 and Rad53 regulate protein re-localization.
(A) A simplified schematic of replication checkpoint activation in yeast. (B) Outline of the imaging and quantification pipeline used in this study. sml1Δ, mec1Δ sml1Δ, or rad53Δ sml1Δ deletions were introduced into 322 strains, each expressing a unique protein-GFP fusion. Strains were treated with 0.03% methyl methanesulfonate (MMS) and imaged at seven times over the course of 240 min. Resulting images were subsequently segmented, and cells with changes in protein localization were identified. (C) Heatmaps of the percent of maximum protein re-localization in MMS (% max) for the control, mec1∆, and rad53∆ screens. The resulting localization vectors were clustered into seven groups by k-means, with the k-group number indicated to the left of the heatmap. (D) Line plots of the mean extent of protein re-localization for each mutant screen at each time point for all proteins within each k-group. (E) The log2 ratio of the re-localization in mutant vs. control is displayed for each timepoint. (F) Representative images of Ddc2-GFP nuclear focus formation in WT, mec1Δ, and rad53Δ cells after 2 hr in 0.03% MMS. Scale bar is 5 µm. (G) The total number of proteins in each category of protein re-localization for all proteins assessed is shown in gray. The number of proteins with evidence of decreased protein re-localization rates in either mec1Δ or rad53Δ cells is shown in blue. (H) Representative images of Top3-GFP nuclear foci in wild type or mec1Δ cells in unperturbed conditions. Scale bar is 8 µm.
Figure 2 with 1 supplement
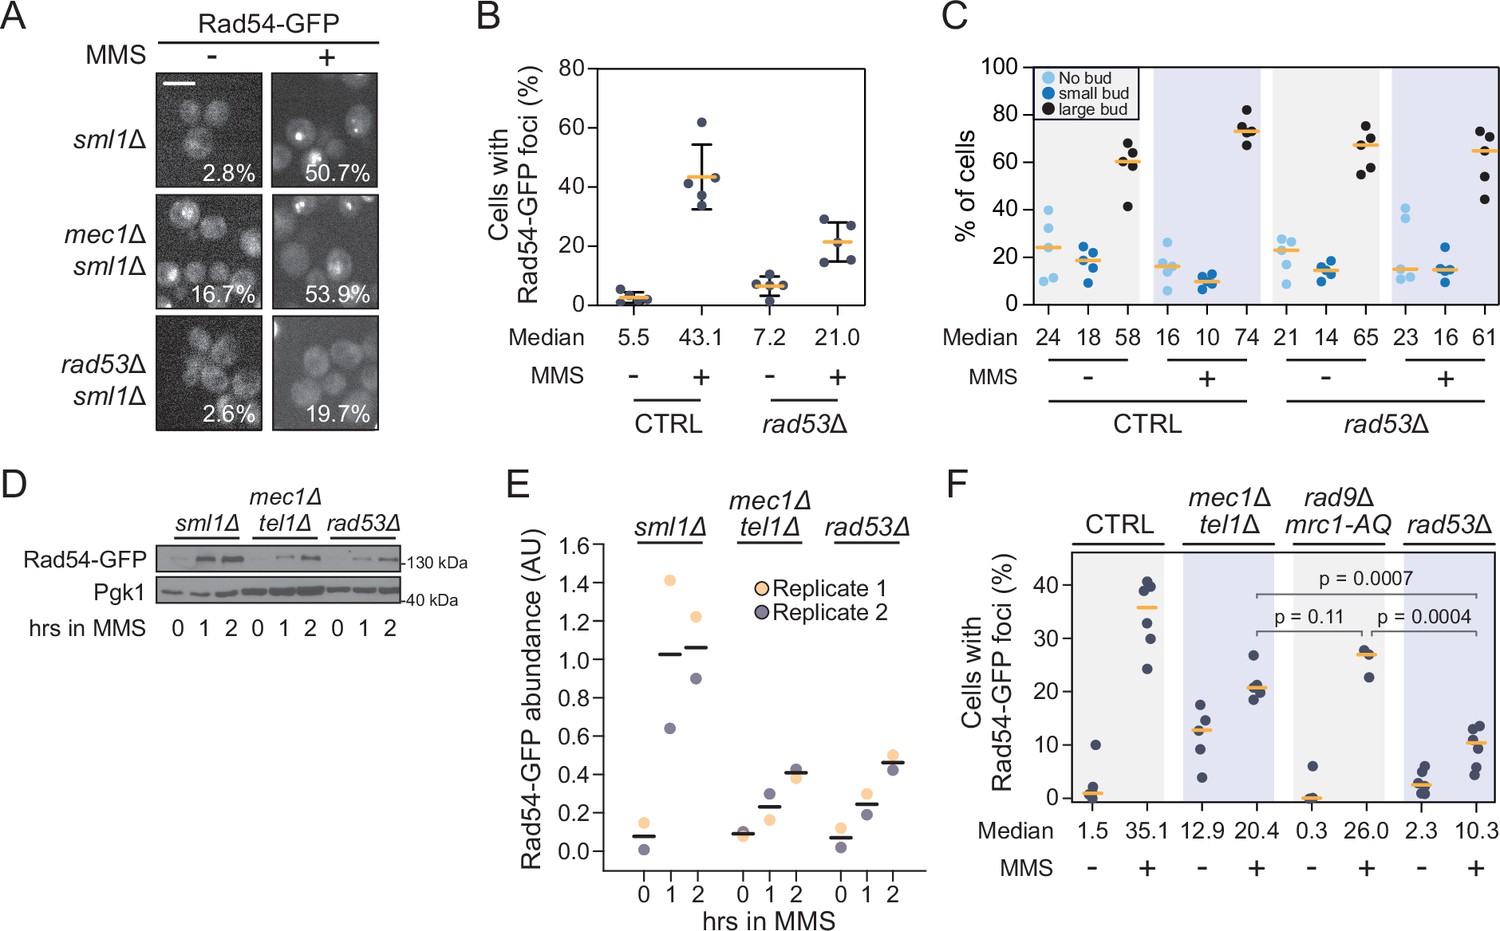
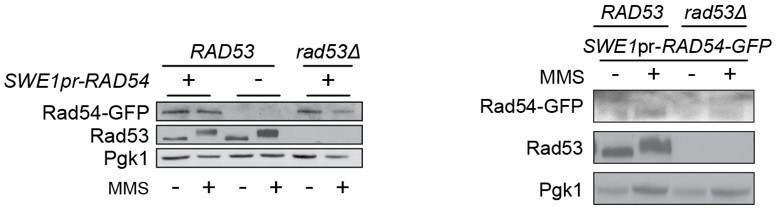
Rad54 nuclear focus formation requires Rad53 but not canonical checkpoint signaling.
(A) Representative images of Rad54-GFP focus formation in sml1Δ, mec1Δ sml1Δ, or rad53Δ sml1Δ cells treated with 0.03% methyl methanesulfonate (MMS) for 2 hr. The percent of cells with Rad54-GFP foci is indicated. Scale bar is 5 µm. (B) The percent of cells with at least one Rad54-GFP nuclear focus, either untreated or after 2 hr of 0.03% MMS treatment, is plotted for wild type and rad53∆. The median percent of cells with Rad54-GFP foci is indicated (n = 5). Error bars represent +/- one standard deviation. (C) The percent of unbudded, small-budded, and large-budded cells is plotted for wild type and rad53∆, for untreated and MMS-treated cells. The median percent of cells for each category is indicated (n = 5). (D) Rad54-GFP was expressed from the RAD54 promoter in the indicated checkpoint mutant strains. Mid-logarithmic phase cells were fixed at the indicated times following 0.03% MMS exposure. Cells were lysed and immunoblotted with anti-GFP or anti-Pgk1. (E) Densitometric quantification of Rad54-GFP protein in panel (D) and its replicate. Values are normalized to the Pgk1 loading control and expressed in arbitrary units (AU). Averages are indicated by the black horizontal bars. (F) Quantification of the percent of cells with at least one Rad54-GFP focus in each of the indicated strains, before and after 0.03% MMS treatment for 2 hr. The median percent is indicated (n ≥ 3). p-Values from a two-tailed t-test are indicated. For all plots, the orange horizontal bars indicate the medians.
-
Figure 2—source data 1
Original and labeled immunoblot images for Figure 2D.
- https://cdn.elifesciences.org/articles/82483/elife-82483-fig2-data1-v1.zip
Figure 2—figure supplement 1
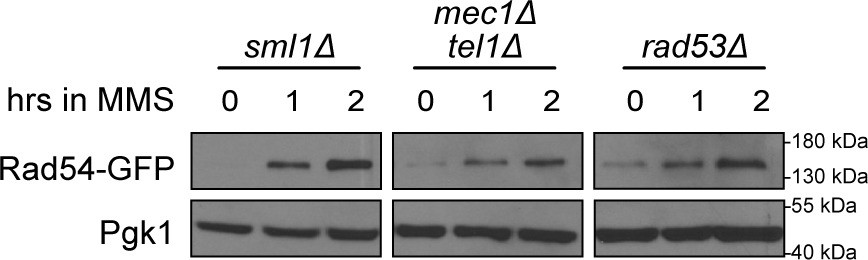
Replicate of the immunoblot in Figure 2D.
Rad54-GFP was expressed from the RAD54 promoter in the indicated checkpoint mutant backgrounds. Mid-logarithmic phase cells were fixed at the indicated times following 0.03% methyl methanesulfonate (MMS) exposure. Cells were lysed and immunoblotted with anti-GFP or anti-Pgk1.
Figure 3
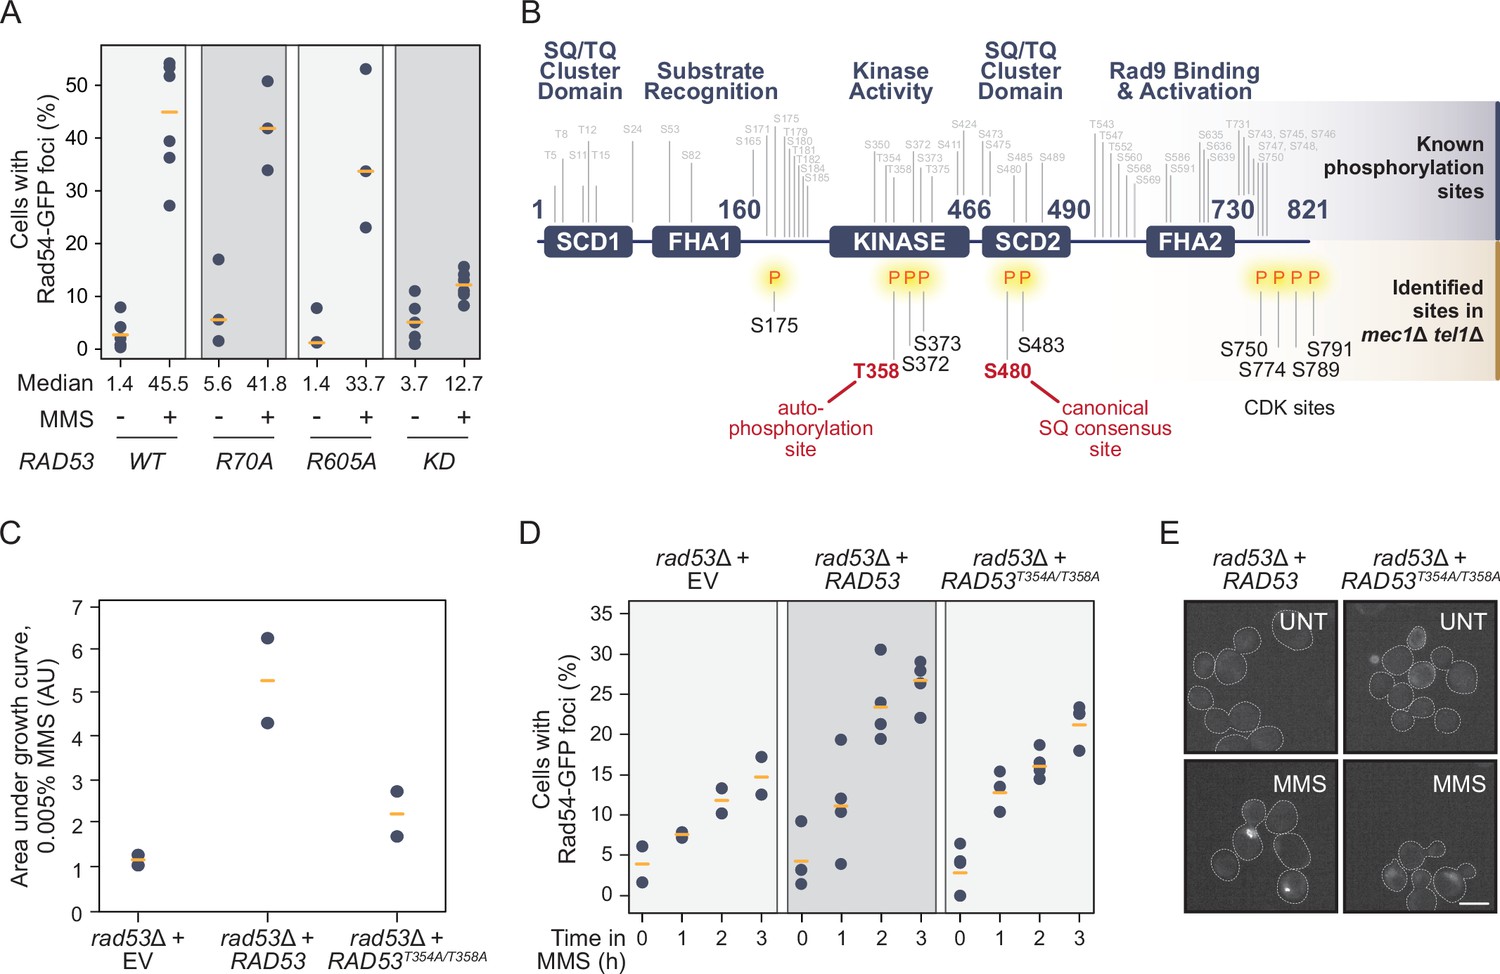
Rad53 is phosphorylated independent of Mec1/Tel1 and its kinase activity promotes Rad54 re-localization.
(A) The percent of cells with at least one Rad54-GFP nuclear focus is plotted for the strains expressing the indicated RAD53 alleles (KD = kinase dead = R70A, R605A), before and after 0.03% methyl methanesulfonate (MMS) treatment for 2 hr. The medians are indicated by the orange bars (n ≥ 3). (B) Schematic of the domain architecture of the Rad53 protein, with known phosphorylation sites annotated above in gray. Phosphorylation sites in mec1Δ tel1Δ cells identified by mass spectrometry are annotated below the schematic in black, with the two highlighted in red representing functional phosphorylation sites described in the literature. (C) The growth of rad53∆ strains expressing the indicated RAD53 alleles (EV = empty vector) was measured and the area under each growth curve is plotted (AU = arbitrary units). Orange bars indicate the medians (n = 2). (D) The percent of cells with at least one Rad54-GFP nuclear focus is plotted for rad53∆ strains expressing the indicated RAD53 alleles over 3 hr of 0.03% methyl methanesulfonate (MMS) treatment. Orange bars indicate the medians (n ≥ 2). (E) Representative fluorescence microscopic images of Rad54-GFP foci in rad53Δ strains expressing the indicated RAD53 alleles. Scale bar is 5 µm.
Figure 4
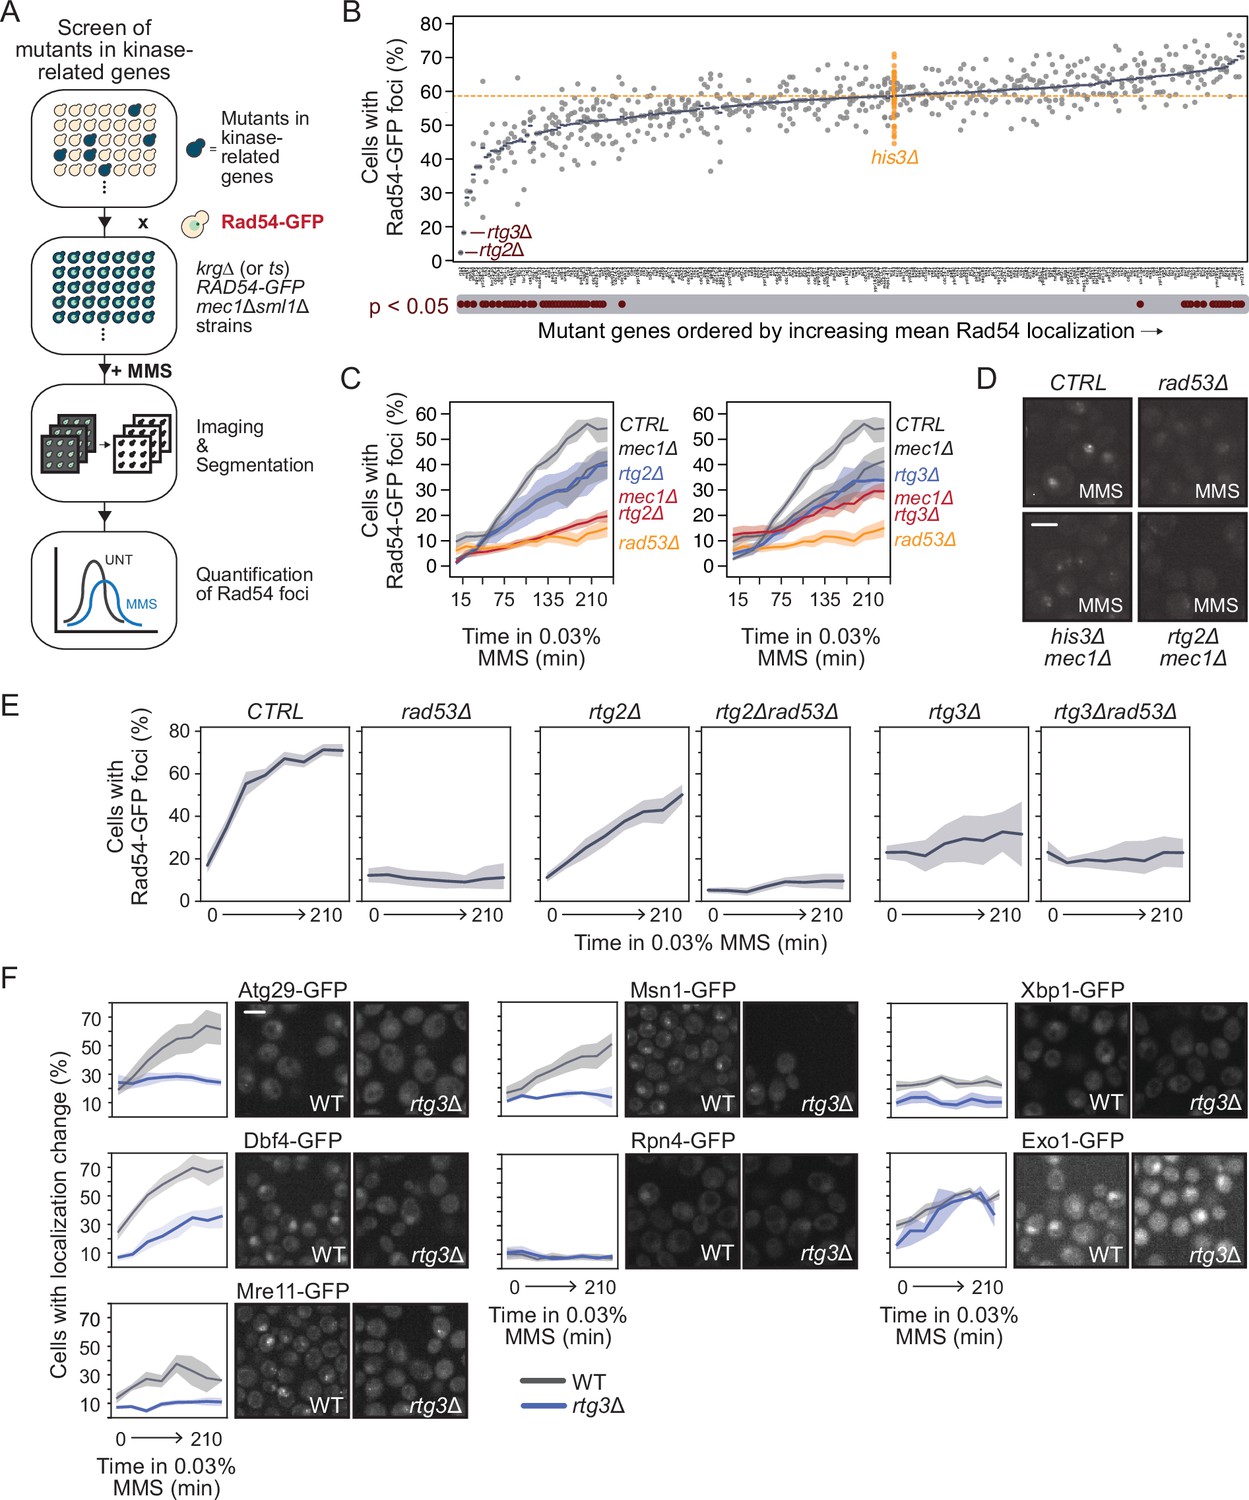
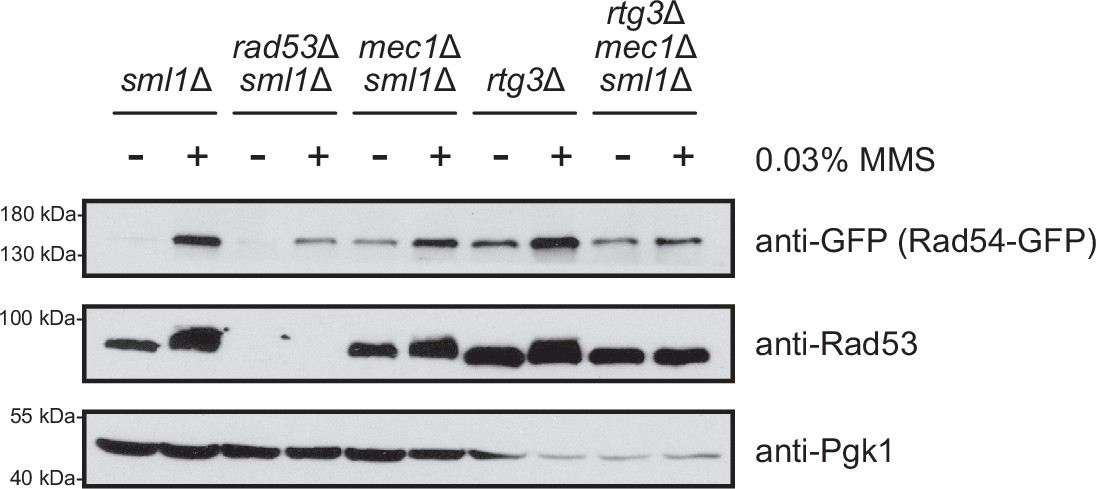
Retrograde signaling promotes Rad53-dependent Mec1-independent re-localizations.
(A) Outline of the imaging and quantification pipeline for the small-scale screen. Briefly, mec1Δ sml1Δ cells expressing Rad54-GFP from its native locus were crossed with an array of unique strains each with a mutation in a kinase-related gene (krg). The resulting krgmut RAD54-GFP mec1Δ sml1Δ strains were treated with methyl methanesulfonate (MMS) and imaged on a high-throughput confocal microscope. Resulting images were segmented and cells with changes in Rad54 localization were quantified. (B) The percent of cells with Rad54-GFP foci is plotted (gray circles, with blue bars indicating the means) for the indicated kinase-related gene mutants. The percent of cells with Rad54-GFP foci for 60 independent his3Δ strains is shown in orange, representing the wild-type control. Mutants with statistically supported (p<0.05) decreases or increases in Rad54-GFP foci compared to the his3Δ strains are indicated below the plot. The orange horizontal dotted line indicates the mean of the his3Δ strains. (C) The percent of cells with at least one Rad54-GFP nuclear focus is plotted for the indicated strains during 0.03% MMS treatment for the indicated times. The double mutants (rtg2∆ mec1∆ and rtg3∆ mec1∆) are shown in red. Orange bars indicate the medians (n = 3). (D) Representative images of Rad54-GFP foci in the indicated mutant strains. Scale bar is 5 µm. (E) The percent of cells with at least one Rad54-GFP nuclear focus is plotted for the indicated strains during 0.03% MMS treatment for the indicated times. Shaded regions indicate the 85% confidence interval. (F) RTG3 was deleted in strains expressing the indicated protein-GFP fusions whose localizations were found to be RAD53-dependent and MEC1-independent. Strains were imaged on a confocal microscope during treatment with 0.03% MMS. The percent of cells with a protein localization change is plotted for WT (gray) and rtg3∆ (blue) for each protein-GFP strain (left panels; shaded regions indicate the 85% confidence interval). Representative images of strains expressing the indicated proteins after treatment with 0.03% MMS for 2 hr are shown to the right of each plot. Scale bar is 5 µm.
Figure 5 with 1 supplement
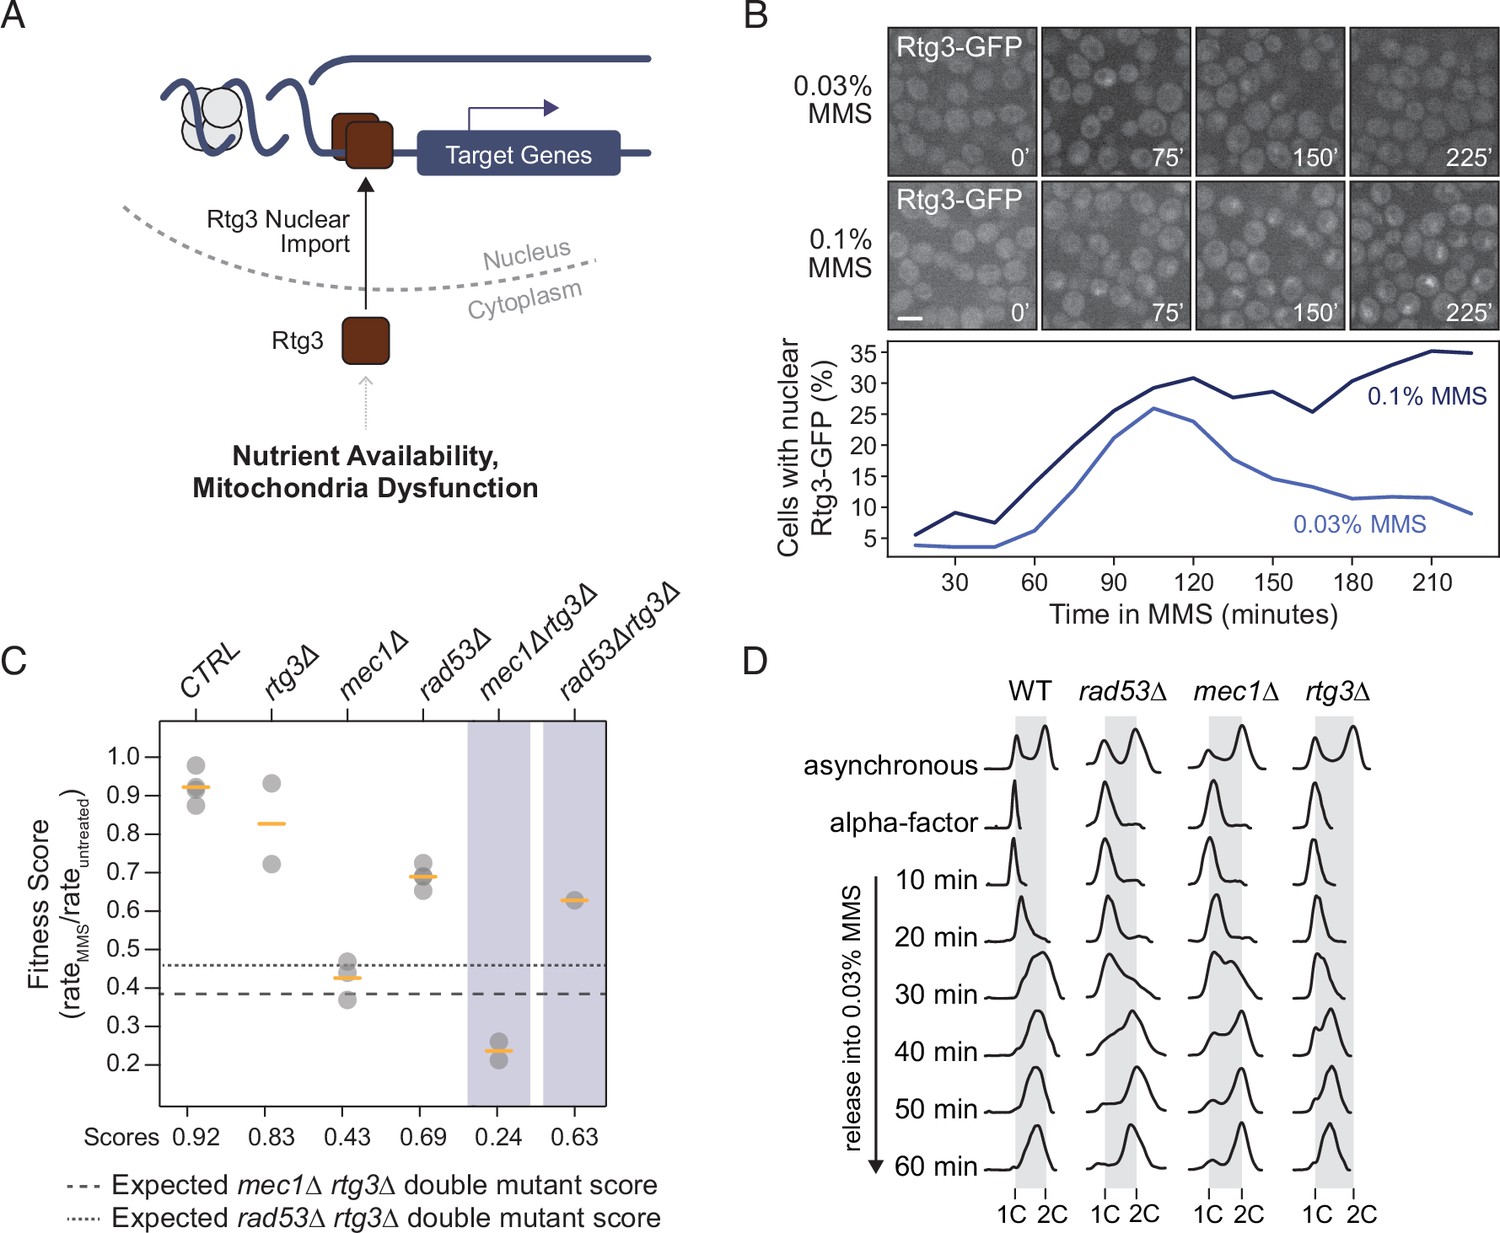
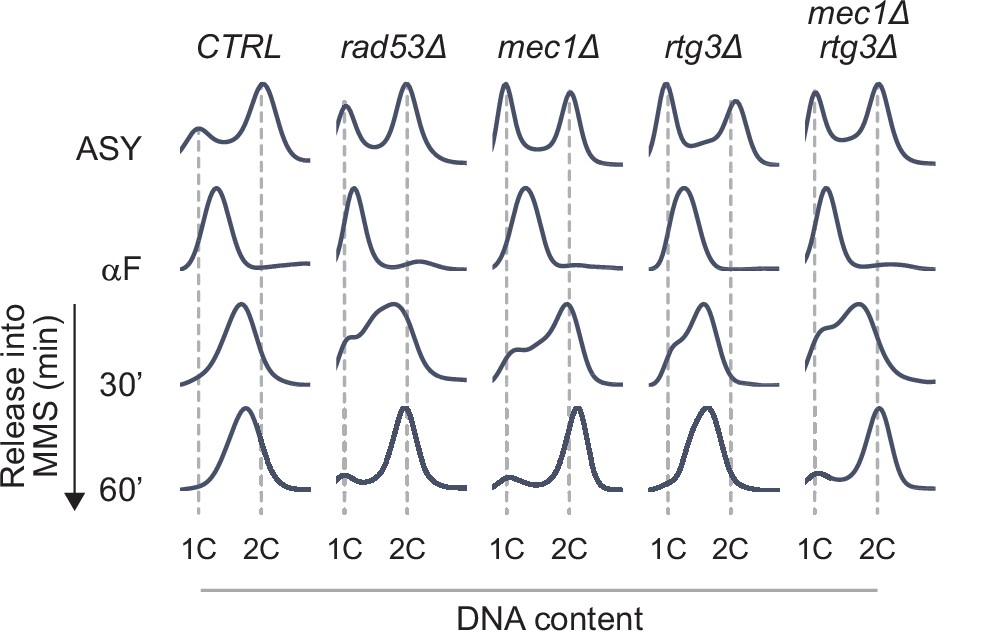
Rtg3 responds to DNA replication stress.
(A) Under conditions of nutrient limitation or mitochondrial dysfunction, Rtg3 enters the nucleus and upregulates stress response genes. (B) Representative images of Rtg3-GFP localization at the indicated times during treatment with methyl methanesulfonate (MMS) (above). The percent of cells with nuclear Rtg-GFP is plotted at the indicated times during MMS treatment (below). Scale bar is 5 µm. (C) Fitness scores for the indicated strains grown in 0.005% YPD liquid culture were calculated as growth rate in MMS divided by growth rate in untreated conditions and plotted. Means are indicated by the orange bars (n ≥ 2). Expected double mutant fitness scores (multiplicative model) are indicated by the dashed lines. (D) Flow cytometric analysis of the indicated strains. Cells were arrested in G1 phase with alpha-factor and released into 0.03% MMS. Samples were fixed at the indicated times, DNA contents were measured, and plotted as histograms with events plotted on the y-axis and fluorescence plotted on the x-axis. Positions of 1C and 2C DNA contents are indicated.
Figure 5—figure supplement 1
Replicate of the cell cycle analysis in Figure 5D.
Flow cytometric analysis of the indicated strains. Cells were arrested in G1 phase with alpha-factor and released into 0.03% methyl methanesulfonate (MMS). Samples were fixed at the indicated times, DNA contents were measured, and plotted as histograms with events plotted on the y-axis and fluorescence plotted on the x-axis. Positions of 1C and 2C DNA contents are indicated.
Figure 6 with 2 supplements
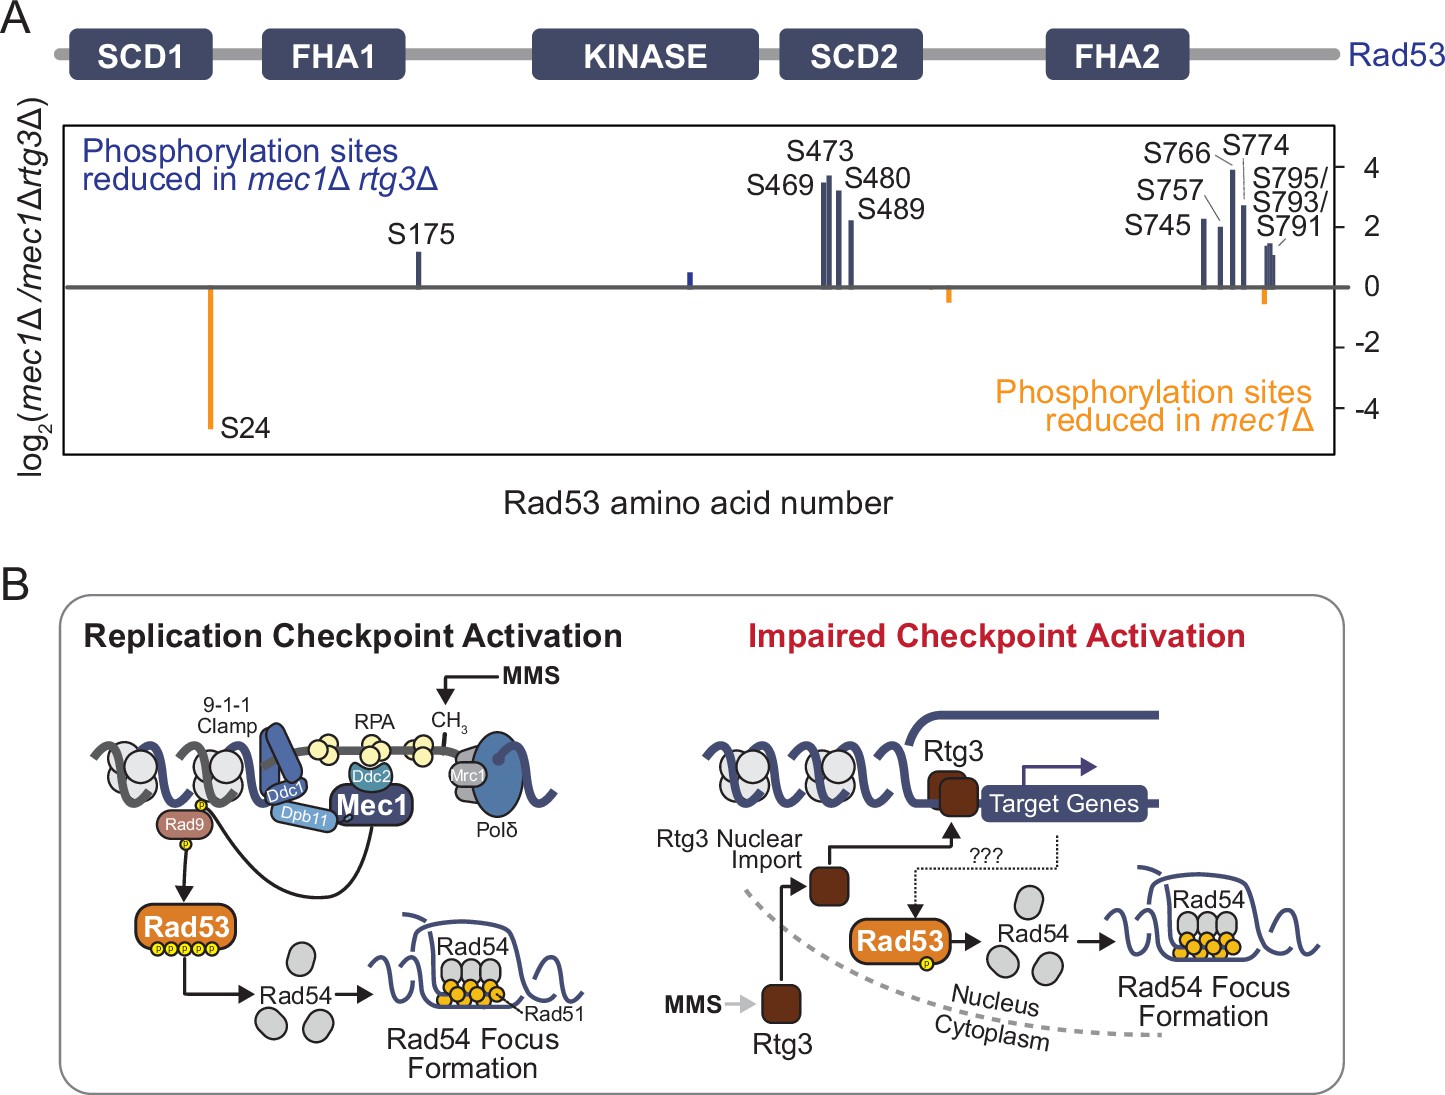
Rad53 phosphorylation is reduced when Rtg3 is absent.
(A) Rad53-FLAG was immunoprecipitated from mec1∆ sml1∆ cells with or without rtg3∆, phosphopeptides were enriched, and quantified by SILAC-MS. Phosphopeptides that are enriched or depleted in mec1∆sml1∆rtg3∆ cells are indicated in orange and blue, respectively. A schematic of the Rad53 protein and its domains indicates the location of the differentially phosphorylated sites. (B) A model for Rad53 activation in DNA replication stress when canonical checkpoint signaling is impaired in mec1∆ cells. Replication stress signals for the nuclear import of the Rtg3 transcription factor, resulting in gene expression changes. Target genes of Rtg3 promote Rad53 phosphorylation at functionally important residues, stimulating Rad53 activity, which is required for proper Rad54 focus formation.
Figure 6—figure supplement 1
rtg3 deletion does not alter the mobility shift of Rad53 observed in replication stress conditions.
Mid-logarithmic phase cells were fixed after 2 hr of 0.03% methyl methanesulfonate (MMS) exposure. Cells were lysed and immunoblotted with anti-GFP, anti-Pgk1, or anti-Rad53 antibody.
-
Figure 6—figure supplement 1—source data 1
Original and labeled immunoblot images for Figure 6—figure supplement 1.
- https://cdn.elifesciences.org/articles/82483/elife-82483-fig6-figsupp1-data1-v1.zip
Figure 6—figure supplement 2
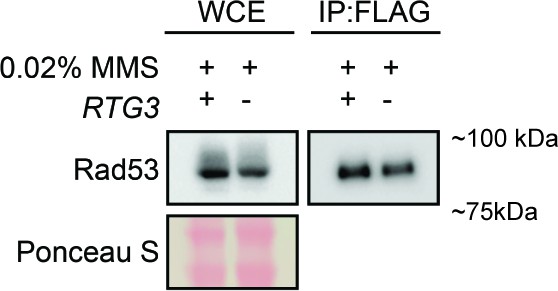
Immunoprecipitation of Rad53-FLAG for SILAC-MS.
Extracts (WCE) and anti-FLAG immunoprecipitates (IP:FLAG) prepared for SILAC-MS analysis were immunoblotted with anti-FLAG antibody to detect Rad53. The membrane was stained with Ponceau S as a loading control. Strains were mec1∆ sml1∆ (+) or mec1∆ sml1∆ rtg3∆ (-) and were treated with 0.03% methyl methanesulfonate (MMS) for 2 hr.
-
Figure 6—figure supplement 2—source data 1
Original and labeled immunoblot images for Figure 6—figure supplement 2.
- https://cdn.elifesciences.org/articles/82483/elife-82483-fig6-figsupp2-data1-v1.zip
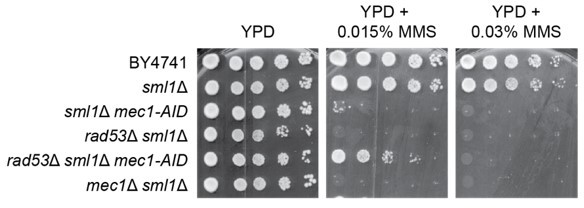
Author response image 1
Author response image 2
Additional files
-
Supplementary file 1
Complete array of GFP-tagged proteins analyzed in this study.
- https://cdn.elifesciences.org/articles/82483/elife-82483-supp1-v1.xlsx
-
Supplementary file 2
Percent of cells with protein re-localization in the control and checkpoint mutant screens.
- https://cdn.elifesciences.org/articles/82483/elife-82483-supp2-v1.xlsx
-
Supplementary file 3
Cells with protein re-localization (percent of maximum) in the control and checkpoint mutant screens.
- https://cdn.elifesciences.org/articles/82483/elife-82483-supp3-v1.xlsx
-
Supplementary file 4
Phosphorylated Rad53 peptides identified in affinity-purified Rad53-FLAG protein from mec1Δtel1Δ cells.
- https://cdn.elifesciences.org/articles/82483/elife-82483-supp4-v1.xlsx
-
Supplementary file 5
Percentage of cells with Rad54-GFP re-localization in mec1 deletion and kinase-related gene deletion double mutants.
- https://cdn.elifesciences.org/articles/82483/elife-82483-supp5-v1.xlsx
-
Supplementary file 6
Changes in Rad53 phosphorylation sites identified by SILAC mass spectrometry.
- https://cdn.elifesciences.org/articles/82483/elife-82483-supp6-v1.xlsx
-
MDAR checklist
- https://cdn.elifesciences.org/articles/82483/elife-82483-mdarchecklist1-v1.pdf
Download links
A two-part list of links to download the article, or parts of the article, in various formats.
Downloads (link to download the article as PDF)
Open citations (links to open the citations from this article in various online reference manager services)
Cite this article (links to download the citations from this article in formats compatible with various reference manager tools)
Mec1-independent activation of the Rad53 checkpoint kinase revealed by quantitative analysis of protein localization dynamics
eLife 12:e82483.
https://doi.org/10.7554/eLife.82483


