The impact of task context on predicting finger movements in a brain-machine interface
- Department of Biomedical Engineering, University of Michigan, United States
- Department of Electrical Engineering and Computer Science, University of Michigan, United States
- Department of Robotics, University of Michigan, United States
- Department of Neurosurgery, University of Michigan Medical School, United States
- Section of Plastic Surgery, Department of Surgery, University of Michigan, United States
Figures
Figure 1
Illustration of the behavioral task and context changes.
(A) Experimental setup during manipulandum control and brain-machine interface (BMI) control experiments. The monkey individuates their index and middle-ring-small finger group, moving each in the manipulandum in order to acquire targets on the screen in front of them. During this task, neural activity and finger positions are both recorded. A model relating neural activity to intended finger movements can be trained and then used in real time to control the virtual hand in front of them. (B) Illustration of the possible finger movements. For 2-degree-of-freedom (2-DOF) movements, the index flexion is represented on the x-axis and MRS flexion is represented on the y-axis. In some tasks the monkeys also did a 1-DOF movement, which required flexing or extending all fingers together. (C) To alter the context of the task, the manipulandum could be rotated so that the wrist was flexed and torsion springs could be added to the underside of the finger doors. The torsion springs were at rest when the finger doors were at full extension and thus resisted flexion and assisted with extension.
Figure 2
The impact of context changes on kinematics and muscle activation.
(A) Trial-averaged traces of index finger position and index finger flexion velocity for an example 1-degree-of-freedom (1-DOF) spring session with Monkey N. Trials are aligned to peak movement (vertical gray line). Black traces are normal trials, blue are trials with springs in the manipulandum, solid traces are for flexion trials, and dotted traces are for extension trials. Shaded area shows one standard deviation. (B) Trial-averaged traces of flexor digitorum profundus (FDP) muscle activation and extensor digitorum communis (EDC) muscle activation for an example spring session with Monkey N. Formatted the same as (A). (C) Change in peak velocity between normal trials and trials with either springs present or the wrist flexed for both Monkey N (left) and Monkey W (right). Trials are split by movement direction, either flexion or extension. Error bars indicate 99% confidence interval based on a two-sample t-test. (D, E) Change in average muscle activation in a window around peak movement between normal trials and trials in the spring (blue) or wrist context (yellow) for all eight muscles recorded in Monkey N. Trials are split between flexion (D) and extension (E) movements. Error bars indicate 99% confidence interval based on a two-sample t-test.
Figure 3
Offline predictions of muscle activations.
(A) Recorded and predicted muscle activation traces for flexor digitorum profundus (FDP) muscle (top half) and extensor digitorum communis (EDC) muscle (bottom half) from one example session with Monkey N. Traces are aligned to peak movement and averaged over trials to the same target, shading represents one standard deviation. Predictions are from a model trained only on normal trials and the model is evaluated either on normal trials (top) or trials with springs present (bottom). r indicates the linear correlation coefficient between recorded and predicted muscle activations using all trials in the specified context for that session, excluding the normal context trials used for training the model where applicable. IF – index flexion, MF – MRS flexion, F – both fingers flexion, IE – index extension, ME – MRS extension, (E) – both fingers extension. (B) Change in prediction mean-squared error (MSE) when a model trained on normal trials is evaluated on trials in a different context. Color indicates which context is being tested, yellow is wrist, blue is spring, and both is red. Each dashed line and pair of dots represent one session during which the same model was used for both measurements. Error bars on the dots indicate one standard deviation for model performance calculated with 10-fold cross-validation. (C) Same as (B) but model performance is measured with prediction correlation.
Figure 4
Offline predictions of kinematics.
(A) Recorded and predicted position traces for index finger position (top) and middle-ring-small (MRS) finger group position (bottom), averaged across all trials toward each target. Shading represents one standard deviation. Predictions are from a model trained only on normal trials and the model is evaluated either on normal trials or trials with springs present. r indicates the linear correlation coefficient between recorded and predicted finger positions using all trials in the specified context for that session, excluding the normal context trials used for training the model where applicable. (B) Change in prediction mean-squared error (MSE) when a model trained on normal trials is evaluated on trials in a different context. Color indicates which context is being tested, yellow is wrist, blue is spring, and both is red. Each dashed line and pair of dots represent one session during which the same model was used for both measurements. Error bars on the dots indicate one standard deviation for model performance calculated with 10-fold cross-validation. (C) Same as (B) but model performance is measured with prediction correlation.
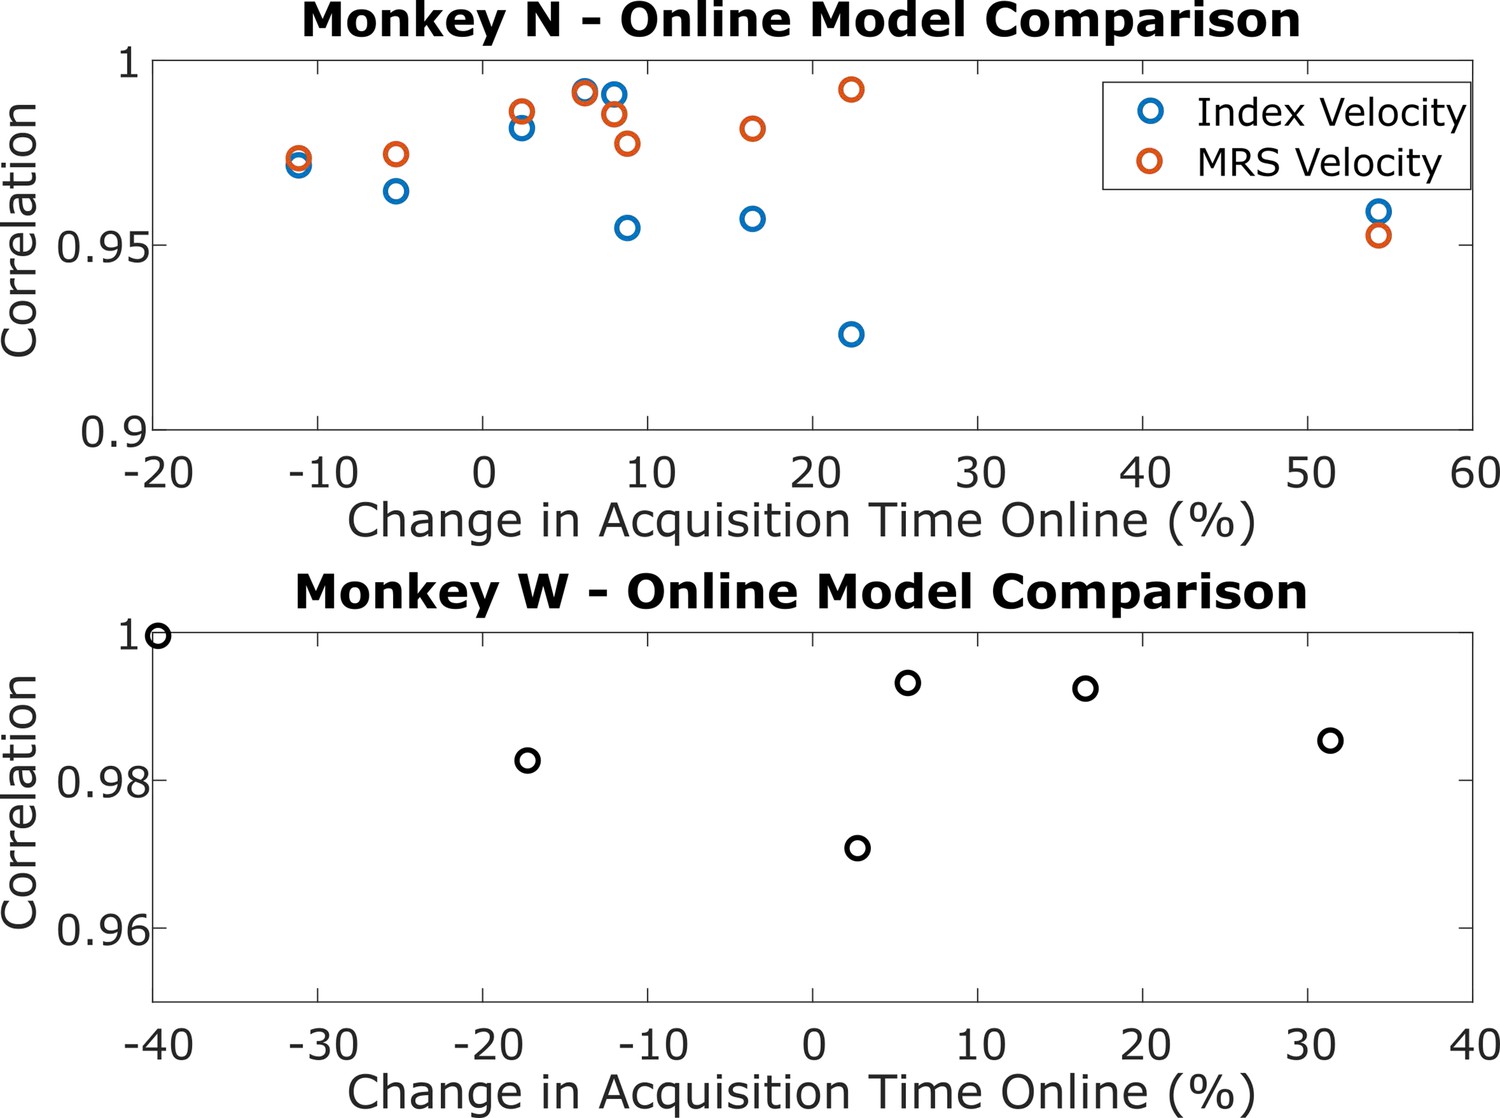
Figure 5 with 2 supplements
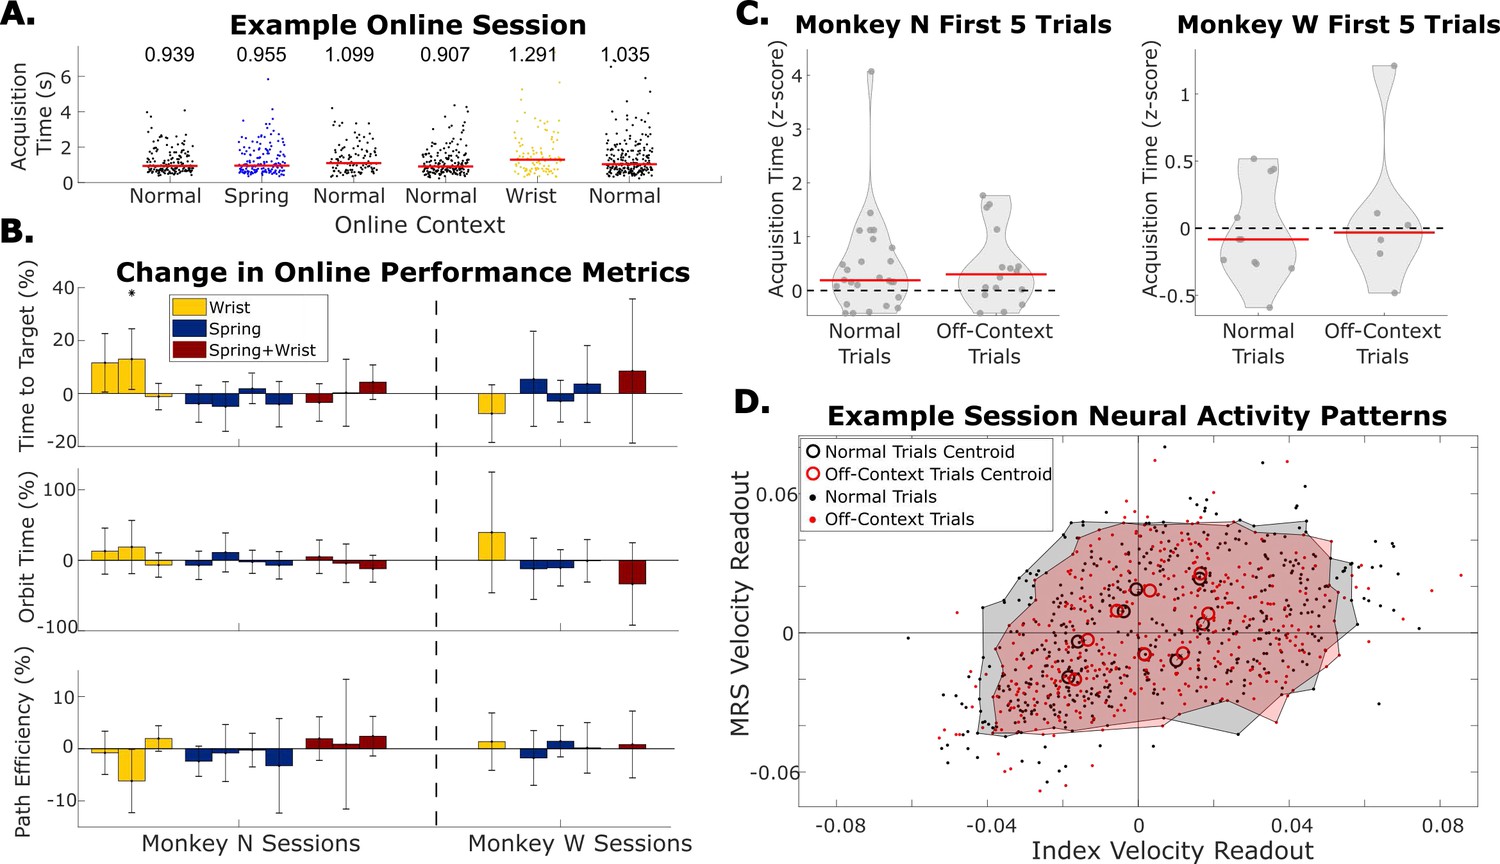
Online performance when context changes are tested by adding changes to the manipulandum during online trials.
(A) Example online session in which both the spring and the wrist context are tested. Each dot indicates acquisition time of one trial, each grouping of dots is a series of trials before the context was changed. Red bars and numbers above each grouping illustrate the median acquisition time (in seconds) for that series of trials. (B) Change in performance metrics between normal online trials and online trials with the context change indicated by the bar color in the manipulandum. Each bar indicates one session where off-context online trials are compared to the normal online trials immediately before and after them. Error bars indicate 99% confidence interval in performance metric change. Dashed line separates Monkey N sessions from Monkey W sessions. (C) Average acquisition time during the first five trials each time online trials were started, split between normal trials and trials with context changes applied to the hand (off-context). Acquisition times were z-scored within a series of trials in the same context. Red lines indicate the median. (D) Neural activity patterns for one example session. Neural activity patterns are velocity predictions at the time point of peak brain-machine interface (BMI) movement using a single linear regression model trained on normal offline trials. Each dot indicates the readout velocity for one trial using the same linear model but for either a normal trial (black) or an off-context trial (red). Larger open circles indicate the centroid of velocity readouts for trials to one of eight target directions split by normal and off-context trials. Shaded areas bound patterns for all trials excluding trials outside the 95th percentile of index or middle-ring-small (MRS) velocities.
Figure 5—figure supplement 1
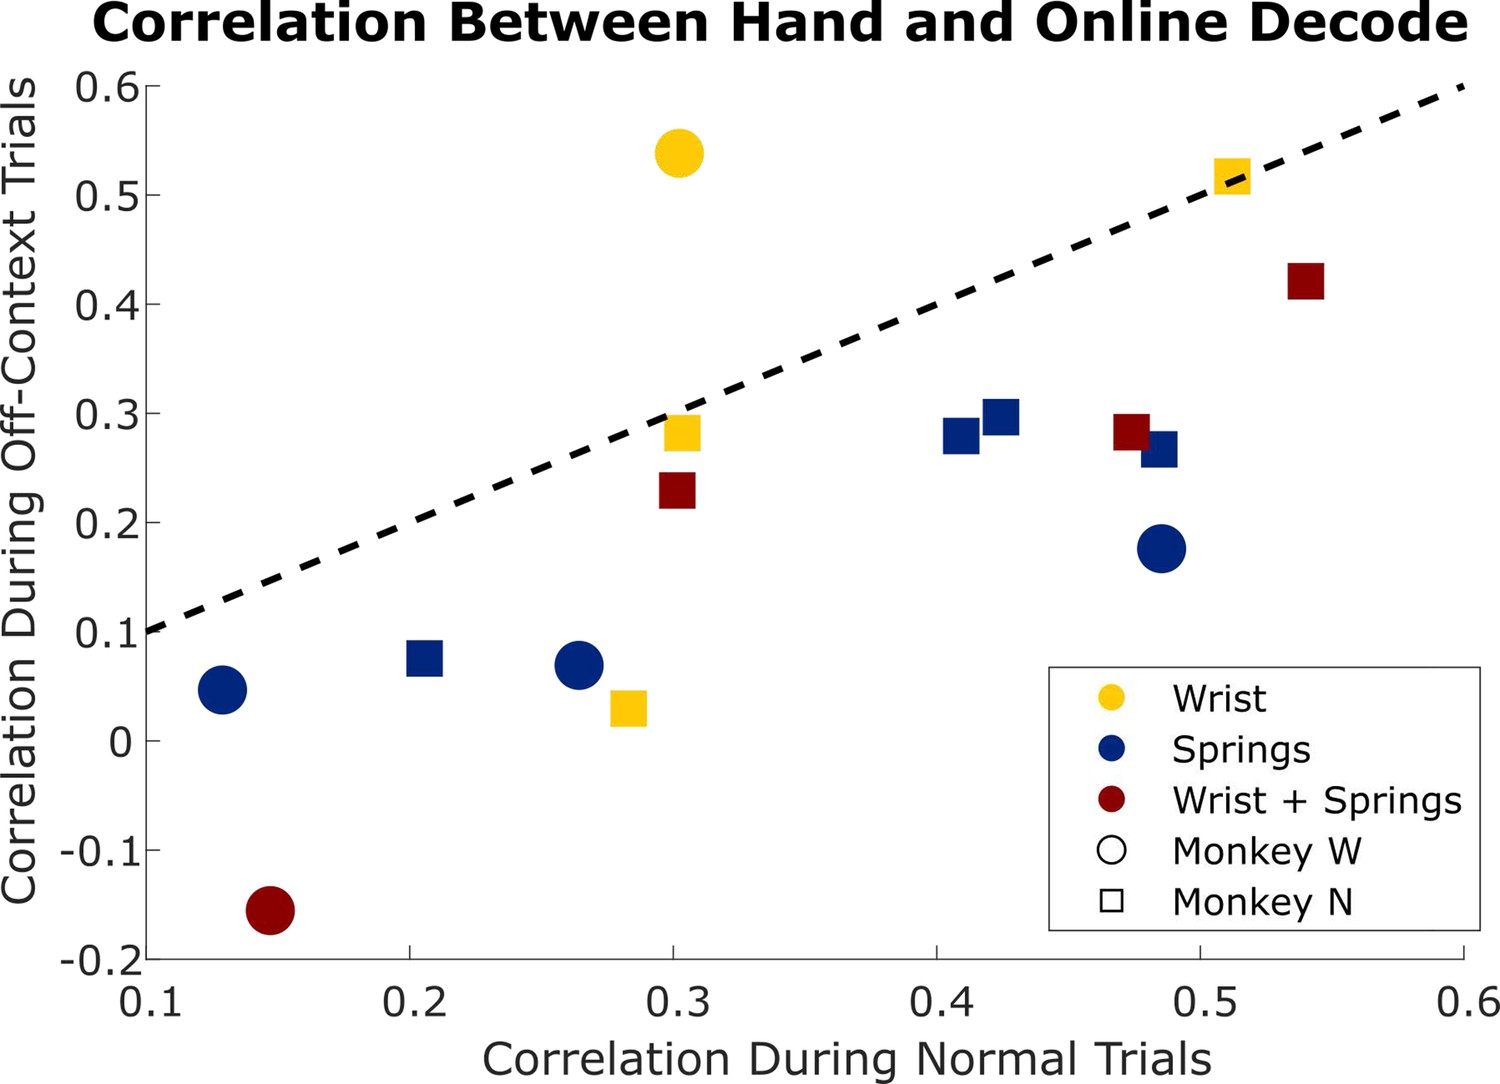
The correlation between hand position and online decode during the trials for each online comparison in Figure 5B.
Colors represent the type of context change (yellow – wrist, blue – springs, red – both wrist and springs), and shape indicates which monkey the session was with. Dotted line indicates equal hand-decode correlation in both types of trial.
Figure 5—figure supplement 2
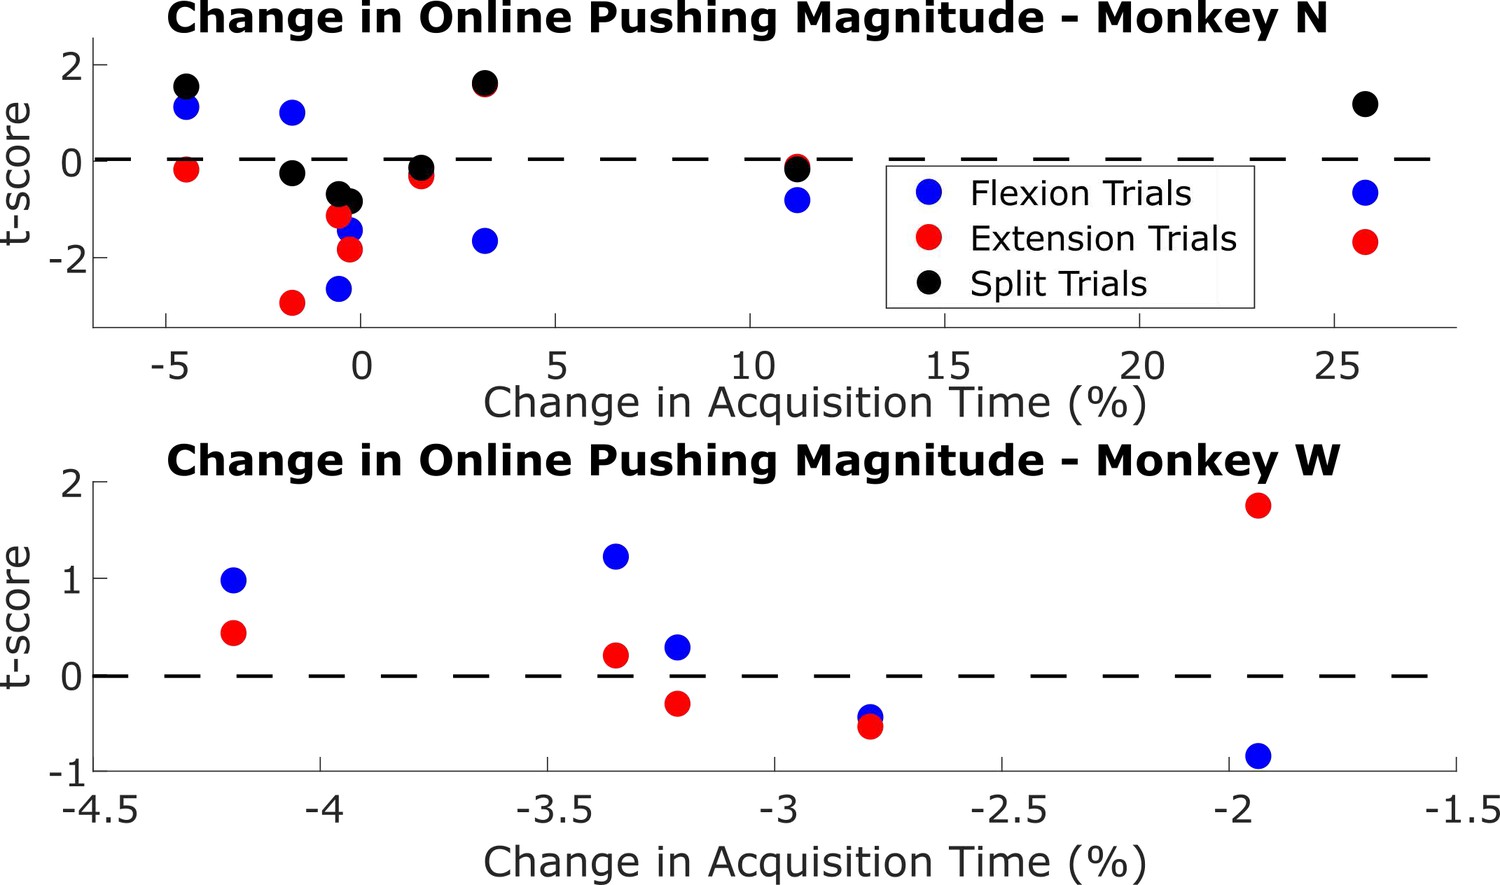
Change in ‘pushing’ magnitude, that is the predicted velocity along the target direction, with predictions made by a linear regression model.
This was trained on normal trials offline and evaluated on neural data during online trials at the time point of peak movement. The change is between trials during normal online control and trials with a context changed added during online control. One dot indicates the two-sample t-score of this change calculated using all trials of one type (blue – flexion, red – extension, or black – split) in one session for Monkey N (top) or Monkey W (bottom). A change greater than 0 indicates a larger magnitude during the off-context trials, that is pushing harder.
Figure 6 with 2 supplements
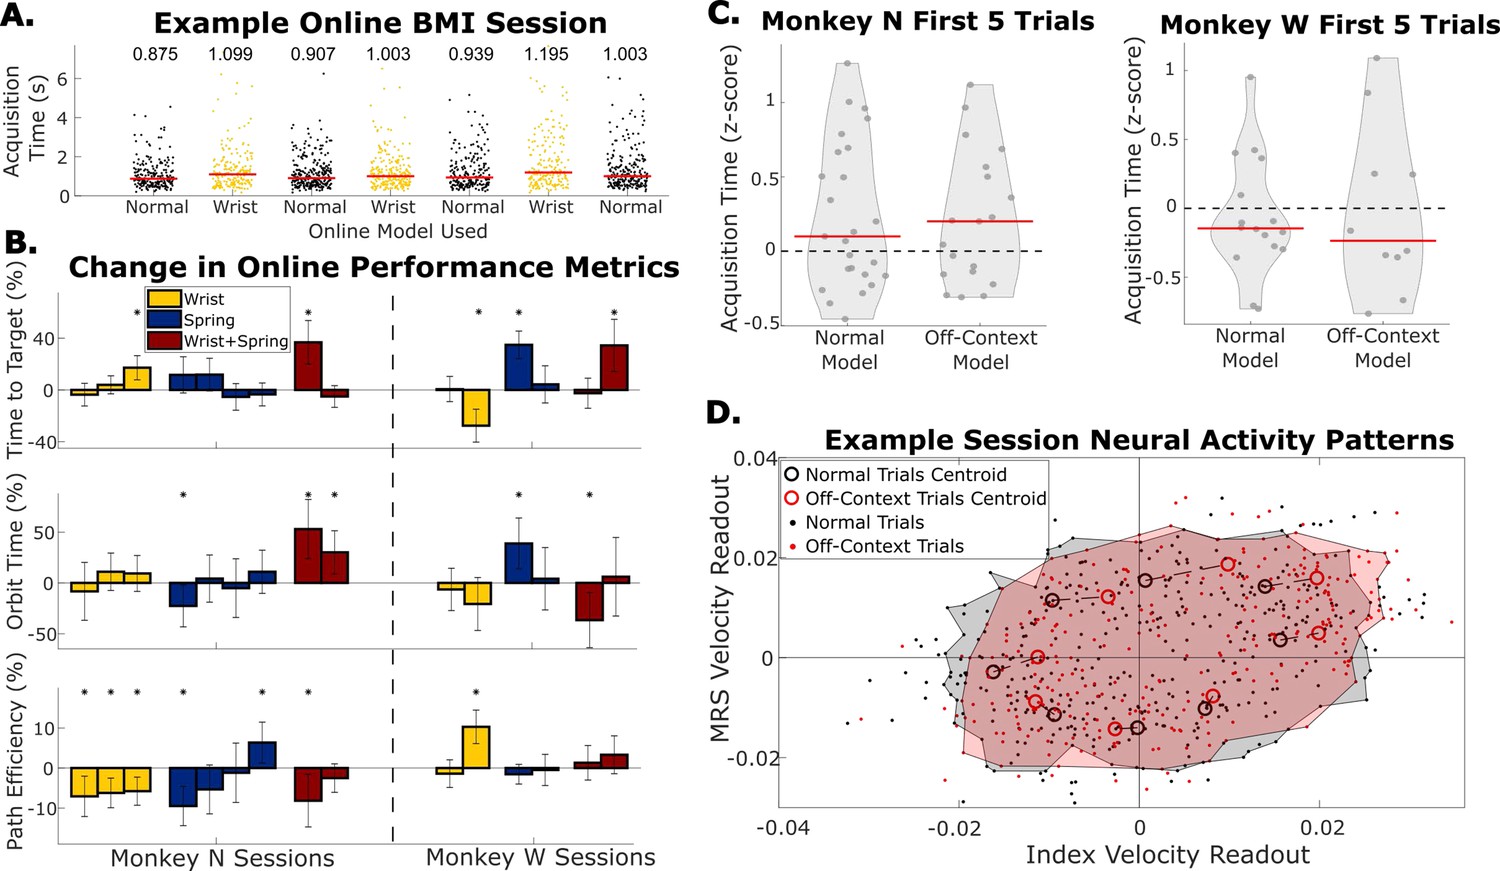
Online performance when context changes were tested by using decoders trained with normal training data or off-context training data.
(A) Example online session in which the wrist context was tested. Each dot indicates acquisition time of one trial, and each grouping of dots is a series of trials before the context was changed. Red bars and numbers above each grouping illustrate the median acquisition time (in seconds) for that series of trials. (B) Change in performance metrics between normal online trials and online trials with the context change indicated by the bar color. Each bar represents one session where off-context online trials are compared to the normal online trials immediately before and after them. Error bars indicate 99% confidence interval in performance metric change. The dashed line separates Monkey N sessions from Monkey W sessions. (C) Average acquisition time during the first five trials each time online trials were started, split between trials performed with the model trained on normal trials and the model trained on off-context trials. Acquisition times were z-scored within a series of trials with the same model. Red lines indicate the median. (D) Neural activity patterns for one example session. Neural activity patterns are velocity predictions at the time point of peak brain-machine interface (BMI) movement using a single linear regression model trained on normal offline trials. Each dot indicates the readout velocity for one trial using the same linear model but for either a normal trial (black) or an off-context trial (red). Larger open circles indicate the centroid of velocity readouts for trials to one of eight target directions split by normal vs off-context trials. Shaded areas bound patterns for all trials excluding trials outside the 95th percentile of index or middle-ring-small (MRS) velocities.
Figure 6—figure supplement 1
Correlation between the velocity predictions made with each Kalman filter used in the two-model brain-machine interface (BMI) experiments for Monkey N.
Each Kalman filter was evaluated on all online trials in a session. One point indicates the correlation between these predictions with both Kalman filters used in one session.
Figure 6—figure supplement 2
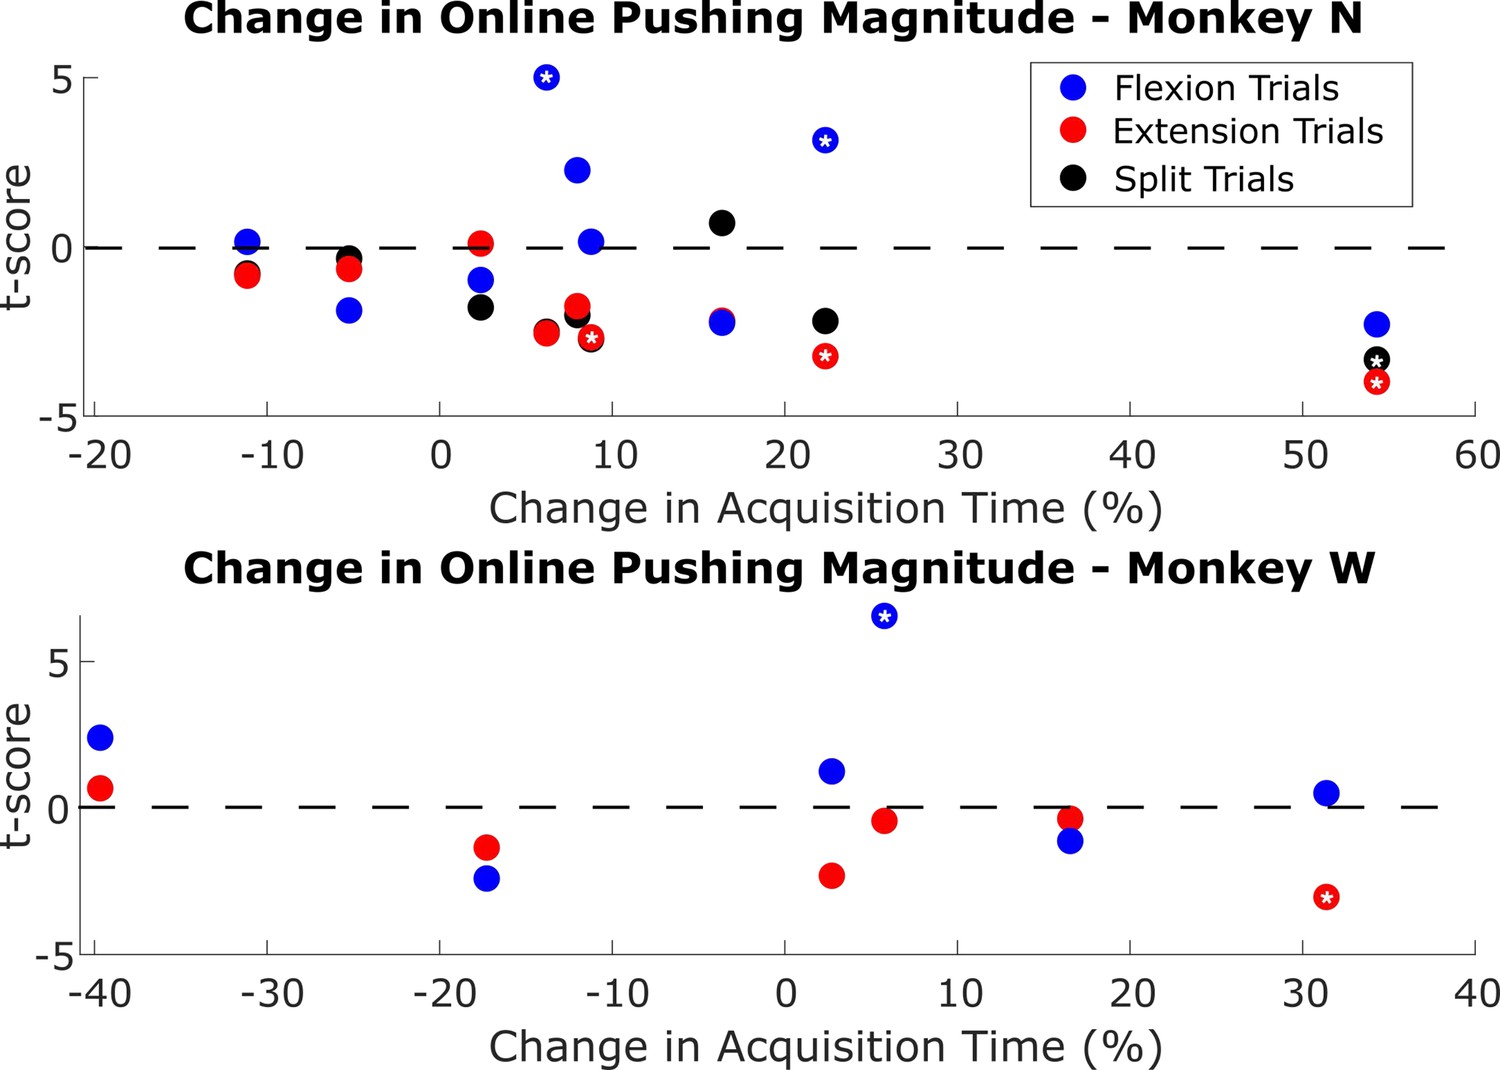
Change in ‘pushing’ magnitude, that is the predicted velocity along the target direction, with predictions made by a linear regression model.
This was trained on normal trials offline and evaluated on neural data during online trials at the time point of peak movement. The change is between trials during normal online control and trials with a context changed added during online control. One dot indicates the two-sample t-score of this change calculated using all trials of one type (blue – flexion, red – extension, or black – split) in one session for Monkey N (top) or Monkey W (bottom). A change greater than 0 indicates a larger magnitude during the off-context trials, that is pushing harder. White asterisks indicate significant changes.
Figure 7
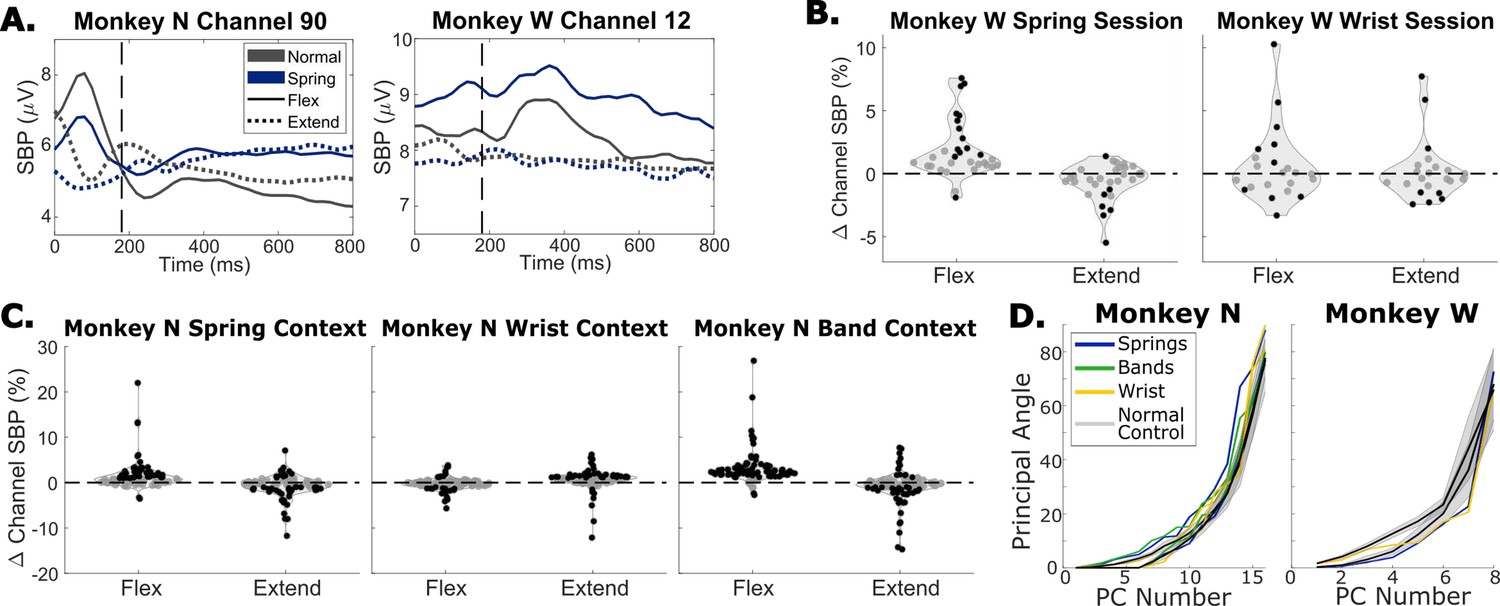
The impact of context changes on neural activity.
(A) Trial-averaged spiking band power (SBP) for two channels during a spring session for each monkey. Trials were aligned to peak movement before averaging, vertical dashed lines indicate peak movement. Black traces show normal trials, blue traces show trials with springs present, solid traces are flexion trials, and dotted traces are extension trials. (B) Change in average SBP in a window around peak movement for each tuned channel for a spring session (left) and wrist session (right), both for Monkey W. Black dots indicate significant differences according to a two-sample t-test (p<0.01). (C) Same as (B) but for Monkey N and using one session where the task was performed normally and in the spring, wrist, and rubber band contexts. (D) Principal angles between the PCA space calculated for normal trials and the PCA spaces calculated for spring trials (blue), band trials (green), or wrist trials (yellow). Black lines are average angles between PCA spaces for two random sets of normal trials, with gray shading indicating one standard deviation.
Figure 8
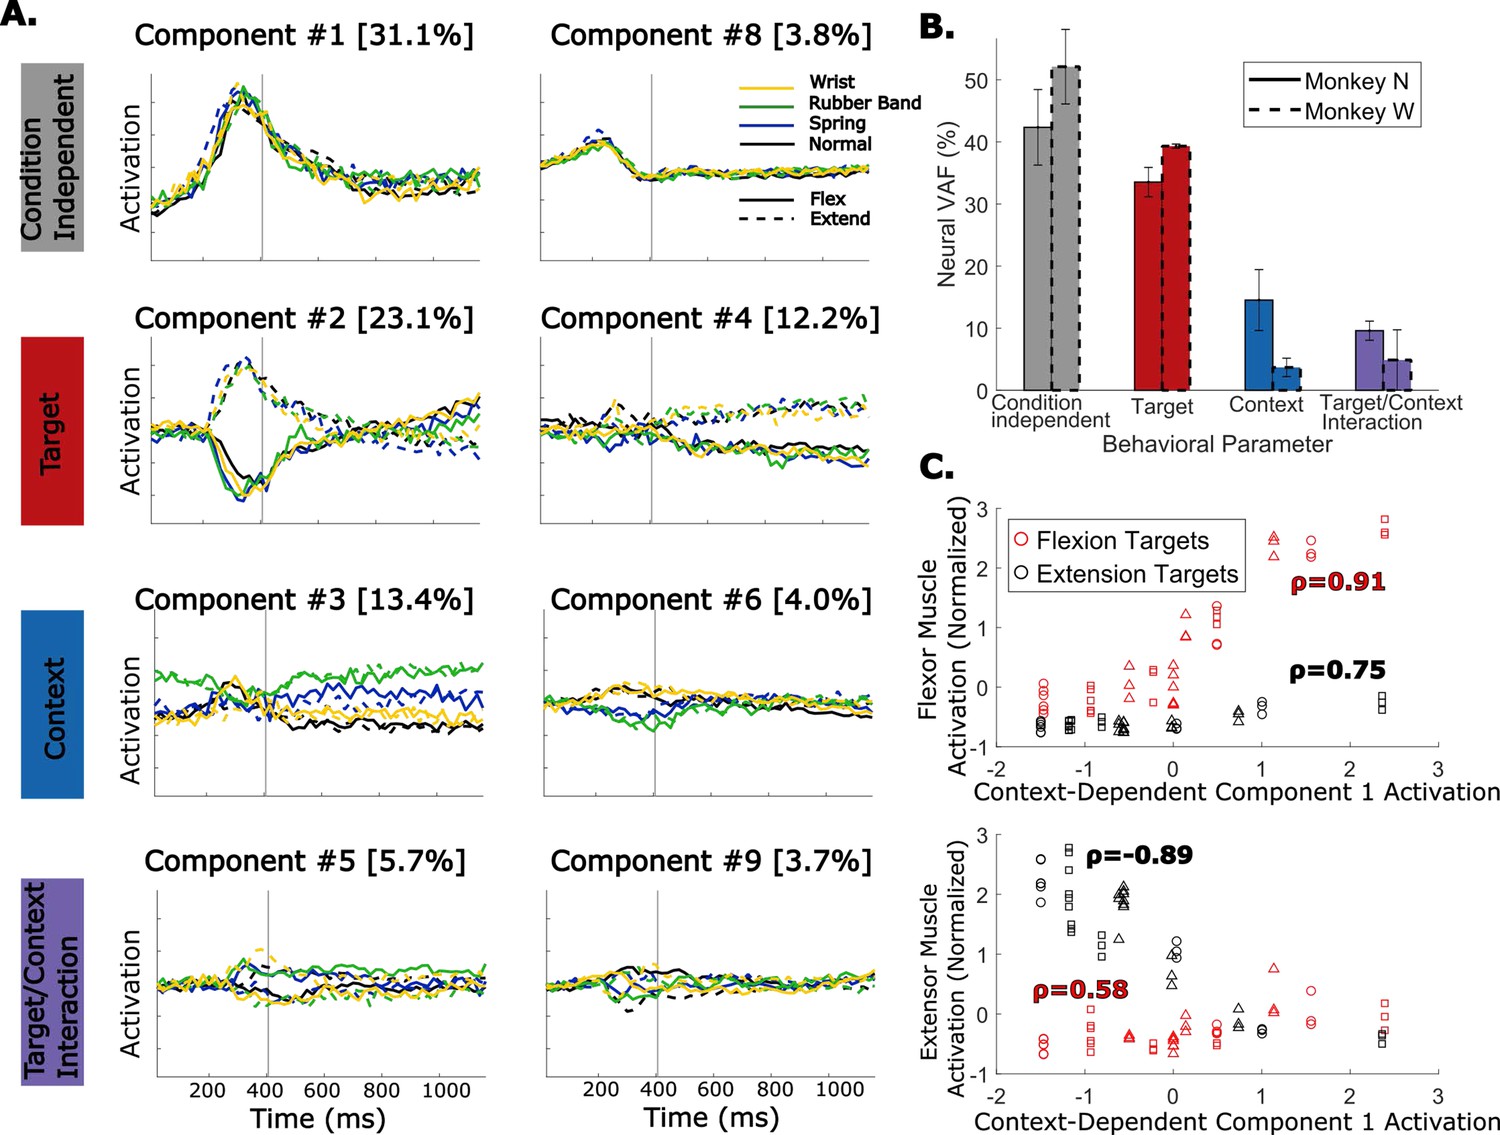
Dimensionally reduced representation of neural activity across multiple context changes.
(A) Demixed PCA (dPCA) components for an example session with Monkey N performing normal trials (black), wrist trials (yellow), spring trials (blue), and rubber band trials (green). Solid traces are flexion trials, and dashed traces are extension trials. Components are organized by which behavioral parameter they explain the most neural variance for. Component numbers are ordered by how much neural variance they account for and the percent in brackets is the neural variance accounted for. (B) Percent of neural variance accounted for by each behavioral parameter. Bars with solid edges are for Monkey N, and bars with dashed edges are for Monkey W. Error bars indicate standard deviation across sessions. Three sessions are included for Monkey N, and two sessions are included for Monkey W. (C) Average muscle activation around peak movement for flexor muscles (top) or extensor muscles (bottom) during trials for each context and target plotted against the average activation of the first context-dependent dPCA component during the same trials. Each point represents the average activations in a series of trials in one context toward one target. Markers indicate which session the sample is from. Correlations are calculated within samples for one target, either flexion (red) or extension (black).
Tables
Table 1
The number of channels tuned to any movement using two features (threshold crossing firing rate [TCFR] and spiking band power [SBP]) and the percentage of tuned channels that showed a significant change in neural feature between normal trials and trials in the tested context for four types of experimental sessions (Monkey N or Monkey W with the spring or wrist context).
Standard deviation (SD) is calculated across sessions of the same type and n is the number of sessions of that type which is indicated in the first column.
| TCFR | SBP | |||
|---|---|---|---|---|
| Tuned channels | % Context modulated channels | Tuned channels | % Context modulated channels | |
| Monkey N spring days (n=3) | 38.3 (SD = 4.0) | 47.0% (SD = 2.8) | 89.3 (SD = 2.1) | 61.7% (SD = 12.0) |
| Monkey N wrist days (n=2) | 35.0 (SD = 1.4) | 43.1% (SD = 9.8) | 84.5 (SD = 7.8) | 54.4% (SD = 0.8) |
| Monkey W spring days (n=3) | 12.0 (SD = 1.0) | 66.5% (SD = 2.8) | 35.0 (SD = 6.9) | 42.8% (SD = 7.1) |
| Monkey W wrist days (n=2) | 11.5 (SD = 3.5) | 5.6% (SD = 7.9) | 21.0 (SD = 5.7) | 20.9% (SD = 4.5) |
Table 2
List of muscles targeted during surgery with their associated function.
| Muscle | Function |
|---|---|
| Extensor indicis proprius (EIP) | Index finger extensor |
| Flexor digitorum profundus, targeting MRS (FDP) | Finger flexor |
| Extensor digitorum communis (EDC) | Finger extensor |
| Extensor carpi radialis brevis (ECRB) | Wrist extensor |
| Flexor carpi ulnaris (FCU) | Wrist flexor/adductor |
| Flexor carpi radialis (FCR) | Wrist flexor |
| Flexor digitorum profundus, targeting index, proximal and distal sites (FDPip, FDPid) | Index finger flexor |
Additional files
-
Supplementary file 1
Average prediction correlation when using ridge regression models to predict muscle activations or kinematics with the same or different test contexts.
- https://cdn.elifesciences.org/articles/82598/elife-82598-supp1-v2.xlsx
-
Supplementary file 2
Average prediction mean-squared error (MSE) when using ridge regression models to predict muscle activations or kinematics with the same or different test contexts.
- https://cdn.elifesciences.org/articles/82598/elife-82598-supp2-v2.xlsx
-
MDAR checklist
- https://cdn.elifesciences.org/articles/82598/elife-82598-mdarchecklist1-v2.docx
Download links
A two-part list of links to download the article, or parts of the article, in various formats.
Downloads (link to download the article as PDF)
Open citations (links to open the citations from this article in various online reference manager services)
Cite this article (links to download the citations from this article in formats compatible with various reference manager tools)
The impact of task context on predicting finger movements in a brain-machine interface
eLife 12:e82598.
https://doi.org/10.7554/eLife.82598


