A mechanism of uncompetitive inhibition of the serotonin transporter
- Institute of Pharmacology and the Gaston H. Glock Research Laboratories for Exploratory Drug Development, Center of Physiology and Pharmacology, Medical University of Vienna, Austria
- Department of Neurobiology, University of Vienna, Austria
- Center for Brain Research, Medical University of Vienna, Austria
Figures
Figure 1
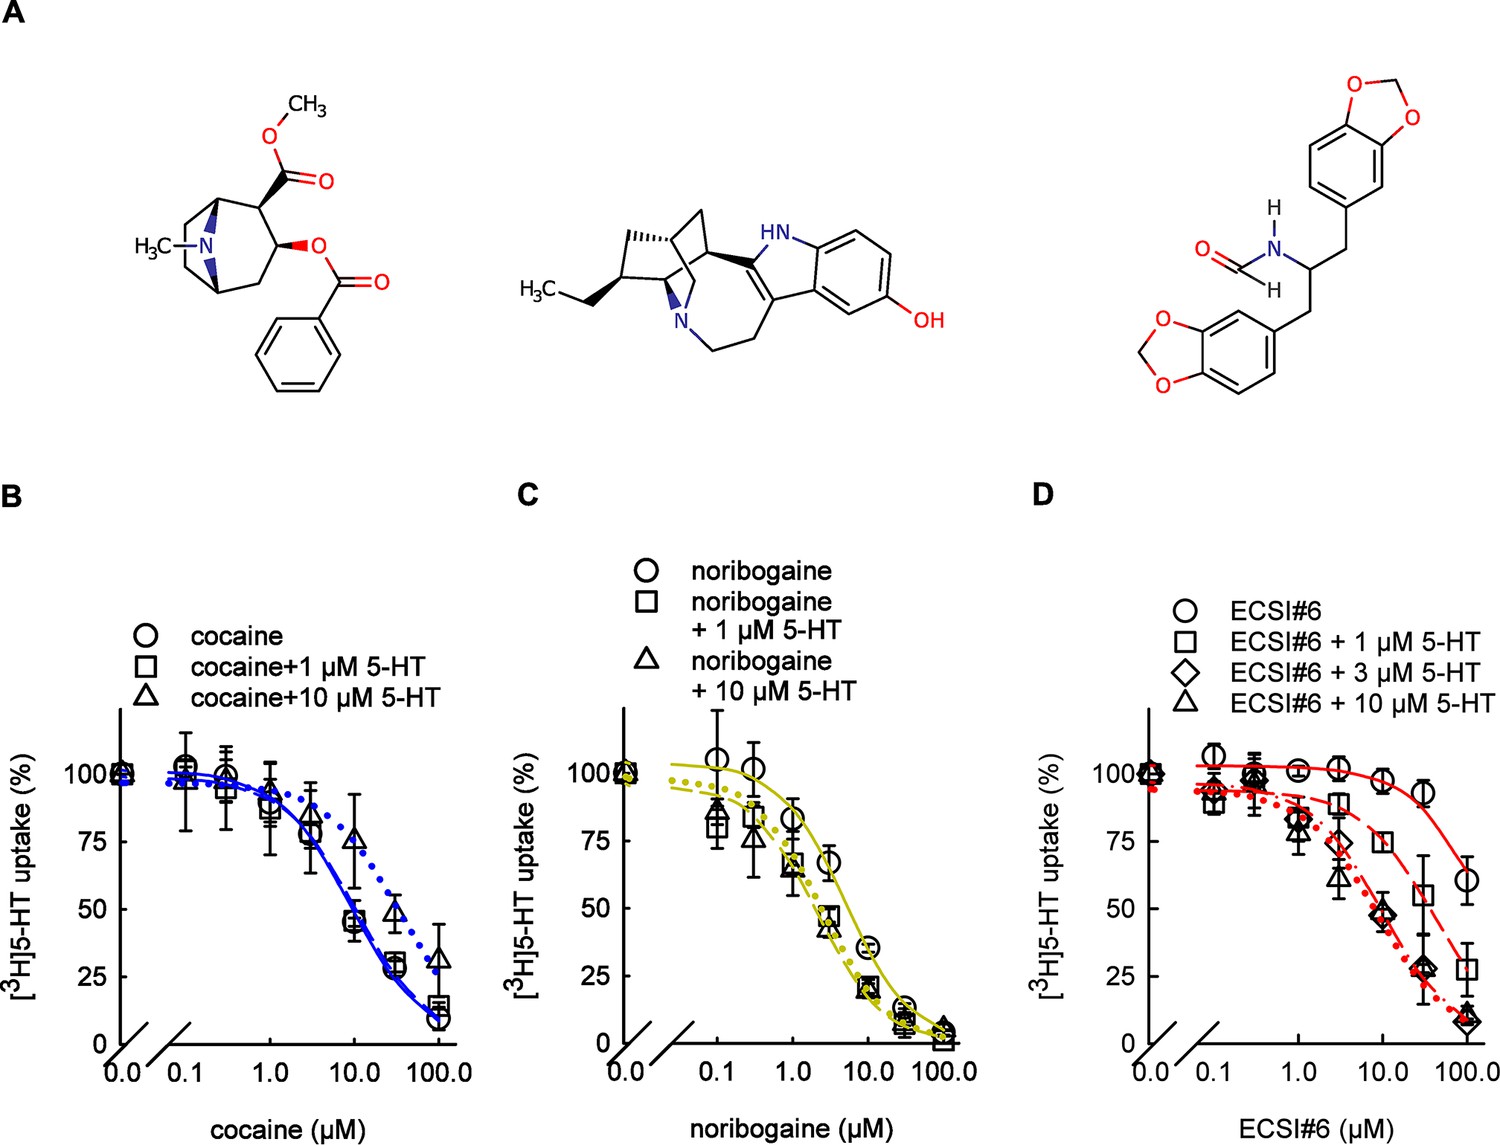
Inhibition of serotonin transporter (SERT)-mediated [3H]5-HT uptake by cocaine, noribogaine, and ECSI#6.
(A) The chemical structures of cocaine, noribogaine, and ECSI#6. (B–D) HEK293 cells stably expressing wild-type YFP-SERT (~30,000 per well) were seeded onto 96-well plates. After 24 hr, inhibition of substrate uptake by cocaine (B), noribogaine (C), or ECSI#6 (D) was determined as outlined under Materials and methods in the absence of additional unlabeled 5-HT (circles and solid lines, IC50(0.1)) or in the presence of 1 µM (squares and dashed lines, IC50(1)), 3 µM (diamonds and dashed-dotted lines in D; IC50(3)), or 10 µM 5-HT (triangles, dotted lines, IC50(10)) of unlabeled 5-HT. Paroxetine (10 µM) was used to determine nonspecific uptake, which was ~5% of total uptake. Uptake was normalized to the specific uptake in the absence of inhibitors (4.2±0.6 pmol min–1 10–6 cells), which was set to 100% (i.e., no inhibition) to account for inter-experimental variations. Data represented are the means ± SD (error bars) from three independent experiments done in triplicate. The curves were generated by fitting a sigmoidal function through data points normalized between 100% and no uptake. The concentrations giving half-maximum inhibition (IC50) were (means and 95% confidence interval in parenthesis): cocaine - IC50(0.1)=9.9 µM (8.7–11.4), IC50(1)=9.8 µM (7.1–13.5), IC50(10)=34.6 µM (24.8–48.3); noribogaine - IC50(0.1)=5.7 µM (4.3–7.3), IC50(1)=2.4 µM (1.8–3.1), IC50(10)=1.9 µM (1.5–2.4); ECSI#6 - IC50(0.1)=440.5 µM (325.8–595.6), IC50(1)=74.1 µM (55.4–99.2), IC50(3)=25.6 µM (19.1–34.2), IC50(10)=19.3 µM (13.2–28.1).
Figure 2
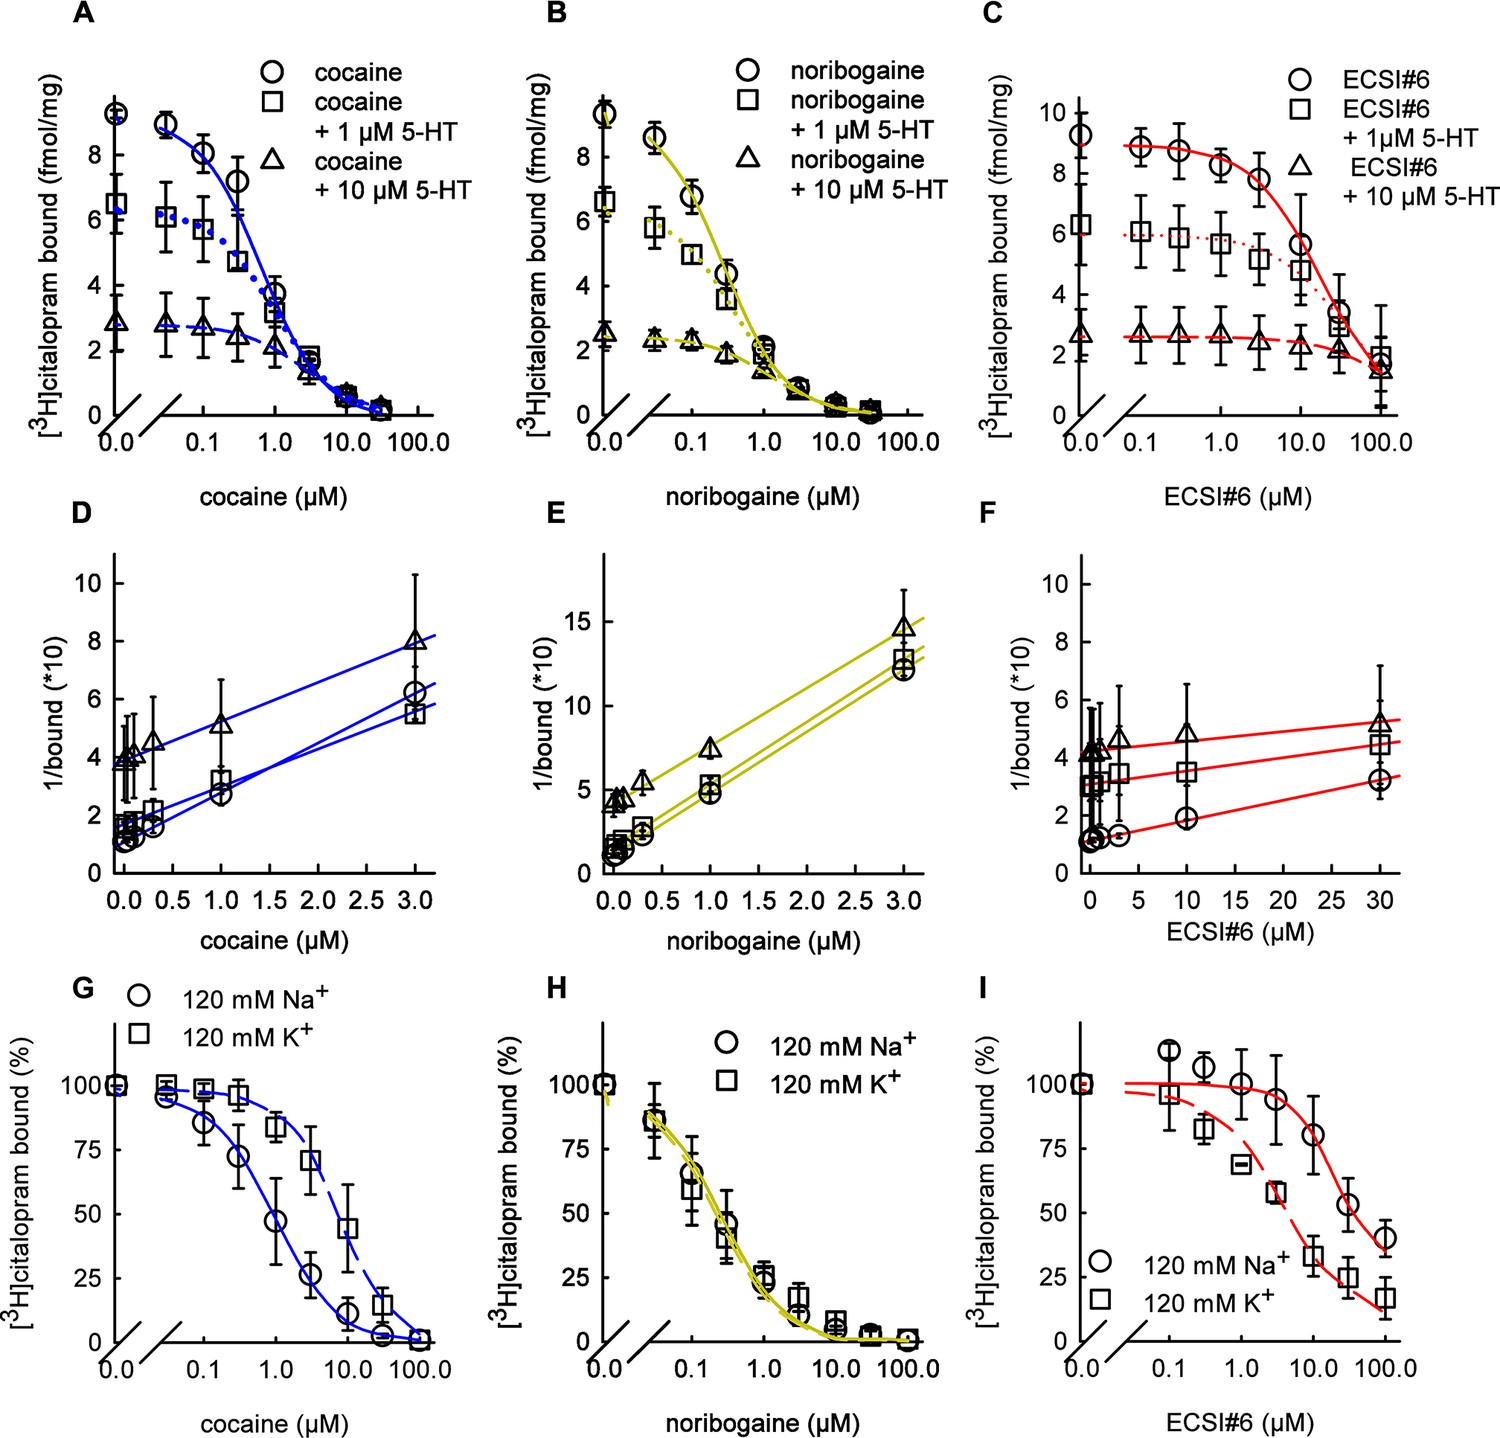
Inhibition of [3H]citalopram binding by cocaine, noribogaine, and ECSI#6.
(A–G) Inhibition of [3H]citalopram binding to serotonin transporter (SERT) by cocaine (A, D; blue curves), noribogaine (B, E; green curves), or ECSI#6 (C, F; red curves). The binding inhibition assays in (A–C) were performed in the absence (open circles, solid lines) and presence of 1 µM (squares, dashed lines) or of 10 µM 5-HT (triangles, dotted lines) in buffer containing 120 mM Na+ with 2–3 µg membranes (0 and 1 µM 5-HT) or 7–8 µg membranes (10 µM 5-HT). (D–F) The data in A–C were transformed to yield Dixon plots. The binding inhibition assays in (G–I) were performed in a binding buffer that contained either 120 mM Na+ (circles, solid curves) or 120 mM K+ (squares, dashed curves). Assays in the presence of 120 mM NaCl were done with 2–3 µg membranes; for assays with 120 mM KCl, 7–8 µg of membranes were used to improve the dynamic binding range. The specific binding values for assays with the 120 mM NaCl and 120 mM KCl buffer were 25±14 and 21±5 fmol assay−1, respectively. These values were normalized to 100% to account for inter-experiment variability. All data are the means from three independent experiments done in duplicate; error bars represent SD. The curves generated were generated by fitting the data points to the equation for a monophasic inhibition. The concentrations giving half-maximum inhibition (IC50 values) were calculated from each plot yielding (95% confidence intervals in parenthesis): (A) cocaine - IC50(no 5-HT)=0.66 µM (0.54–0.82), IC50(1 µM 5-HT)=0.94 µM (0.76–1.09), IC50(10 µM 5-HT)=2.48 µM (2.08–2.90); (B) noribogaine - IC50(no 5-HT)=0.28 µM (0.24–0.31), IC50(1 µM 5-HT)=0.32 µM (0.26–0.42), IC50(10 µM 5-HT)=1.10 µM (0.92–1.31); (C) ECSI#6 - IC50(no 5-HT)=16.02 µM (10.96–22.42), IC50(1 µM 5-HT)=28.6 µM (20.2–40.0), IC50(10 µM 5-HT)=60.0 µM (38.2–94.2); (D) cocaine - IC50 (120 Na+)=0.82 µM (0.62–1.10), IC50(120 K+)=7.94 µM (5.34–9.01); (E) noribogaine - IC50 (120 Na+)=0.24 µM (0.18–0.32), IC50(120 K+)=0.20 µM (0.16–0.24); (F) ECSI#6 - IC50(120 Na+)=46.2 µM (31.6–67.6), IC50(120 K+)=4.18 µM (2.58–5.88). Paroxetine (10 µM) was used to determine nonspecific binding, which was ≤10% of total binding.
Figure 3
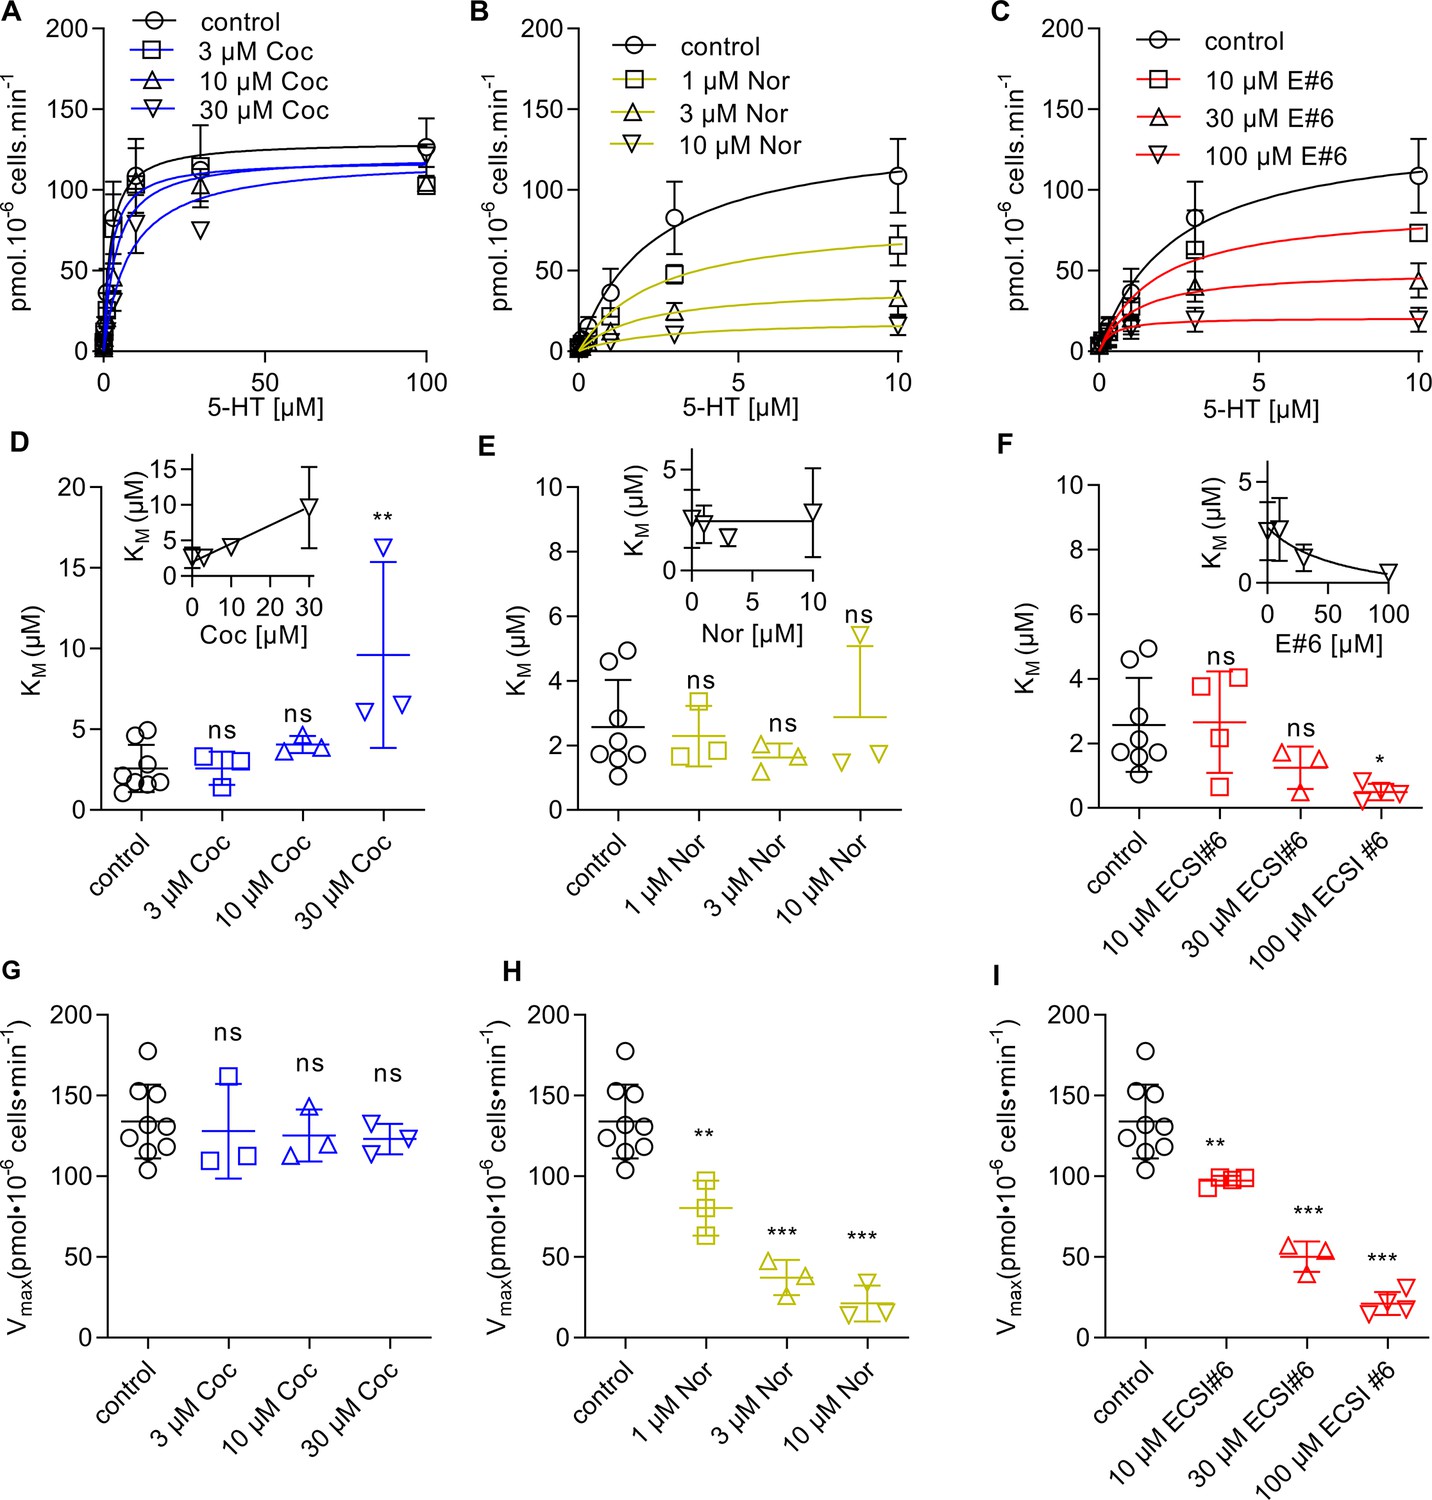
Different modes of inhibition by cocaine, noribogaine, and ECSI#6 of substrate uptake by serotonin transporter (SERT).
HEK293 cells stably expressing YFP-SERT (30,000/well) were preincubated in buffer in the absence (control, black circles) or presence of the indicated concentrations of cocaine (A), noribogaine (B), or ECSI#6 (C), for 10 min; subsequently, the uptake reaction was initiated as outlined in Materials and methods. In the absence of any inhibitor (black circles and black lines, control), the KM and VMAX of 5-HT transport by SERT was 2.3 µM (95% CI, 1.5–3.2) and 137.3 pmol min–1 10–6 cells (95% CI, 117.4–157.3); these control curves are identical in all panels. (A) In the presence of 3 μM (blue squares), 10 μM (blue upward triangles), and 30 μM cocaine (blue downward triangles), there was a progressive increase in KM-values (panel D) with KM = 2.2 µM [95% CI, 1.1–3.3], 3.7 µM [95% CI, 1.9–5.5], and 8.1 µM [95% CI, 1.9–5.5], respectively. The inset in panel D shows the same data on a linear abscissa to visualize the linear relation between apparent KM and cocaine concentration. In contrast to the KM values, the Vmax-values remained constant (panel G, VMAX = 118.3 pmol min–1 10–6 cells [95% CI, 117.4–157.3], 121.1 pmol min–1 10–6 cells [95% CI, 105.5–136.8], and 120.1 pmol min–1 10–6 cells [95% CI, 104.6–135.6], respectively). (B) Preincubation with 1 µM (yellow squares), 3 μM (yellow upward triangles), and 10 μM noribogaine (yellow downward triangles) did not change the KM-values (panel E with KM = 2.4 µM [95% CI, 1.4–3.5], KM = 1.9 µM [95% CI, 0.6–3.3], and 2.4 µM [95% CI, 0.6–5.5], respectively). The inset shows the same data on a linear abscissa. The VMAX on the other hand was reduced in a concentration-dependent manner (panel H with VMAX = 82.4 pmol min–1 10–6 cells [95% CI, 69.3–95.4], 39.9 pmol min–1 10–6 cells [95% CI, 30.6–49.2], and 19.5 pmol min–1 10–6 cells [95% CI, 13.9–24.9], respectively). (C) Preincubation with 10 μM (red squares), 30 μM (red upward triangles), and 100 μM ECSI#6 (red downward triangles) led to a drop in both, the KM-values (panel F, KM = 1.7 µM [95% CI, 0.5–2.9], 1.1 µM [95% CI, 0.2–1.9], and 0.4 µM [95% CI, 0.0–0.8], respectively; the inset shows the same data on a linear abscissa) and the VMAX-values (panel I, VMAX = 89.5 pmol min–1 10–6 cells [95% CI, 68.5–110.0], 49.9 pmol min–1 10–6 cells [95% CI, 37.5–62.3], and 20.8 pmol min–1 10–6 cells [95% CI, 15.6–26.0], respectively). Data are the means ± SD (error bars) from at least three independent experiments done in triplicate. The curves were generated by fitting the data points to the equation for a rectangular hyperbola. Control KM- and VMAX-values were pooled and are hence the same in panels D–F and G–I, respectively. Statistical comparisons were done by one-way ANOVA followed by Dunnett’s post hoc test to verify significant differences vs. control (*p<0.05, **p<0.01, ***p<0.001).
Figure 4
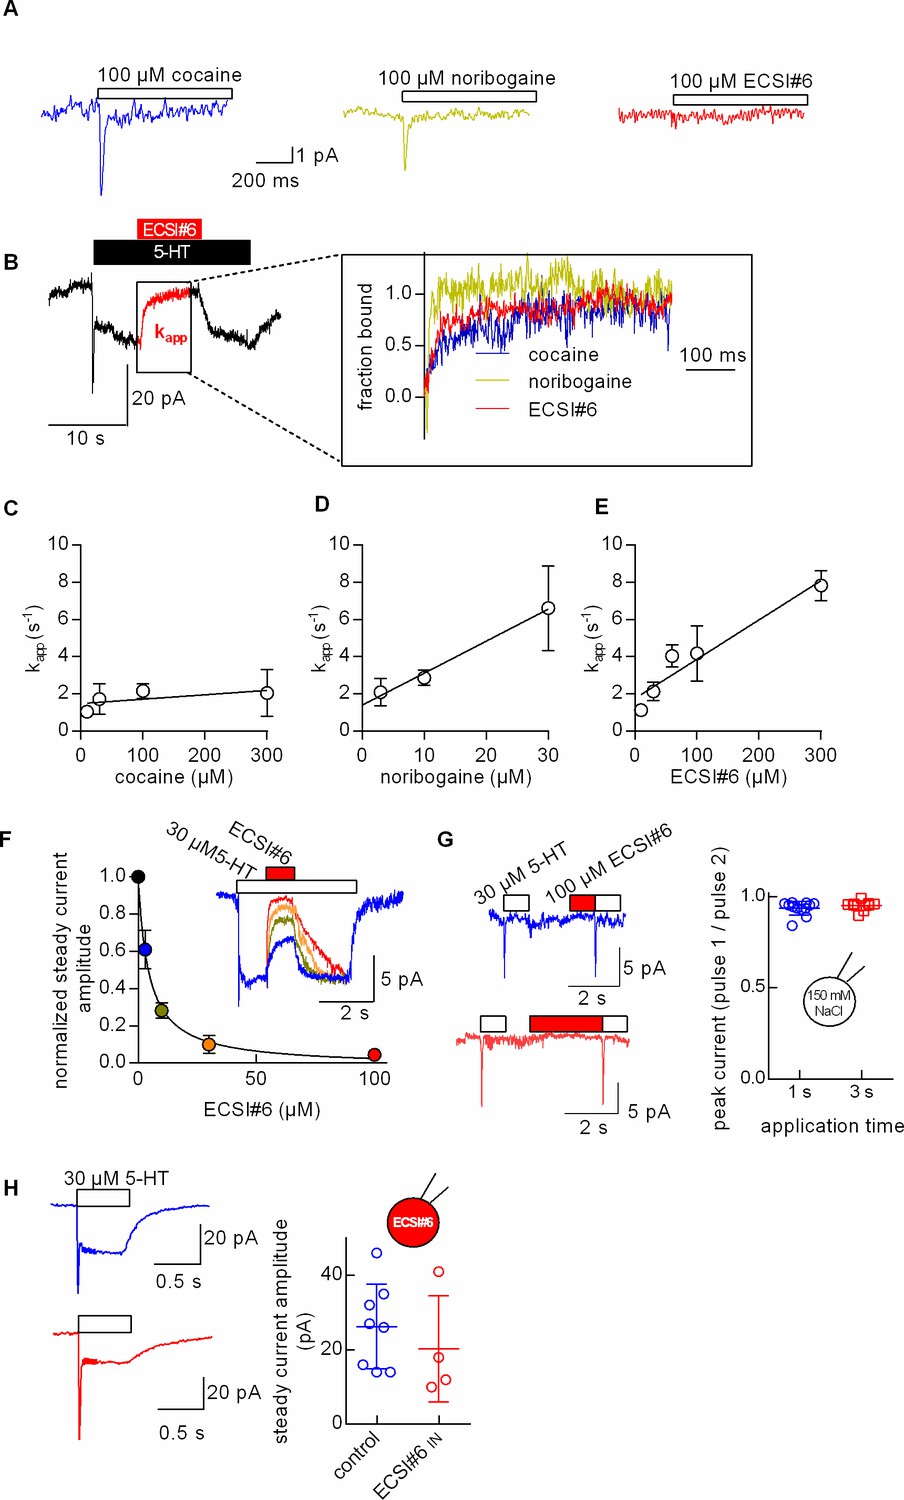
Kinetics of current inhibition by cocaine, noribogaine, and ECSI#6.
Single HEK293 cells stably expressing GFP-serotonin transporter (SERT) were voltage-clamped to –60 mV using the whole-cell patch clamp technique under physiological ionic gradients. (A) Representative recording of a cell superfused with cocaine (100 µM, left-hand trace), noribogaine (100 µM, middle trace), or ECSI#6 (100 µM, right-hand trace). (B) Cells were initially challenged with 10 µM 5-HT. After 5 s, the cells were superfused with varying concentrations of either cocaine, noribogaine, or ECSI#6 for 5 s in the continuous presence of 10 µM 5-HT, which resulted in current inhibition. Thereafter, the compounds were removed by superfusion with 10 µM 5-HT alone for 10 s to monitor the recovery of the steady current. The left-hand panel shows the original trace of a representative current recorded after sequential superfusion with 10 µM 5-HT for 5 s, which triggered a peak current followed by a steady current, 100 µM ECSI#6 in the continuous presence of 10 µM 5-HT, which led to complete suppression of the current (highlighted in red), and 10 µM 5-HT, which resulted in the recovery of the steady current. The right-hand panel shows magnified representative segments of the traces recorded from different cells, which had been superfused with either cocaine (blue, 100 µM), noribogaine (green, 30 µM), or ECSI#6 (red, 100 µM). The time course of current inhibition was fitted to the equation for a mono-exponential decay to estimate the apparent rate constant (kapp). (C, D, E) Analysis of the kinetics of current inhibition by cocaine (open circles), noribogaine (open triangles), and ECSI#6 (open squares), respectively. The kapp-values were derived from experiments done as in panel A with the indicated concentrations of the compounds. Data are means ± SD ≥5 independent recordings. The kapp-values were plotted against the concentration. The slopes of the resulting lines were calculated by linear regression. The slope for cocaine did not deviate in a statistically significant manner from zero (F-test; p=0.12), while those for noribogaine and ECSI#6 did (p<0.0001 in both instances). (F) Assessment of the apparent ECSI#6 affinity for SERT in the presence of 5-HT. The inset in panel G shows representative current traces obtained from a cell stably expressing SERT. The current was evoked by rapid application of 30 µM 5-HT to the cell. Once the current had reached the steady level, increasing concentrations of ECSI#6 were applied in the continuous presence of 5-HT for a period of 0.5 s (inset). Application of ECSI#6 led to a concentration-dependent reduction in the current amplitude. The graph shows the fraction of unblocked current as a function of the ECSI#6 concentration. These data were fitted to an inhibition curve. The IC50 value estimated by the fit was 4.5±0.5 µM (n=5). (G) Assessment of the apparent affinity of ECSI#6 for SERT in the absence of 5-HT: the peak current was isolated by employing an internal solution containing 150 mM NaCl (which suppressed the steady current). The current traces show 5-HT-induced peak currents before and after pre-application of 100 µM ECSI#6 for 1 s (upper panel in blue) and 3 s (lower panel in red): pre-application of 100 µM ECSI#6 did not result in the reduction of the peak current amplitude consistent with a very low affinity for SERT in the absence of 5-HT. The panel on the right shows the result of independent measurements (n=12, prepulse 1 s; n=9, prepulse 3 s). Plotted is the ratio of the amplitude of peak 2 (i.e., after ECSI# pre-application) and peak 1 (i.e., control). (H) Effect of intracellular application of ECSI#6 on 5-HT-induced currents: the left-hand panel shows representative currents elicited by the application of 30 µM 5-HT in the absence (upper traces in blue) and presence of 100 µM intracellular ECSI#6 (lower traces in red). The right-hand panel summarizes the current amplitudes obtained from individual cells measured in the absence (blue circles) and presence of ECSI#6 (red circles). When applied from the intracellular side, ECSI#6 only had a modest effect, if any, on the current amplitude.
Figure 5
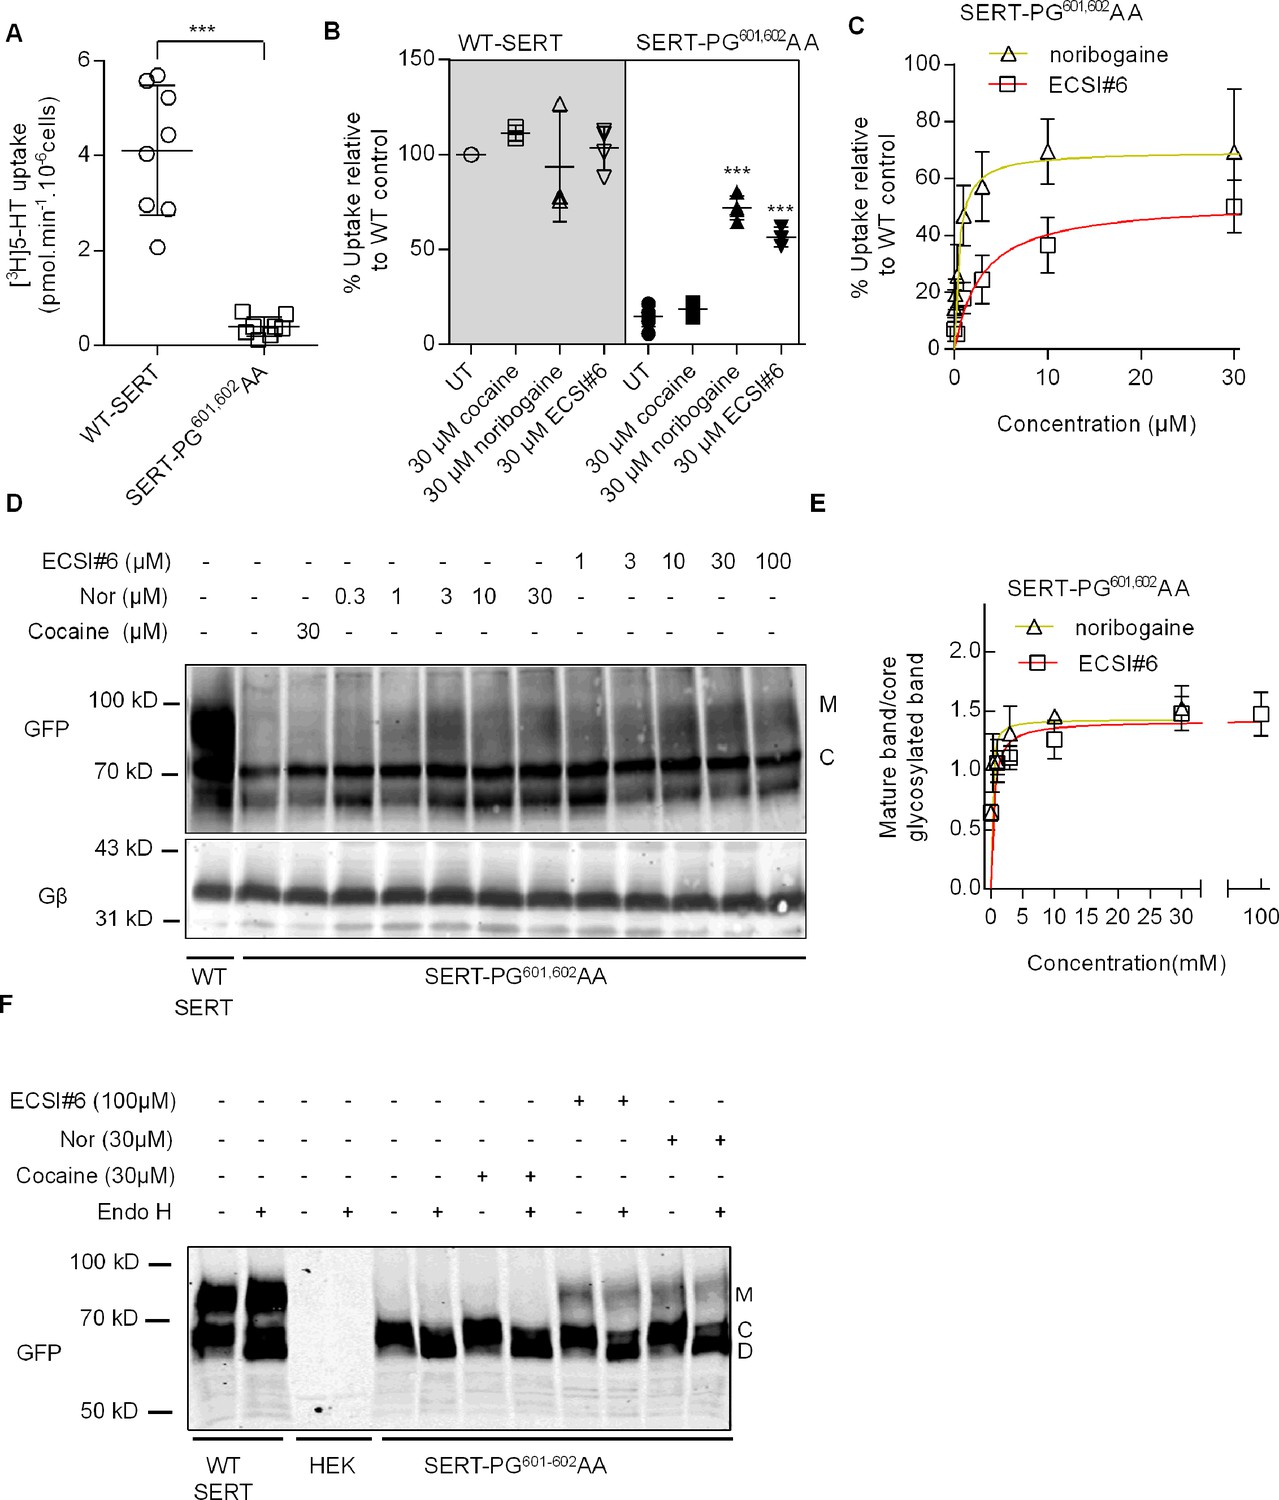
ECSI#6 can rescue folding-deficient SERT-PG601-602AA.
[3H]5-HT uptake by and glycosylation pattern of hSERT-PG601,602AA expressed in HEK293 cells incubated with cocaine, noribogaine, or ECSI#6. (A) Comparison of [3H]5-HT uptake by HEK293 cells transiently expressing either wild-type serotonin transporter (WT SERT) or SERT-PG601,602AA. Cellular uptake of the substrate was measured with 0.1 µM[3H]5-HT as outlined under Materials and methods and amounted to (means ± SD) 4.1±1.3 pmol min–1 10–6 cells and 0.39±0.20 pmol min–1 10–6 cells for wild-type SERT and SERT-PG601,602AA, respectively. Each symbol represents the result of an individual experiment (done in triplicate). The statistical comparison was done by a Mann-Whitney test (p=0.0009). (B) Cells transiently expressing either WT-SERT or SERT-PG601,602AA were incubated in the presence of 30 μM of either cocaine, noribogaine, or ECSI#6. After 24 hr, cellular substrate uptake was determined with 0.1 µM [3H]5-HT. Uptake values from individual conditions were normalized to the ones from untreated cells expressing wild-type SERT (set to 100%) to account for inter-experimental variations. Values from individual experiments (done in triplicate), represented collectively as a box plot, are shown as mean ± SD as follows: WT-SERT untreated (4.1±1.3 pmol min–1 10–6 cells set to 100%), WT-SERT+30 µM cocaine (111.4 ± 4.2%), WT-SERT+30 µM noribogaine (93.5 ± 28.8%), WT-SERT+30 µM ECSI#6 (103.3 ± 11.3%), SERT-PG601,602AA untreated (14.8 ± 5.3%), SERT-PG601,602AA+30 µM cocaine (18.6 ± 3.9%), SERT-PG601,602AA+30 µM noribogaine (71.9 ± 6.4%), SERT-PG601,602AA+30 µM ECSI#6 (56.5 ± 5.1%). The statistical comparison of untreated cells expressing SERT-PG601,602AA and their treated counterparts was done by one-way ANOVA followed by post hoc Dunnett’s multiple comparisons (***p<0.001). (C) Concentration-response curves for pharmacochaperoning of SERT-PG601,602AA by noribogaine and ECSI#6. Rescued uptake was normalized to uptake velocity measured in parallel in HEK293 cells transiently expressing WT-SERT to account for inter-experimental variations. EMAX and EC50 for noribogaine and ECSI#6 were determined by fitting the data to the equation for a rectangular hyperbola (95% CI in parenthesis): for noribogaine and ECSI#6, EMAX was 69.5% (59.2–79.7) and 52.0% (44.6–59.5), and EC50 was 0.46 µM (0.15–0.77) and 2.9 µM (1.1–4.7), respectively. The data were obtained in at least three independent experiments carried out in triplicate. The error bars indicate SD. (D) Confluent cultures of HEK293 cells transiently expressing SERT-PG601,602AA (1 well of a 6-well plate/condition) were treated with either cocaine (30 µM), noribogaine, or ECSI#6 in the indicated concentrations for 24 hr. Untreated cells were taken as negative controls (second lane in the representative blot). Membrane proteins extracted from these cells were denatured and resolved with SDS-PAGE and transferred onto nitrocellulose membranes. The blots were incubated overnight at 4°C with anti-GFP (top) or anti-Gβ (bottom, loading control) antibodies. The immunoreactive bands were detected with fluorescently labeled secondary antibodies. The blot is representative of three independent experiments. (E) The intensities of the immunoreactive bands were quantified by densitometry; the ratio of mature (M) to core-glycosylated band (C) was corrected for the intensity of the loading control (Gβ). These normalized values (expressed as AU – arbitrary units) were plotted as a function of drug concentration, and fitted to an equation for a rectangular hyperbola. The EMAX and EC50 (95% CI in parenthesis) were EMAX = 1.43 AU (1.18–1.68) and 1.42 (1.18–1.65), EC50=0.14 µM (0.01–0.35) and 0.44 µM (0.01–1.05) for noribogaines and ECSI#6, respectively. (F) Lysates were prepared from HEK293 cells, which expressed wild-type SERT (WT-SERT) and mutant (SERT-PG601-602AA) and which were preincubated with the indicated concentrations of cocaine, noribogaine, or ECSI#6 for 24 hr, or from non-transfected HEK-cells (HEK). Aliquots of the lysate (20 µg) were subjected to enzymatic digestion by endoglycosidase H (Endo H). Endo H specifically cleaves core glycans to generate the lower molecular weight deglycosylated (D) from the core-glycosylated species (C). Mature glycosylated bands (M) are resistant to the actions of Endo H. The immunoreactive bands were detected as in (D). The blot is representative of three independent experiments.
Figure 6
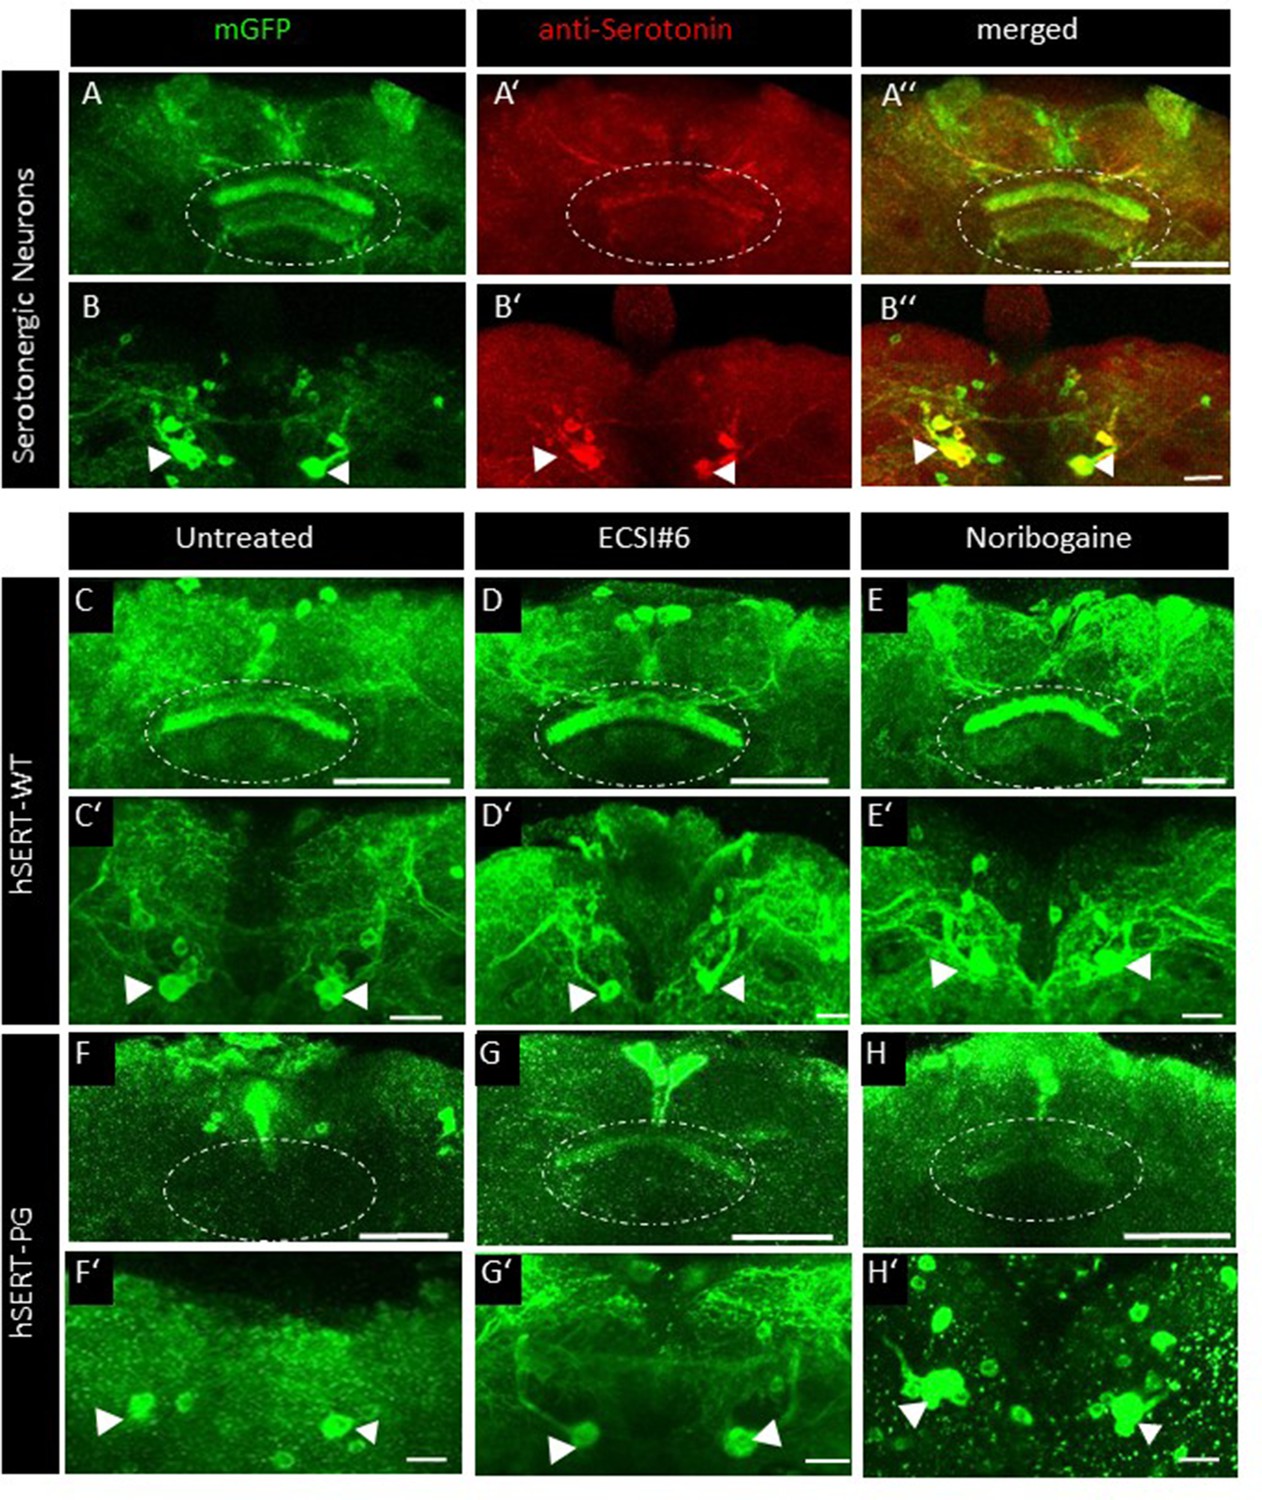
ECSI#6 and noribogaine modulate presynaptic expression of hSERT-PG 601,602 AA in the adult fly brain.
The top row (A–A’’) shows the expression of membrane-anchored GFP in the presynaptic compartment of serotonergic neurons in distinct fan-shaped body (FB) layers (dotted circle) co-labeled with an anti-serotonin antibody (red) and the merged image of the presynaptic compartment. (B–B’’) Cell body clusters of the corresponding serotonergic neurons in the posterior brain (arrowheads). (C–E’) Localization of YFP-tagged human wild-type serotonin transporter (hSERT-WT) in the FB neuropile (dotted circle in C–E) and in cell bodies of the corresponding serotonergic neurons (arrowheads in C’–E’) either from 3-day-old male untreated flies (C, C’) or flies treated for 48 hr with 100 µM ECSI#6 (D, D’) or 100 µM noribogaine (E, E’) in their food. (F–G’) Localization of YFP-tagged human mutant SERT-PG601,602AA (hSERT-PG in the FB neuropile [dotted circle in F–H]) and in cell bodies of the corresponding serotonergic neurons (arrowheads in F’–H’) either from 3-day-old male untreated flies (F, F’) or flies treated for 48 hr with 100 µM ECSI#6 (G, G’) or 100 µM noribogaine (H, H’) in their food. Images from the brains of these flies were captured by confocal microscopy and compiled with the ImageJ software. Images are single representatives of >10 brains per condition. Scale bars: (A,C–H) 50 μm; (B,C’–H’) 20 μm. Genotypes: (A–B) UAS-mCD8GFP; TRHT2A-GAL4. (C-E’);UAS-YFP-hSERT-WT/TRHT2A-GAL4; (F-´H’);;UAS-YFP-hSERT-PG 601,602 AA/TRHT2A-GAL4.
Figure 7
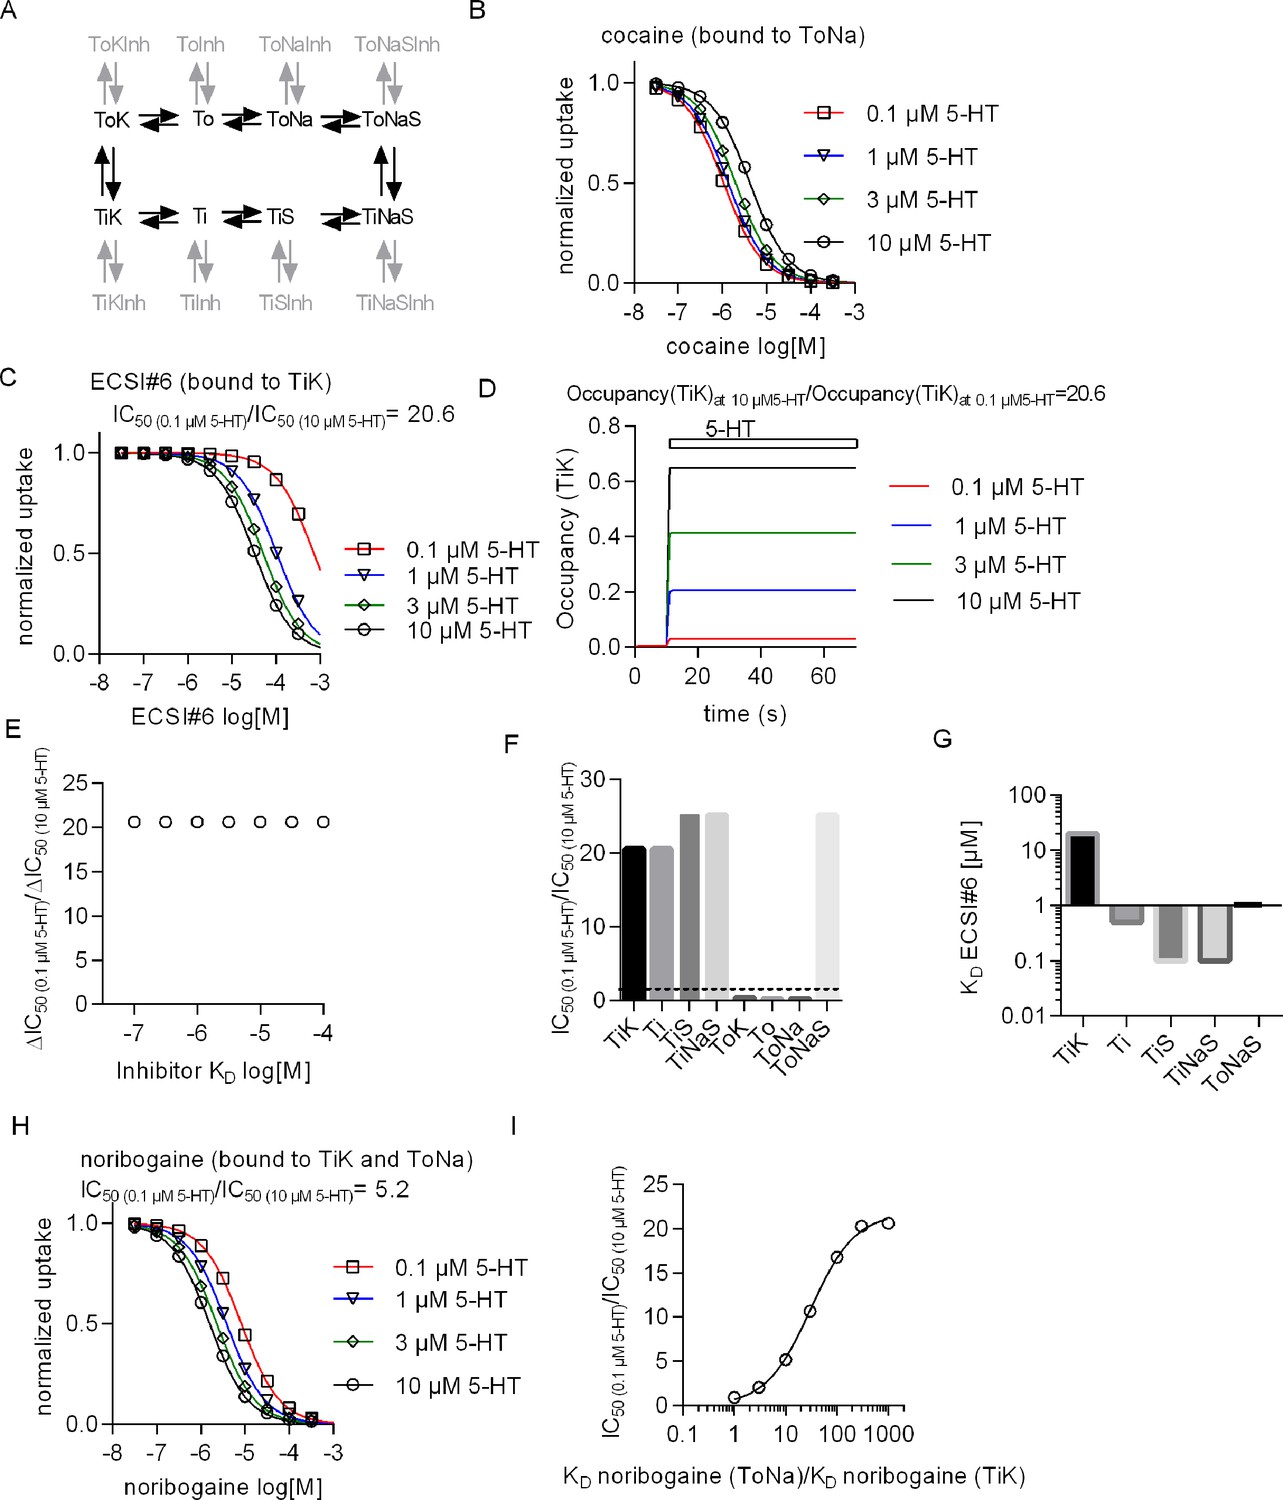
Conformational preference of cocaine, noribogaine, and ECSI#6 for binding to serotonin transporter (SERT).
(A) Reaction scheme (black) of a simple kinetic model of substrate transport by the SERT. The chosen microscopic rate constants were as follows: kon(K+)=106 M–1 s–1, koff(K+)=5000 s–1, kon(Na+)=106 M–1 s–1, koff(Na+)=1000 s–1, kon(5-HT)=107 M–1 s–1, koff(5-HT)=500 s–1, ToNaS→TiNaS = 60 s–1, TiNaS→ToNaS = 75 s–1, TiK→ToK = 5 s–1, ToK→TiK = 4 s–1. The reactions in gray represent possible states where a SERT-specific inhibitor can bind. In the simulation we assumed that all inhibitors bind to SERT with the same association rate (i.e., kon(inhibitor)=106 M–1 s–1) and we set the KDs to the desired values by adjusting the corresponding dissociation rates (koff(inhibitor; KD = koff/kon)). A value in the range of 106 M–1 s–1 is typical for the kon of SERT inhibitors (Sandtner et al., 2016; Hasenhuetl et al., 2015). (B) Simulation of uptake inhibition by cocaine matches experimental data when the preferred state of cocaine binding is to the ToNa state. (C) Simulation of uptake inhibition by ECSI#6 matches experimental data when the preferred state of ECSI#6 binding is to the TiK state. The ratio of ECSI#6 IC50 in the presence of 0.1 and 10 μM 5-HT (IC50(10)/IC50(10)) is equal to 20.6. (D) Simulations of occupancy of TiK states with increasing concentrations of 5-HT over time. The ratio of steady-state 5-HT occupancy of TiK at 10 and 0.1 μM is also 20.6. (E) The observed shift in the ratio IC50(10)/IC50(10) is not affected, if the affinity of ECSI#6 for SERT is varied. (F) Assessment of the IC50(0.1/10) ratio upon assigning binding preference of ECSI#6 to different possible inhibitor-bound states. ECSI#6 shows a clear preference for the inward-facing states of SERT. The notable exception is the ToNaS state, which requires binding to an allosteric site in SERT. (G) The true affinity estimates of ECSI#6 were extracted from the simulations by assuming preferential binding to the indicated distinct states of SERT. (H) Simulation of uptake inhibition by noribogaine matches the experimental data, if the preferred state of noribogaine binding is to both ToNa and TiK states. (I) A ratio of IC50(10)/IC50(10) of 5, which was close to that observed in the actual experiments with noribogaine, can be recapitulated in the simulations, if the KD of noribogaine to the ToNa state is assumed to be 10-fold higher than the KD to the TiK state.
Figure 8
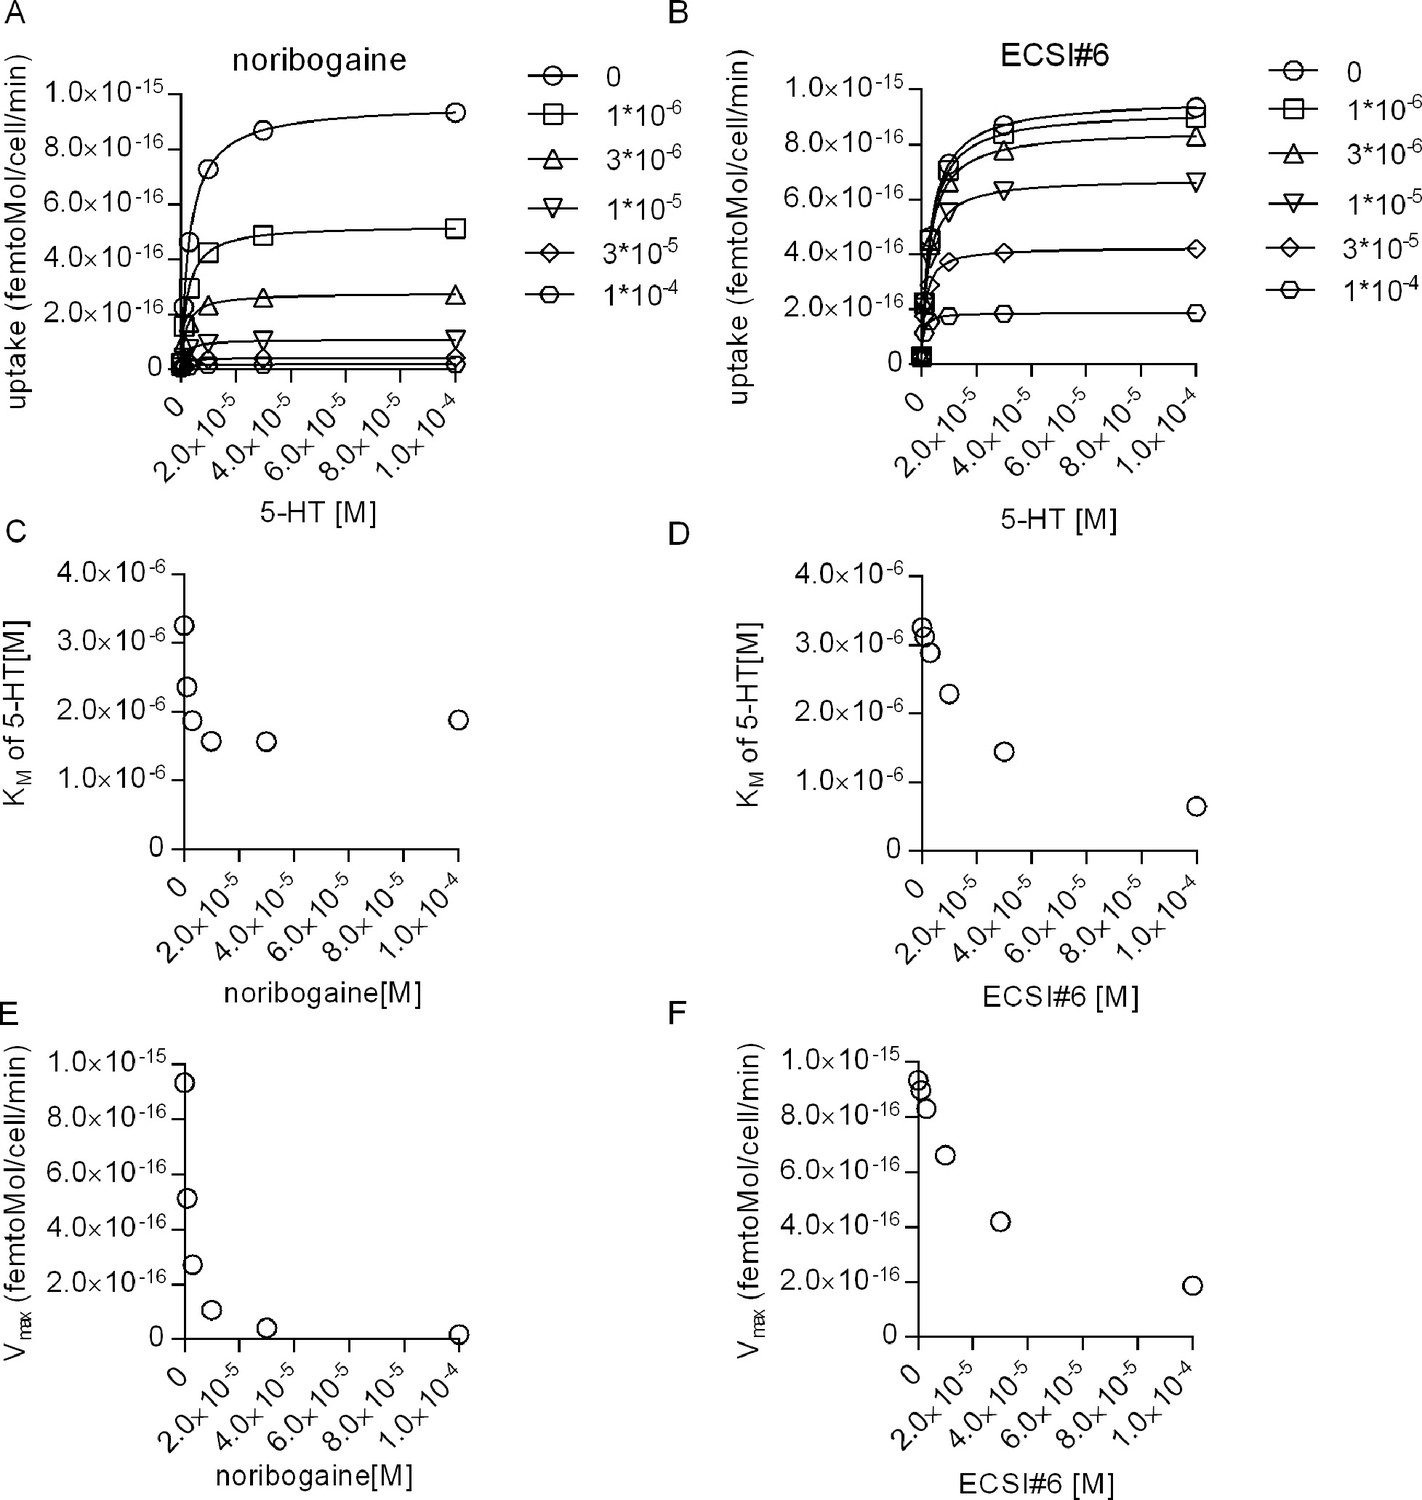
Interrogating the kinetic model to analyze the inhibition of substrate transport by serotonin transporter (SERT) by noribogaine and ECSI#6.
(A and B) Simulations of the saturation kinetics of SERT in the presence of the indicated concentrations of noribogaine (A) or ECSI#6 (B). The curves were generated using the reaction scheme depicted in Figure 7A and the parameters calculated in Figure 7 for noribogaine and ECSI#6. The KM of 5-HT uptake by SERT was extracted by fitting the data points to a rectangular hyperbola and plotted as a function of the concentration of noribogaine (C) and ECSI#6 (D). In (E) and (F) we show the Vmax values obtained from the simulation as a function of the noribogaine and ECSI#6 concentration, respectively.
Additional files
Download links
A two-part list of links to download the article, or parts of the article, in various formats.
Downloads (link to download the article as PDF)
Open citations (links to open the citations from this article in various online reference manager services)
Cite this article (links to download the citations from this article in formats compatible with various reference manager tools)
A mechanism of uncompetitive inhibition of the serotonin transporter
eLife 12:e82641.
https://doi.org/10.7554/eLife.82641


