Identification of a GABAergic neural circuit governing leptin signaling deficiency-induced obesity
- USDA/ARS Children’s Nutrition Research Center, Department of Pediatrics, Baylor College of Medicine, United States
Figures
Figure 1 with 3 supplements
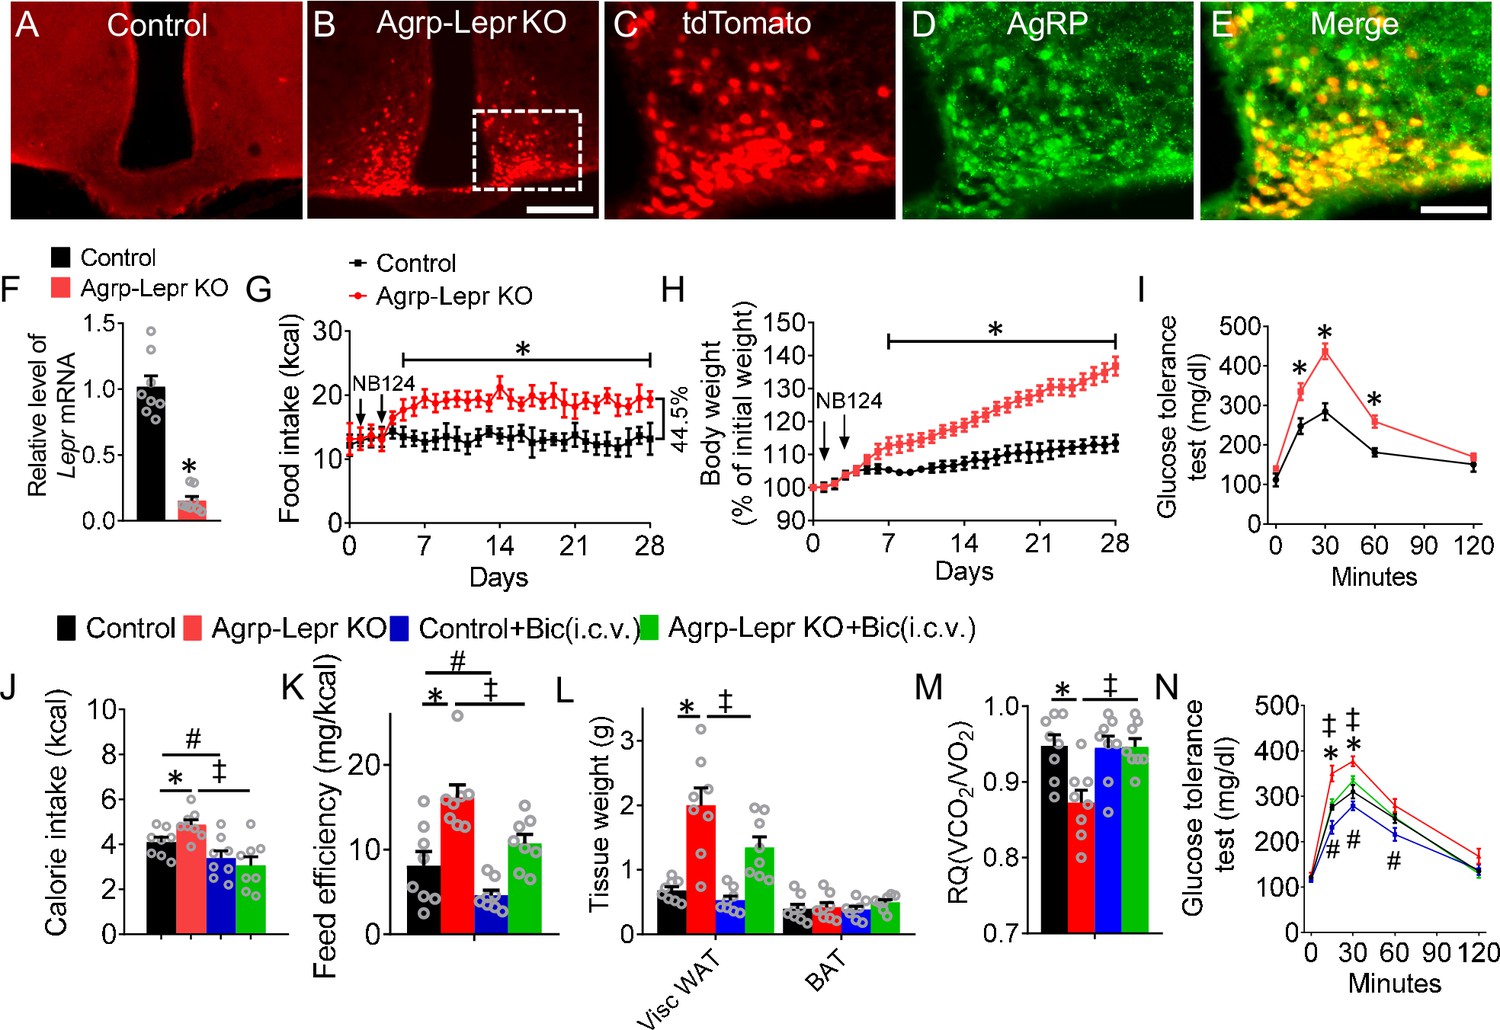
Suppressing GABAA signaling reverses feeding and metabolic dysfunction induced by leptin deficiency in AgRP neurons.
(A,B) Expression of tdTomato in the arcuate nucleus with injection of NB124 into the 3rd ventricle for both Agrp+/+::Leprlox/lox::NeoR::Rosa26fs-tdTomato mice (control, (A)) and AgrpnsCre/+::Leprlox/lox::NeoR::Rosa26fs-tdTomato mice (Agrp-Lepr KO, (B)). Scale bar in B for A and B, 200 μm. (C–E) Colocalization of tdTomato (C) and anti-AgRP (D) in ARC. Scale bar in E for C–E, 100 μm. (F) Real-time qPCR analysis of Lepr transcript levels within the AgRP neurons of the control and Agrp-Lepr KO mice. (n=8 per group; *p<0.05). (G–I) Daily calorie intake (G) and body weight (H) of the control and Agrp::LeprKO mice. The GTT (I) was tested on the day 21 after injection of NB124. (n=8 per group; *p<0.05). (J) The 4-hr food intake by the control and Agrp-Lepr KO mice after chronic infusion of Bic (1 ng) into the 3rd ventricle for 4 weeks. (K) Feeding efficiency is presented as mg of body weight gain/kcal consumed in the mice as described in J. (L) Weight of adipose tissues in the mice as described in J (Visc WAT: visceral white adipose tissue; BAT: brown adipose tissue). (M) Average value for RQ (defined as ratio of VCO2/VO2) tested on Day 28 in the mice as described in J. (N) The GTT was performed in the mice as described in J. (n=8 per group in J–N; *p<0.05 between Control and Agrp-Lepr KO, #p<0.05 between Control and Control +Bic(i.c.v.), ‡p<0.05 between Agrp-Lepr KO and Agrp-Lepr KO +Bic(i.c.v.)). Error bars represent mean ± SEM. unpaired two-tailed t test in F; one-way ANOVA and followed by Tukey comparisons test in J–M; two-way ANOVA and followed by Bonferroni comparisons test in G–I, and N.
-
Figure 1—source data 1
The original data of body weight, food intake, and GTT for Figure 1.
- https://cdn.elifesciences.org/articles/82649/elife-82649-fig1-data1-v1.xlsx
Figure 1—figure supplement 1
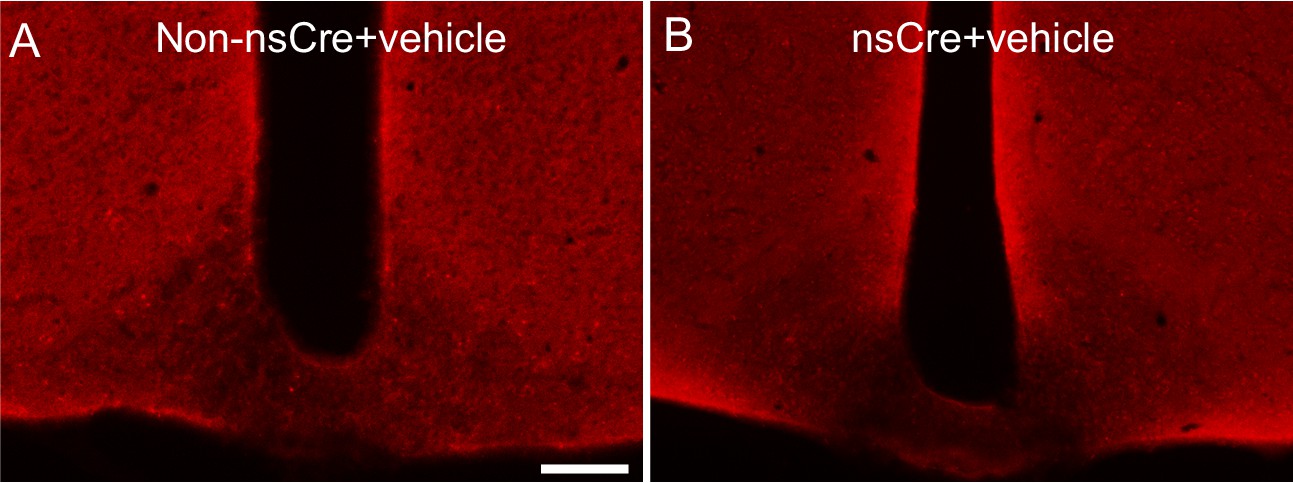
Representative images of the arcuate nucleus with injection of vehicle into the 3rd ventricle for both Agrp+/+::Leprlox/lox::NeoR::Rosa26fs-tdTomato mouse (A) and AgrpnsCre/+::Leprlox/lox::NeoR::Rosa26fs-tdTomato mouse (B).
Scale bar in A for A and B, 200 μm.
Figure 1—figure supplement 2
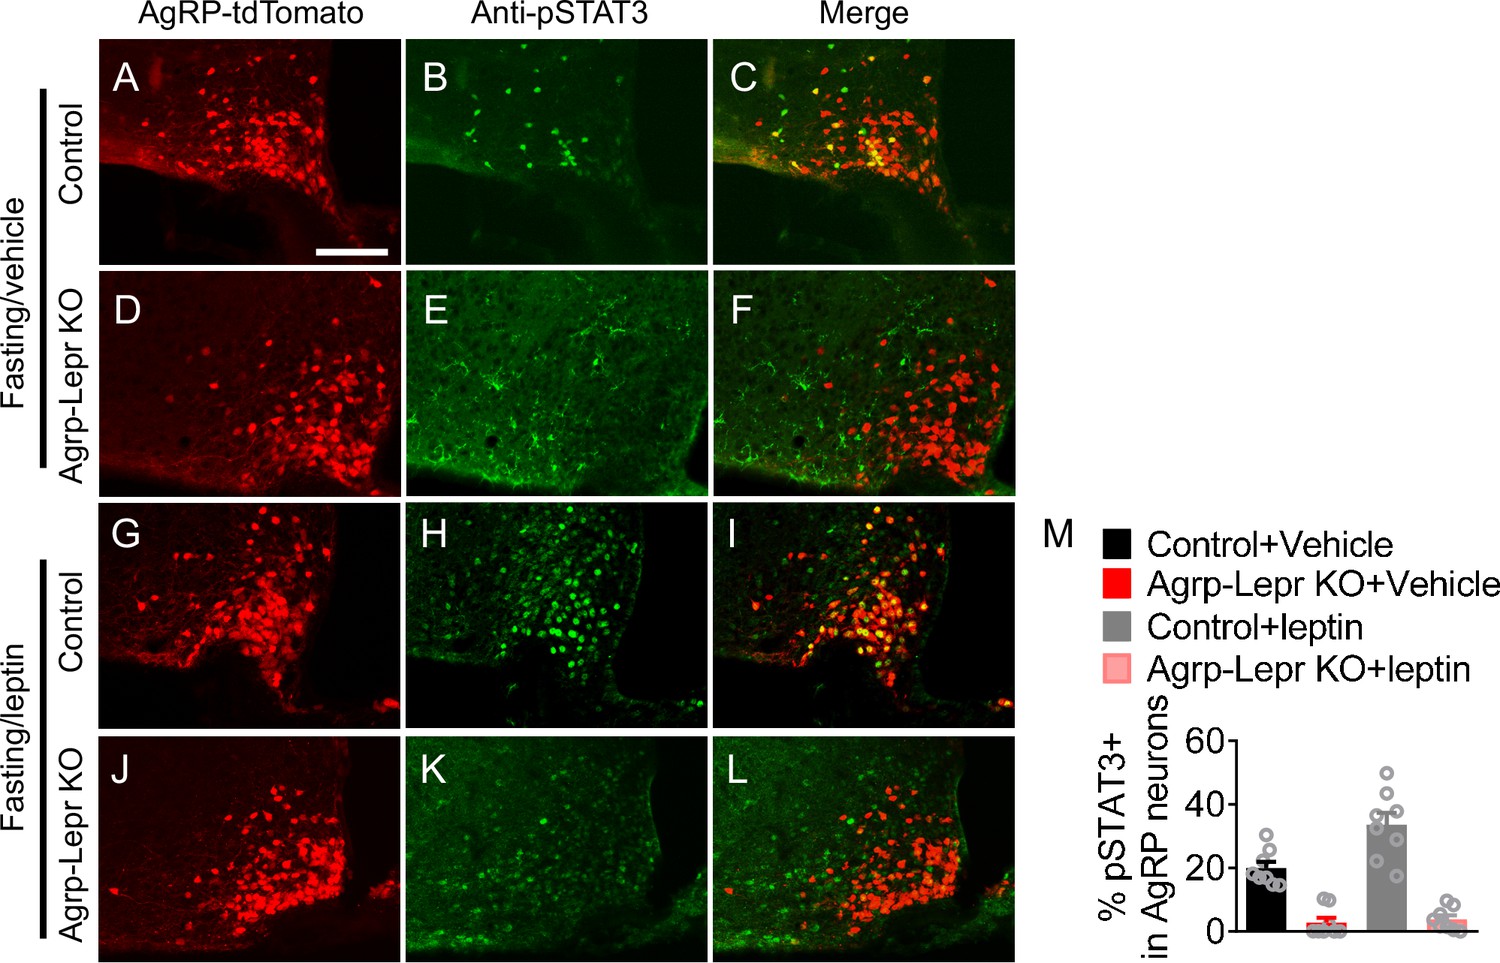
Representative images of pSTAT3 immunofluorescent staining in the ARC of fasted control and Agrp-Lepr KO mice with vehicle (A–F) or leptin i.c.v injections (G–L).
The percentage of pSTAT3 +in AgRP neurons are quantified (M). (n=8 per group).
Figure 1—figure supplement 3
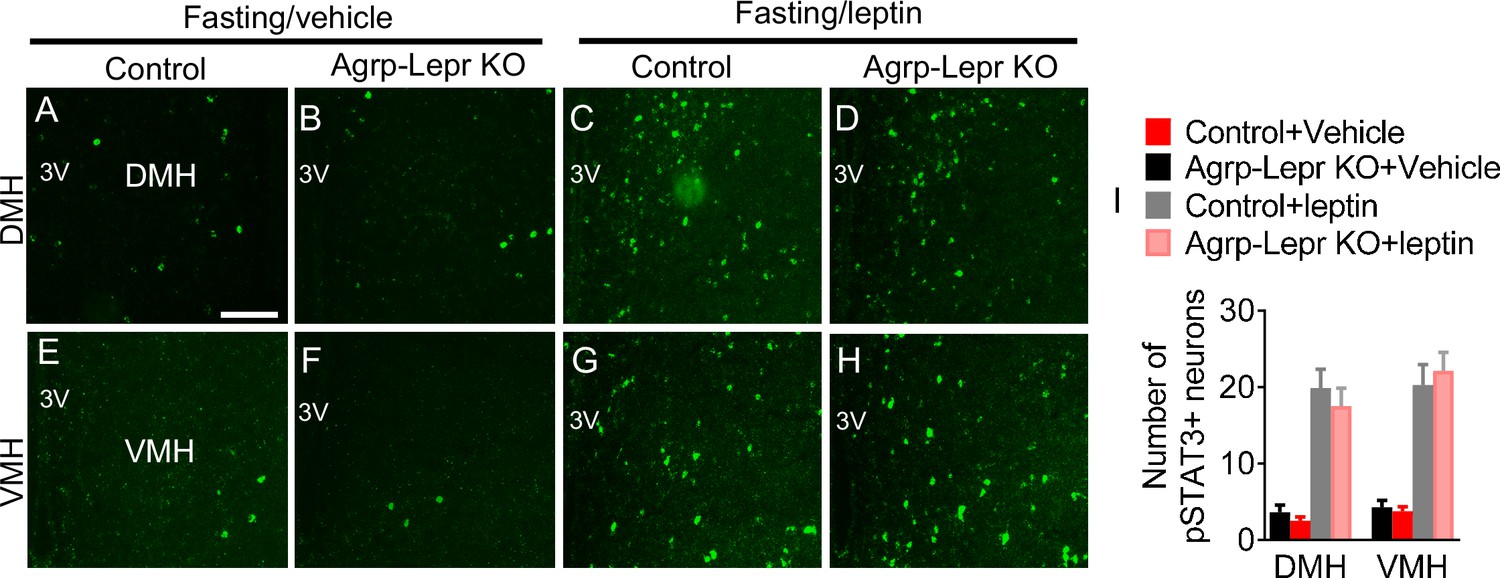
Representative images of pSTAT3 immunofluorescent staining in the DMH and VMH of fasted control and Agrp-Lepr KO mice with vehicle (A–B, E–F) or leptin i.c.v injections (C–D, G–H).
The number of pSTAT3 +neurons from unilateral side are quantified (I). (n=8 per group).
Figure 2 with 2 supplements
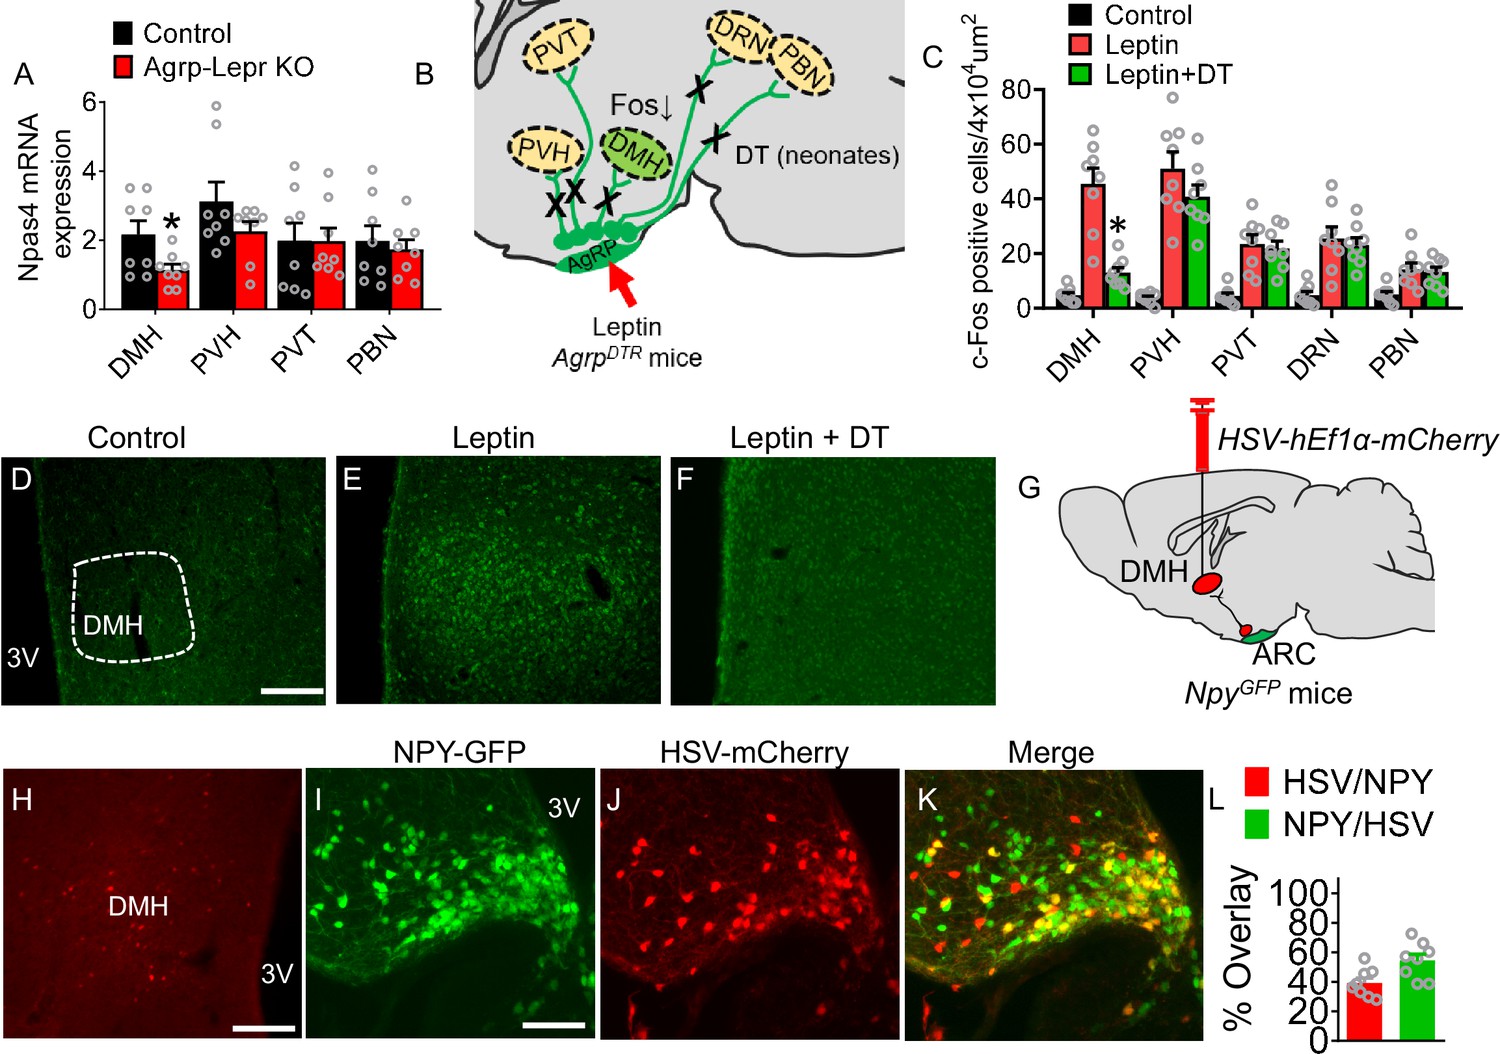
Identification of downstream targets of the leptin-responsive AgRP neurons.
(A) Real-time qPCR analysis of transcript levels of Npas4 expressed in the DMH, PVH, PVT, and PBN in the control and Agrp-Lepr KO mice. (n=8 per group; *p<0.05). (B) The schematic diagram showing Fos activities in downstream targets of AgRP neurons after treatment of leptin combined with or without neonatal ablation of AgRP neurons. (C–F) Expression profiling of Fos (green) in the DMH under vehicle (D), leptin (i.p.) (E), leptin (i.p.) and DT (s.c. neonates) (F). Scale bar in D for D–F, 200 μm. (n=8 per group; *p<0.05). (G) Diagram shows retrograde tracing of AgRPARC→DMH neurons by injection of HSV-hEf1α-mCherry into the DMH of NpyGFP mice. (H–K) The fluorescence in the DMH (H) and ARC (I–K, yellow, DMH-projecting AgRP neurons). Scale bar in H, 200 µm; scale bar in I for (I–K), 100 µm. (L) Quantification of overlap of HSV-hEf1α-mCherry and NPY-GFP. (n=8 per group). Error bars represent mean ± SEM; unpaired two-tailed t test in A; one-way ANOVA and followed by Tukey comparisons test in C.
-
Figure 2—source data 1
The histological data for Figure 2.
- https://cdn.elifesciences.org/articles/82649/elife-82649-fig2-data1-v1.xlsx
Figure 2—figure supplement 1
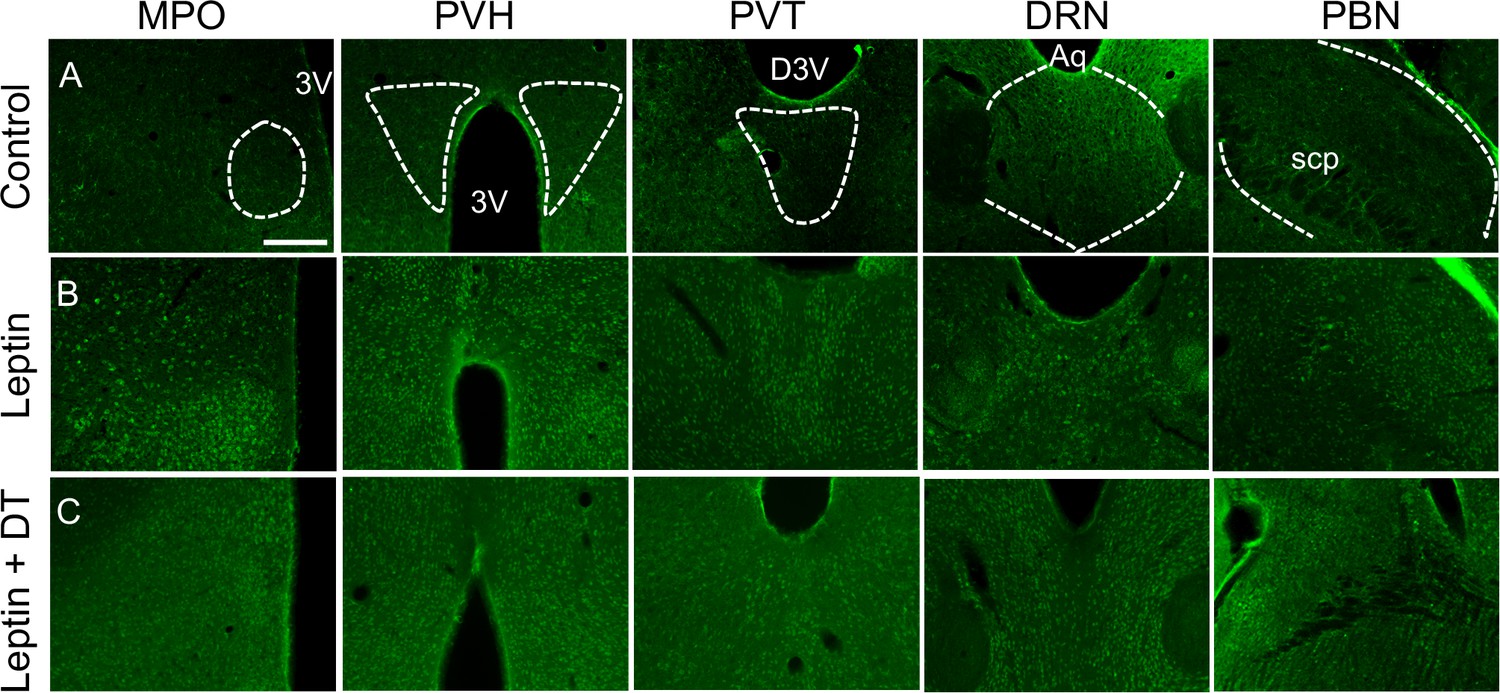
Expression profiling of Fos (green) in the PVH, PVT, DRN, and PBN under vehicle (A), leptin (i.p.) (B), leptin (i.p.) and DT (s.c. neonates) (C).
Scale bar in A for A–C, 200 μm.
Figure 2—figure supplement 2
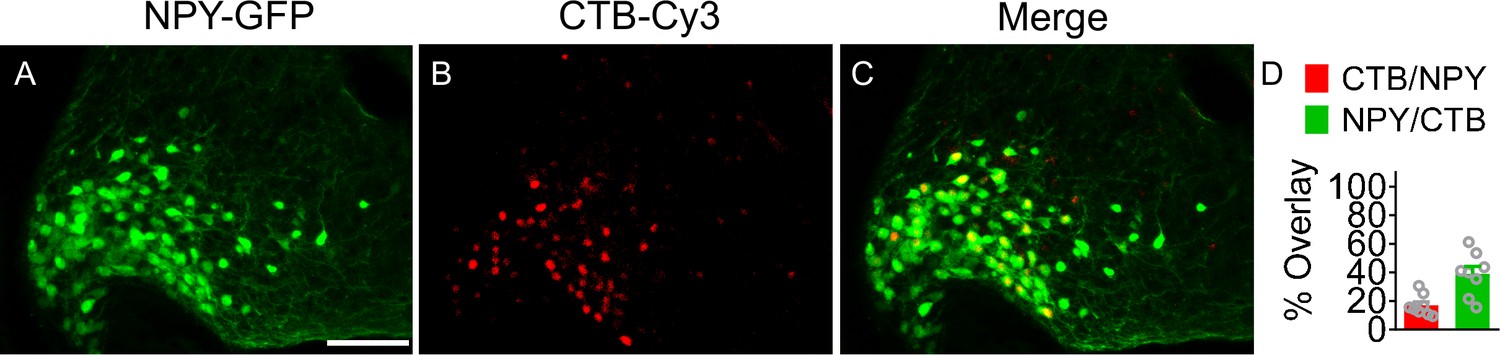
Retrograde tracing of AgRPARC→DMH neurons by injection of CTB into the DMH of NpyGFP mice.
(A–C) The fluorescence in the ARC. Scale bar in A for A–C, 100 µm. (D) Quantification of overlap of CTB-Cy3 and NPY-GFP in the ARC. (n=8 per group).
Figure 3 with 1 supplement
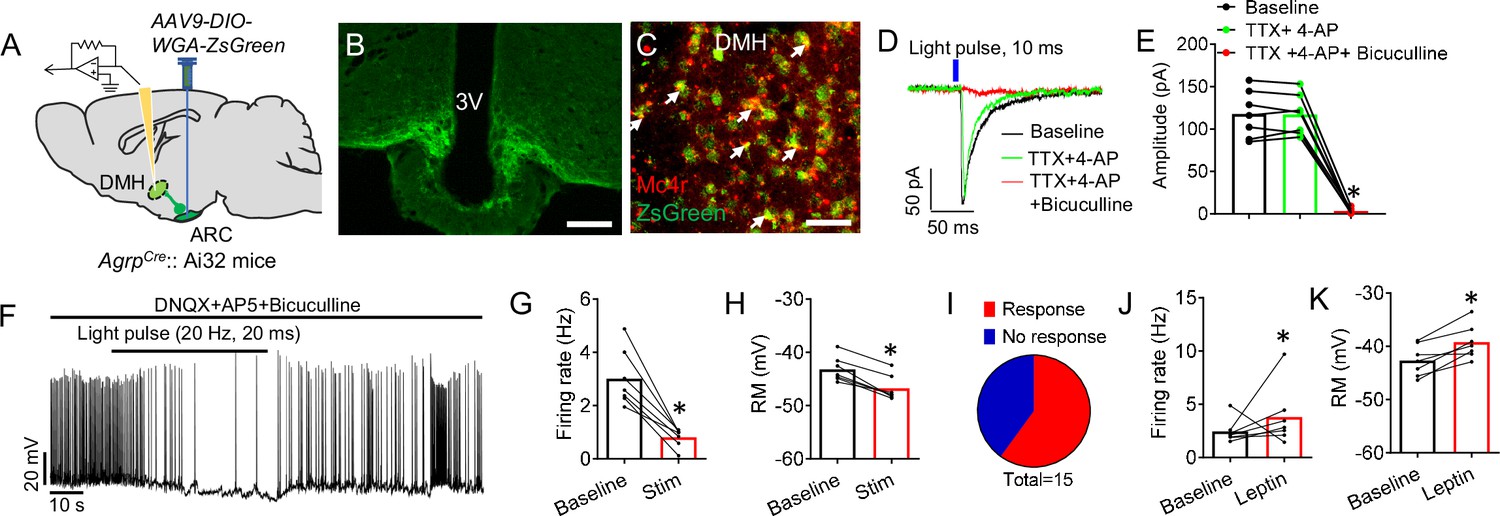
Leptin-responsive AgRP neurons directly innervate DMH neurons.
(A) Diagram of transsynaptic tracing downstream targets from AgRP neurons. AAV9-DIO-WGA-ZsGreen, a Cre-dependent tracer that labels neurons with synaptic connections, was injected into the ARC of AgrpCre::Ai32 mice. Ai32 mice express ChR2/EYFP fusion protein conditioned Cre-mediated recombination. (B) ChR2-EYFP-labeled AgRP neurons in the ARC. Scale bar, 200 μm. (C) Double-labeling of MC4R neurons with transsynaptic WGA-ZsGreen in the DMH (C), green, ZsGreen RNA in situ; red, Mc4r RNA in situ. Scale bar, 100 μm. (D) The response of IPSCs recorded from an ZsGreen+ neuron upon photostimulation of AgRP terminals within the DMH (10ms pulse) with a pretreatment of vehicle or TTX +4 AP, and in slices pretreated with either TTX +4 AP or TTX +4-AP+Bic. (E) Statistical amplitude analysis of IPSCs from neurons recorded in D. (n=7 neurons; *p<0.05 between TTX +4 AP and TTX +4-AP+Bic). (F) Representative spikes of ZsGreen-labeled DMH neurons before and after blue light pulses (20ms/pulse, 20 Hz) shined onto AgRP axonal fibers. (G–I) Firing frequency (G), resting membrane (H), and statistical analysis (I) of neurons recorded in F (n=7 neurons; *p<0.05). (J,K) Firing frequency (J), and resting membrane (K) of ZsGreen-labeled DMH neurons with or without leptin i.p. treatment. (n=7 neurons; *p<0.05). Error bars represent mean ± SEM. paired two-tailed t test in G,H, J, and K; one-way ANOVA and followed by Tukey comparisons test in E.
-
Figure 3—source data 1
The original data of firing rate and rest membrane potential from in vitro electrophysiological recording in Figure 3.
- https://cdn.elifesciences.org/articles/82649/elife-82649-fig3-data1-v1.xlsx
Figure 3—figure supplement 1
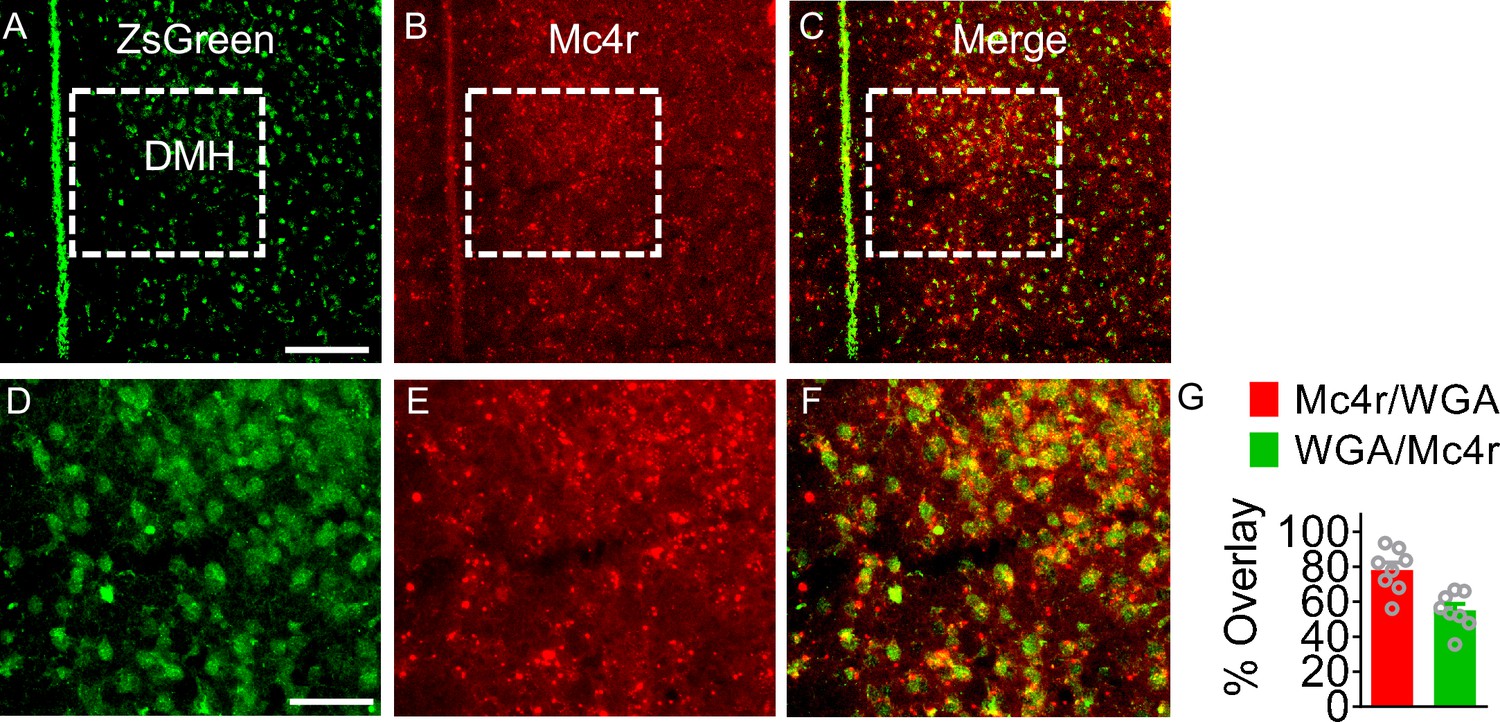
Colocolization of ZsGreen and Mc4r in the DMH.
Double-labeling of MC4R neurons with transsynaptic WGA-ZsGreen in the DMH (A) and (D), green; WGA-ZsGreen; (B) and (E), red, Mc4r RNA in situ. Scale bar in A for A–C, 200 μm, scale bar in D for D–F, 100 μm. (G) Quantification of overlap of Mc4r and WGA in the DMH. (n=8 per group).
Figure 4 with 2 supplements

The leptin-responsive AgRP-DMH circuit regulates feeding, body weight, and glucose tolerance.
(A,B) 1-hr food intake (A) and GTT (B) after photostimulation of the AgRP→DMH circuit. (n=8 per group; *p<0.05). (C,D) 1-hr refeeding test (C) and GTT (D) after photostimulation of the MC4RDMH neurons. (n=8 per group; *p<0.05). (E–G) Daily food intake (E), body weight (F) and GTT (G) in control mice, Agrp-Lepr KO mice with Bic or vehicle injected into the DMH. The saline or Bic (4 ng; 0.25 μl/hr) was chronically infused into the DMH via the osmotic minipump for 14 days. (n=8 per group; *p<0.05 between Control and Agrp-Lepr KO, #p<0.05 between Agrp-Lepr KO and Agrp-Lepr KO +Bic(DMH), ‡p<0.05 between Control and Control +Bic(DMH)). (H) 4-hr food intake in the mice described in E-G on day 14. (I) Feed efficiency in the mice described in E–G. (J) Weight of adipose tissues in the mice described in E–G on day 14. (K) Average value for RQ (VCO2/VO2) in the mice described in E–G on day 14. (n=8 per group in H–K; *p<0.05 between Control and Agrp-Lepr KO, #p<0.05 between Agrp-Lepr KO and Agrp-Lepr KO +Bic(DMH)). (L–O) Firing rate of representative MC4RDMH neurons and non-MC4RDMH neurons when mice under baseline (satiation) (L, N), foraging (prior to meal initiation) (M), and glucose i.p. injection (well-fed state) (O). The statistical analysis of the firing rate under baseline, foraging (P), and glucose treatment (Q) were calculated. (n=10 neurons from 3 mice in each group; *p<0.05). Error bars represent mean ± SEM. unpaired two-tailed t test in A, C, P and Q; one-way ANOVA and followed by Tukey comparisons test in H–K; two-way ANOVA and followed by Bonferroni comparisons test in B and D–G.
-
Figure 4—source data 1
The original data of body weight, food intake, GTT, and firing rate of MC4R neurons in the DMH for Figure 4.
- https://cdn.elifesciences.org/articles/82649/elife-82649-fig4-data1-v1.xlsx
Figure 4—figure supplement 1
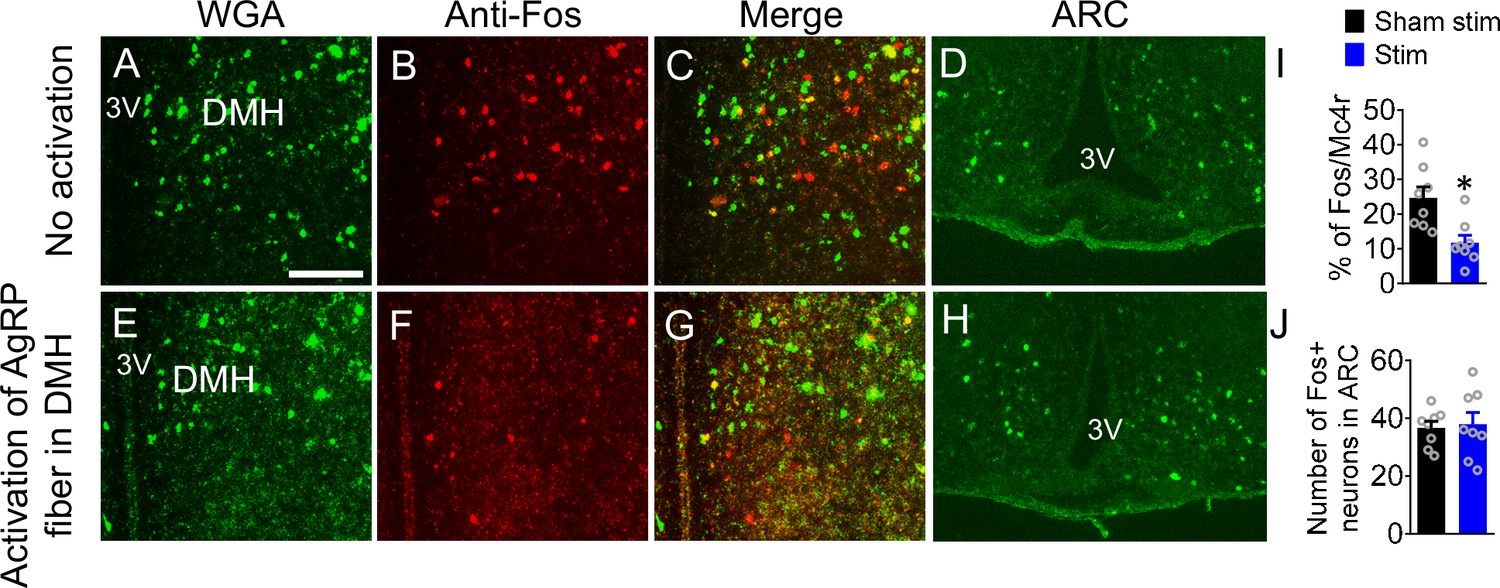
Immunostaining of Fos and WGA-ZsGreen in the DMH of AgrpCre::Roas26fs-ChR2 mice with (E–G) or without (A–C) optogenetic activation of AgRP fiber in the DMH.
The Fos expression in the ARC was examined with (H) or without (D) optogenetic activation of AgRP fiber in the DMH. Scale bars in A for A–H, 100 µm. (I) The percentage of overlay between Fos and Mc4r in the DMH of the mice as described in A–H. (J) The number of Fos +neurons from bilateral sides of ARC (n=8 per group; *p<0.05; unpaired two-tailed t test).
Figure 4—figure supplement 2
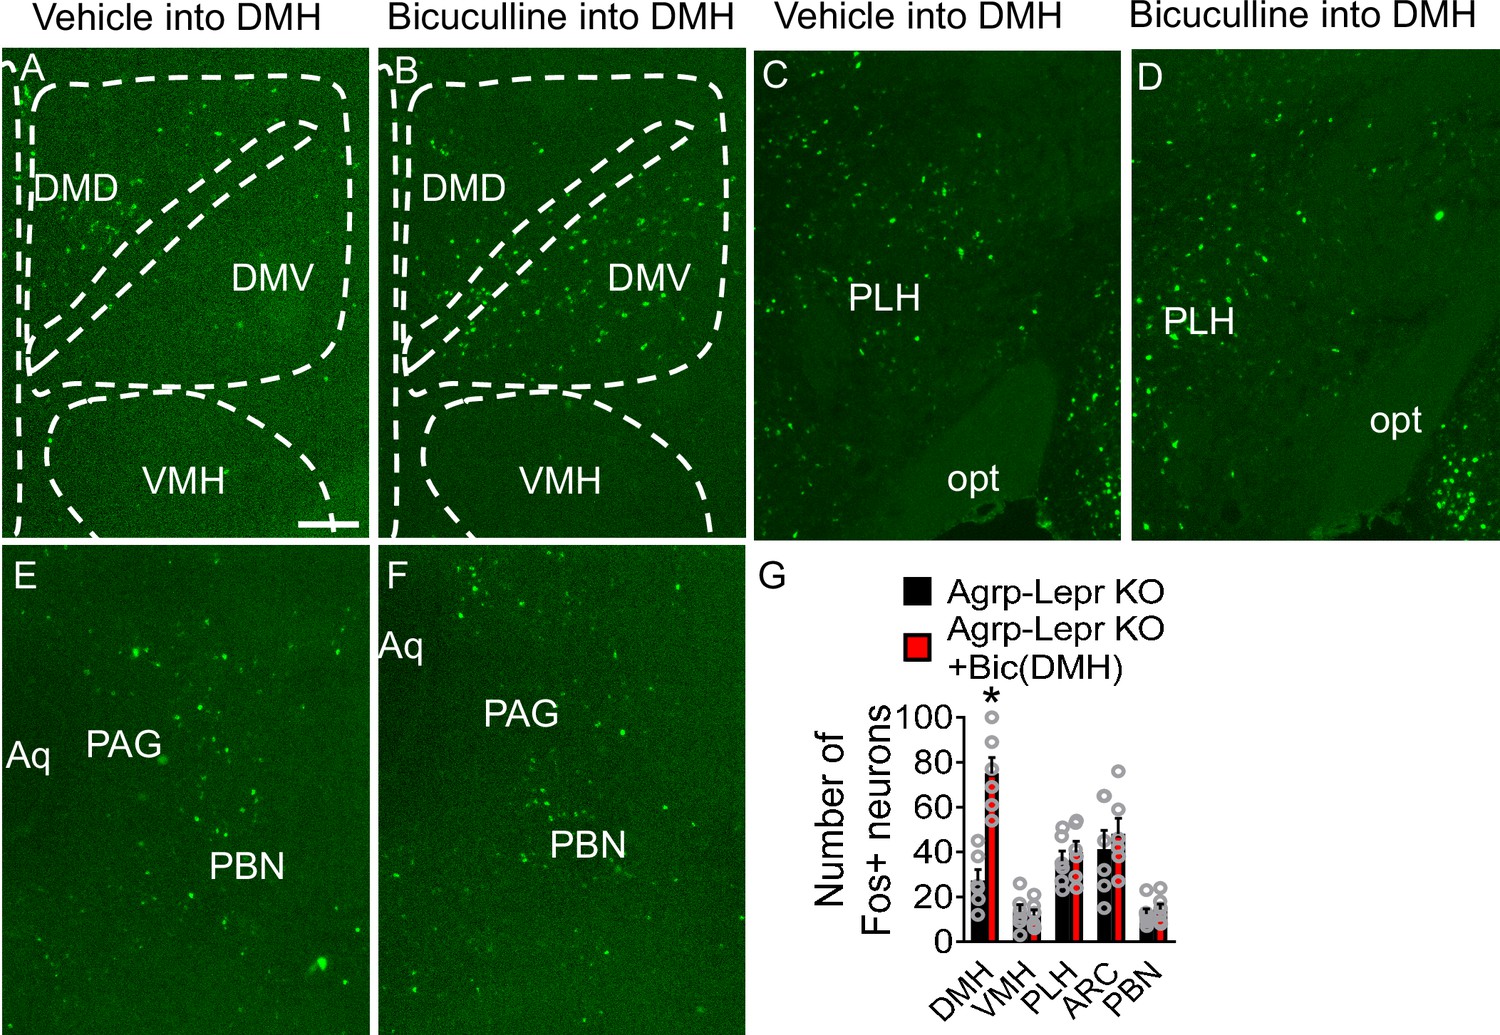
The Fos expression in the DMH and other brain regions after infusing Bic into DMH.
(A–F) Representative images of Fos inmmunostaining in the DMH (A–B), PLH (C–D), and PBN (E–F) of Agrp-Lepr KO mice with Bic or vehicle injected into the DMH. The saline or Bic was chronically infused into the DMH via the osmotic minipump. Scale bars in A for A–F, 200 µm. (G) Statistic data about the number of Fos +neurons from unilateral side in the mice described in A–F. (n=6 per group; *p<0.05; unpaired two-tailed t test).
Figure 5 with 2 supplements
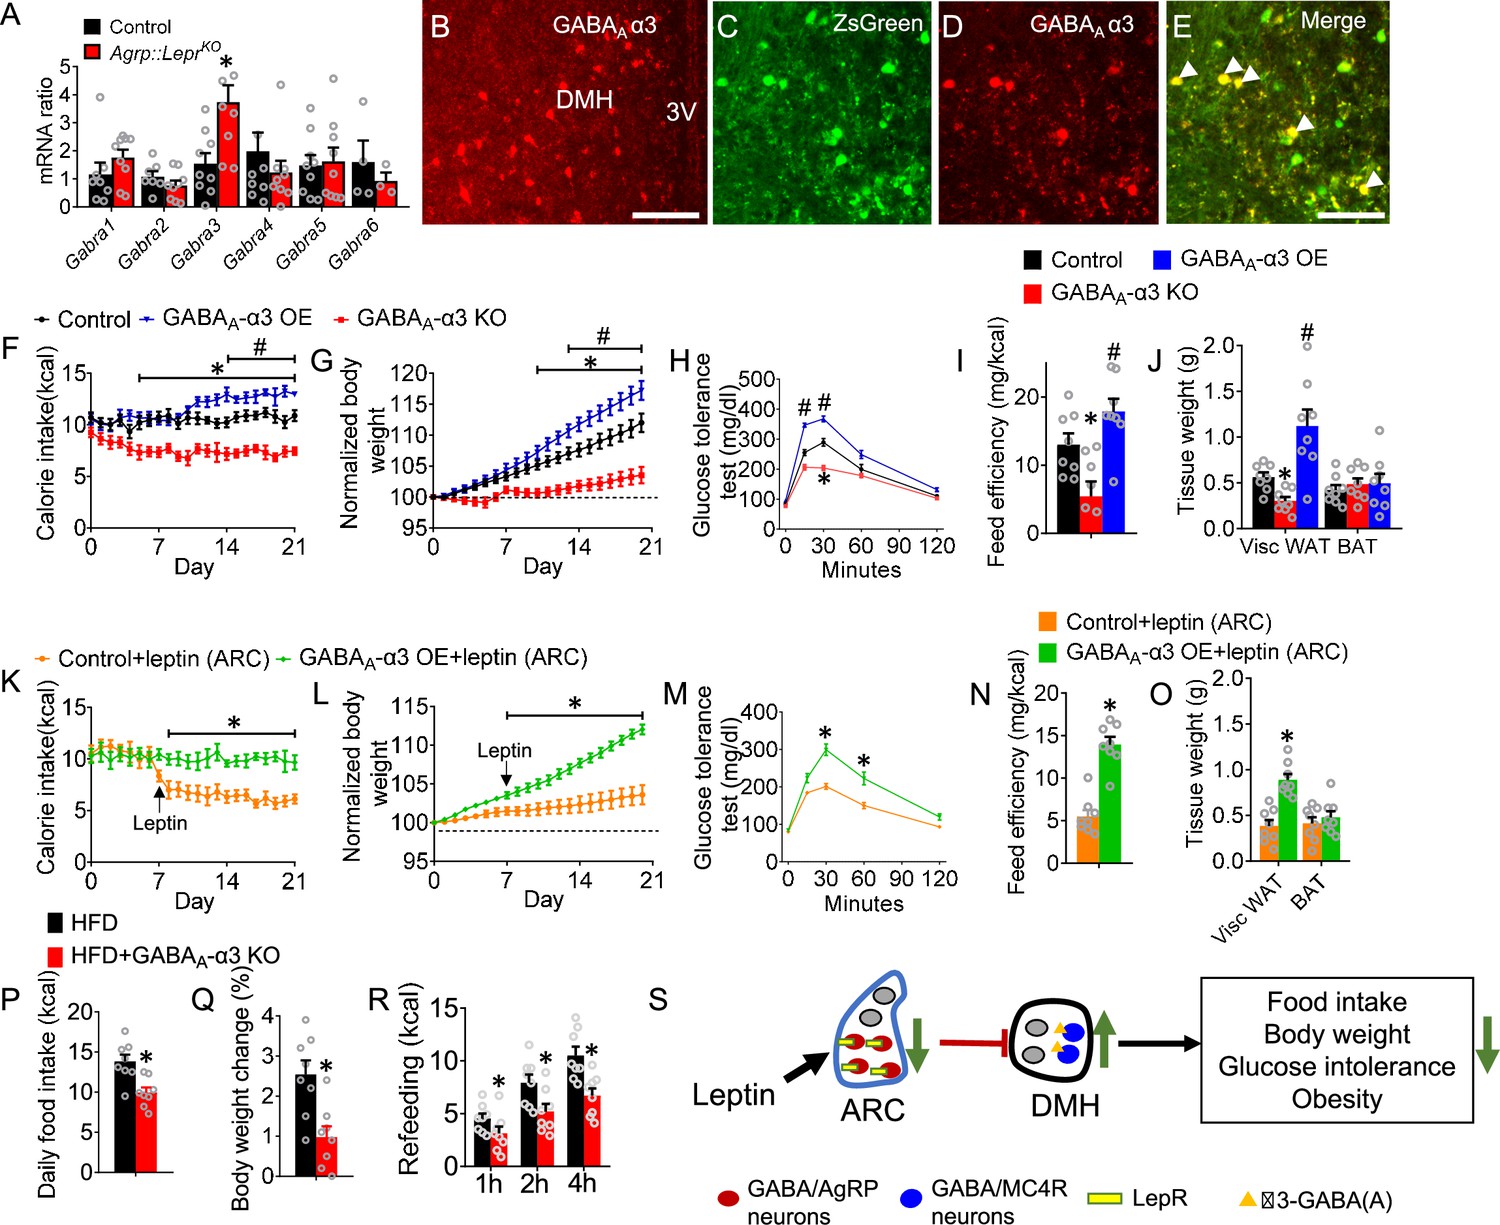
The α3-GABAA receptor signaling within the MC4RDMH mediates feeding and glucose tolerance.
(A) Expression level of Gabra1- Gabra6 in the DMH neurons of control and Agrp-Lepr KO mice. (B) Immunostaining showing the expression of GABAA α3 in the DMH. Scale bar, 100 μm. (C–E) Colocalization of GABAA α3 and transsynaptically labeled neurons by WGA-ZsGreen in the DMH after injection of AAV9-DIO-WGA-ZsGreen into the ARC of AgrpCremice. Scale bar in E for C–E, 50 μm. (F–H) The food intake (F), body weight (G), and GTT (H) were performed in Mc4rCre::Rosa26fs-Cas9 mice with a bilateral injection of vehicle, AAV9-Gabra3sgRNA-tdTomato (GABAA-α3 KO), or AAV9-DIO-Gabra3cDNA-EYFP (GABAA-α3 OE) into the DMH. (I) Feeding efficiency in the mice described in F–H. (J) Weight of adipose tissues in the mice described in F–H. n=8 per group in F–J; *p<0.05 between Control and GABAA-α3 KO, #p<0.05 between Control and GABAA-α3 OE. (K–O) The food intake (K), body weight (L), GTT (M), feeding efficiency (N), and weight of adipose tissues (O) were performed in control mice and GABAA-α3 OE mice followed by the microinjection of leptin into ARC. (n=8 per group in K-O; *p<0.05 between Control +leptin and GABAA-α3 OE +leptin). (P–R) The 24-hr food intake (P), body weight change (Q), and refeeding test (R) were performed in HFD-treated with or without knockout of GABAA-α3. (n=8 per group; *p<0.05). Error bars represent mean ± SEM. unpaired two-tailed t test in A and N–R; one-way ANOVA and followed by Tukey comparisons test in I and J; two-way ANOVA and followed by Bonferroni comparisons test in F–H and K–M. (S) Diagram showing a leptin regulated GABAergic neural circuit reverses obesity. The GABAergic AgRPLepR→DMH circuit plays a critical role in control of leptin-mediated food intake, body weight, and glucose tolerance through the α3-GABAA signaling within the MC4RDMH neurons.
-
Figure 5—source data 1
The original data of body weight, food intake, and GTT for Figure 5.
- https://cdn.elifesciences.org/articles/82649/elife-82649-fig5-data1-v1.xlsx
Figure 5—figure supplement 1
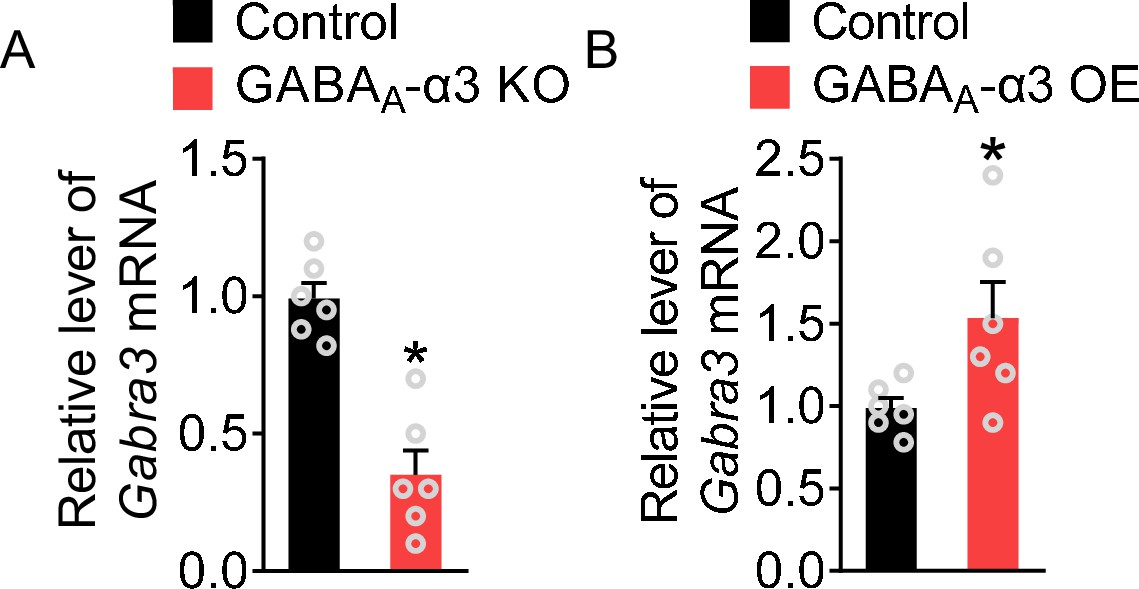
Quantification of gabra3 transcription levels in the DMH by qPCR 21 days after injection of AAV9-Gabra3sgRNA-tdTomato into DMH of Mc4rCre::Rosa26fs-Cas9 mice (A) or injection of AAV9-DIO-Gabra3cDNA-EYFP into DMH of Mc4rCre mice (B).
(n=6 per group; *p<0.05; unpaired two-tailed t test).
Figure 5—figure supplement 2
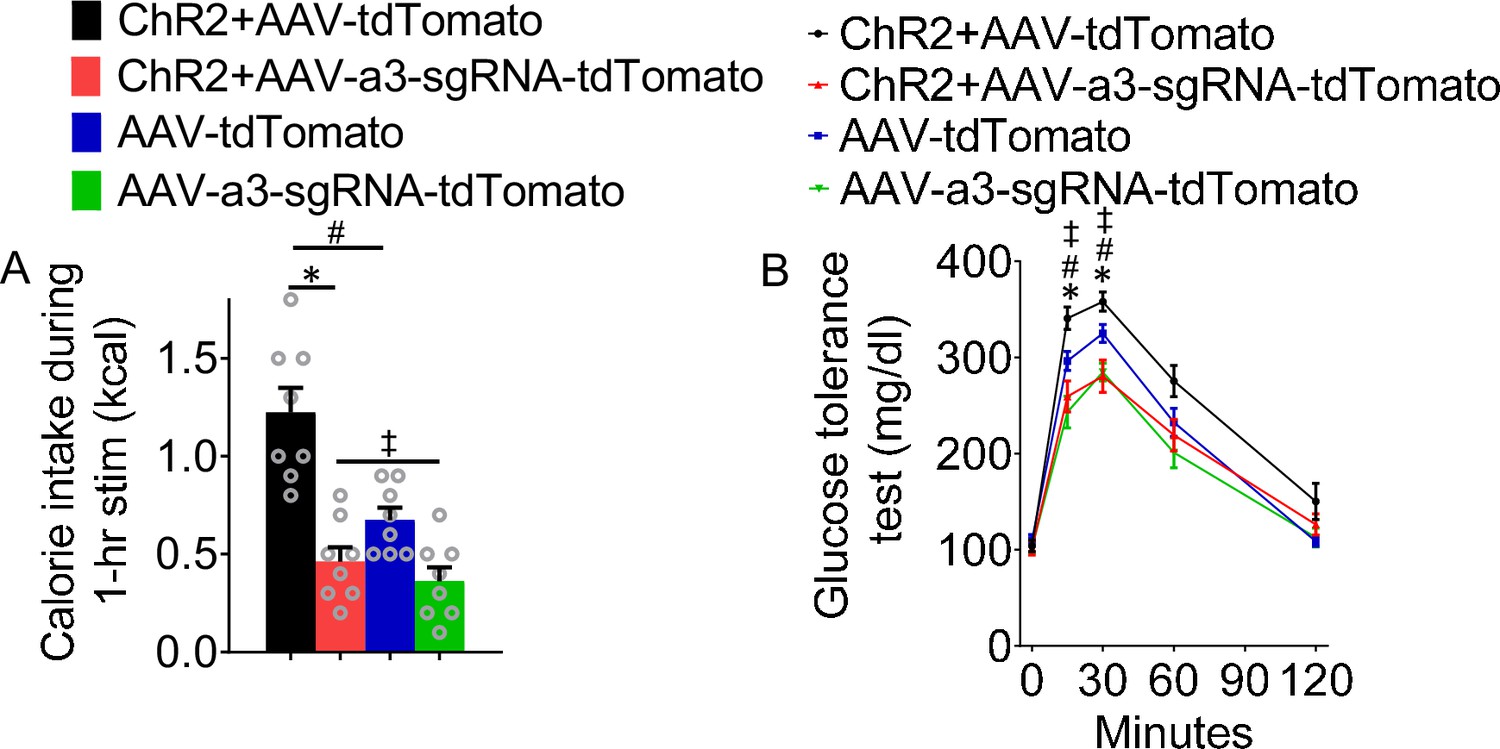
The AgRP-DMH circuit regulates feeding and glucose tolerance depending on the α3-GABAA receptor signaling in the MC4RDMH neurons.
(A–B) 1-hr food intake (A) and GTT (B) in mice with AAV9-fDIO-ChR2-EYFP into ARC, AAV9-DIO-Cas9-mCitrine and AAV9-Gabra3sgRNA-tdTomato injected into the DMH of NpyFlp::Mc4Cre mice followed with implantation of optic fiber in the DMH. n=8 per group; *p<0.05 between ChR2 +AAV-tdTomato and ChR2 +AAV-a3-sgRNA-tdTomato, #p<0.05 between ChR2 +AAV-tdTomato and AAV-tdTomato, ‡p>0.05 between ChR2 +AAV-a3-sgRNA-tdTomato and AAV-a3-sgRNA-tdTomato. Error bars represent mean ± SEM. One-way ANOVA and followed by Tukey comparisons test in A; two-way ANOVA and followed by Bonferroni comparisons test in B.
Additional files
Download links
A two-part list of links to download the article, or parts of the article, in various formats.
Downloads (link to download the article as PDF)
Open citations (links to open the citations from this article in various online reference manager services)
Cite this article (links to download the citations from this article in formats compatible with various reference manager tools)
Identification of a GABAergic neural circuit governing leptin signaling deficiency-induced obesity
eLife 12:e82649.
https://doi.org/10.7554/eLife.82649


