Axonal T3 uptake and transport can trigger thyroid hormone signaling in the brain
- Section of Adult and Pediatric Endocrinology and Metabolism, University of Chicago, United States
- Laboratory of Integrative Neuroendocrinology, Institute of Experimental Medicine, Hungary
- Laboratory of Molecular Cell Metabolism, Institute of Experimental Medicine, Hungary
- János Szentágothai PhD School of Neurosciences, Semmelweis University, Hungary
Figures
Figure 1 with 4 supplements
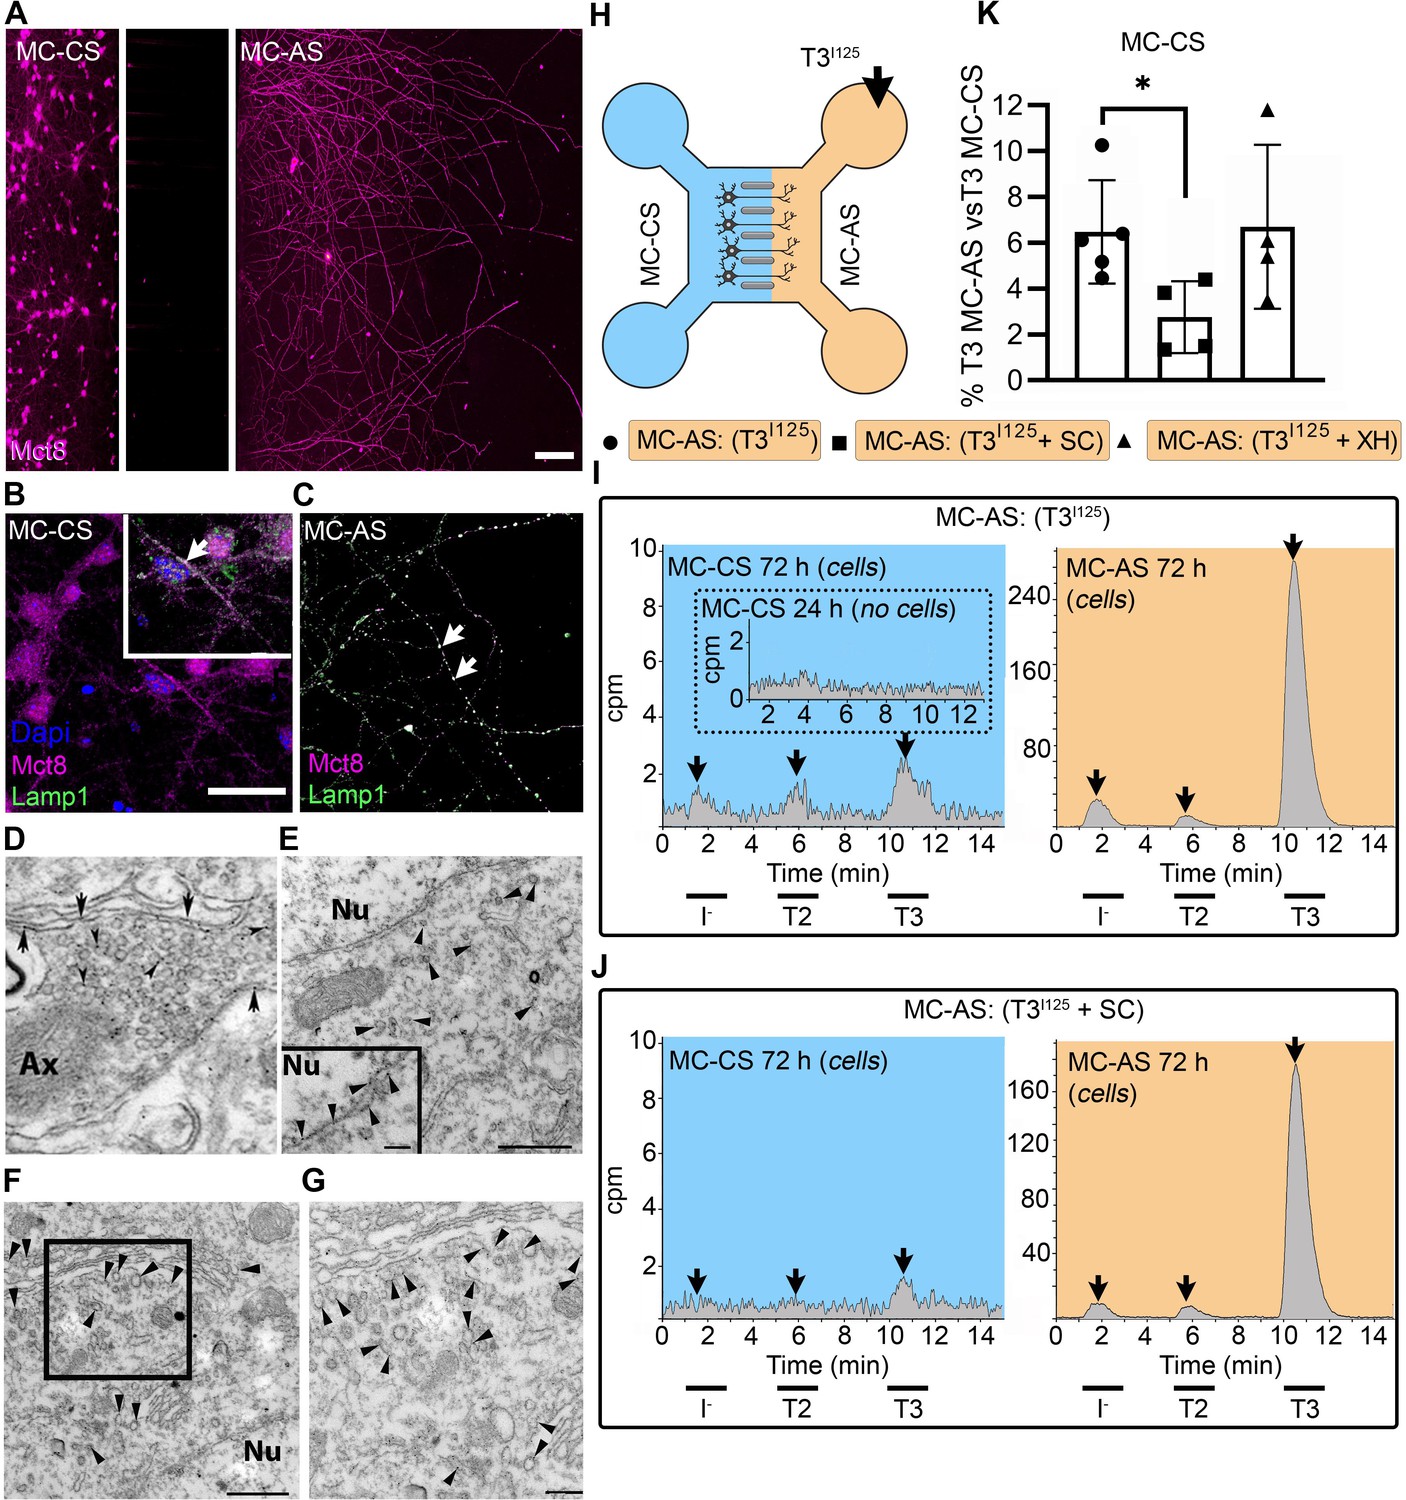
T3 is taken up and retrogradely transported through neuronal long distal axons.
(A-C) Immunofluorescence of cortical neurons in the compartmentalized device using the indicated antibodies (A) Collage of a compartmentalized culture stained for MCT8 (magenta). (B–C) MCT8 staining in magenta, Lamp1 in green; colocalization is indicated as white. (B) In the MC-CS and (C) in the MC-AS. (D) MCT8-immunoreactivity (silver grains) was present in the outer cell membrane of neuronal elements, and in the membrane of vesicles of axonal profiles (arrows and arrowheads, respectively), on the nuclear membrane (inset in E), in vesicles close to the nucleus of the neurons (E), and the trans and cis Golgi apparatus (F). (G) Detail of the squared area in (F, H). T3I125 was applied in the MC-AS. (I). After 72 hr, T3I125 was detected in the MC-CS medium (no T3I125 was detected after 24 hr; inset in the blue panel). (J). Effect of 2 µM SC on T3 uptake and transport. The size of the T3I125 peak in the MC-CS decreased after 72 hr compared to (I, K). Quantitation of T3I125 transported to the MC-CS medium under the indicated conditions. The Y-axis in % T3I125 in the MC-CS medium vs. T3I125 added to the MC-AS medium. Values are mean ± SD of 4–5 independent experiments; *p<0.05 in comparison with T3I125 incubation. SC, Silychristin; XH, Xanthohumol; Ax, axon; Nu, nucleus. Scale bars are 25 µM on A-E and G, 150 µM on F, 500 nm on J, K, and M, and 200 nm on L.
Figure 1—figure supplement 1
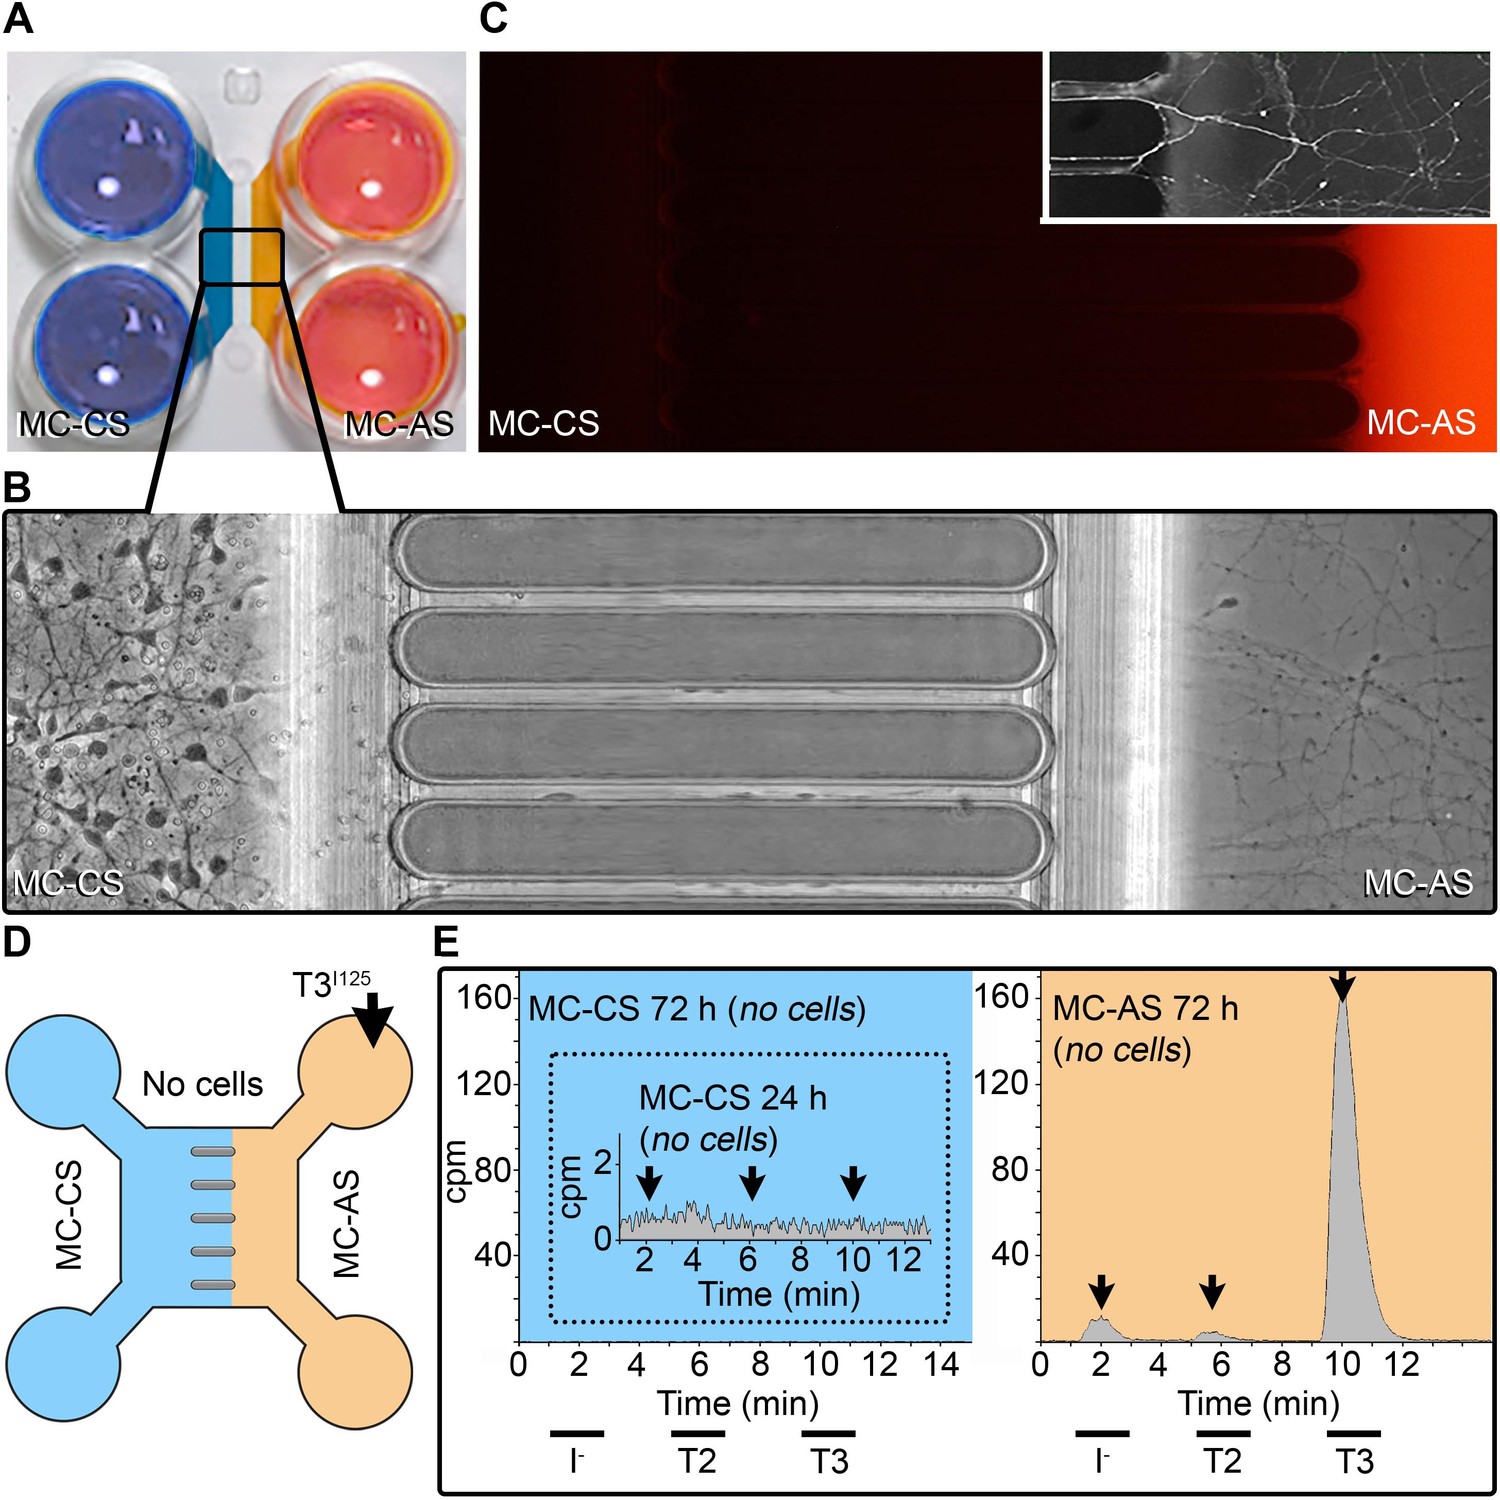
A system to study TH signaling in neurons.
(A) Microfluidic device showing the MC-CS in blue and the MC-AS in orange. (B). Typical neuronal growth at DIV ~10, the MC-AS is densely populated by axons (C). Applying Alexa Fluor 594 in the MC-AS demonstrate fluidic isolation. Inset shows calcein fluorescent axons. (D, E). In the absence of cells (no cells), T3I125 is applied in the MC-AS, and only background radioactivity was detected in the MC-CS. Chromatograms from the MC-AS (orange) show typical peaks of T3I125 T2I125, and II125.
Figure 1—figure supplement 2
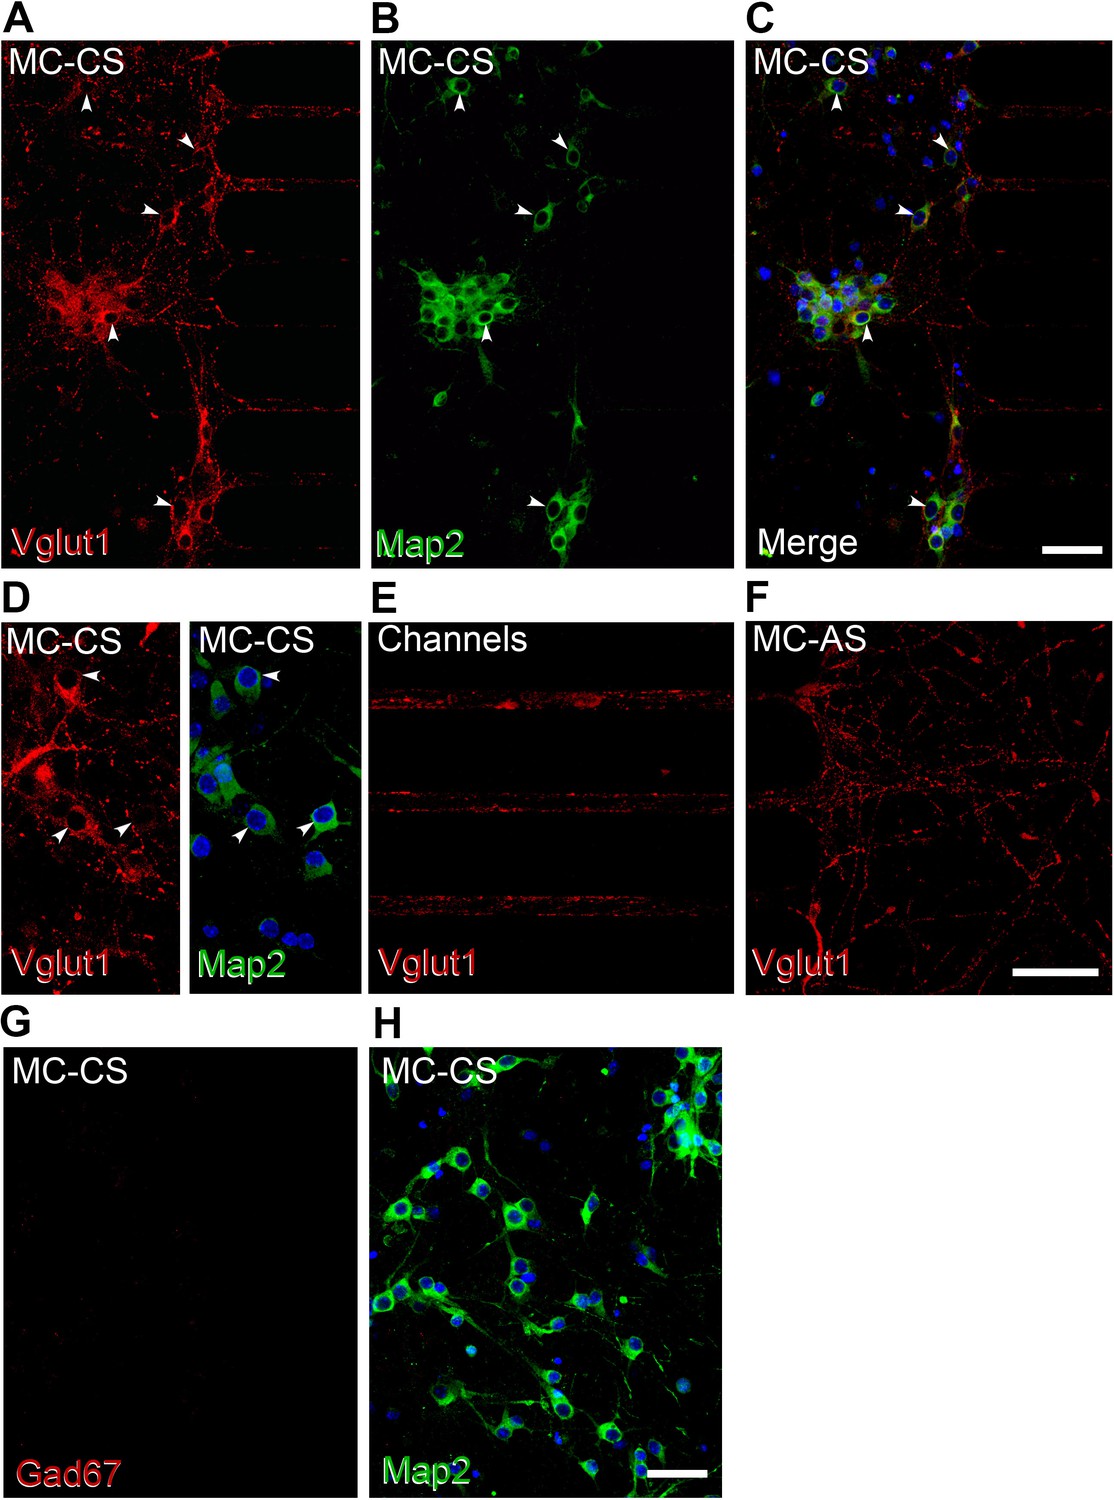
Neurons residing in the MC-CS are excitatory.
(A-H) Immunofluorescence of cortical neurons in the compartmentalized device using the indicated antibodies. (A–C), Vglut1 staining in red, Map2 in green; arrows point to Vglut1 and NeuN immunoreactive cells. (D–F). Higher magnification confocal images show Vglut expression in the MC-CS (D), in the axons crossing the channels (E), and in the MC-AS (F). G-H. No Gad67 immunoreactive cells were found in the MC-CS.
Figure 1—figure supplement 3
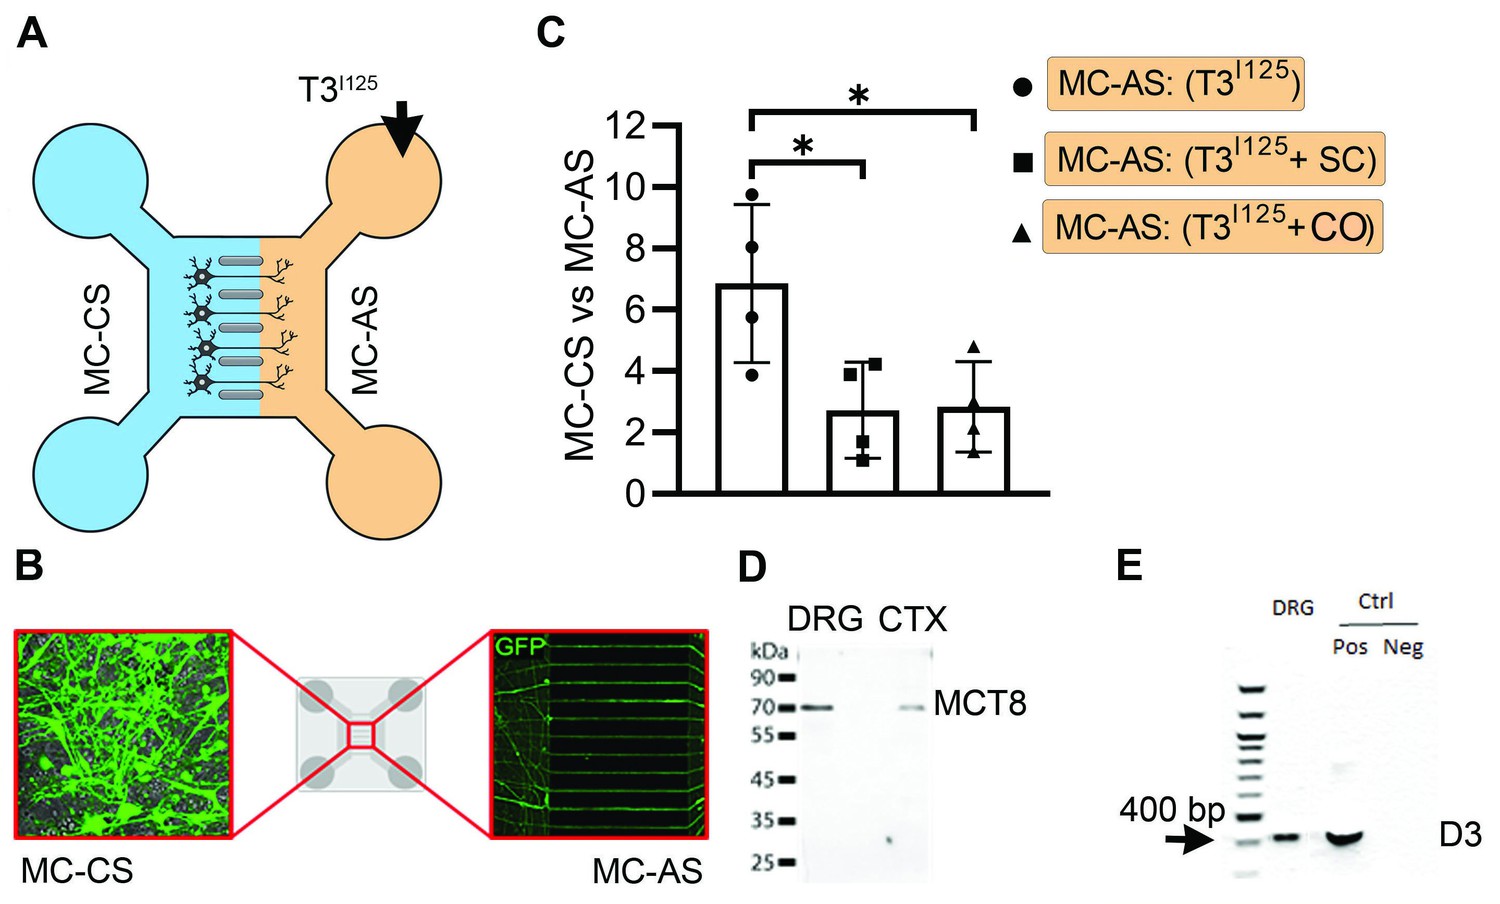
T3 trafficking in rat DRG cells in microfluid chambers.
(A) ~100.000 cpm freshly purified T3I125 was added into the MC-AS. (B) Rat DRG cells in microfluid chamber transfected with GFP. (C) Media in the MC-CS was counted on a gamma-meter at the indicated conditions. (D) Western blot on cultured rat DRG cells using an anti-MCT8. (D) Presence of D3 was confirmed by PCR. SC, Silychristin; CO, Colchicine. Values are mean ± SD of four independent experiments (multiplied by 10); *p<0.05 when compared T3 vs. T3 +SC and vs. T3 +CO.
-
Figure 1—figure supplement 3—source data 1
Original blots for panels D and E.
- https://cdn.elifesciences.org/articles/82683/elife-82683-fig1-figsupp3-data1-v2.zip
Figure 1—figure supplement 4
T3 is taken up and anterogradely transported through neuronal long distal axons.
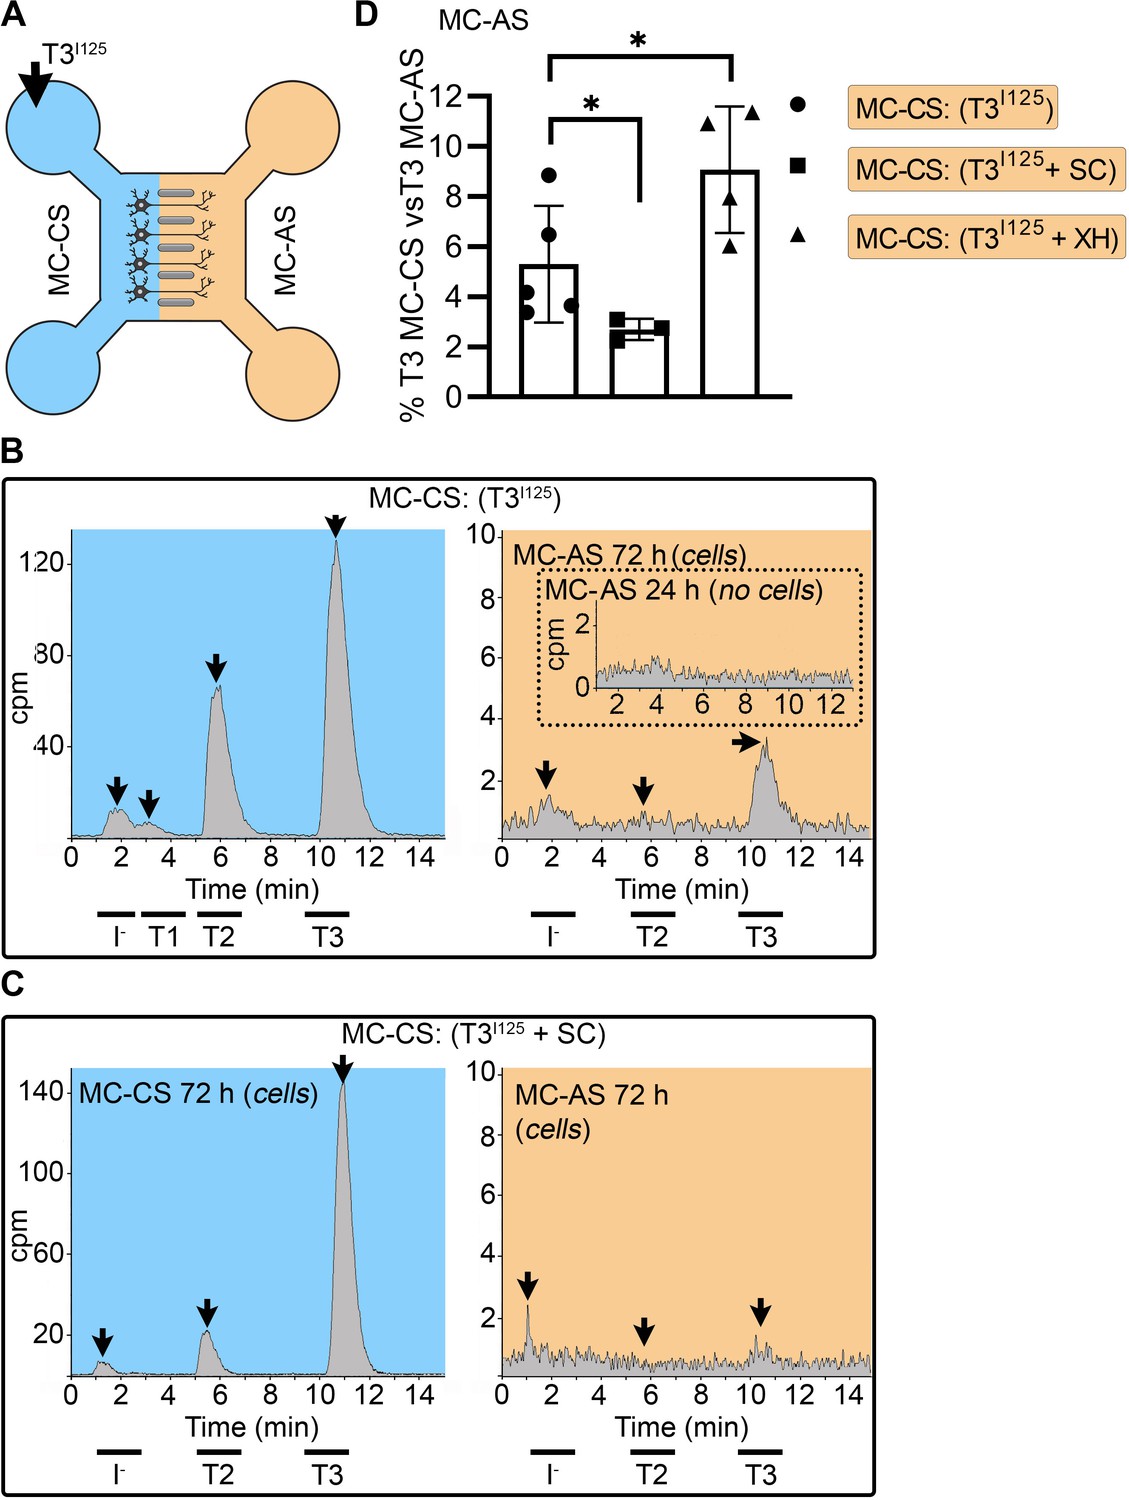
(A) T3I125 was applied in the MC-CS. (B). After 72 h, T3I125 was detected in the MC-AS (no T3I125 was detected after 24 hr; inset in the orange panel). (C). Effect of 2 µM SC on T3 uptake and transport. The size of the T3I125 peak in the MC-AS decreased after 72 hr compared to (B, D). Quantitation of T3I125 transported into the MC-AS under the indicated conditions. The Y-axis in % T3I125 in the MC-AS vs. T3I125 added to the MC-CS. Values are mean ± SD of three to five independent experiments; *p<0.05 in comparison with T3I125 incubation. Abbreviations: SC, Silychristin; XH, Xanthohumol.
Figure 2
T3 is in neuronal endosomes/NDL; retrograde transport depends on clathrin-mediated endocytosis and microtubules and initiates TH signaling.
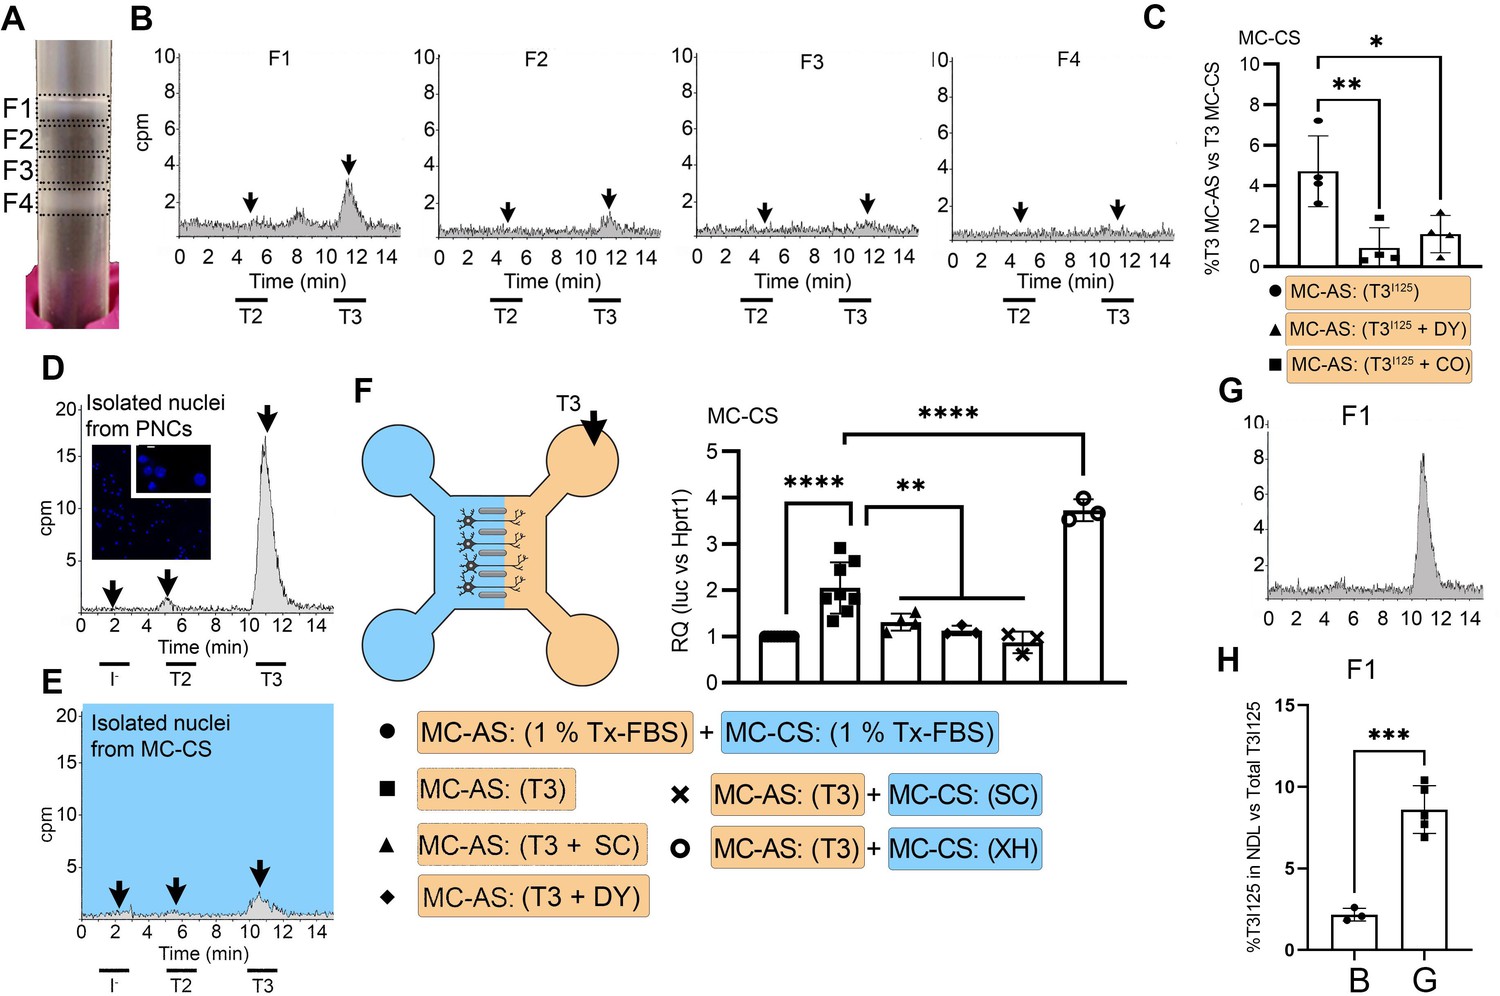
(A) Gradient column after ultracentrifugation, the resulting four fractions are indicated. (B) Chromatograms of the medium after the PNCs were incubated with T3I125 for 24 hr, and of the four fractions after ultracentrifugation. (C) Quantitation of T3I125 retrogradely transported into the MC-CS medium under the indicated conditions. The Y-axis in % T3I125 in the MC-CS vs. T3I125 added to the MC-AS. D.~9 x 10⁶ PNCs were loaded with T3I125 for 24 hr and processed for nuclei isolation, which were subsequently studied through UPLC, showing an accumulation of T3I125. (E). Same as in (D), except that the T3I125 was applied in the MC-CS and the nuclei isolated from ~200.000 neurons from the MC-AS (pool of 10 microchambers). (F) At 8- to 10-day-old cultures were incubated for 48 hr with a medium containing 1% charcoal-stripped serum (Tx-medium; the B27 supplement is removed). Subsequently, 10 nM T3 was applied in the MC-AS for 24 hr. Bar graph shows the quantitation of the Luc mRNA levels of the cells in the MC-CS under the indicated conditions. (G). Same as in (B), except that endosomes/NDL were isolated in the presence of 2 µM SC. (H) Quantitation of the T3I125 from the chromatograms found in fraction 1 in (B and G). The Y-axis in % T3I125 in the F1 vs. T3I125 was added to the medium. Values are mean ± SD of 3–8 independent experiments; *p<0.05, in comparison with 10 nM T3 incubation, **p<0.01, ***p<0.001 in comparison with 1 % Tx FBS incubation. SC, Silychristin; XH, Xanthohumol; Dy, Dynasore; CO, Colchicine.
Figure 3 with 1 supplement
T3 is not metabolized by axonal D3.
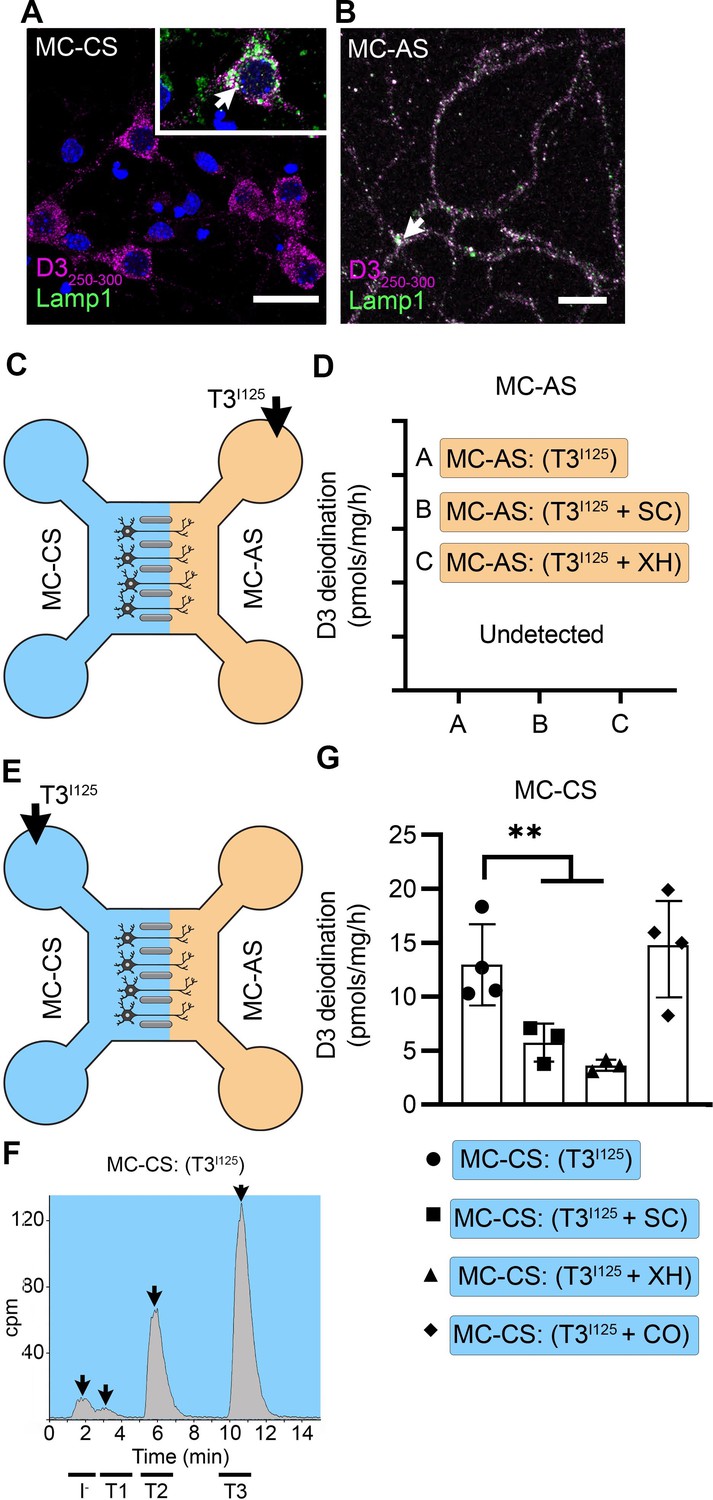
(A) In the MC-CS D3 staining in magenta and Lamp1 staining in green; colocalization is indicated as white and shown in the inset (arrow). Scale bar = 25 µm. (B). In the MC-AS, D3 staining in magenta and Lamp1 staining in green; colocalization is indicated as white (arrow). Scale bar = 25 µm. (C,D). No D3-mediated T2I125 production was detected in the MC-AS. However, a high D3-mediated T2I125 production was detected in the MC-CS (E–G), which was reduced by exposure to 2 µM SC or 6 µM XH but not by exposure to 80 µM DY. Values are mean ± SD of three to four independent experiments; **p<0.01 in comparison with T3I125 incubation.
Figure 3—figure supplement 1
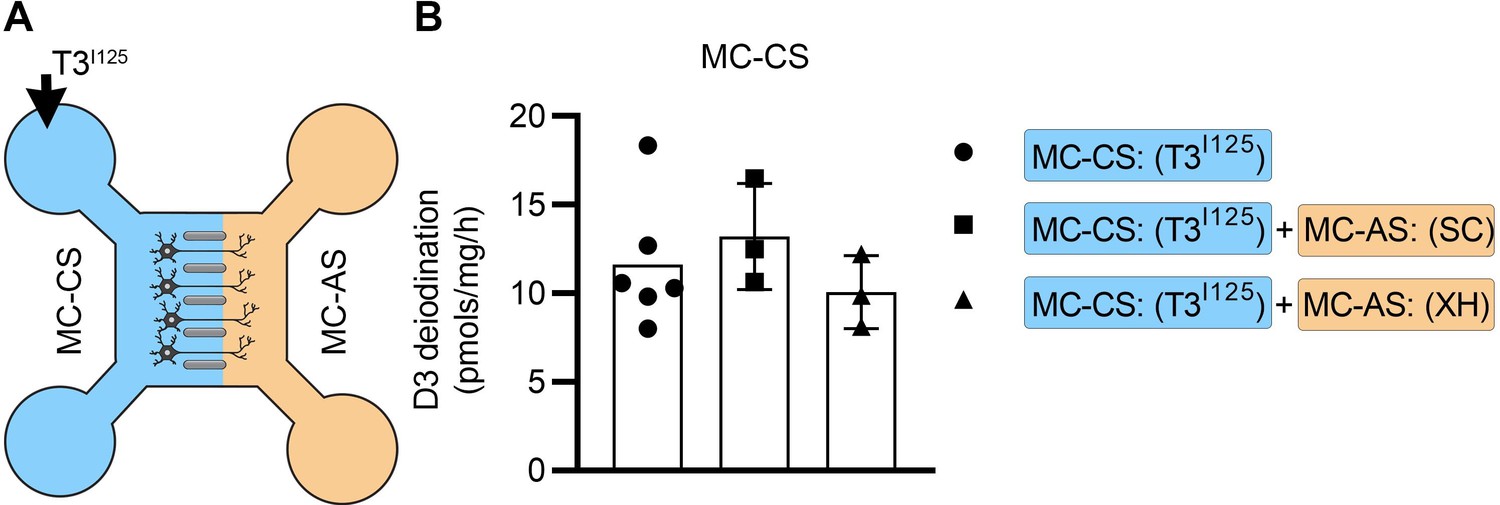
Adding SC or XH in the MC-AS did not affect the MC-CS.
(A) T3I125 was applied in the MC-CS. (B). D3-mediated T2I125 production in the indicated conditions. Values are mean ± SD of three to six independent experiments; **p<0.01 compared to T3I125 incubation.
Figure 4 with 2 supplements
Axonal T3 transport can initiate TH signaling between two interconnected brain areas.
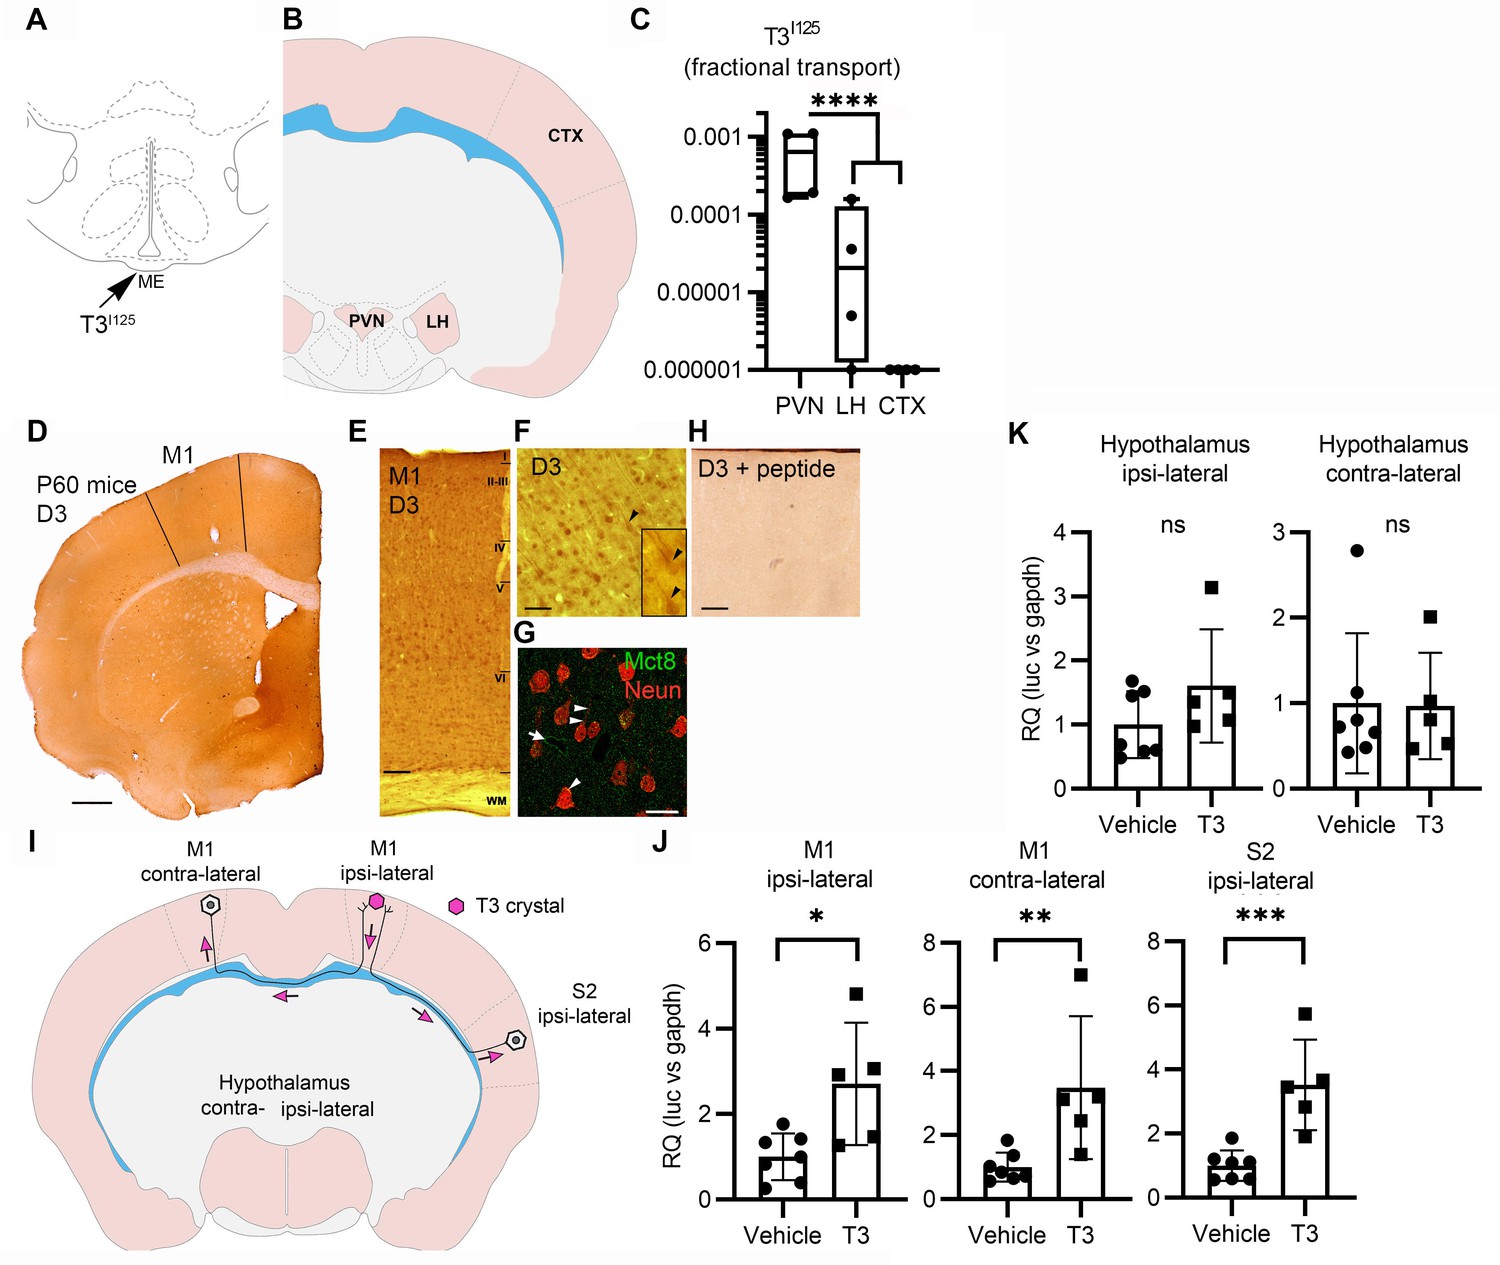
(A) Cartoon showing the injection site of T3I125 in the median eminence (Bregma – 2.56 mm). Scale bar = 1 mm. (B) The areas dissected after 30 min of injection are indicated (Bregma –1.80). (C) Quantitation of the transported T3I125 from the rat median eminence to the indicated areas (D) D3 immunostaining in the adult mouse M1 cortex. (E) Dio3 immunoreactive neurons were found in all layers of the M1 cortex. Scale bar = 150 µm. (F) Detail of layer V, where pyramidal neurons and their apical dendrites were stained (arrowheads). Scale bar = 25 µm. The bar in 4F represents 25 µm in the inset in 4F. (G) Immunofluorescence of M1 neurons in the P60 mice cortex using the indicated antibodies. Mct8 is evenly distributed in the M1, including in apical dendrites of neurons (arrowhead), and showed higher intensity in the wall of the capillaries (arrow). Scale bar = 10 µm. (H) Incubating the α-D3250-300 with its blocking peptide resulted in no staining. Scale bar = 25 µm. The bar in 4F represents 25 µm in the inset in 4F. (I) A T3 crystal (pink hexagon) was inserted into the M1 of the right hemisphere, which receives axons from neurons located in the indicated areas. The pink arrows indicated the direction of the transported T3. (J) Quantitation of Luc mRNA levels at the indicated brain areas. (K) Hypothalamic expression of Luc mRNA. Values are mean ± SD of four to seven independent experiments; *p<0.05, **p<0.01, ***p<0.001; ns: non-significant.
Figure 4—figure supplement 1
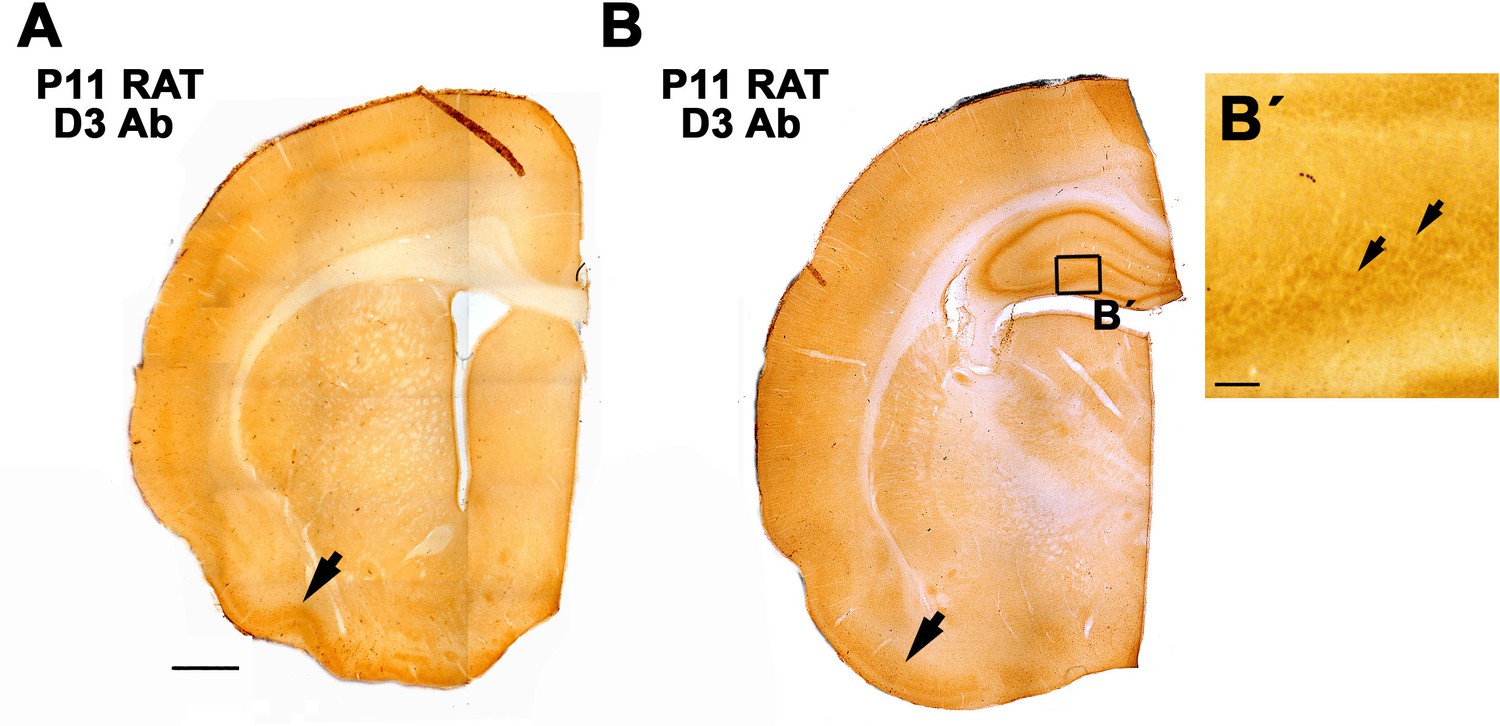
Staining with α-D3250-300 resulted in a similar spatial expression of D3 (in the P11 rat cortex) as previously reported for its mRNA with in situ hybridization (Escámez et al., 1999).
In an anterior level (A), the piriform cortex shows a higher staining intensity (arrow). In a posterior level (B), the piriform cortex (arrow) and the hippocampus showed a higher staining intensity. B’. detail of D3 stained neurons in the dentate gyrus. Scale bar in A 1mm. In B' = 25 µm.
Figure 4—figure supplement 2
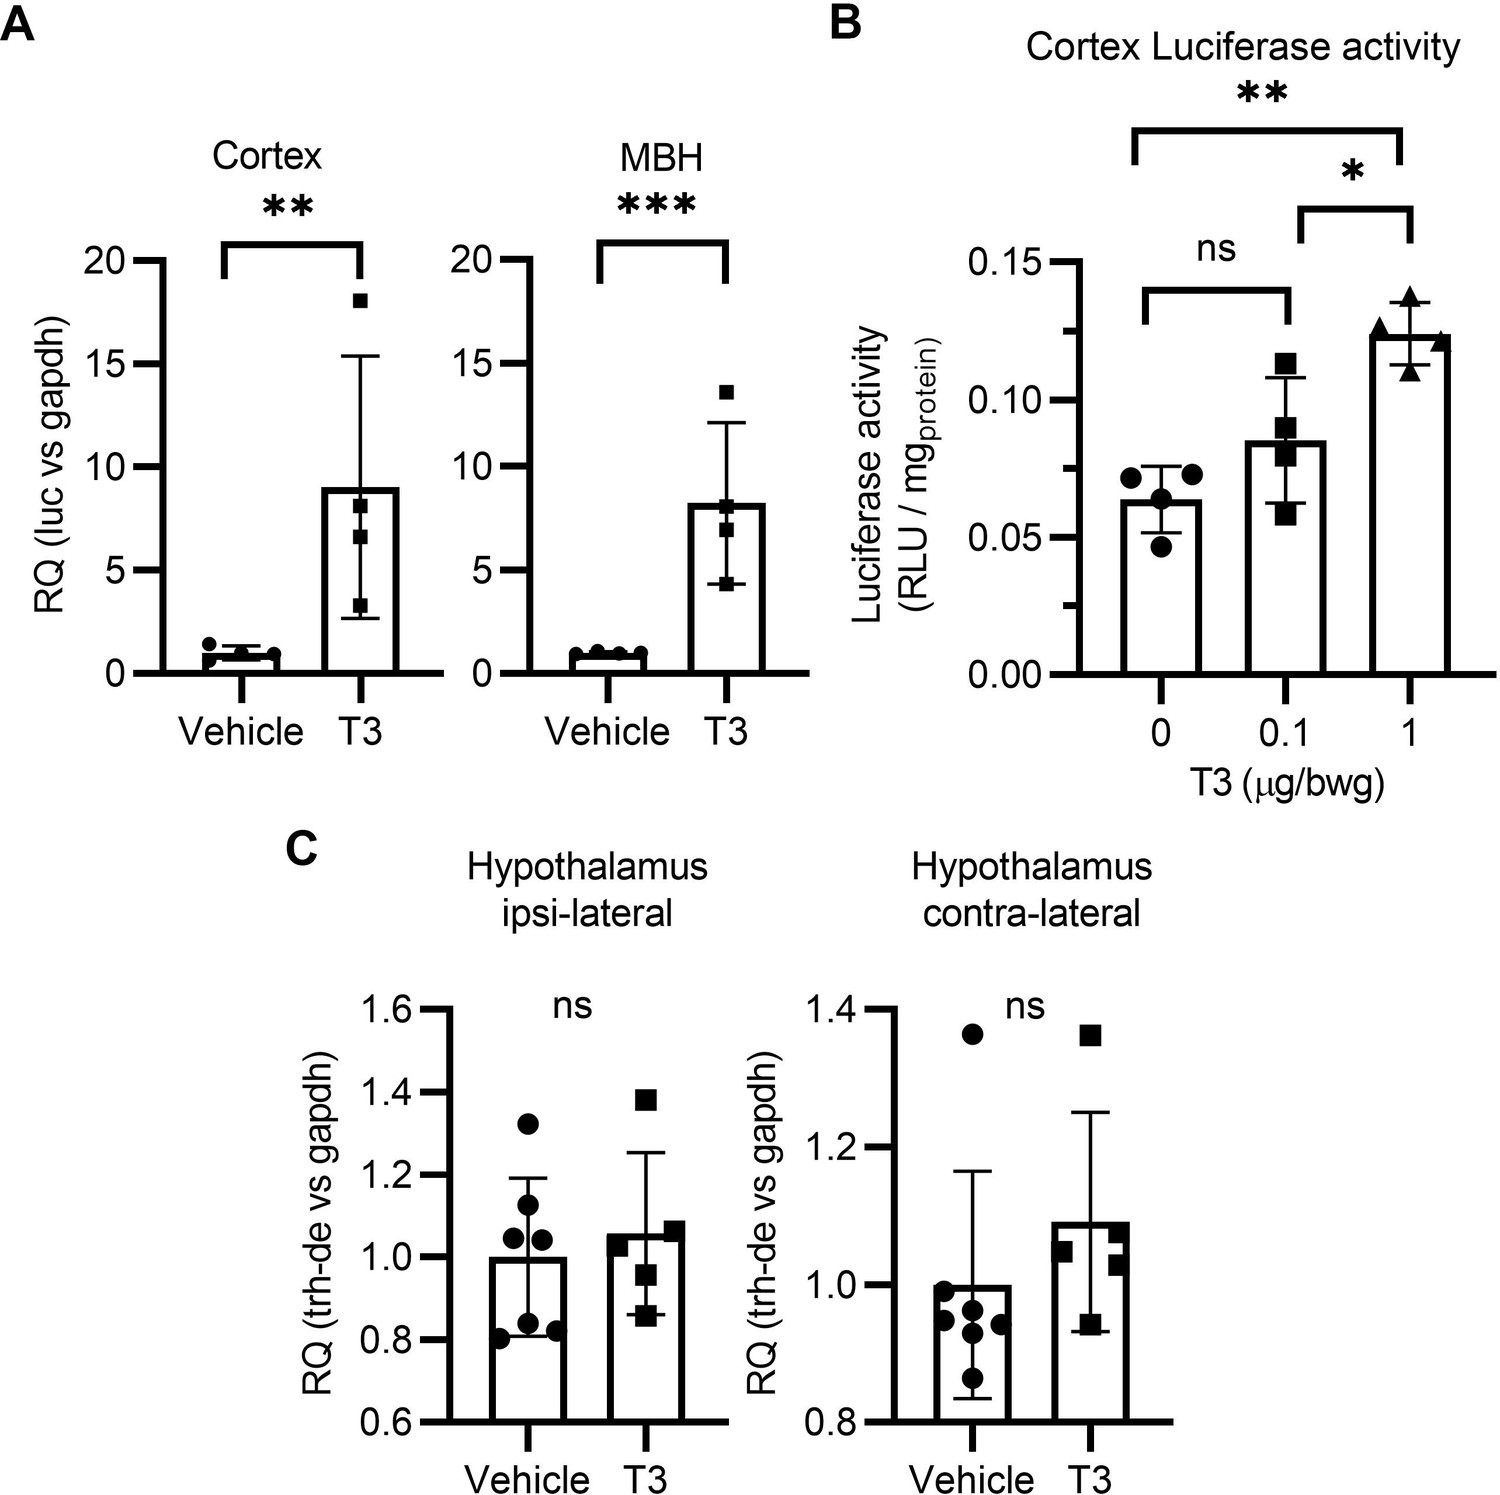
T3 triggers TH signaling in the brain of the THAI mice (A).
Luciferase mRNA levels in the mediobasal hypothalamus (MBH) and cortex (B) Quantitation of the Luciferase activity in the cerebral cortex of the THAI mice at the indicated conditions. (C) Hypothalamic expression of Trh-de studied after inserting a T3 crystal in the M1 of the right hemisphere. Values are mean ± SD of four to seven independent experiments.
Additional files
Download links
A two-part list of links to download the article, or parts of the article, in various formats.
Downloads (link to download the article as PDF)
Open citations (links to open the citations from this article in various online reference manager services)
Cite this article (links to download the citations from this article in formats compatible with various reference manager tools)
Axonal T3 uptake and transport can trigger thyroid hormone signaling in the brain
eLife 12:e82683.
https://doi.org/10.7554/eLife.82683


