Testing the ion-current model for flagellar length sensing and IFT regulation
- Department of Biochemistry and Biophysics, University of California, San Francisco, United States
- Kenyon College, Gambier, and Summer Research Training Program at University of California San Francisco, United States
- Max Planck Institute of Molecular Cell Biology and Genetics, Germany
- Department of Physiology, University of California, San Francisco, United States
Figures
Figure 1
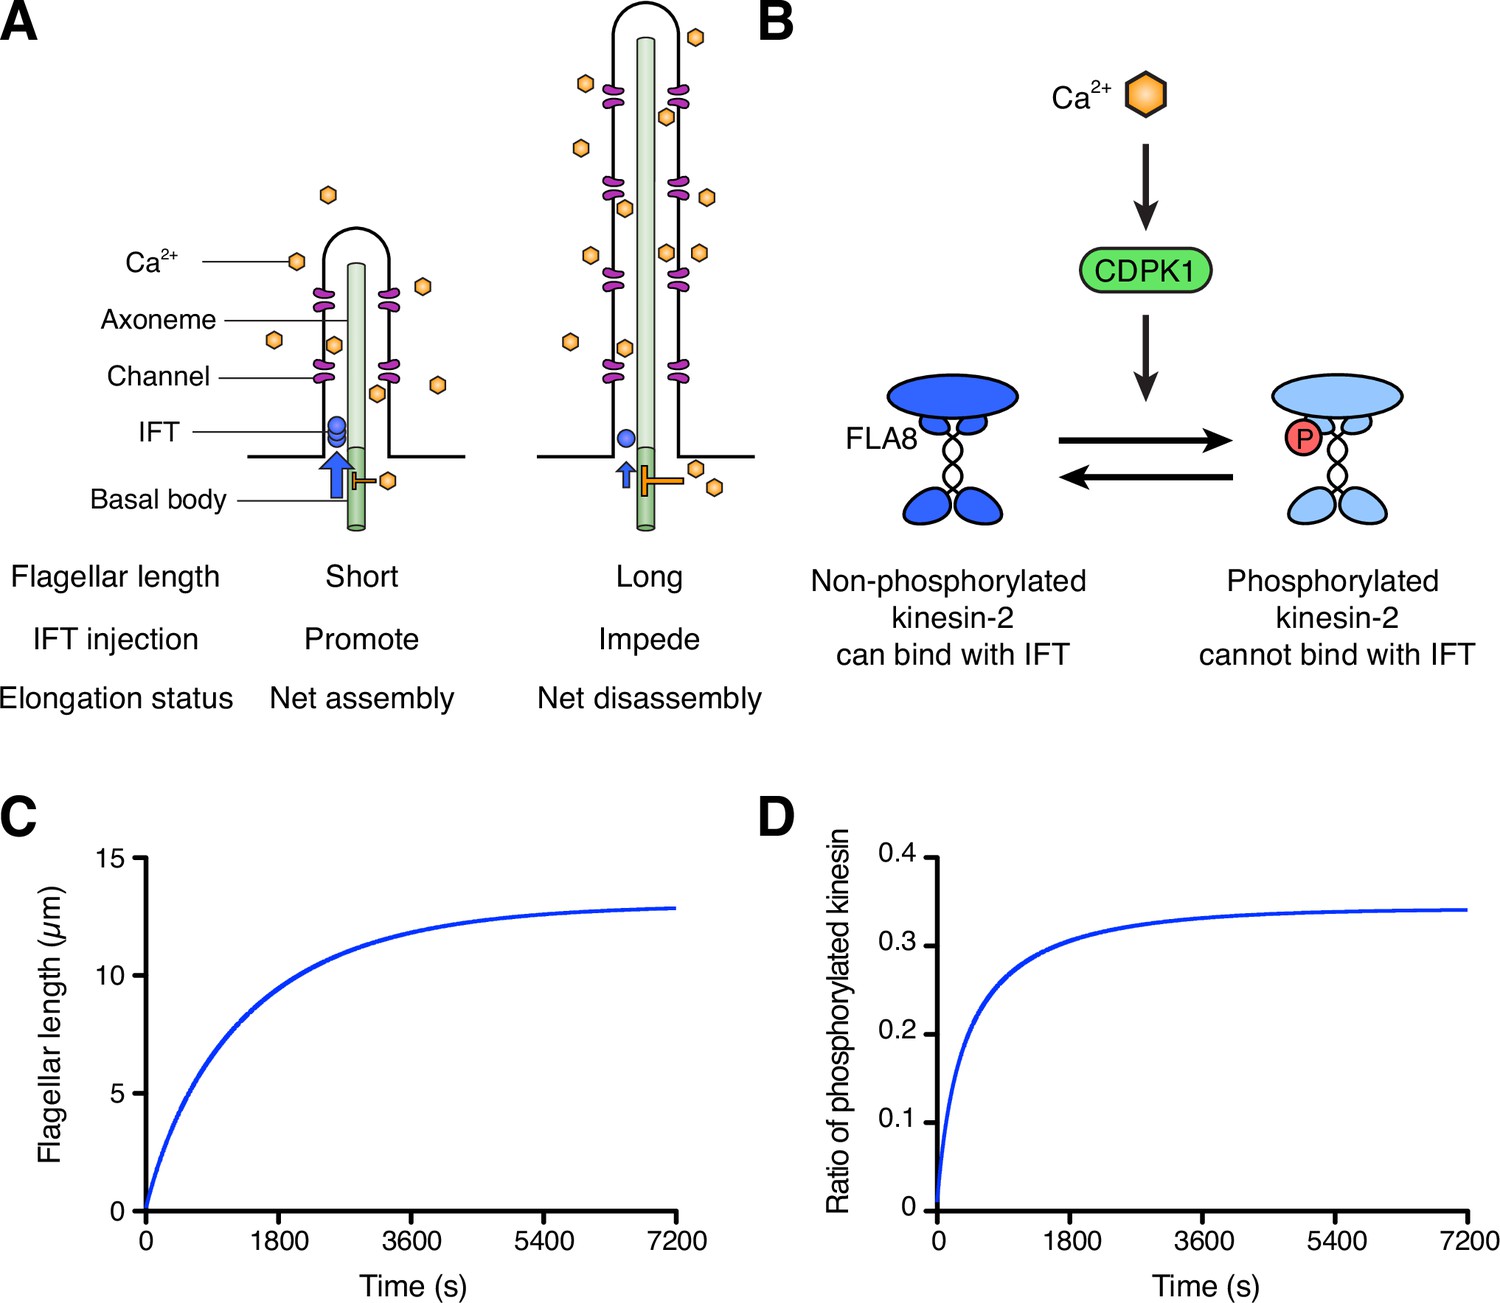
Schematic diagram and modeling of the ion-current model.
(A) The ion-current model assumes the ion channels are uniformly distributed along the length of the flagellum, and Ca2+ ions entering the flagellum are proportional to the flagellar length. Flagellar Ca2+ is assumed to negatively regulate IFT injection into flagella to control the flagellar length. The longer flagellum can intake more ions, and these ions inhibit IFT injection such that the further assembly of flagella is suppressed. (B) The schema of kinesin-2 inactivation by Ca2+ and CDPK1 based on Liang et al., 2014. In a Ca2+-dependent manner, CDPK1 phosphorylates FLA8, a subunit of heterotrimeric kinesin-2. Phosphorylated kinesin-2 loses its IFT protein binding activity. (C, D) Simulated result of the ion-current model based on kinesin-2 phosphorylation by CDPK1 (Liang et al., 2014), as detailed in Materials and methods. Flagellar length (C) and the ratio of phosphorylated kinesin (D) were plotted against time.
Figure 2
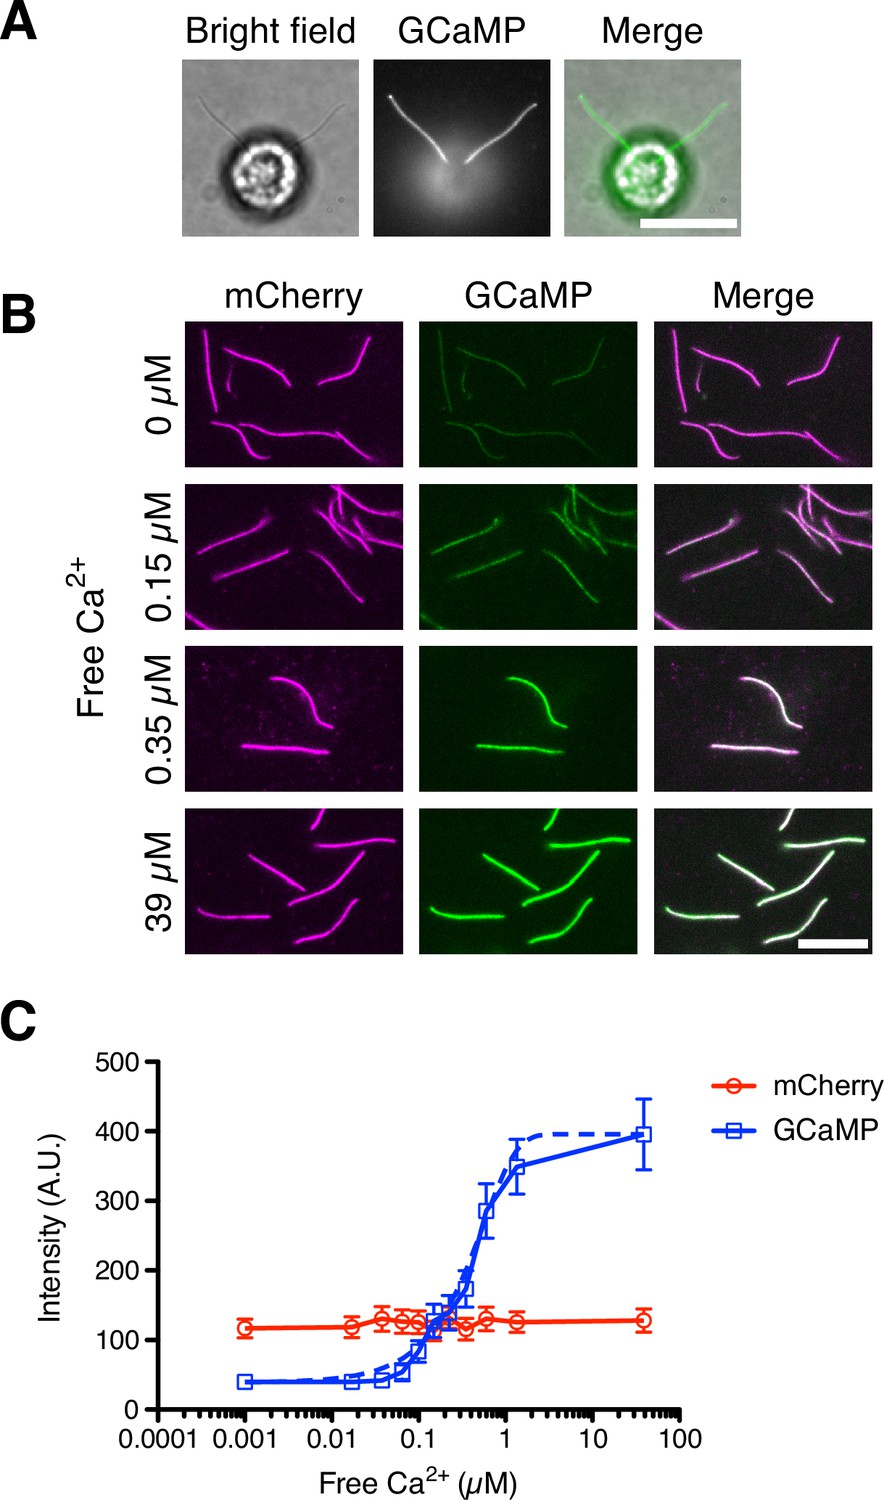
DRC4-GCaMP quantitatively detects free Ca2+.
(A) Bright-field and fluorescent images of DRC4-GCaMP cells. DRC4-GCaMP localizes to the entire length of flagella. Scale bar: 10 µm. (B) Fluorescent images of isolated DRC4-mCherry-GCaMP axonemes. Axonemes were isolated from DRC4-mCherry-GCaMP cells and were treated with various concentration of free Ca2+. GCaMP intensity increased as free Ca2+ concentration increased. Scale bar: 10 µm. (C) Semilogarithmic plot of GCaMP and mCherry intensities. GCaMP and mCherry intensities were measured and plotted with mean ± SD. Thirteen axonemes were analyzed for each Ca2+ concentration. The blue dashed line shows the equation of a sigmoidal curve which is calculated from the data.
-
Figure 2—source data 1
Raw data of DRC4-mCherry-GCaMP intensity.
- https://cdn.elifesciences.org/articles/82901/elife-82901-fig2-data1-v2.xlsx
Figure 3 with 2 supplements
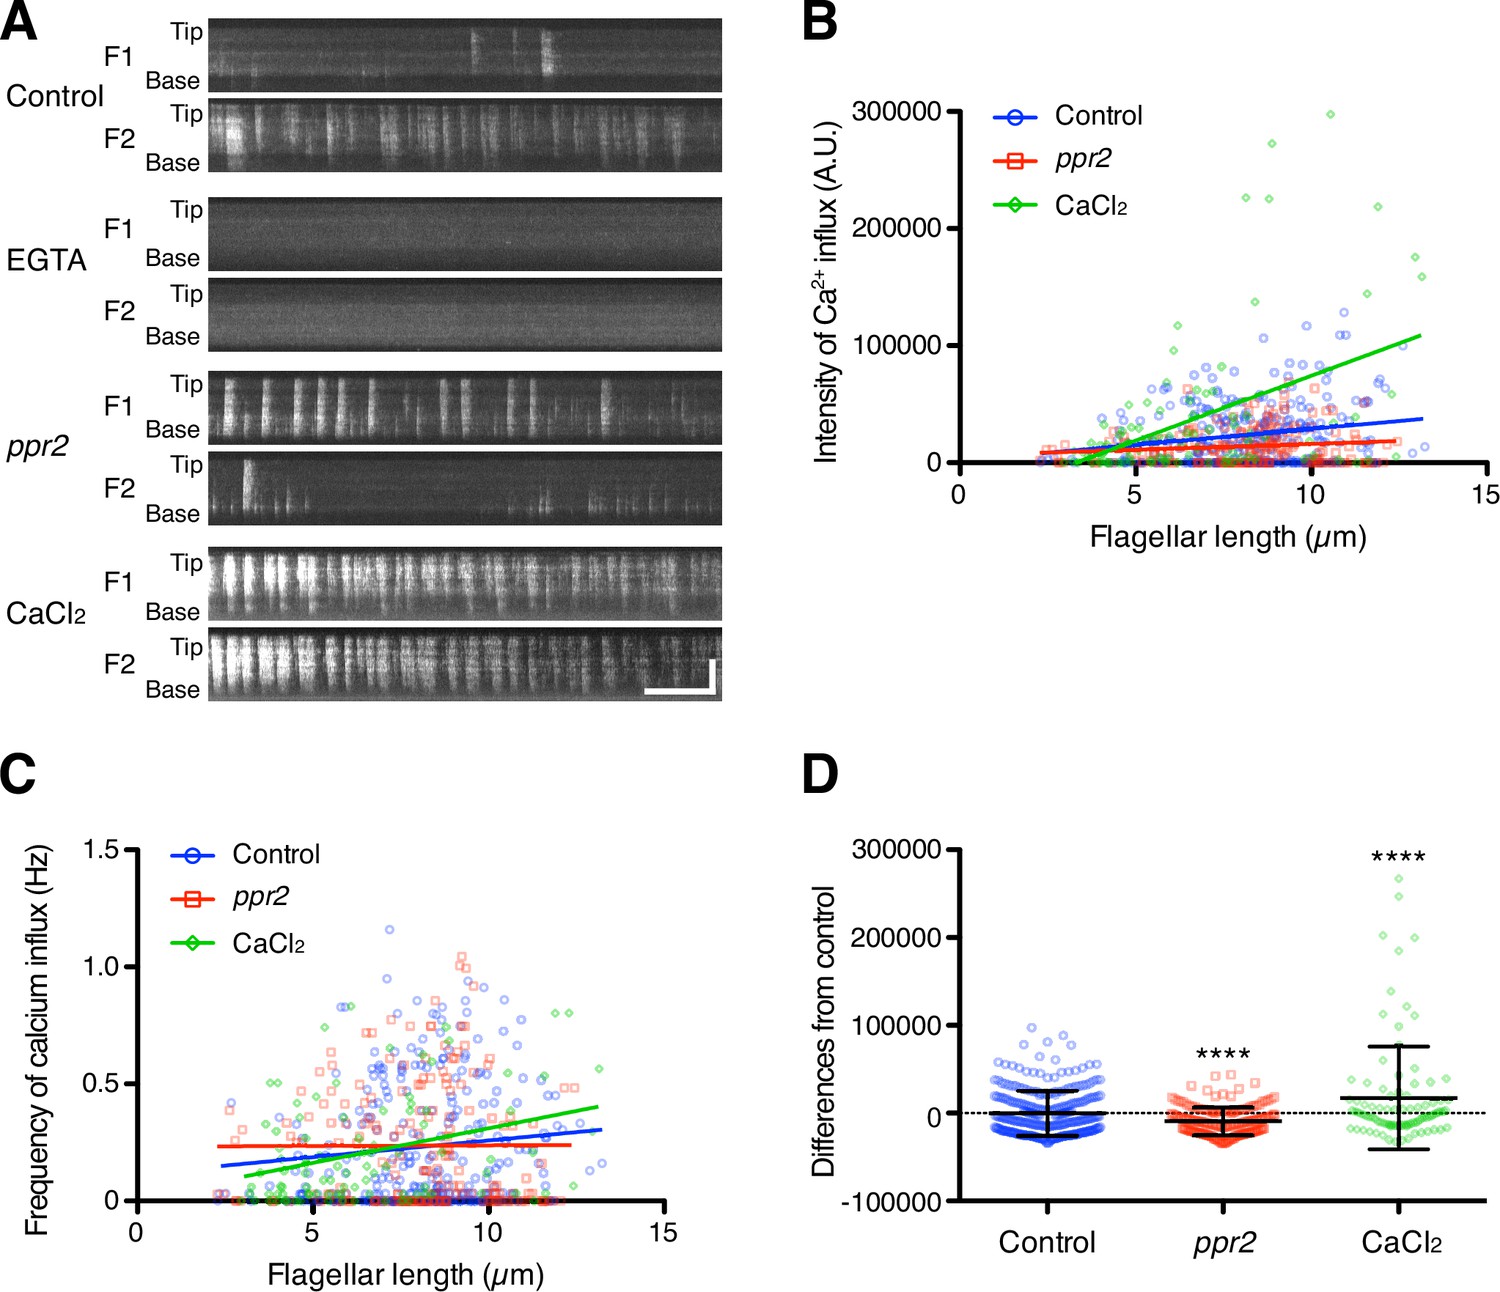
Quantification of Ca2 +influx as a function of flagellar length.
(A) Representative DRC4-GCaMP kymographs of Chlamydomonas flagella in control (pf2 DRC4-GCaMP), 1 mM EGTA-treated (pf2 DRC4-GCaMP), ppr2 mutant (pf2 ppr2 DRC4-GCaMP), and 1 mM CaCl2-treated (pf2 DRC4-GCaMP) cells. These kymographs were assembled from Videos 1–4. Horizontal bar: 5 s; vertical bar: 5 µm. (B) The intensity of Ca2+ influx into flagella was calculated from kymographs and plotted against flagellar length. Different lengths of flagella were obtained by imaging flagella during regeneration. Control (blue circles, n=272, Pearson correlation coefficient ρ=0.21, and coefficient of determination r2=0.04), the ppr2 mutant (red squares, n=182, ρ=0.14, and r2=0.02), and 1 mM CaCl2-treated cells (green diamonds, n=96, ρ=0.46, and r2=0.21). (C) The frequency of Ca2+ influx was plotted against flagellar length. No obvious correlation was detected in either the control (blue circles, ρ=0.11, and r2=0.01) or the ppr2 mutant (red squares, ρ=0.004, and r2=1.85 × 10⁻⁵). However, the frequency of Ca2+ influx in 1 mM CaCl2 treated cells was correlated with flagellar length (green diamonds, ρ=0.33, and r2=0.11). (D) The mean differences of Ca2+ influx intensity from the control regression line. Data were plotted as scatter dot plots with mean ± SD. Statistical significance was determined by an unpaired two-tailed t test against the control (**** p<0.0001).
-
Figure 3—source data 1
Raw data of flagellar length and DRC4-GCaMP intensity.
- https://cdn.elifesciences.org/articles/82901/elife-82901-fig3-data1-v2.xlsx
Figure 3—figure supplement 1
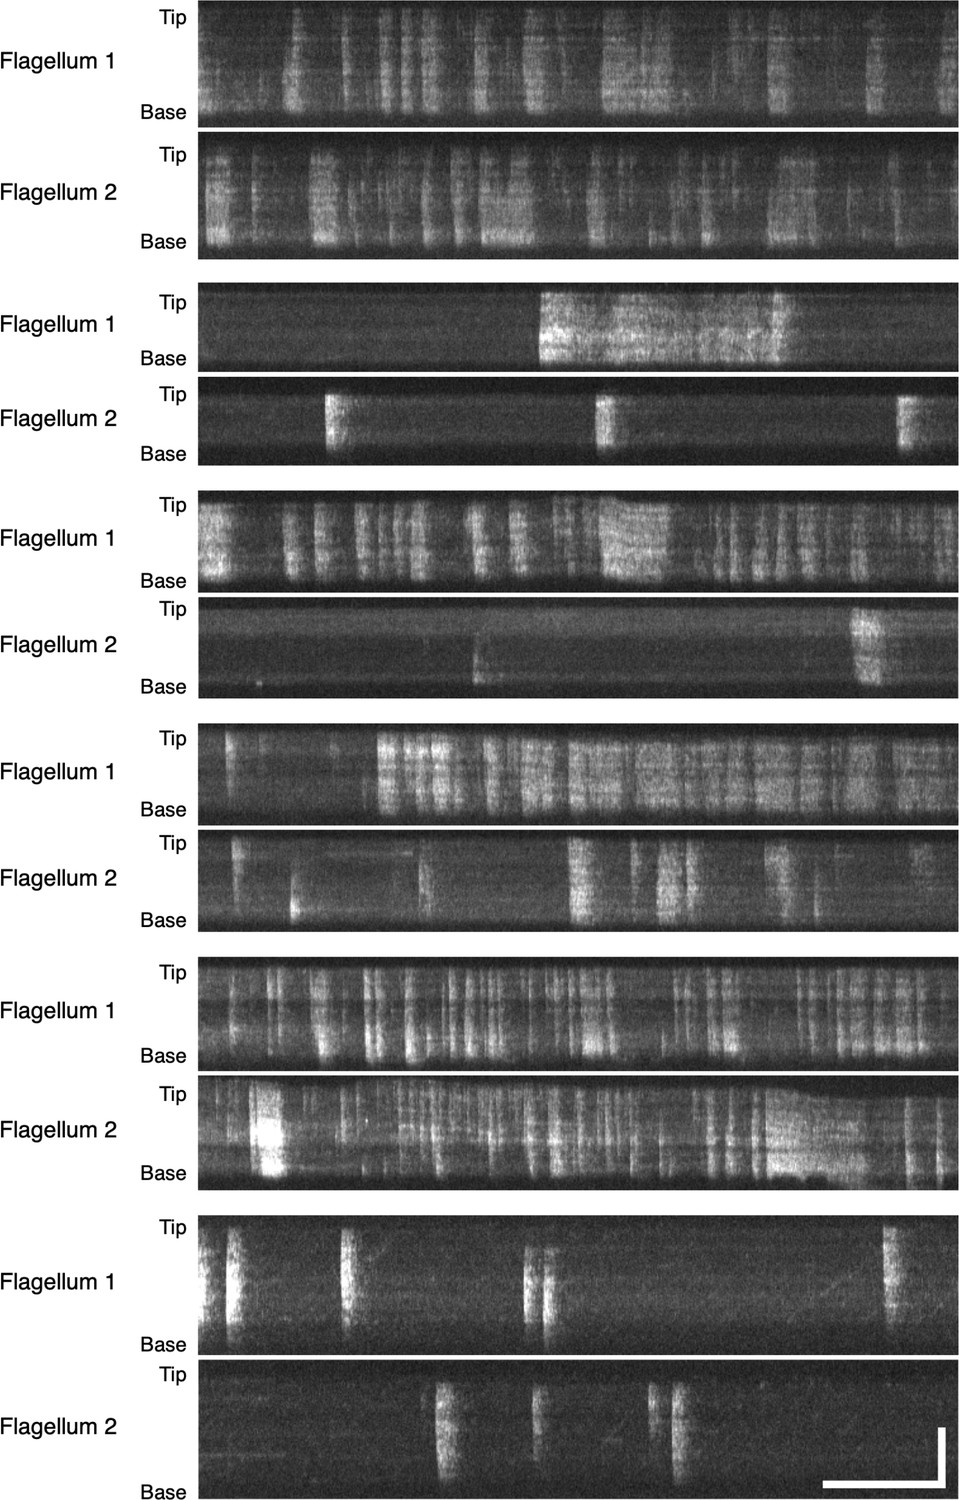
Example DRC4-GCaMP kymographs of Chlamydomonas flagella (control, pf2 DRC4-GCaMP).
The pair of Flagellum 1 and Flagellum 2 are flagella from the same cells. The pattern of Ca2+ influx events varied from flagellum to flagellum and from time to time. Horizontal bar: 5 s; vertical bar: 5 µm.
Figure 3—figure supplement 2
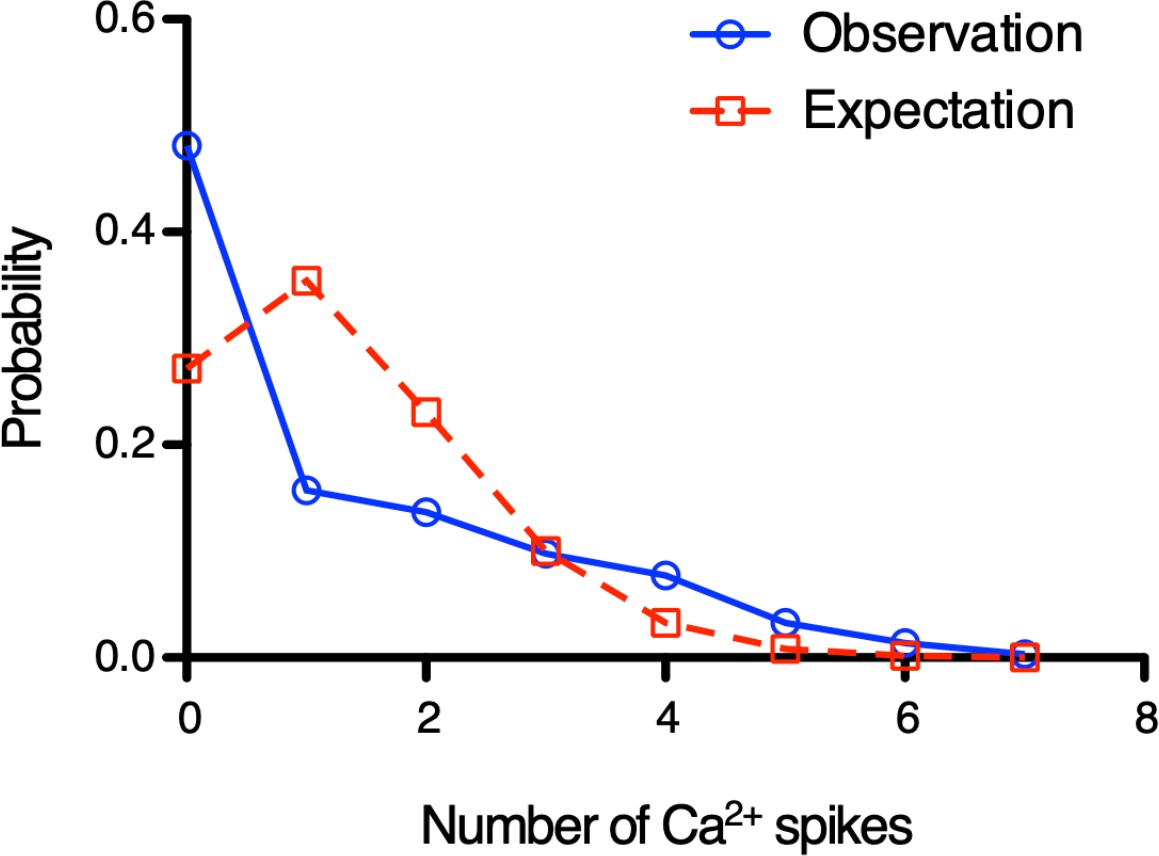
Individual Ca2+ influx events are not independent.
Histogram shows Ca2+ spikes distribution every 5 s. Blue line shows the DRC4-GCaMP (control) data from Figure 3. Red dashed line shows calculated data to fit with Poisson distribution. Blue line does not fit with red line (Chi-square goodness-of-fit test, p<0.0001). Similar results were obtained at other time intervals.
Figure 4
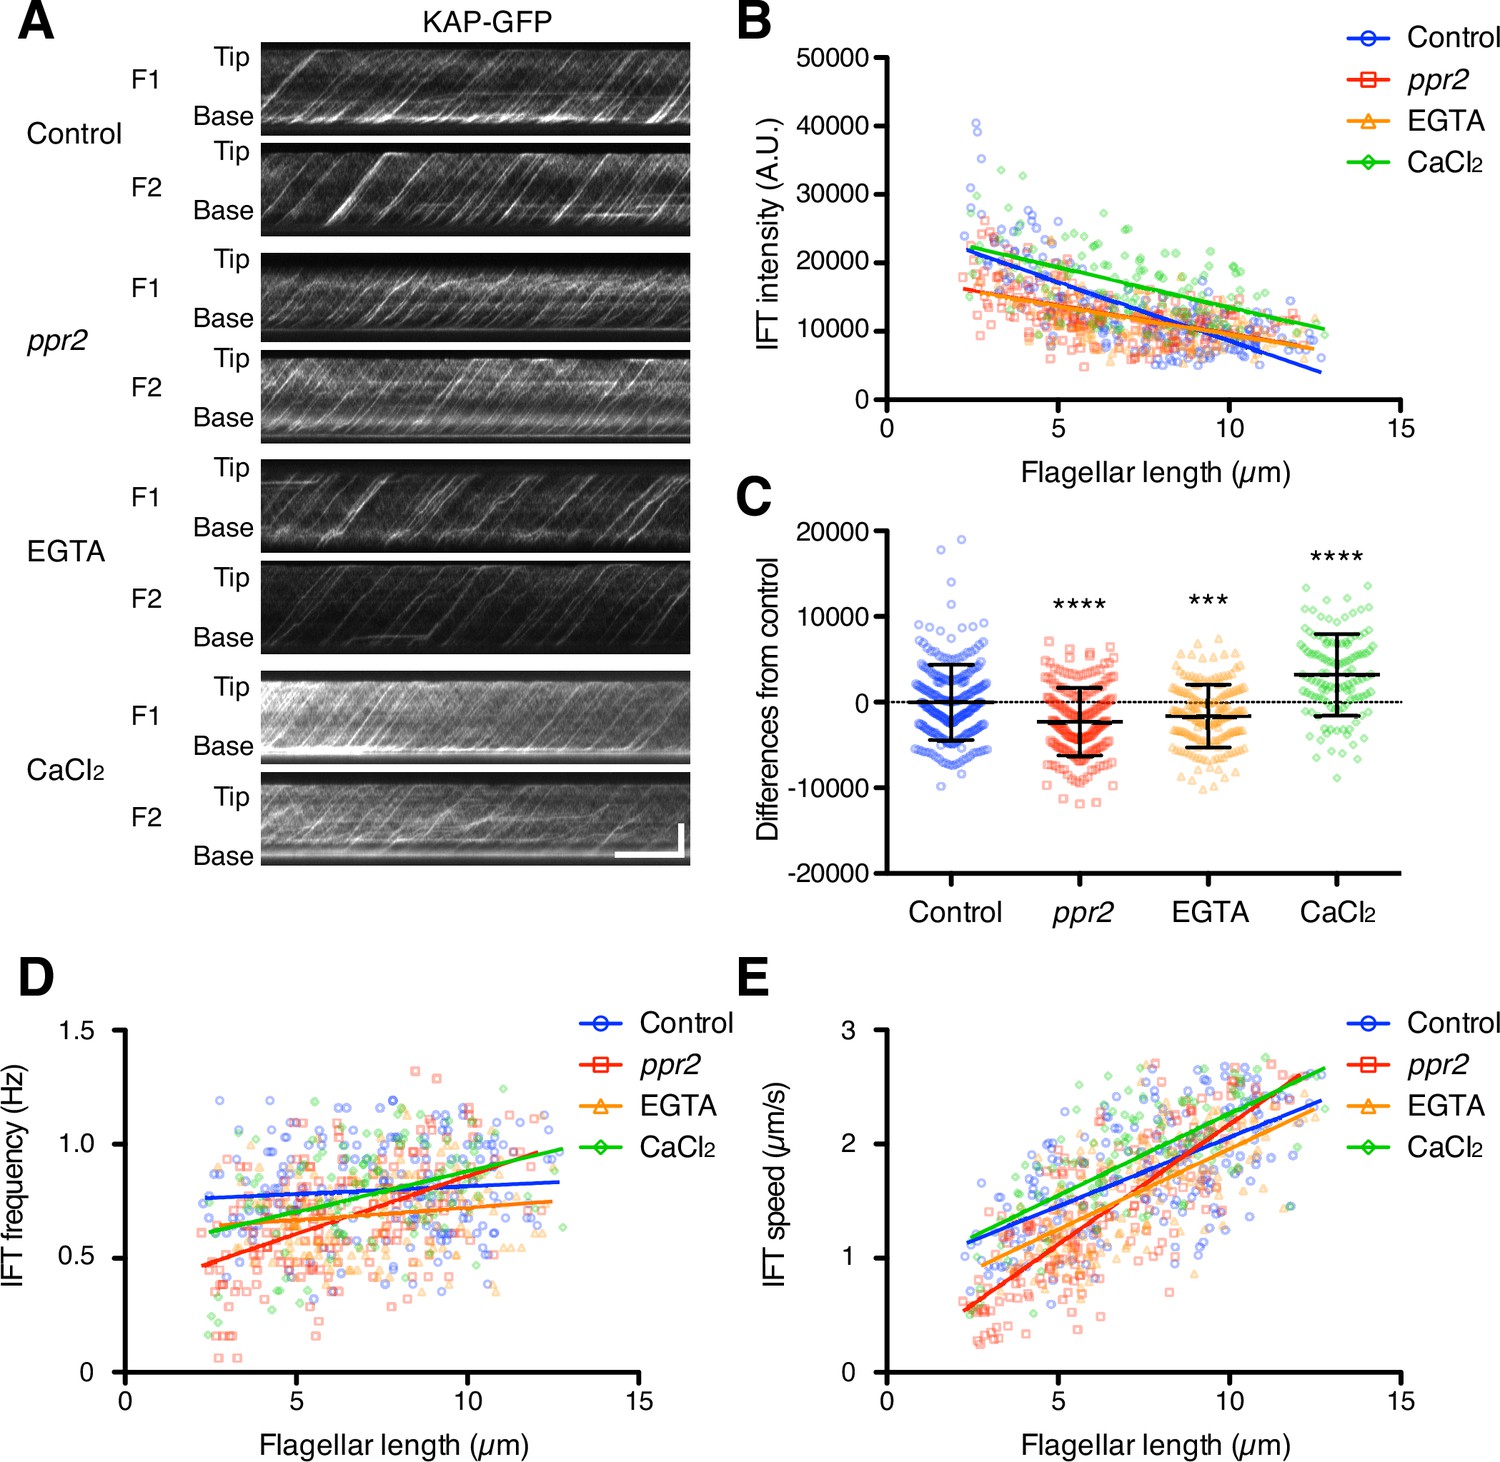
Quantification of IFT injection as a function of flagellar length.
(A) Representative KAP-GFP kymographs of Chlamydomonas flagella in control (fla3 KAP-GFP), ppr2 mutant (fla3 ppr2 KAP-GFP), 1 mM EGTA-treated (fla3 KAP-GFP), and 1 mM CaCl2-treated (fla3 KAP-GFP) cells. These kymographs were assembled from Videos 5–8. Horizontal bar: 5 s; vertical bar: 5 µm. (B) The mean KAP-GFP intensity of each flagellum was calculated from kymographs and plotted against flagellar length. Control (blue circles, n=220, ρ=–0.72, and r2=0.51), ppr2 (red squares, n=192, ρ=–0.52, and r2=0.27), EGTA (orange triangles, n=162, ρ=–0.53, and r2=0.28), and CaCl2 (green diamonds, n=116, ρ=–0.52, and r2=0.27). (C) The mean difference of IFT intensity from the control regression line. Data were plotted as scatter dot plot with mean ± SD. Statistical significance was determined by an unpaired two-tailed t test against the control (*** p<0.001; **** p<0.0001). (D) The frequency of KAP-GFP was plotted against flagellar length. Control (blue circles, ρ=0.17, and r2=0.03), ppr2 (red squares, ρ=0.51, and r2=0.26), EGTA (orange triangles, ρ=0.14, and r2=0.02), and CaCl2 (green diamonds, ρ=0.38, and r2=0.15). (E) The velocity of KAP-GFP was plotted against flagellar length. Control (blue circles, ρ=0.64, and r2=0.41), ppr2 (red squares, ρ=0.81, and r2=0.64), EGTA (orange triangles, ρ=0.69, and r2=0.47), and CaCl2 (green diamonds, ρ=0.69, and r2=0.48).
-
Figure 4—source data 1
Raw data of flagellar length and KAP-GFP intensity.
- https://cdn.elifesciences.org/articles/82901/elife-82901-fig4-data1-v2.xlsx
Figure 5 with 1 supplement
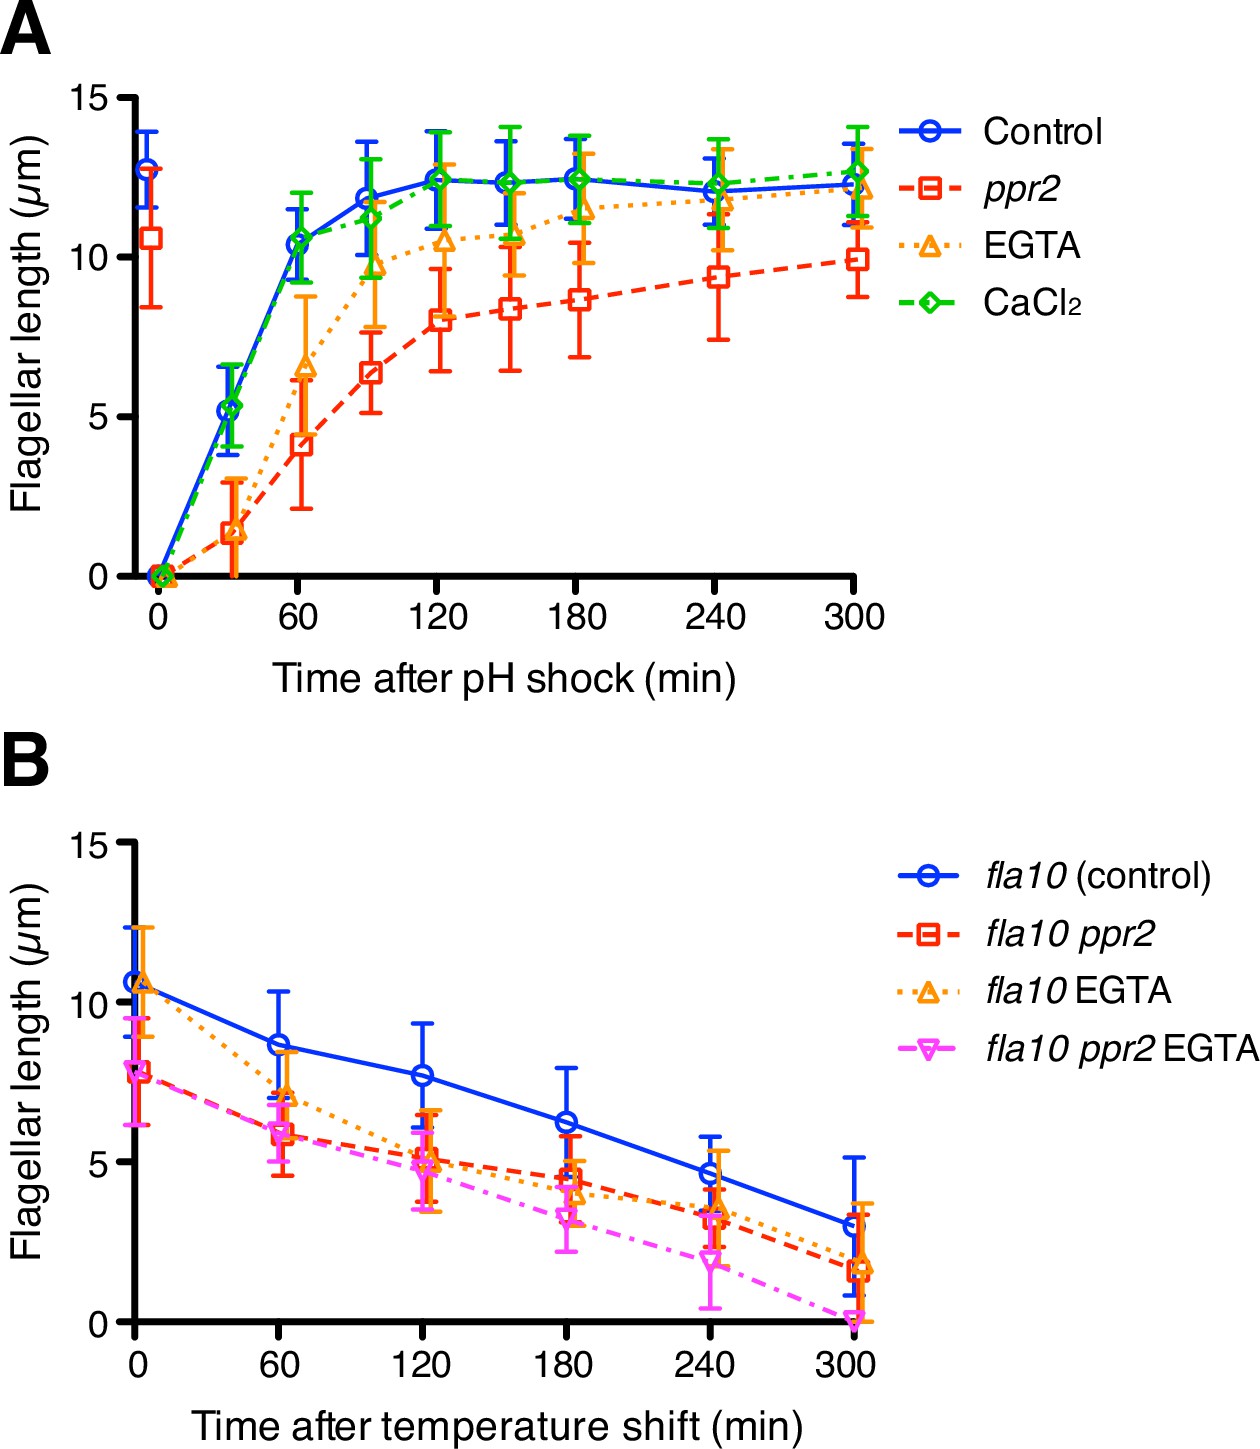
The kinetics of flagellar regeneration and disassembly.
(A) Flagella were removed by the pH shock method. Mean flagellar length of control (wild-type CC-125, blue circles), ppr2 mutant (red squares), 1 mM EGTA-treated (orange triangles), and 1 mM CaCl2-treated (green diamonds) cells was plotted against time after pH shock. (B) The fla10 mutant strains were transferred to the restrictive temperature (33 °C). Mean flagellar length of control (fla10, blue circles), fla10 ppr2 mutant (red squares), 1 mM EGTA-treated fla10 (orange triangles), and 1 mM EGTA-treated fla10 ppr2 (magenta inverted triangles) cells was plotted against time after temperature shift. Twenty biflagellated cells were measured per strain and time point. Data were plotted with mean ± SD.
-
Figure 5—source data 1
Raw data of flagellar length during flagellar regeneration and disassembly assays.
- https://cdn.elifesciences.org/articles/82901/elife-82901-fig5-data1-v2.xlsx
Figure 5—figure supplement 1
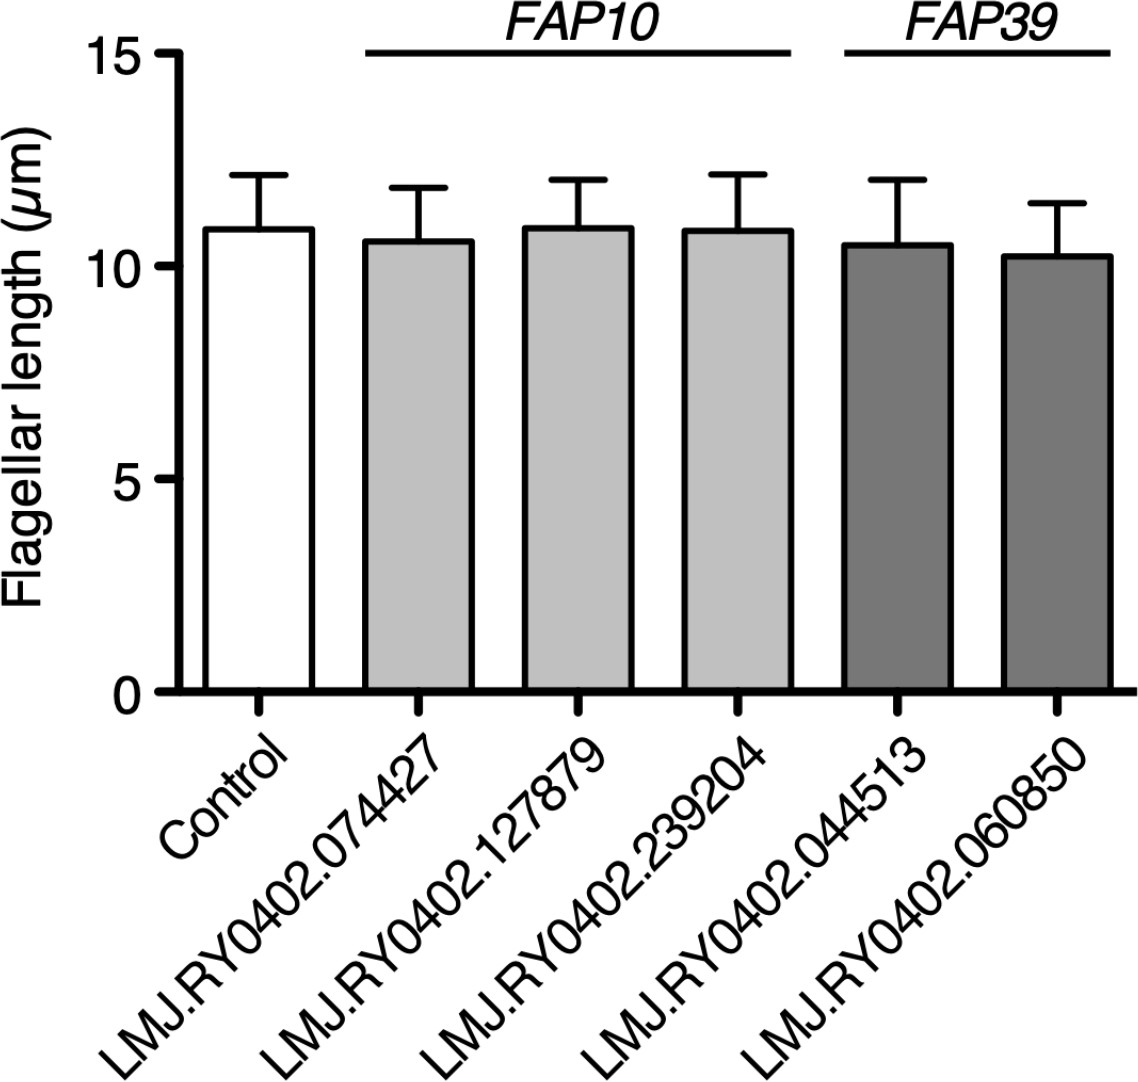
Flagellar length of potential flagellar calcium pump mutant cells.
Potential mutant strains of FAP10 and FAP39 were obtained from the CLiP library. The control cell is the background strain of the library, CMJ030 (CC-4533 cw15 mt-). These mutations were identified from the CLiP library database and not independently verified. Twenty-five biflagellated cells were measured per strain. Data were plotted with mean ± SD. All mutant strains showed no significant differences in flagellar length from the control. Statistical significance was determined by an unpaired two-tailed t test against the control.
Figure 6
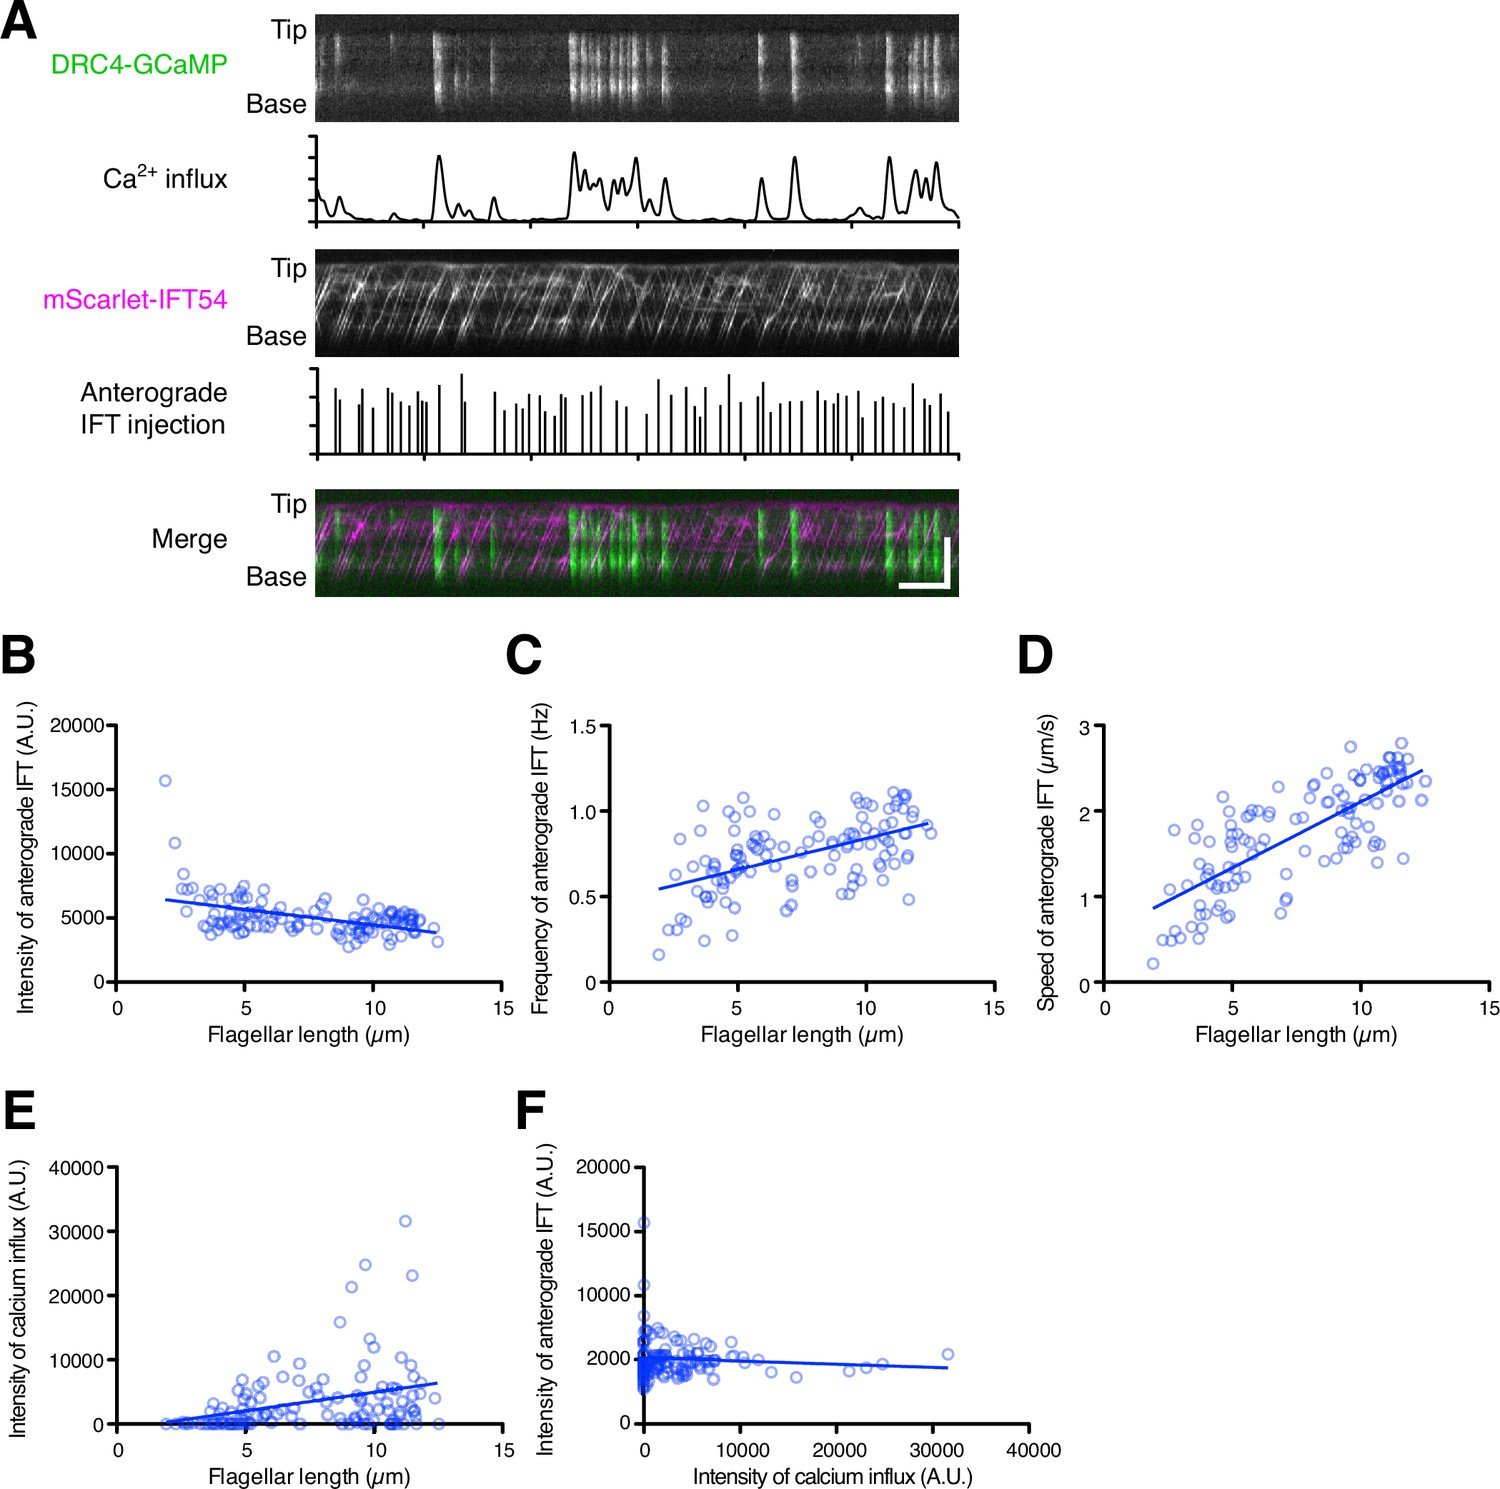
Dual-channel imaging of DRC4-GCaMP and mScarlet-IFT54.
(A) Representative kymographs and quantified data. The DRC4-GCaMP kymograph (top) was generated from Video 9. Quantified intensity of Ca2+ influx is shown at the bottom of the kymograph. The mScarlet-IFT54 kymograph (middle) was generated from Video 9. Quantified anterograde IFT injection is shown at the bottom of the kymograph. The merged kymograph (bottom) of DRC4-GCaMP (green) and mScarlet-IFT54 (magenta). Horizontal bar: 5 s; vertical bar: 5 µm. (B) The mScarlet-IFT54 intensity of each flagellum was calculated from kymographs and plotted against flagellar length (n=116, and Pearson correlation coefficient ρ=–0.47). Non-linear regression is indicated by a solid line (r2=0.21). (C) The frequency of anterograde IFT was plotted against flagellar length (ρ=0.53 and r2=0.28). (D) The velocity of anterograde IFT was plotted against flagellar length (ρ=0.76 and r2=0.58). (E) The intensity of Ca2+ influx into flagella was calculated from kymographs and plotted against flagellar length (ρ=0.33 and r2=0.11). (F) The mean mScarlet-IFT54 intensity was plotted against the intensity of Ca2+ influx (ρ=–0.08 and r2=0.007).
-
Figure 6—source data 1
Raw data of flagellar length and intensities of DRC4-GCaMP and mScarlet-IFT54.
- https://cdn.elifesciences.org/articles/82901/elife-82901-fig6-data1-v2.xlsx
Figure 7 with 1 supplement
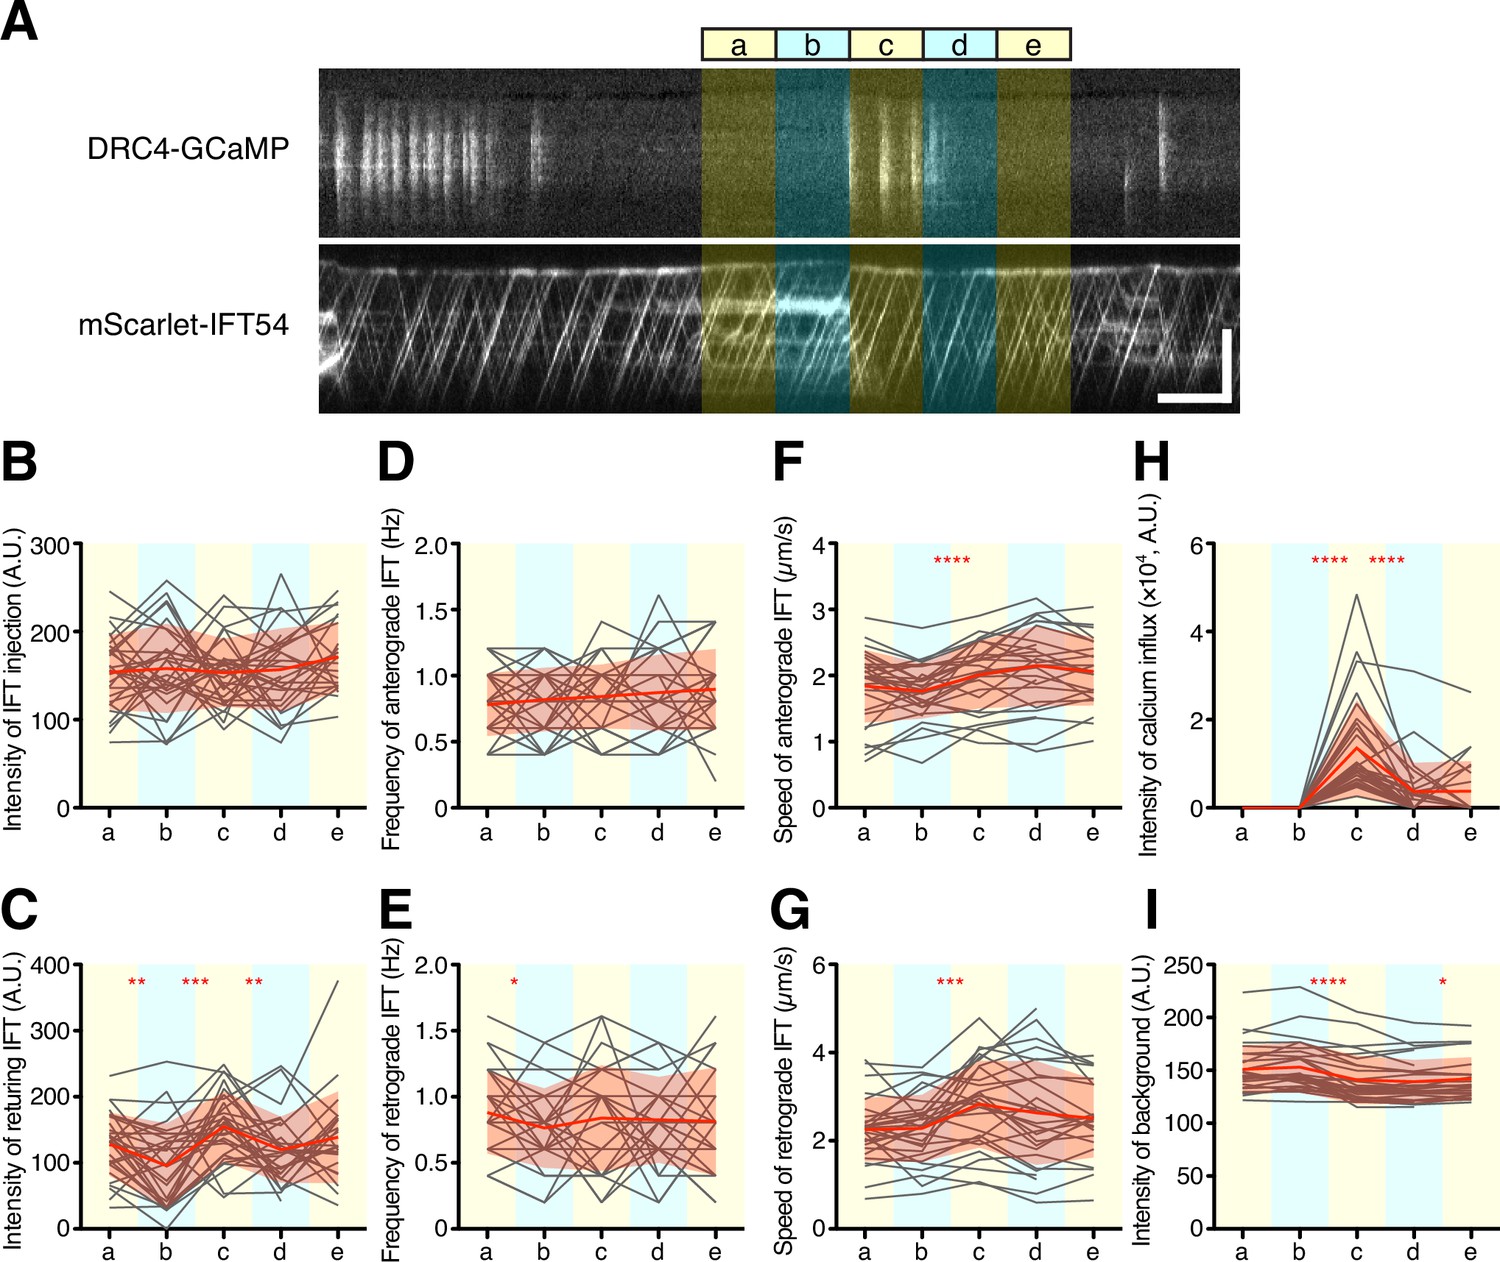
Quantification of IFT behavior after Ca2+ influx.
(A) Overview of the short-time analysis of IFT behavior after a burst of Ca2+ influx using dual-channel imaging. Analyzed areas were colored on the representative kymographs of DRC4-GCaMP and mScarlet-IFT54. Intervals of each area are 5 s. Bursts of Ca2+ influx were selected where no previous Ca2+ influx was observed for more than 10 s before the Ca2+ influx. The ‘c’ area was set at the start of the burst of Ca2+ influx. The areas ‘a’ and ‘b’ were set to 10 s and 5 s before the burst of Ca2+ influx at the ‘c’ area. The areas ‘d’ and ‘e’ were set to 5 s and 10 s after the start of the Ca2+ influx, respectively. Horizontal bar: 5 s; vertical bar: 5 µm. (B–G) IFT behaviors before and after the burst of Ca2+ influx were plotted against each area (n=29). Gray lines show each analysis, and red lines and area show the mean and SD, respectively. (B) The intensity of IFT injection. (C) The intensity of returning IFT. (D) The frequency of anterograde IFT. (E) The frequency of retrograde IFT. (F) The speed of anterograde IFT. (G) The speed of anterograde IFT. (H) The sum of the Ca2+ influx before and after the burst of Ca2+ influx. (I) The background intensity of mScarlet-IFT54. Statistical significance between neighboring areas was determined by a paired two-tailed t test (* p<0.05; ** p<0.01; *** p<0.001; **** p<0.0001).
-
Figure 7—source data 1
Raw data of IFT behavior analysis.
- https://cdn.elifesciences.org/articles/82901/elife-82901-fig7-data1-v2.xlsx
Figure 7—figure supplement 1
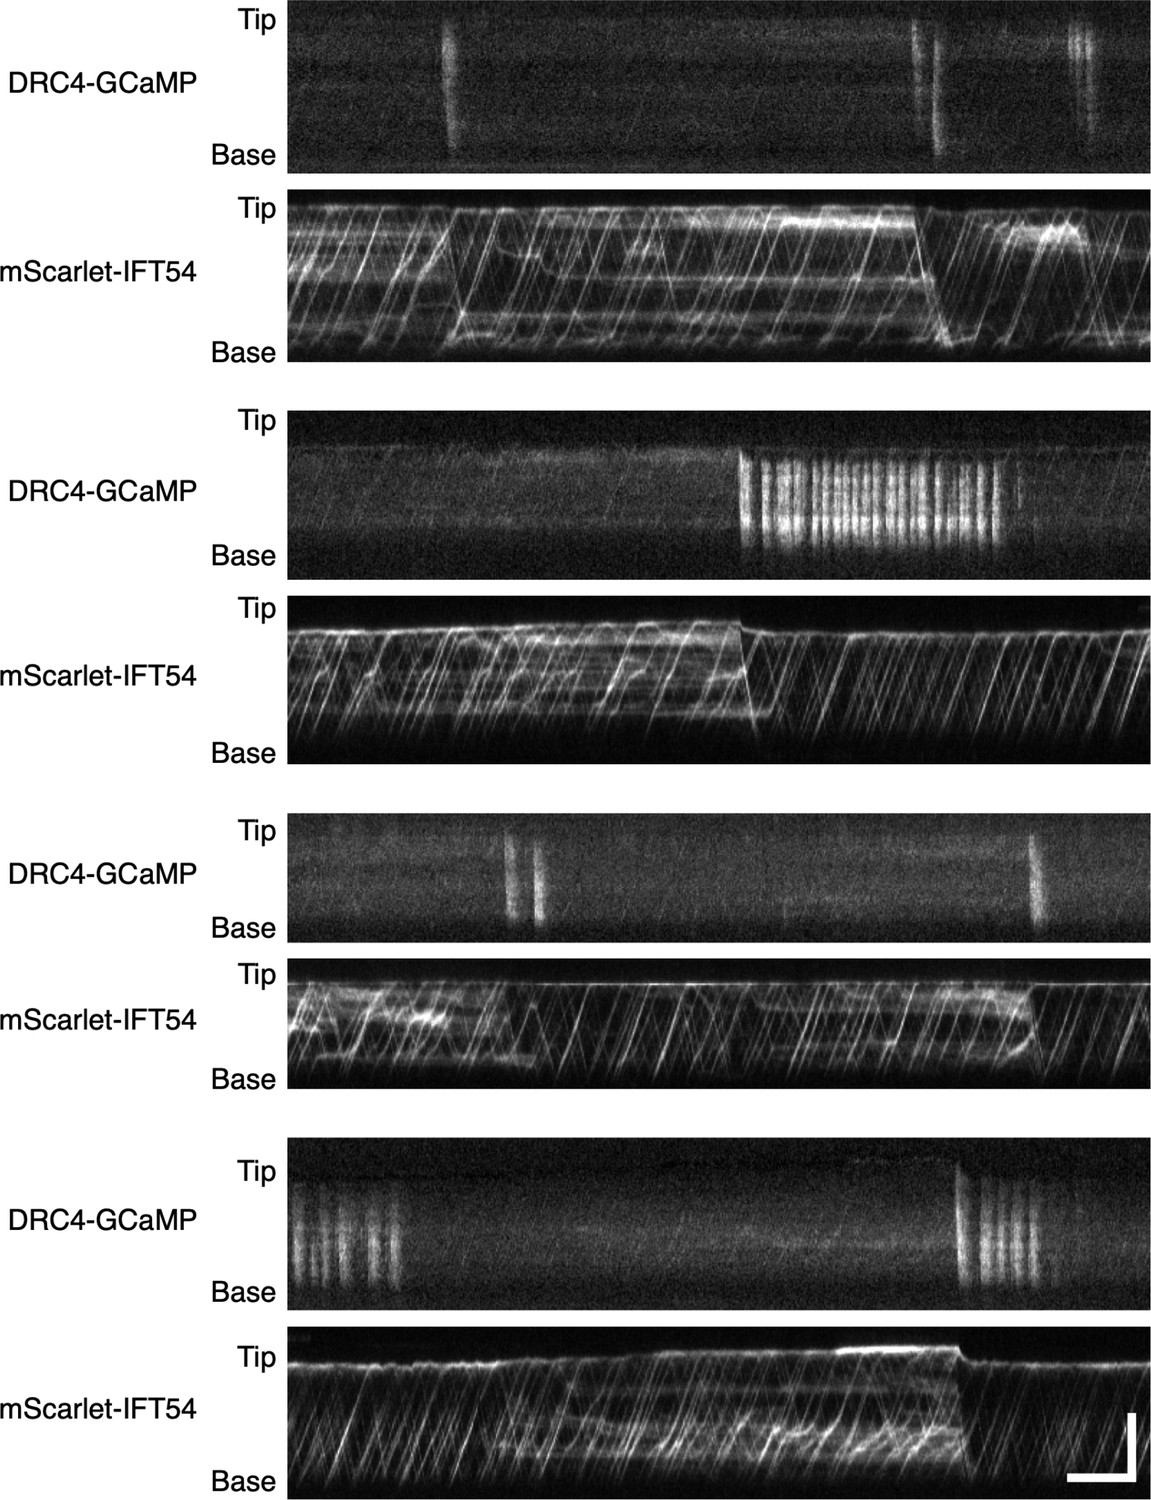
Additional examples of stalled IFT release by Ca2+ influx.
Kymographs of DRC4-GCaMP and mScarlet-IFT54 were from four different flagella. mScarlet-IFT54 was paused and accumulated when Ca2+ influx was not observed for a long-time. These examples confirm that Ca2+ influx can clear paused IFT for flagella. Horizontal bar: 5 s; vertical bar: 5 µm.
Videos
Video 1
Movie of DRC4-GCaMP in control (pf2 DRC4-GCaMP) cell.
This movie was taken at 20 frames per second (fps) and plays in real time. Scale bar 5 μm.
Video 2
Movie of DRC4-GCaMP in 1 mM EGTA treated (pf2 DRC4-GCaMP) cell.
This movie was taken at 20 fps and plays in real time. Scale bar 5 μm.
Video 3
Movie of DRC4-GCaMP in the ppr2 mutant (pf2 ppr2 DRC4-GCaMP) cell.
This movie was taken at 20 fps and plays in real time. Scale bar 5 μm.
Video 4
Movie of DRC4-GCaMP in 1 mM CaCl2 treated (pf2 DRC4-GCaMP) cell.
This movie was taken at 20 fps and plays in real time. Scale bar 5 μm.
Video 5
Movie of KAP-GFP in control (fla3 KAP-GFP) cell.
This movie was taken at 20 fps and plays in real time. Scale bar 5 μm.
Video 6
Movie of KAP-GFP in the ppr2 mutant (fla3 ppr2 KAP-GFP) cell.
This movie was taken at 20 fps and plays in real time. Scale bar 5 μm.
Video 7
Movie of KAP-GFP in 1 mM EGTA treated (fla3 KAP-GFP) cell.
This movie was taken at 20 fps and plays in real time. Scale bar 5 μm.
Video 8
Movie of KAP-GFP in 1 mM CaCl2 treated (fla3 KAP-GFP) cell.
This movie was taken at 20 fps and plays in real time. Scale bar 5 μm.
Video 9
Movie of DRC4-GCaMP and mScarlet-IFT54 in the pf2 ift54 DRC4-GCaMP mScarlet-IFT54 cell.
DRC4-GCaMP is shown in green, and mScarlet-IFT54 is shown in magenta. This movie was taken at 10 fps and plays in real time. Scale bar 5 μm.
Additional files
Download links
A two-part list of links to download the article, or parts of the article, in various formats.
Downloads (link to download the article as PDF)
Open citations (links to open the citations from this article in various online reference manager services)
Cite this article (links to download the citations from this article in formats compatible with various reference manager tools)
Testing the ion-current model for flagellar length sensing and IFT regulation
eLife 12:e82901.
https://doi.org/10.7554/eLife.82901


