Neural circuits underlying habituation of visually evoked escape behaviors in larval zebrafish
- Wyss Institute for Biologically Inspired Engineering, Harvard University, United States
- Department of Molecular and Cellular Biology, Harvard University, United States
Figures
Figure 1 with 2 supplements
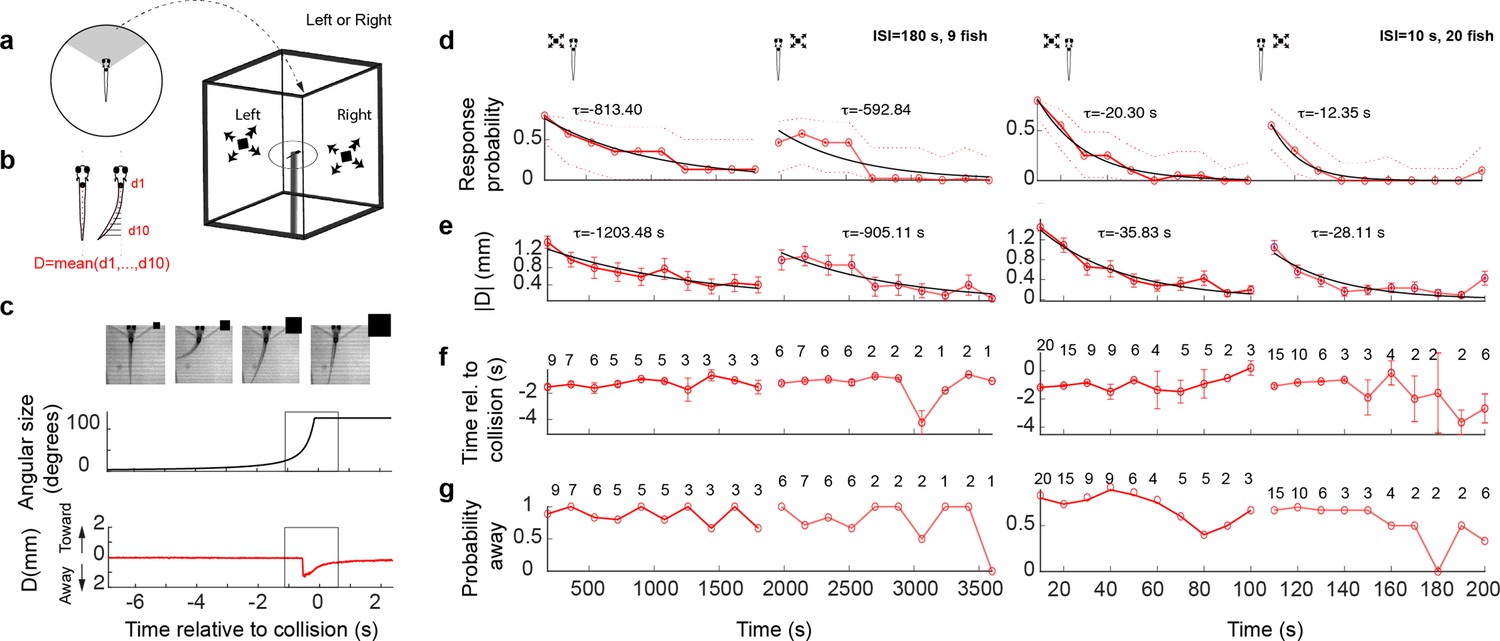
Looming stimuli evoke escapes in head-embedded tail-free larvae, which habituate in an eye- and interstimulus interval (ISI)-dependent manner.
(a) Schematic of the experimental setup. The fish was embedded in agarose in a dish with its tail free to move and then placed in the center of a cuboid tank on the walls of which looming stimuli were presented. (b) The tail movement amplitude was quantified as the average displacement from the midline. (c) Example of a looming-evoked escape response. Four equally spaced frames taken within the gray box in the lower panels. The size of the looming stimulus shown next to the video frames is for illustration purposes only and does not reflect the actual relative size of the stimulus. The stimulus angular size and the tail flick amplitude are shown in the middle and bottom panels, respectively. (d) Response probability declines with stimulus repetition (red curves), with the response recovering when the stimulus is shown to the contralateral eye (light red curve to the right). The left and right panels show data from ISI = 180 and 10 s, respectively. The time for each data point corresponds to integer multiples of ISI values. τ values correspond to the time constant of the exponential fit to the data a*exp(−t/τ). Only the very responsive zebrafish, that is those that at least responded to the first stimulus presentation were included in these experiments and the probability of observing a spontaneous tail flick within the same time window was subtracted from the observed probability. (e) Average amplitude of maximum peak in the tail flick trace. This includes all data points including no-escape trials where the peak amplitude was set to zero (9 fish for ISI = 180 and 20 fish for ISI = 10). (f) Response time relative to collision. The number of trials reflects the trials in which the escape occurred. (g) Percent escapes directed away from the approach.
Figure 1—figure supplement 1
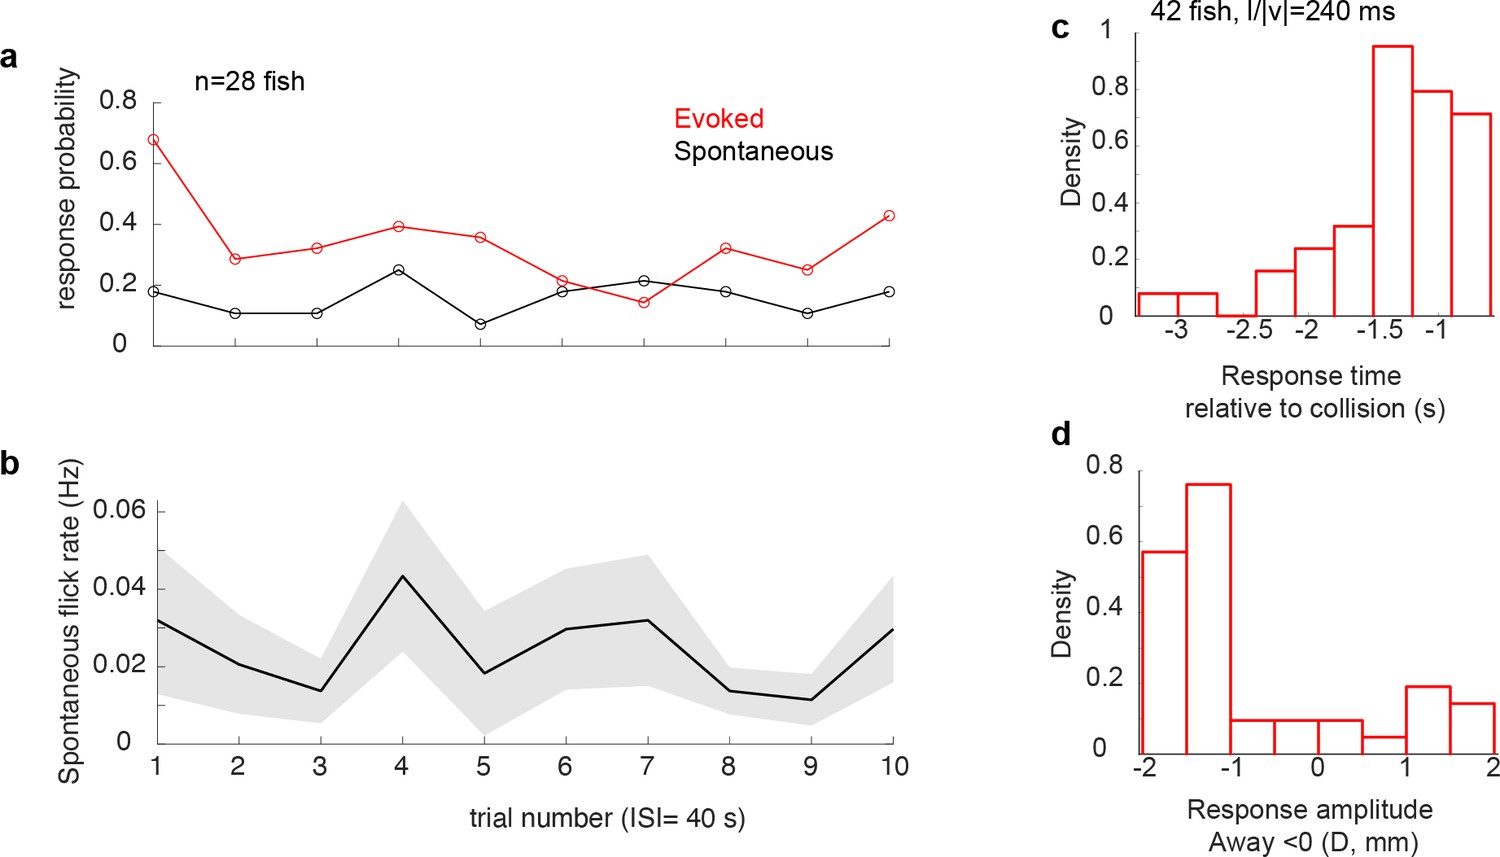
Spontaneous tail flicks occurred at a low rate, which did not change throughout the experiment Stimulus-evoked tail-flicks were directional and phase-locked to the stimulus.
(a) Average response probability of stimulus-evoked (red, calculated for each trial across 28 fish) and spontaneous tail flicks calculated in a same-length window prior to stimulus presentation (black). For each fish, a response was registered as 1 each time there was a tail flick and zero when there was none. The probability of evoked responses declines over trials, whereas it stays stable for spontaneous. (b) Panel shows the average rate of spontaneous tail flicks was similarly stable across trials. (c) Distribution of response time relative to collision (d) and peak amplitude.
Figure 1—figure supplement 2
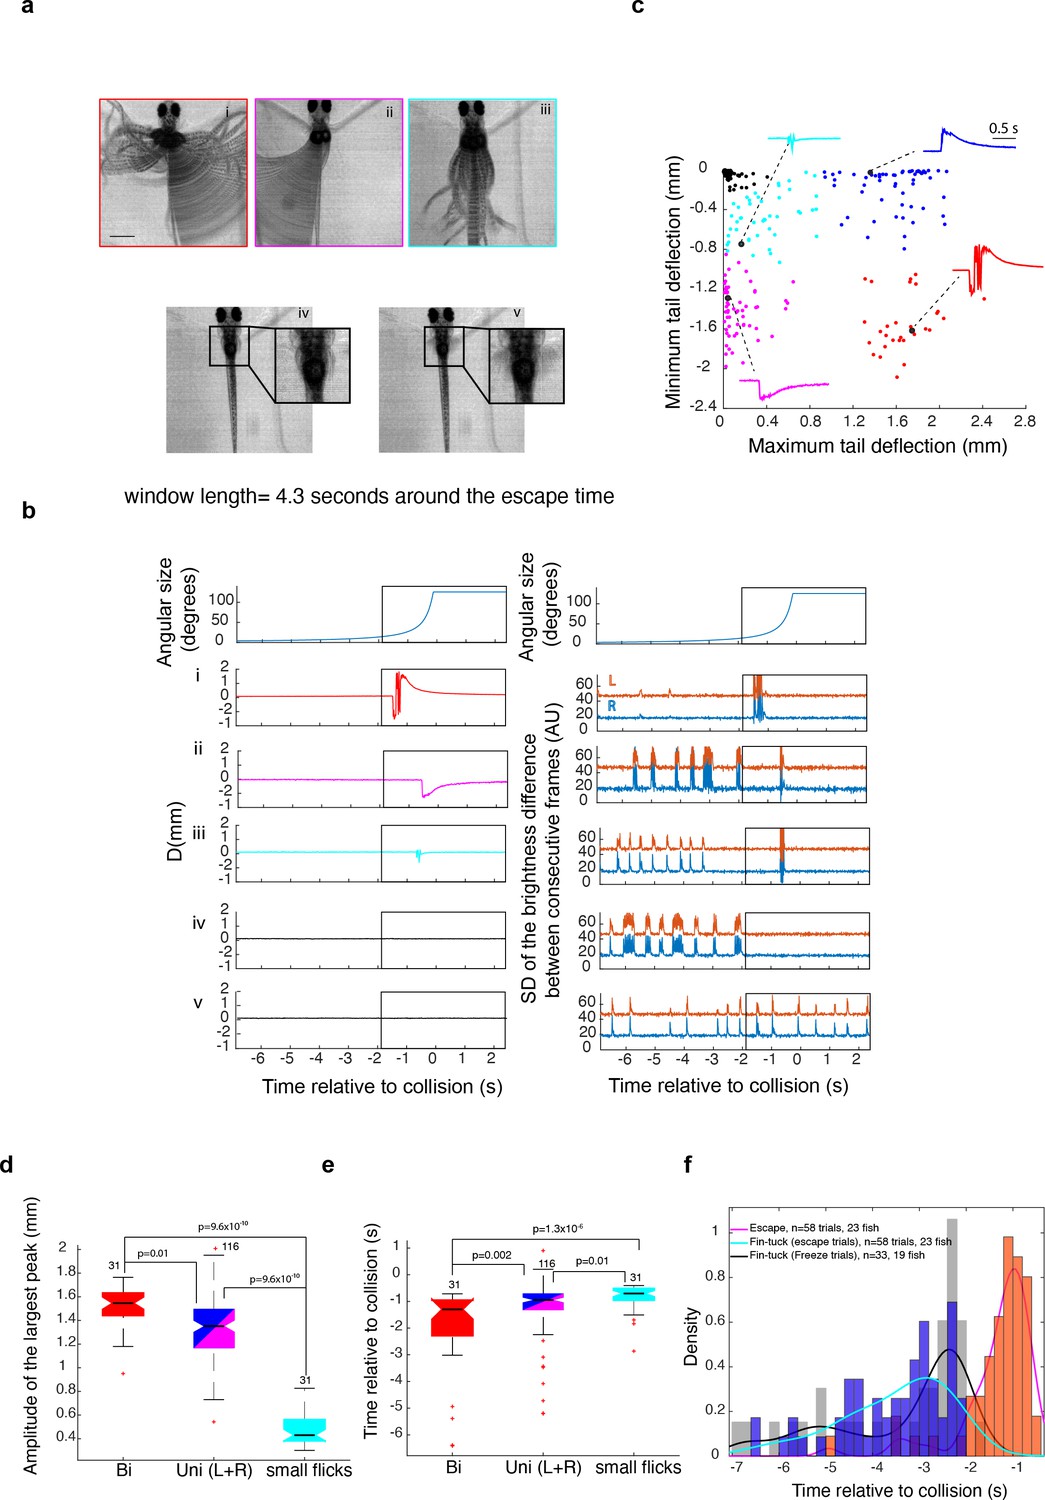
Larval zebrafish generate various types of escapes and freezing responses to looming stimuli.
(a) Composite video frames corresponding to various response types calculated over a 4.3-s-long window around the time of escape. Insets in panels iv and v focus on a window around the pectoral fins. scale bar = 1 mm (b) Tail and pectoral fin traces corresponding to the examples shown in (a). The top panels show the time course of the stimulus angular size. The left panels below show the average of tail deflection from the midline and the right panels show the corresponding fin movement traces. Note that escape movements create an artifact in the fin trace (large deflections within the rectangular window). The rectangular window corresponds to the time window where the composite images in panel (a) were calculated. (c) K-means clustering of response types: response time, amplitude of the positive peak, amplitude of the negative peak, and their ratio were used to classify behavior into four different escape types (colored dots) and no escapes (black dots). The panel shows the result of K-means clustering plotted against two of the variables used for clustering data from 420 trials in 42 fish. The stimulus was either presented to the left or right eye, resulting in two clusters of unilateral escapes showing opposite tail flick directions. The insets show the points corresponding to traces shown in panel (b). Red: large bidirectional tail flicks, magenta and blue: unidirectional tail flicks to one side or the other, cyan: small flicks, black: no escape (d, e). Amplitude and timing of escape relative to expected collision for different response types, respectively. Data for left and right unidirectional tail flicks were pooled. The + symbols indicate outliers. (f) The distribution of the timing of escape and fin tucking for escape and freeze trials. Although fin tucks occurred significantly earlier than escapes, the timing of fin tucks was not significantly different between escape and freeze trials.
Figure 2
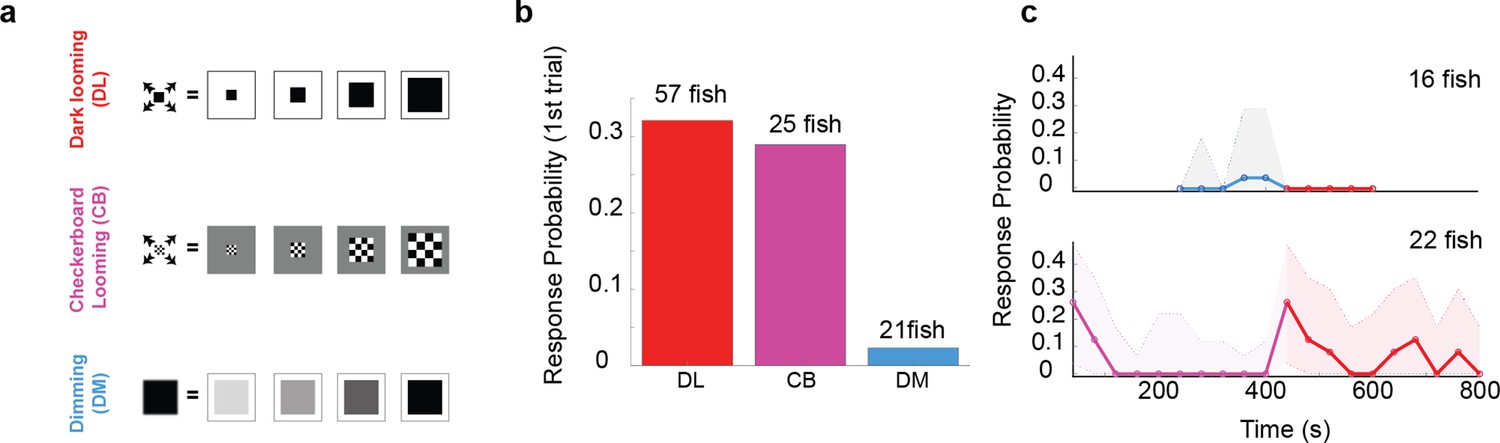
The looming aspect of the stimulus is essential for driving fast escapes, however, pre-exposure to dimming abolishes response to dark looming.
(a) Schematics of different stimulus types used to dissect the effect of overall dimming versus expansion. (b) The probability of an escape response upon the first encounter with these stimulus types. A tail flick was taken as a response to the stimulus if they occurred after stimulus size had reached 5 degrees and before 5 s after the stimulus ended expanding. (c) Bottom panel, magenta line shows the response probability to checkerboard stimulation (10 trials, n = 22 fish), which were subsequently presented with 10 dark looming stimuli (red line). The fish attempt to escape in response to dark looming stimuli that follow 10 instances of checkerboard stimulation, but they do not respond to the same stimulus when it comes after exposure to even 5 dimming stimulations (top panel, blue and red lines: response probability to dimming and subsequent dark looming stimuli, respectively). The shaded areas show the 95% confidence interval. The probability of spontaneous flicks over the same-length time window was subtracted from the overall response probability in data presented in all panels.
Figure 3 with 3 supplements
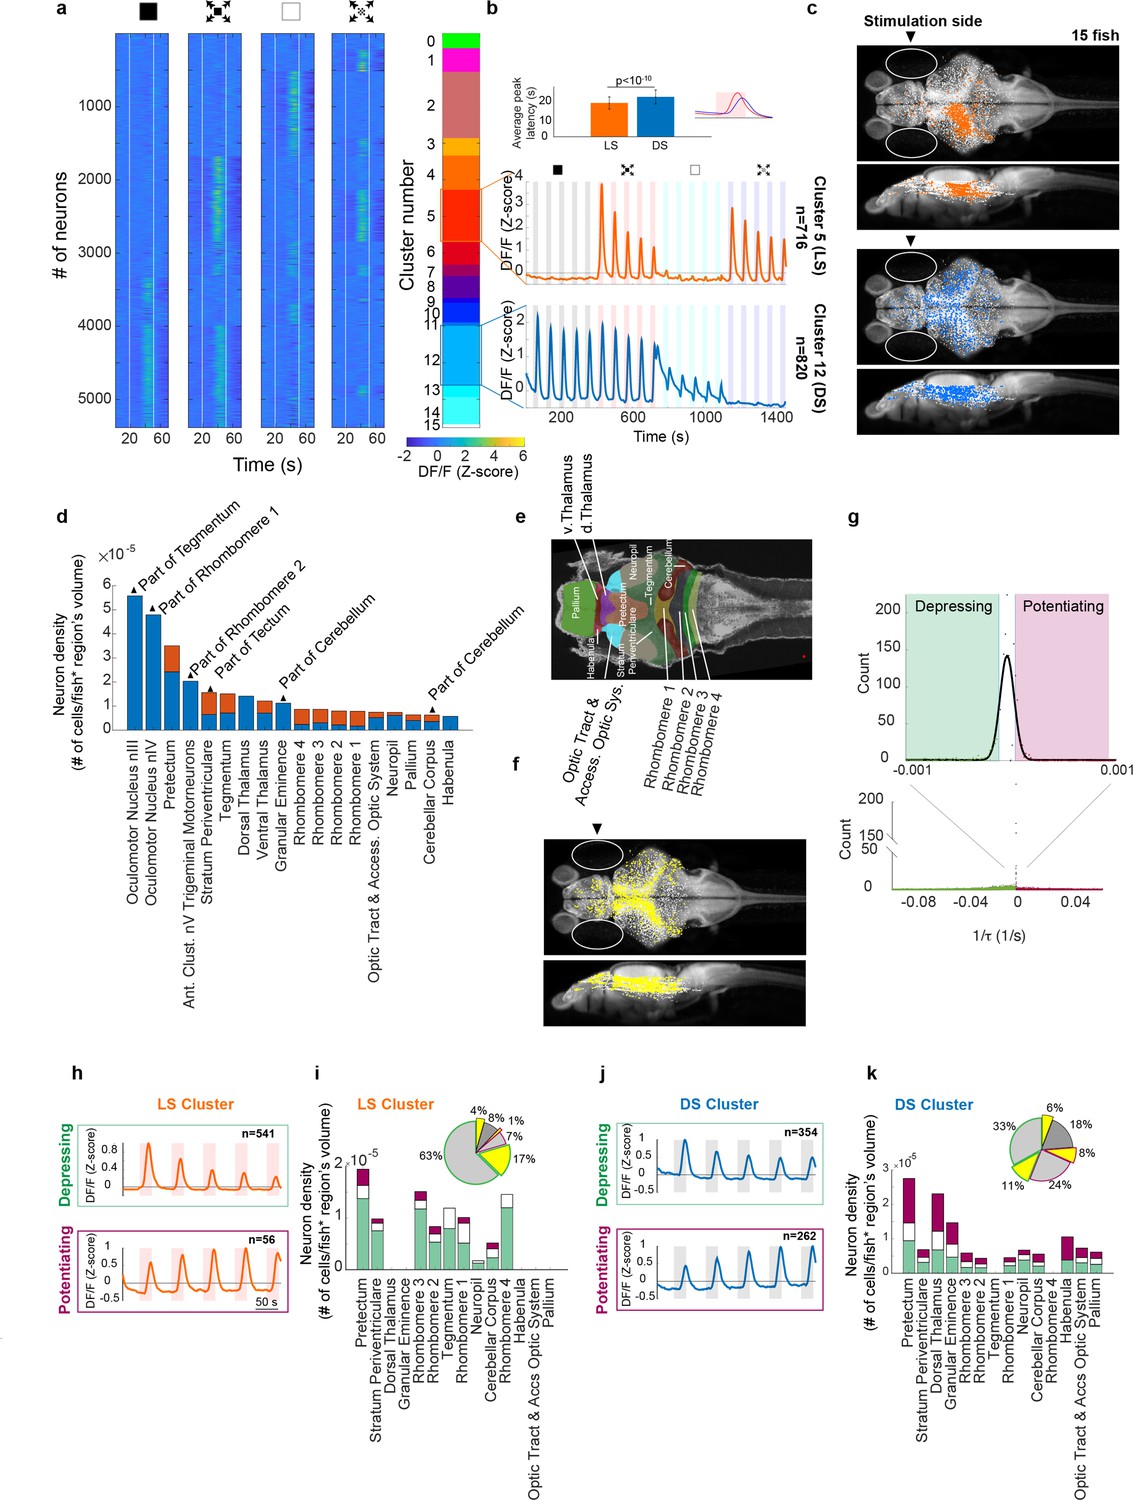
Looming stimuli evoke activity in distinct neuronal populations across brain regions, the peak response amplitudes of which could decline as well as potentiate with repeating stimulation.
(a) First four panels show trial averages of neurons responsive to one or more of the stimulus types. Neurons were sorted based on their 4-digit binary code corresponding to higher than threshold correlation of trial averages with dimming, dark looming, brightening, or checkerboard stimuli (interstimulus interval [ISI] = 40 s,l/|v| = 480 ms). The fifth panel shows the decimal cluster number corresponding to the binary code obtained after thresholding correlation levels of trial averages with the stimulus (see Methods). (b) Average (SE) response of the neurons in clusters 5 (red) and 12 (blue). Inset shows the average (SD) of response peak latency. (c) Distribution of looming- (LS; red) and dimming-sensitive (DS; blue) neurons in clusters 5 and 12, respectively. White dots show all neurons. (d) Regional distribution of all neurons in the LS (red) and DS (blue) clusters, regions are shown only if they contained at least 10 cells and were represented by at least 3 fish. (e) Key to the brain regions shown on the reference Z brain. (f) Distribution of putative GABAergic neurons (yellow) among all neurons (white). (g) Histogram of the coefficients of the exponential fit function to the peak response amplitudes of all neurons (see Methods). Full-width-half-max of a Gaussian fit to the near zero peak was used to determine positive (4.13 × 10⁻⁵ s−1) and negative (−1.17 × 10⁻⁵ s−1) thresholds. Maroon and green segments correspond to potentiating and depressing groups, respectively. (h) Median responses of depressing and potentiating LS cell subclusters to the first five dark looming stimuli. (i) Brain region stacked histogram of depressing (green), potentiating (maroon), and stable (white) LS cells. Inset: the proportion of GABAergic neurons (yellow) within each subcluster (border colors corresponding to depressing, potentiating, and stable subclusters, gray: non-GABAergic) (j, k). Same as (h, i) for DS cells.
Figure 3—figure supplement 1
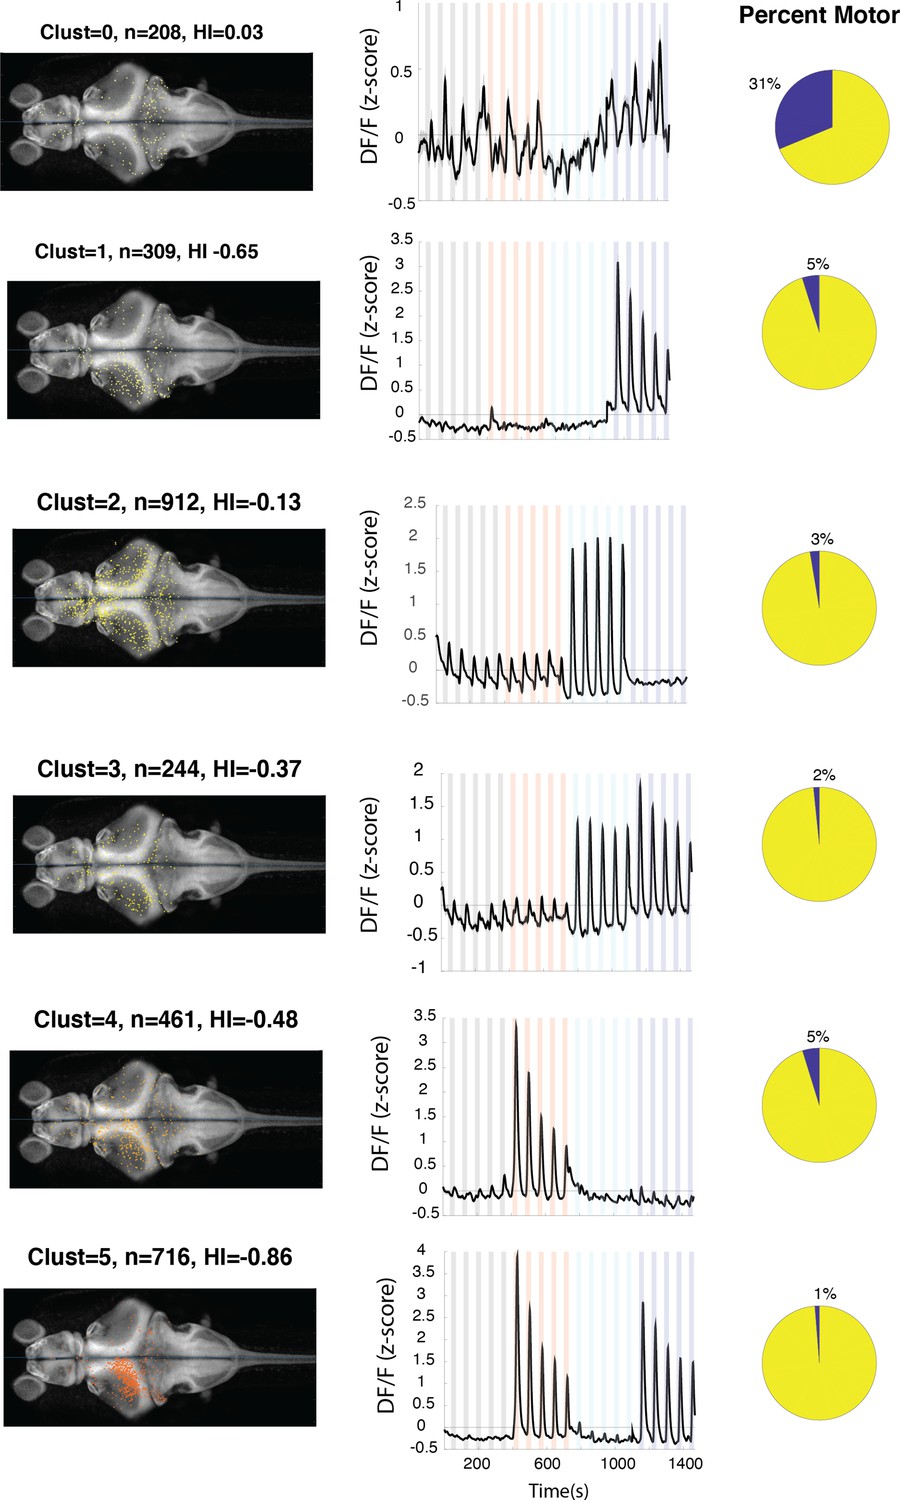
Anatomical location and response properties of identified neuronal clusters.
Left columns: distribution of neurons within each cluster across brain regions mapped onto the standard Z-brain. Clust: cluster number, HI: hemispheric index, n: number of neurons. Middle columns: average response of neurons in all 16 clusters. Right column: percentage of neurons in the cluster that show correlation of more than 0.5 with the motor output.
Figure 3—figure supplement 2
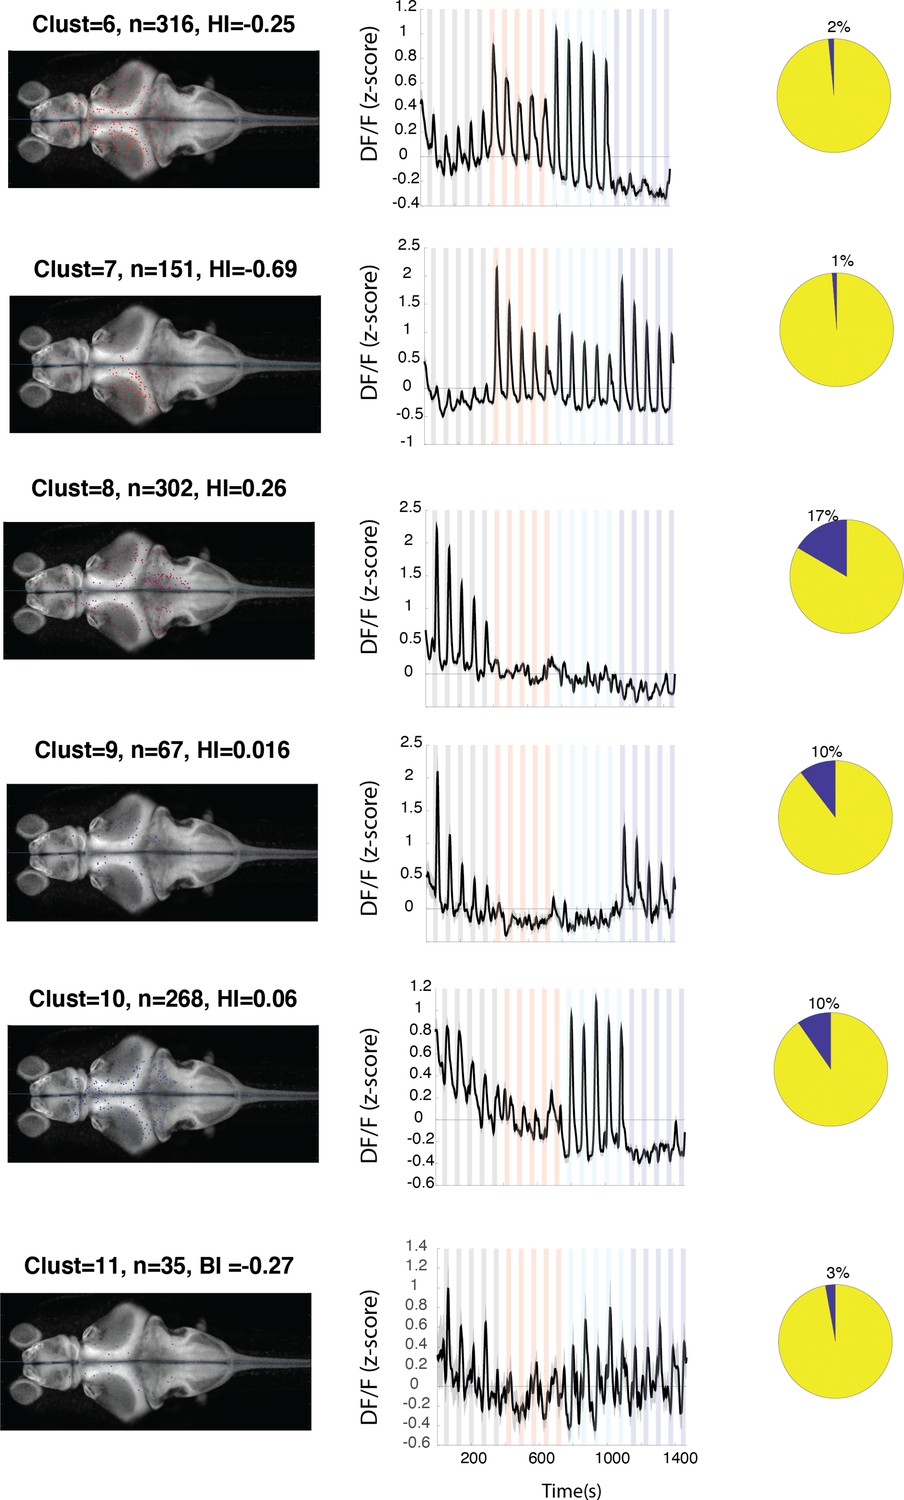
Anatomical location and response properties of identified neuronal clusters.
Left columns: distribution of neurons within each cluster across brain regions mapped onto the standard Z-brain. Clust: cluster number, HI: hemispheric index, n: number of neurons. Middle columns: average response of neurons in all 16 clusters. Right column: percentage of neurons in the cluster that show correlation of more than 0.5 with the motor output. Histogram shows the neuron density across brain regions that were imaged. Regions are shown only if they contained at least 10 cells and were represented by at least 3 fish.
Figure 3—figure supplement 3

Anatomical location and response properties of identified neuronal clusters.
Left columns: distribution of neurons within each cluster across brain regions mapped onto the standard Z-brain. Clust: cluster number, HI: hemispheric index, n: number of neurons. Middle columns: average response of neurons in all 16 clusters. Right column: percentage of neurons in the cluster that show correlation of more than 0.5 with the motor output. Histogram shows the neuron density across brain regions that were imaged. Regions are shown only if they contained at least 10 cells and were represented by at least 3 fish.
Figure 4
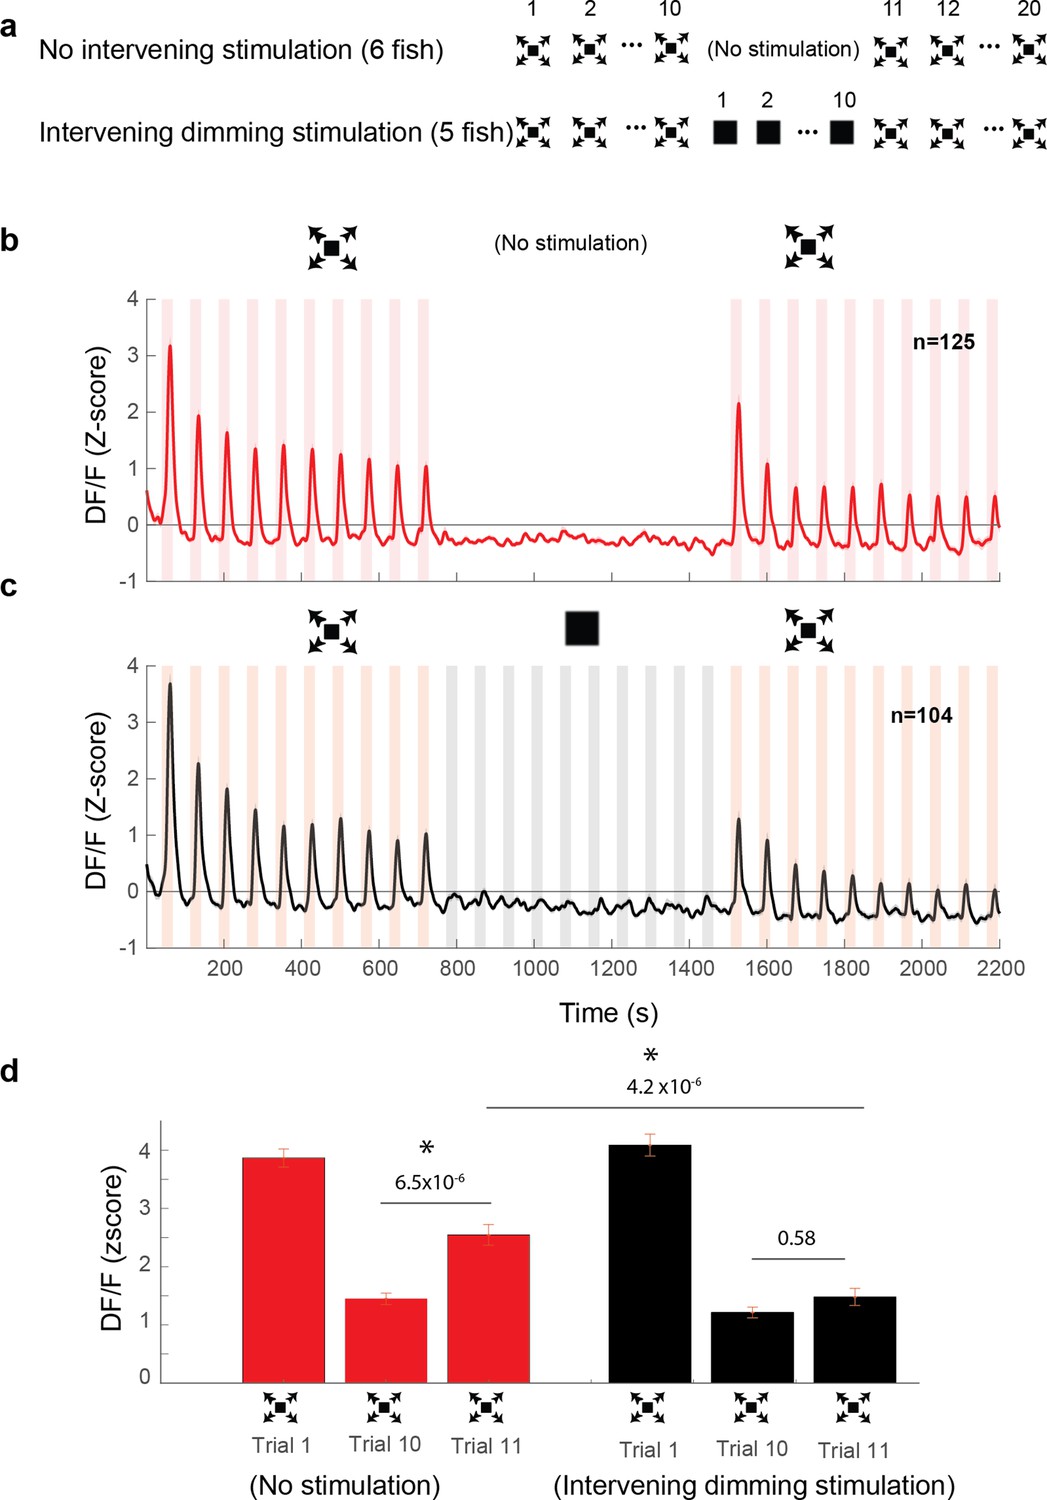
Dimming stimuli negatively affect response recovery of looming-specific neurons.
(a) Stimulation paradigms for the two experimental groups: one with dimming stimuli presented in between two dark looming sequences and the other with no stimulation for an equal period of time. (b) Average response of looming responsive decreasing neurons (interstimulus interval [ISI] = 40 s). Dark looming stimuli were presented, followed by a recovery period (equal to the timing of 10 stimulus presentations at ISI = 40 s), after which dark looming stimuli were presented again. (c) Same as (b) except that instead of the period with no stimulation, the fish was stimulated with dimming stimuli. (d) The peak response to dark looming was significantly smaller on the 10th compared to the first trial as expected. This response has significantly recovered on the first dark looming test trial after waiting period (Trial 11), but not in the case of intervening dimming stimulation. The peak response on the 11th trial for the dimming group was significantly smaller than that for the wait group. Error bars = standard error. * indicates statistical significance.
Figure 5
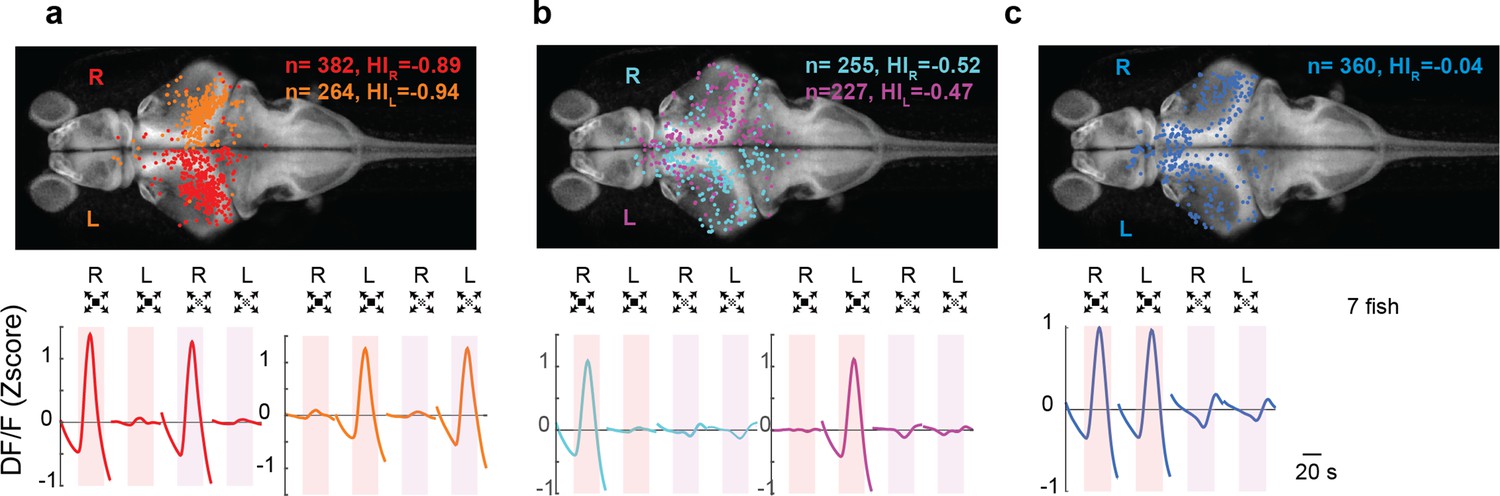
Looming-sensitive neurons were monocular, whereas dimming-sensitive neurons could be binocular or monocular.
(a) Looming-sensitive neurons respond to both dark looming and checkerboard stimuli, but only when they are presented to the eye contralateral to their location in the brain. Top panel shows the location of the cell bodies that respond to right eye (red) and left eye (orange) stimulation. The bottom panel shows trial-averaged responses of these neurons. HI: hemispheric index, negative values indicate bias toward the hemisphere contralateral to the stimulated eye. (b) Dimming-sensitive neurons that responded to stimulation of one or the other eye. These neurons were located largely in the hemisphere contralateral to the eye they responded to, although the bias was not as large as that in looming-sensitive neurons. (c) Dimming-sensitive neurons that responded to the stimulation of either eye were present in both contralateral and ipsilateral hemispheres. Data from seven fish, n indicates the number of neurons.
Figure 6
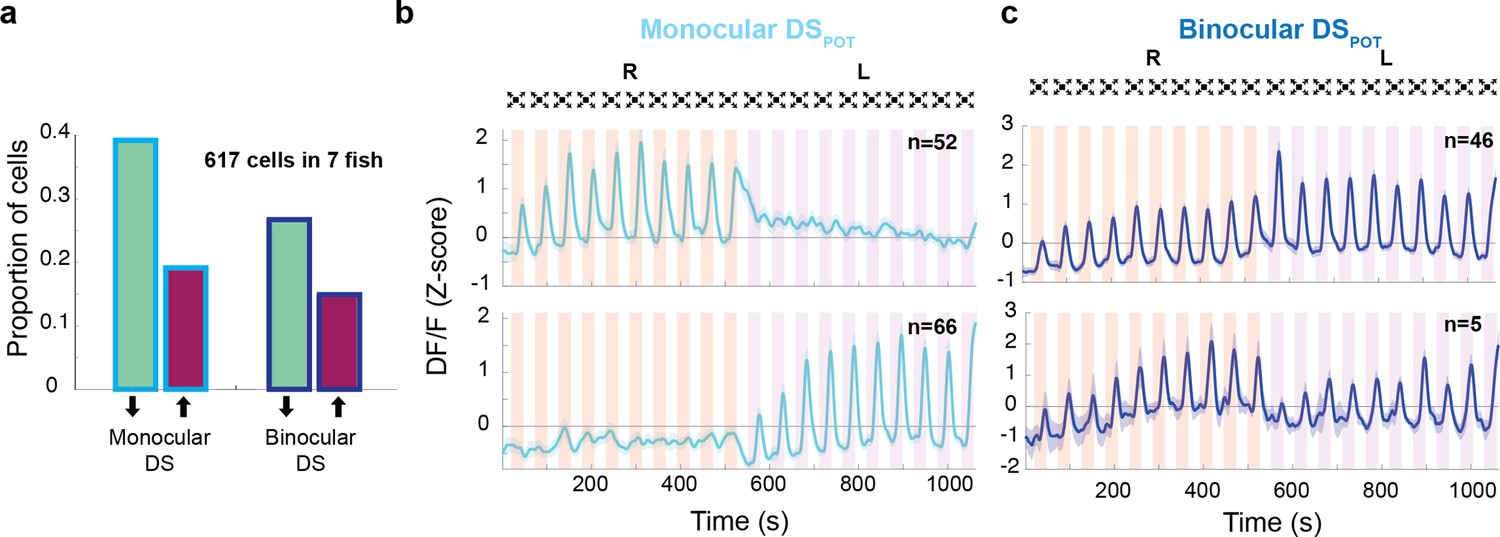
Response properties of binocular and monocular dimming-sensitive neurons.
(a) Proportion of dimming-sensitive neurons that fall into binocular/monocular categories and further into potentiating (maroon) and depressing (green). (b) Top and bottom panels show the average of monocular DSPOT neurons responsive to the right and left eyes, respectively (interstimulus interval [ISI] = 20 s). (c) Top panel shows the average response of binocular DSPOT neurons that retain or continue increasing their amplitude on the second side. Bottom panel shows the few binocular DSPOT neurons that reset their response when the stimulus was switched to the contralateral side.
Additional files
Download links
A two-part list of links to download the article, or parts of the article, in various formats.
Downloads (link to download the article as PDF)
Open citations (links to open the citations from this article in various online reference manager services)
Cite this article (links to download the citations from this article in formats compatible with various reference manager tools)
Neural circuits underlying habituation of visually evoked escape behaviors in larval zebrafish
eLife 12:e82916.
https://doi.org/10.7554/eLife.82916


