Coordinated head direction representations in mouse anterodorsal thalamic nucleus and retrosplenial cortex
- Department of Brain & Cognitive Sciences, McGovern Institute for Brain Research, Massachusetts Institute of Technology, United States
- Open-Ephys Inc, United States
- HHMI Janelia Research Campus, United States
- Department of Brain & Cognitive Sciences, Picower Institute for Learning and Memory, Massachusetts Institute of Technology, United States
- Department of Physics, Massachusetts Institute of Technology, United States
- Harvard Medical School, United States
- Department of Electrical Engineering and Computer Science, Massachusetts Institute of Technology, United States
Figures
Figure 1 with 3 supplements
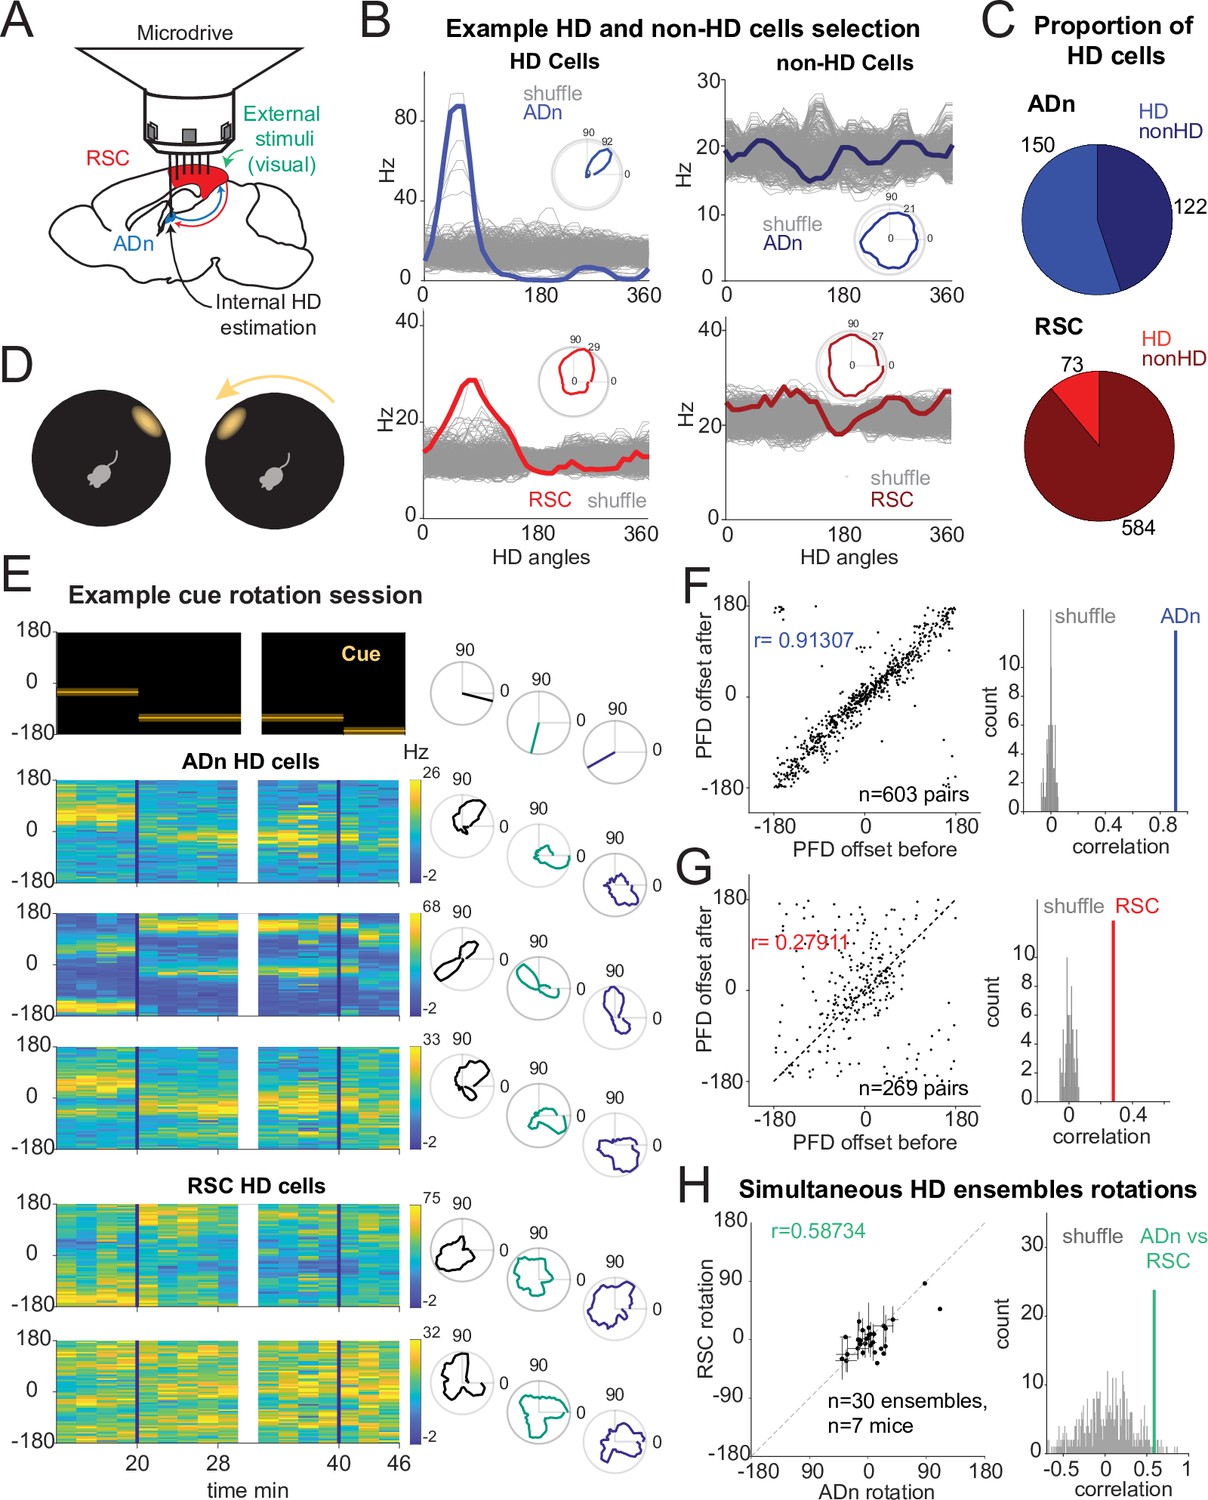
Congruent HD response to visual cue rotation in ADn and RSC.
(A) Schematic of simultaneous ADn (blue) and RSC (red) tetrode recording. (B) Tuning curves of examples of HD (left) and non-HD (right) cells in ADn and RSC. Grey lines are the tuning curves obtained from 500 shuffles of the cells firing rates. Insets show the tuning curves in polar coordinates. (C) Pie charts showing that 54% of cells in mouse ADn meet the HD selection criterion, but only 12% in RSC do (right) (n=12 mice, 9 with simultaneous ADn and RSC, 2 ADn only and 2 RSC only). (D) Schematic of the arena with the only prominent LED cue before (left) and after 90° rotation (right). (E) Simultaneous ADn-RSC recording from a session where the cue (top, left) was rotated first by 90° (first segment) and then 45° (second segment). Top right, same cue angular position representation but in polar coordinates. Left, tuning curves (2 min bins) over time of HD cells in the two regions shift the preferred firing direction (yellow bins, maximal firing rate) in response to the cue rotation. Right, same tuning curves in polar coordinates drawn for the different cue angles. (F) Right, scatter plot of preferred firing directions (PFD) differences from unique ADn HD cell pairs (n=603) before versus after rotation (ADn correlation: 0.91, 10 mice). Left, the correlation from the data in left is above the 99th percentile of randomly drawn angle differences. (G) Same as in F for RSC HD cell pairs (n=269, correlation = 0.28, 9 mice). (H) Left, ADn HD ensembles mean rotations (dots with horizontal lines, standard mean error) versus mean rotations of simultaneously recorded HD ensembles in RSC (vertical lines, standard mean error). Right, correlation value (correlation = 0.59) from the data in the left (n=30 ensembles for different sizes and directions of rotations from 71 trials, 7 mice) is above the 95th percentile of 500 times shuffled rotation trial indices for each HD cell.
Figure 1—figure supplement 1

Electrolytic lesions in RSC and ADn.
(A) Confocal images of coronal slices containing ADn or RSC from individual mice used for tetrode recordings. Images from individual mice are organized in a 3x4 grid, where sample electrolytic lesions in RSC are presented in the top row and those in ADn in the bottom row for mice with dual site recordings. Coordinates of the lesions are given as Anterior Posterior (AP), Medio-Lateral (ML) and Dorso-Ventral (DV) from Bregma. For mice with single recording site (the first 3), only one sample image is provided (in order RSC, carbon fiber-targeted ADn, and RSC). ADn and RSC granular and dysgranular outlines are shown with dashed lines in the first two images. White, leftward arrows indicate the lesions, which corresponds to the locations of the recording electrodes. Scale bar 1 mm; the same scale was applied to all images. (B) Summary of cortical tetrode locations from all mice color coded by mouse, distributed over four roughly matching coronal slices from the Mouse Allen Brain Atlas.
Figure 1—figure supplement 2
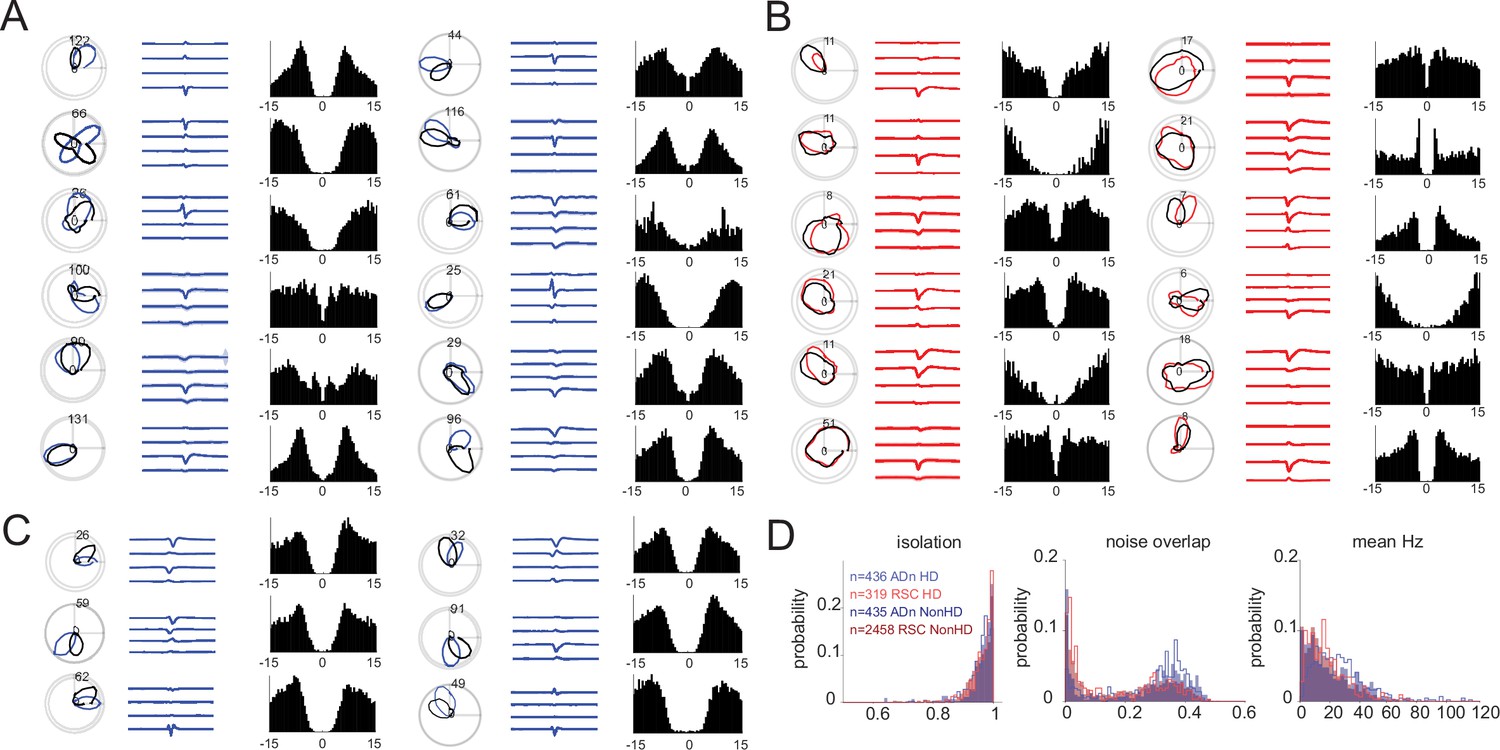
Example HD cells and sorting metrics.
(A) Twelve example ADn HD cells; for each cell: (left) tuning curves in polar coordinates black and blue to indicate tuning curves from distinct angular positions of the visual cue; (middle) the waveforms mean (solid thick line) and standard error (shaded region) from the four channels of the tetrode where the unit was detected; (right) autocorrelogram of the selected unit. (B) Same representation as in A but for 12 example RSC HD units. (C) Same representation as in A and B but for six simultaneously recorded HD cells in ADn from mouse 2. (D) Distributions of isolation (left), noise overlap (middle), and mean firing rate Hz (right) metrics extracted from spike-sorting of all ADn HD (n=436, filled blue histograms) and non-HD units (n=435, hollow dark blue) and RSC HD (n=319, red filled) and non-HD units (n=2458 hollow dark red) recorded.
Figure 1—figure supplement 3
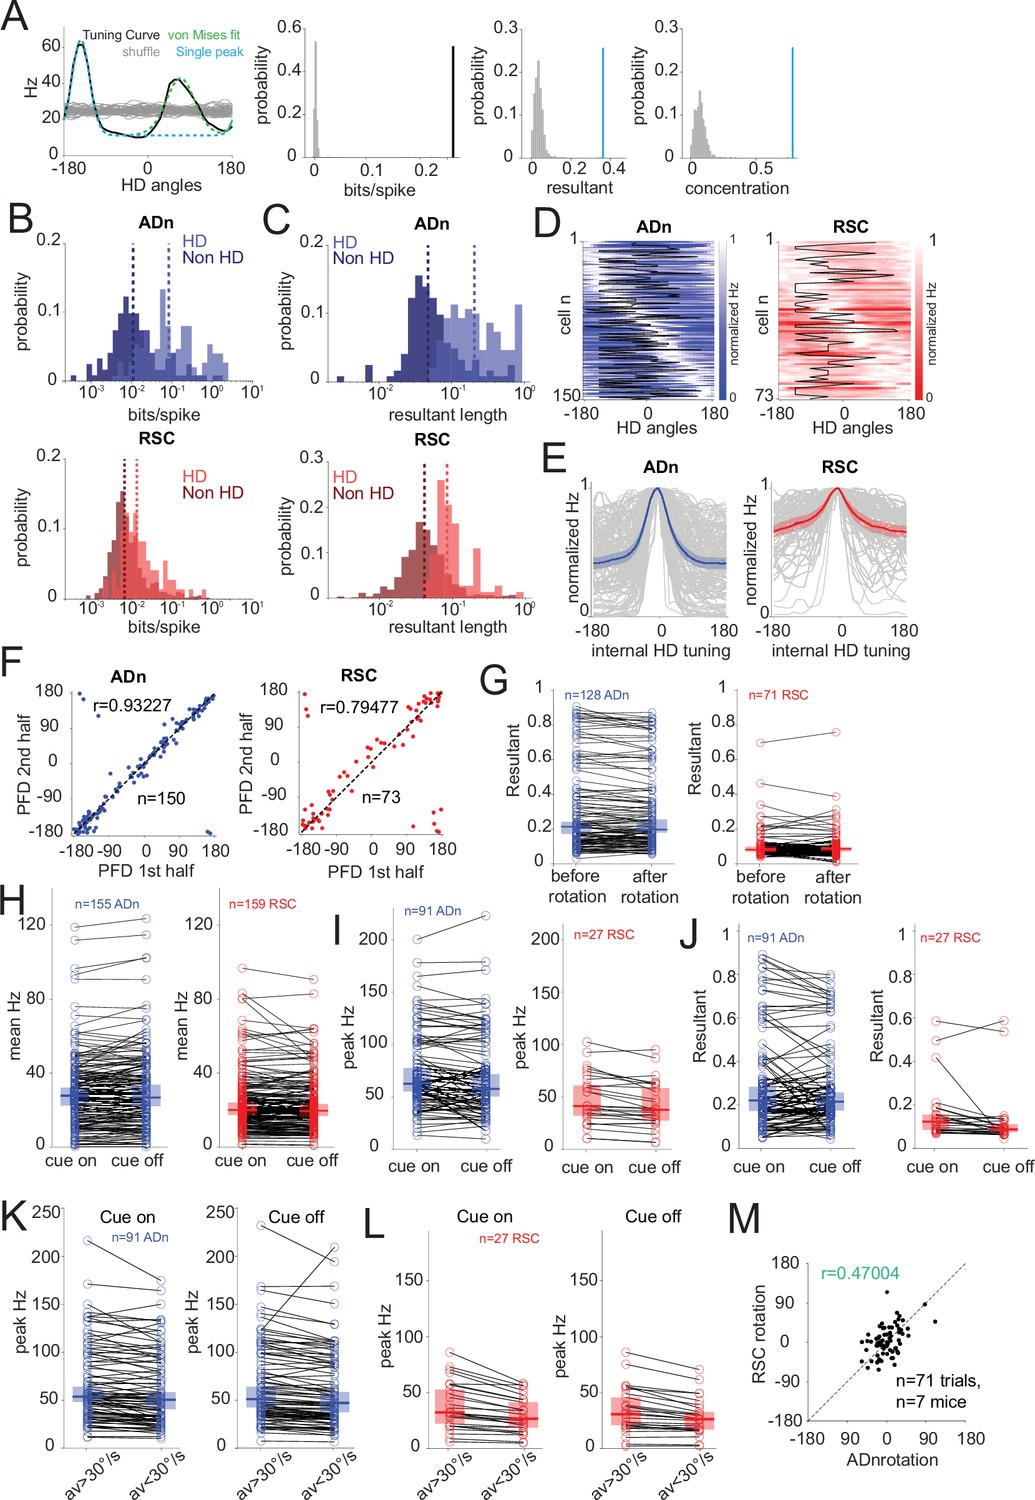
HD selection method and HD features across ADn and RSC.
(A) Left, example of von Mises fitting (green dashed) to an ADn HD tuning curve (solid black) with two identified peaks and the single peak trace (cyan dashed) derived from the von Mises model calculated on the tallest peak. Grey solid lines, tuning curves obtained from shuffling the spikes. Center left, the directional information calculated from the tuning curve in the example on the left is above the 98th percentile of the shuffle distribution. Center right and right, respectively, the resultant and the concentration parameter of the fit to the largest peak of the tuning curve is above the 98th percentile of the shuffle distribution. (B) Distributions and medians (dashed lines) of the directional information (in bits/spike) of the same groups of units as in B: ADn HD (0.084, n=150) and non-HD (0.011, n=122) and RSC HD (0.015, n=73) and non-HD (0.006, n=584) units (p<0.0001, Kruskal Wallis test, p<0.0001 for multiple comparisons after Bonferroni correction except for ADn nonHD versus RSC HD, p>0.05). (C) Distributions and medians (dashed lined) of the resultants across ADn (top) HD (0.21, n=150) and non-HD (0.047, n=122) and RSC (bottom) HD (0.084, n=73) and non-HD (0.041, n=584) units (p<0.0001, Kruskal Wallis test, p=0.0031 for ADn-RSC HD and p=0.028 for ADn-RSC non-HD, other multiple comparisons after Bonferroni correction p<0.0001). (D) Normalized tuning curves of all the HD units in Figure 1C sorted by peak location in ADn (left) and RSC (right) overlaid by the cue angular position (black). (E) Individual (grey) and mean and 95% CI of normalized and peak-aligned to 0° HD tuning curves from D, ADn (left, blue) and RSC (right, red). (F) Stability of HD cells assessed by plotting the preferred firing direction (PFD) of HD cells’ tuning curves calculated from the first half of stable cue-on periods against those from the second half in ADn (left, n=150, circular correlation r=0.93, p<0.0001) and RSC (right, n=73, circular correlation r=0.79, p<0.0001). (G) Stability of HD cells resultant length in ADn (left, n=128, p=0.23, median before = 0.22, after = 0.23) and RSC (right, n=71, p=0.79, median before = 0.086, after = 0.088) between before and after cue rotation for a single trial in selected significant cue rotation sessions sampling unique HD ensembles. (H) Mean firing rates (in Hz) of all recorded cells in ADn were stable between cue on and off conditions (left, n=155, median cue on = 27.58, median cue-off=26.80, p=0.067); however, a small but significant reduction was observed in RSC units (right, n=159, median cue-on=20.10, median cue-off=19.69, p=0.046) between cue-on and cue-off conditions. (I) Reduced peak firing rates (in Hz) of HD cells ADn (left, n=91, cue-on median = 62.52, cue off median = 57.63, p=0.0027) and RSC (right, n=27, cue-on median = 41.35, cue-off median = 37.74, p=0.0004) between cue-on and cue-off conditions. (J) Stable HD cells resultant length in ADn (left, n=91, cue-on median = 0.22, cue-off median = 0.21, p=0.69), but reduced in RSC (right, n=27, cue on median = 0.123, cue-off median = 0.087, p=0.0057) between cue-on and cue-off conditions. (K) Peak firing rates (in Hz) of unique HD cells ensembles in ADn were modulated by AV in both cue on and cue-off conditions (n=91, AV >30°/s cue-on median = 53.7, AV <30°/s cue-on median = 50.4, p<0.0001; cue-off AV >30°/s median = 51.17, AV <30/s median = 47.18, p<0.0001). (L) Peak firing rates (in Hz) of unique HD cells ensembles in RSC were modulated by AV in both cue-on and cue-off conditions (n=27, AV >30°/s cue-on median = 32.24, AV <30°/s cue-on median = 26.6, p<0.0001; cue-off AV >30°/s median = 30.78, AV <30°/s median = 26.31, p<0.0001). (M) Coordination of ADn and RSC HD ensembles rotations (circular correlation r=0.47, above the 99th percentile of 500 random angles samples) of individual trials (n=71, from 7 mice) from the same selected sessions sampling unique ensembles in Figure 1H. Comparisons in G-L were tested through Wilcoxon Signed-Rank test and median and 95% CI are presented. Data was taken from selected sessions sampling unique cells ensembles.
Figure 2 with 3 supplements
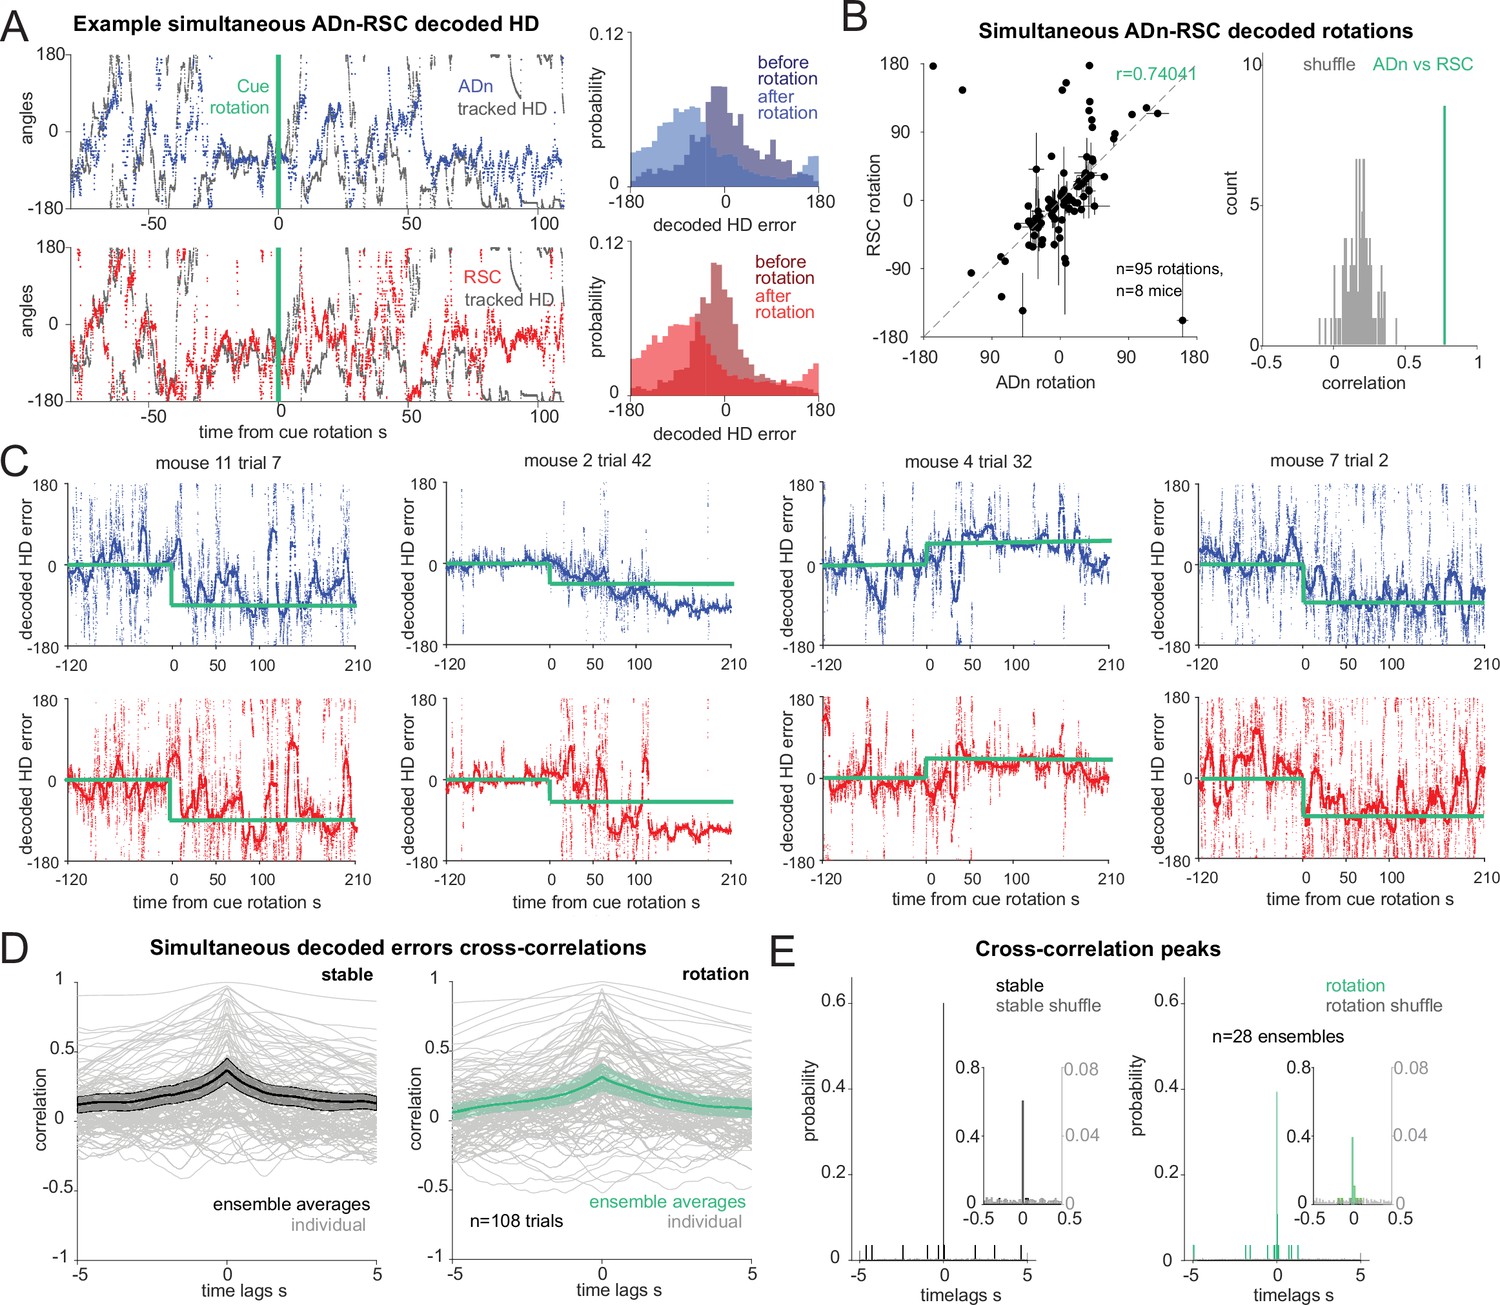
Synchronous shifting of ADn and RSC HD representation in response to cue rotation.
(A) Left, Example of decoded HD in ADn (top, blue line) and RSC (bottom, red line) from a simultaneous recording in the two regions before and after cue rotation (green line at t=0 s). Grey, mouse HD from tracking. Right, probability-histograms of the difference between the tracked and the decoded HD shown on the left in ADn (top, blue) and RSC (bottom, red). Darker shades, decoded error before rotation, lighter shades after rotation. (B) Left, decoded ADn vs paired RSC rotation (n=95 unique ensembles for different sizes and directions of rotations from a total of 182 trials, 8 mice). Right, circular correlation coefficient (0.74) between the decoded ADn and RSC rotation (green) is above the 99th percentile of the 100 times randomly shifted RSC decoded HD for each trial (grey histogram). (C) Four examples of paired ADn (top row) and RSC (bottom row) decoded HD errors drifting toward the target (yellow). Thicker lines, median-smoothed error over a 5 s window. The fourth example is the decoded error of the traces shown in A. (D) Mean and 95% CI of temporal cross correlation between paired decoded errors before rotation (left, black) and immediately after rotation (right, green) (75 s long segments, n=28 unique ensembles from a total of 108 paired trials out of 182 with mean ADn rotation >17.2°, 8 mice). Grey, individual trials. (E) Probability histograms (20ms bins) of the time lags corresponding to the peak correlation values from the unique ensembles (n=28), averaged traces from the trials in D; left, before rotation, right, after rotation. Left y-axis scaled to show the uniformity of the null distributions (grey). Insets, zoomed in histograms in the –0.5 s to 0.5 s range. The real distributions are significantly different from null (two-sample Kolmogorov-Smirnov test, p<0.0001 for both stable and shifted). No difference between stable and shifted trial correlations was observed (Wilcoxon Signed-Rank test p=0.88).
Figure 2—figure supplement 1

HD decoding with a linear-Gaussian GLM.
(A) Linear-Gaussian GLM-based decoding strategy for each trial and neuronal ensembles (See also Methods section) with an example of modeled sin(HD) and cos(HD). (B) Individual sessions median decoded HD errors from the stable test period that are below the 10th percentile of the medians from 100 decoded errors from shuffled spikes for ADn (n=69, 3 rejected) and RSC (n=62, 2 rejected) ensembles are included for further analyses. (C) Mean and 95% CI of the absolute decoding error distribution for ADn (blue) and RSC (red) and the respective 100 combined spike shuffles for each region from the test period from rotation trials (n=36 unique ensembles ADn, n=29 for RSC). (D) Violin plots of the medians of the absolute decoded errors for ADn and RSC ensembles and the respective combined 100 shuffles (p=0.0039, Mann-Whitney test, medians plotted in black 36.32° in ADn, n=36, and 47.53° in RSC, n=29). (E) Same as C, but separating time points of high (>30°/s) from low (<30°/s) AV. (F) Same as C, but separating between the median errors collected from high versus low AV (medians of low AV: ADn = 33.37°, RSC = 43.44°, medians of high AV: ADn = 39.42°, RSC = 60.98°; two-way ANOVA p<0.0001 between the two regions and p=0.0012 between the two velocity states, p>0.05 of the interaction between the two groups). p<0.05 for multiple comparisons test between all groups except high AV ADn and low AV RSC and high AV ADn and low AV ADn. (G) Left: scatter plot with error bars of the mean rotations from simultaneous ADn HD neurons tuning curves versus the mean rotations calculated from decoding HD from ADn neurons (circular correlation coefficient = 0.73, p<0.0001, n=113 ensembles averaged across trials of positive and negative small and large rotations). Right: the observed correlation is more than the 99th of 100 correlation obtained from shuffling the spikes for HD decoding. (H) Same as G but for RSC (circular correlation coefficient = 0.76, p<0.0001, n=59 ensembles).
Figure 2—figure supplement 2

Relationship between cue bearing and decoded neural rotations.
(A) Schematic of the distinction between egocentric ‘in view’ (right) and ‘out of view’ (left) angular position of the visual cue before rotation. (B) Violin plots of the decoded rotations from all simultaneous ADn and RSC trials separated according to the imposed cue rotation size (at a cutoff of 67.5°) and the egocentric view of the cue before rotation. On average, small cue rotations were more closely followed by the two regions than the large cue rotations (multiple ways ANOVA, p=0.0003 effect of the size of rotation, p>0.05 for effects of brain region and egocentric condition and for the interactions, except for region*size of rotation interaction of p=0.046). Between the following categories n trials: large/out-of-view: n=8, large/in-view: n=51, small/out-of-view: n=14, small/in-view: n=36, p>0.05 for all Bonferroni-corrected multiple comparisons except for ADn in-view big rotations and RSC out-of-view big and small rotations and RSC in-view small rotations where p>0.01. (C) Decoded ADn and RSC rotation as a function of the egocentric bearing of the cue right before rotation. (D) Decoded ADn and RSC rotation as a function of the egocentric bearing of the cue right after rotation. p>0.05 of the Pearson’s correlation coefficients, ADn n=253, RSC n=262, both in C and D.
Figure 2—figure supplement 3

Robustness of different similarity metrics between decoded ADn and RSC HD and time course of the realignment.
(A) Similar to Figure 2E but only for the first 25 s of simultaneous decoded errors after cue rotation (two-sample Kolmogorov-Smirnov test, P<0.0001 for both stable and shifted versus the null distributions in grey, n=28 unique ensembles). No difference between stable and shifted trial correlations was observed (Wilcoxon Signed-Rank test p=0.40). (B) Median differences of 7 5s-long segments (considering therefore the first 35 s of stable and realignment traces) of the absolute values of the differences of decoded HD from ADn and RSC offset between –5 s up to 5 s time lags. Grey traces are the individual trials and black and green traces the medians and 95% CI. (C) Similar to B but for the difference in decoded HD errors between ADn and RSC. (D) Histograms of the time lags corresponding to the minimum error for each trial in C. (E) Median and 95% CI for the unique ensembles (grey) from the trials in C. Wilcoxon Signed-Rank test between before and after rotation p=0.831, n=28 ensembles. (F) Distributions of the time lags corresponding to the minimum absolute median decoded error differences shown in E for the stable and after rotation segments (n=28 unique ensembles where the individual trials where averaged, Wilcoxon Signed-Rank test between before and after rotation, p=0.916). Insets show the distribution between –0.5 and 0.5 s. (G) Scatter plots of the circular variance of the tracked HD in the stable and the realignment segments for each trial versus the variance of the decoded error medians plotted in C (n=108 trials, correlation r=0.389 for the stable, r=0.302 after rotation, p<0.0001 for both). (H) Mean and 95% CI decoded HD errors from 20 s before the rotated cue entered the visual field of the mouse up to 80 s after. All traces were aligned to have final positive target offsets; for simultaneous RSC-ADn trials the target was based on the mean of the ADn decoded errors. Large rotations in green (offset equal or larger than 67.5°) ADn n=29, RSC n=37; small rotations in purple (offset smaller than 67.5°and larger than 17.2°) ADn n=138, RSC n=143.
Figure 3 with 1 supplement
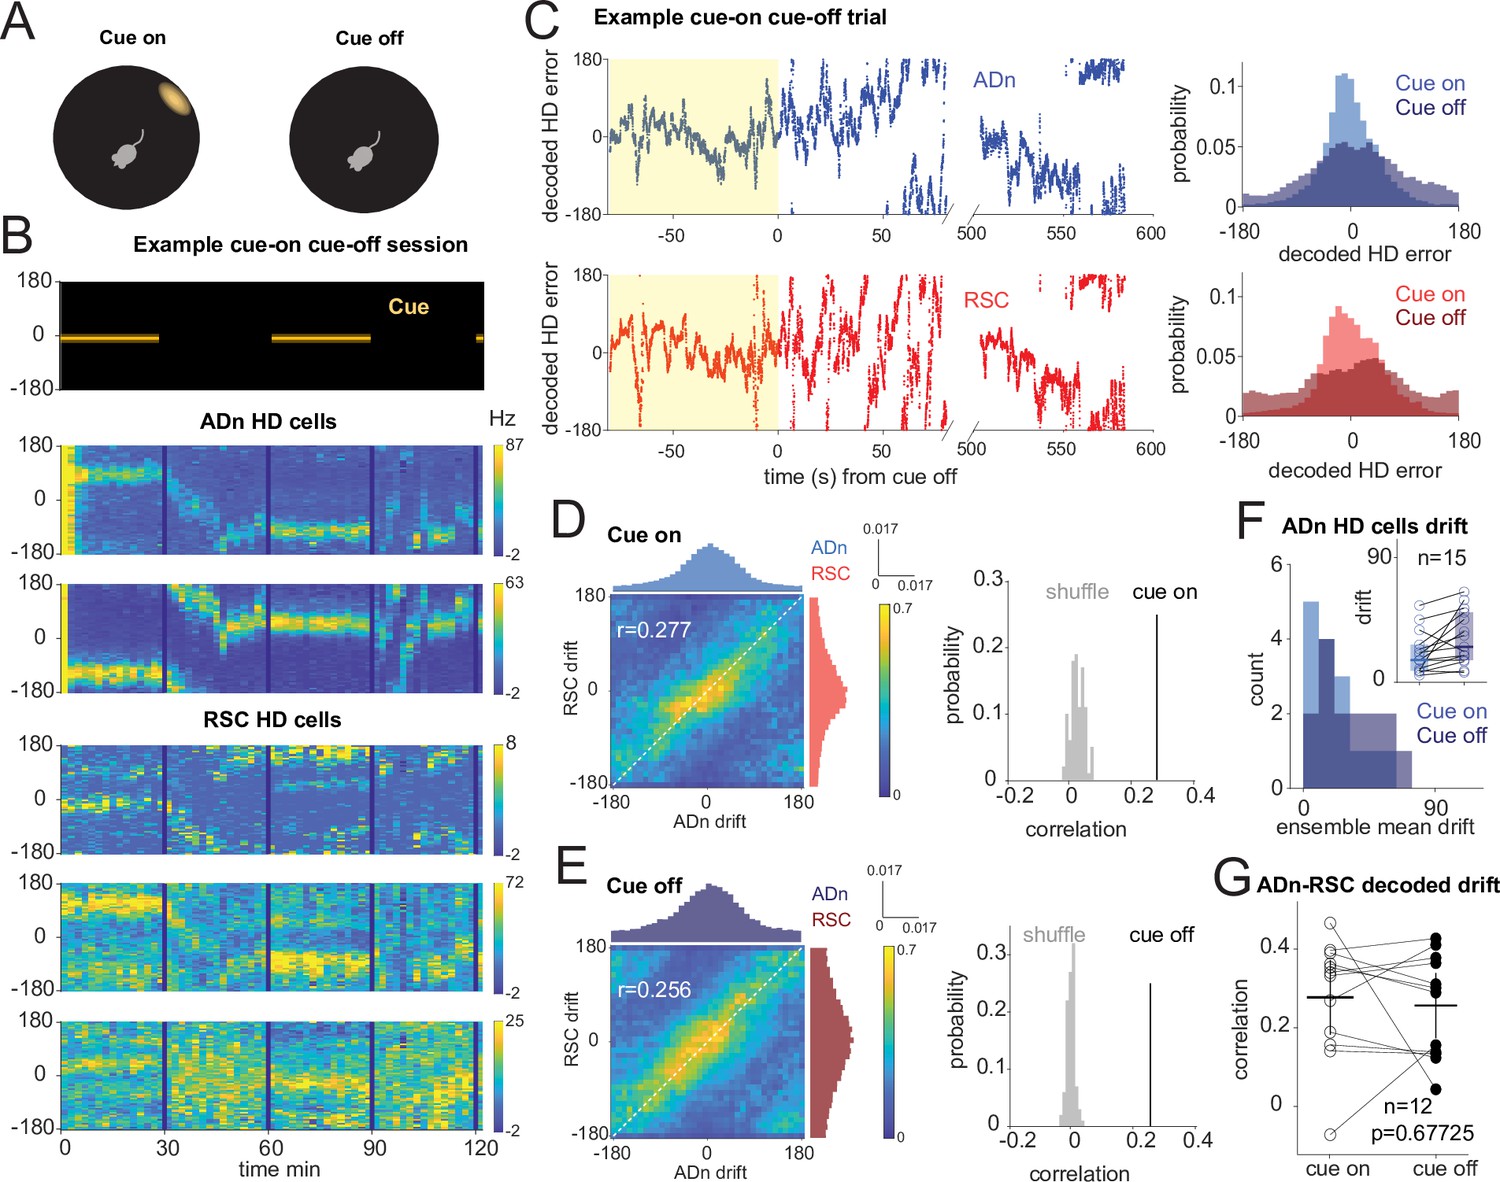
Correlated HD drift in darkness in ADn and RSC.
(A) Schematic of cue-on/off trials. (B) Simultaneous ADn-RSC recording from a session where the cue (top) was turned on and off. (C) Left, simultaneous ADn (blue) and RSC (red) decoded HD errors from the first cue-on (yellow shaded) and -off trial of the example shown in B. Black, median-smoothed decoded error over a 5 s window. Right, probability normalized histograms of the decoded HD error from the example in C in ADn (blue, top) and RSC (red, bottom). The lighter shaded histograms are from the cue-on segments, the darker shaded from the cue-off. (D) Left: 2D histogram of simultaneous ADn and RSC decoded errors from cue-on, normalized by the maximum column value per bin (i.e. in the ADn dimension); above and on the side, marginal distributions of ADn and RSC drift, respectively. Right: correlation value (r=0.277) from the not-normalized data in the left is above the 99th percentile of the distribution obtained after randomly shifting the RSC drift in each trial (grey). (E) Left: same 2-D histogram and marginal distributions for the cue-off segments from the same trials as D; right: averaged circular correlation (r=0.256) of the real cue off data is also above the 99th percentile of the shuffle distribution. Data in D and F includes n=12 ensembles averaged from 28 trials, 3 mice. (F) Distribution of the absolute drift of ensemble ADn HD tuning curves averaged over 2 min bins and across unique ensembles (n=15 from 58 trials, p=0.0053 Wilcoxon Signed-Rank test between cue on drift, inset individual values, median = 15.9, and cue off drift, median = 25.6, shaded areas are the 95% CI). (G) The circular correlation between decoded ADn and RSC drifts from unique ensembles is not significantly different between cue on and cue off (n=12, p=0.67, mean correlations 0.277 for cue on and 0.256 for cue off, plotted together with the 95% CI).
Figure 3—figure supplement 1
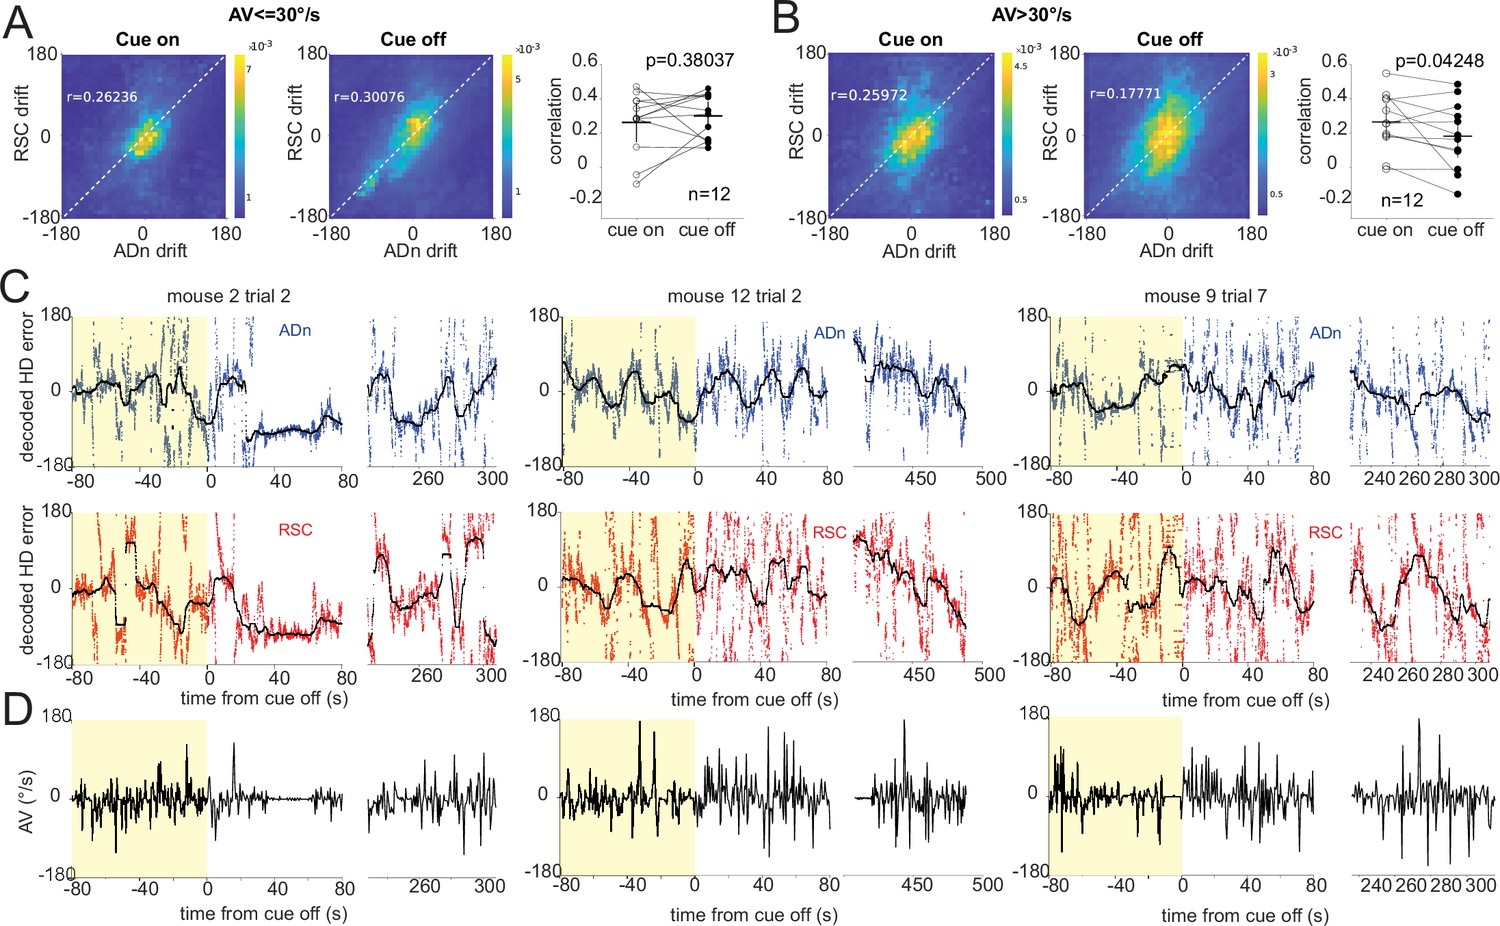
Effect of angular velocity (AV) on HD drift in darkness in ADn and RSC.
(A) Heatmap of 2D histograms of 10°-binned ADn vs RSC decoded HD errors (referred to as drift) from time points of slow AV (<30°/s) from cue-on (left, mean correlation coefficient r=0.262) and cue-off (middle, mean correlation coefficient r=0.30076) trials (n=12 ensembles averaged from 25 trials, 3 mice). Right, comparison of individual ensembles circular correlations for cue-on and cue-off trials (p=0.380, Wilcoxon Signed-Rank test) plotted together with the mean and 95% CI. (B) Same as A but for time points of high AV, (>30°/s) from cue-on (left, mean correlation coefficient r=0.259) and cue-off (middle, mean correlation coefficient r=0.177) trials (p=0.042, Wilcoxon Signed-Rank test, n=12). (C) Examples of decoded HD representations from different cue-on/cue-off trials of simultaneously recorded ADn (blue) and RSC (red) during cue-on (yellow shade) and cue-off periods. In black overlaying, the median-smoothed decoded errors over a 5 s window. (D) The corresponding AV profiles over time for the trails in C.
Figure 4 with 2 supplements
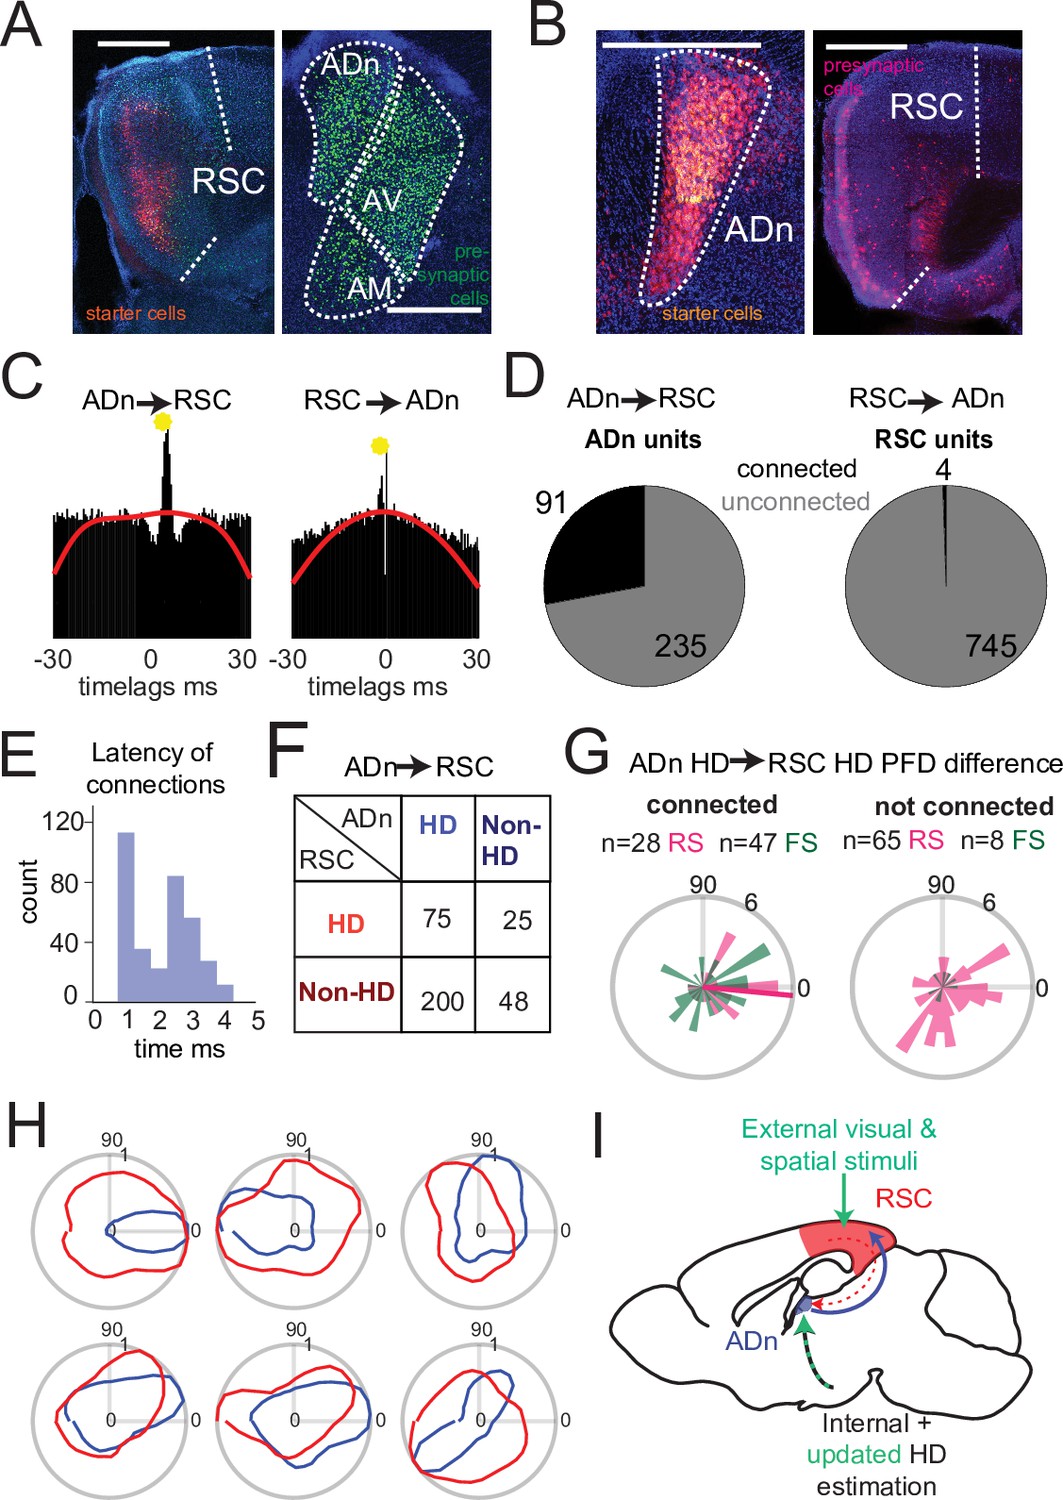
Dense connectivity from ADn to RSC.
(A) Monosynaptic rabies tracing of inputs to RSC (left, starter cells in red) shows a high density of presynaptic cells in ADn (right, green). (B) Monosynaptic rabies tracing of inputs to ADn (left, starter cells identified by the overlap of blue, green and red) shows a low density of presynaptic cells in RSC (right, red) and mostly in A29. Scale bar in A and B, 0.5 mm. (C) Examples of cross-correlograms with putative excitatory connections (yellow circle) from ADn to RSC (left) and RSC to ADn (right), showing a sharp peak between 1 and 5ms time lag above the baseline (red line) at more than 99.9% of the cumulative Poisson distribution. (D) Number of ADn units with putative connections to RSC (left) and of RSC units with putative connections to ADn (right). (E) Distribution of the latencies of the peaks in the cross-correlograms for ADn-to-RSC connections. (F) Breakdown into HD- and non-HD coding of the putative pre- and post- synaptic partners of connected ADn-to-RSC pairs. (G) Polar plot distributions of the differences between preferred directions of connected ADn HD units and their putative HD-coding synaptic partners in RSC (n=75 units, 28 RS and 47 FS, 6 mice, left) and the same ADn HD units and all other HD-coding non-synaptic partners (n=73, 65 RS and 8 FS, 6 mice, right). Magenta line on the left plot indicates the circular mean (–5.4°) of the RS peak differences; Rayleigh test for non-uniformity p=0.005 for the RS synaptic partner, p=0.002 for RS and FS, p=0.052 of the RS non-synaptic partners and 0.086 for all non-partners (right plot). (H) Polar plots of tuning curves of 6 example pairs of connected ADn to RSC HD units with variable preferred directions. (I) Adapted schematic from Figure 1A showing that the connectivity from RSC to ADn is nearly absent and that the visually-guided updates in the HD frame emerge from a strong feedforward HD input from ADn.
Figure 4—figure supplement 1

Anatomical tracing of reciprocal connectivity between ADn and RSC.
(A) Additional modified rabies tracing experiment in RSC, as showed in Figure 4A. (B) Red fluorescent microspheres (Lumafluor) injected in ADn (left) retrogradely label deep layers of RSC (right).
Figure 4—figure supplement 2

Separation of putative pyramidal neurons and fast-spiking interneurons in cortex.
(A) Example putative RS neuron spike waveform with A (pre-polarization) and B (after-hyperpolarization) heights and the peak to trough distance metrics used for separating RS (~pyramidal) and FS (~interneurons) spiking neurons in RSC. (B) Scatter plot of all 749 RSC units according to the metrics calculated as in A. Dashed line indicates the <0.42ms peak-to-trough duration discrimination. Units are shape- and color-coded to reflect the unit type classification and whether they were HD tuned or not. The plot includes the mean and SD of the combined spike waveforms for the four classes of units. (C) Unimodal distribution of the spike waveform symmetry values across all units. (D) Bimodal distribution of the peak-to-trough values, indicative of two clusters. (E) Counts of the 4 classes of units.
Author response image 1
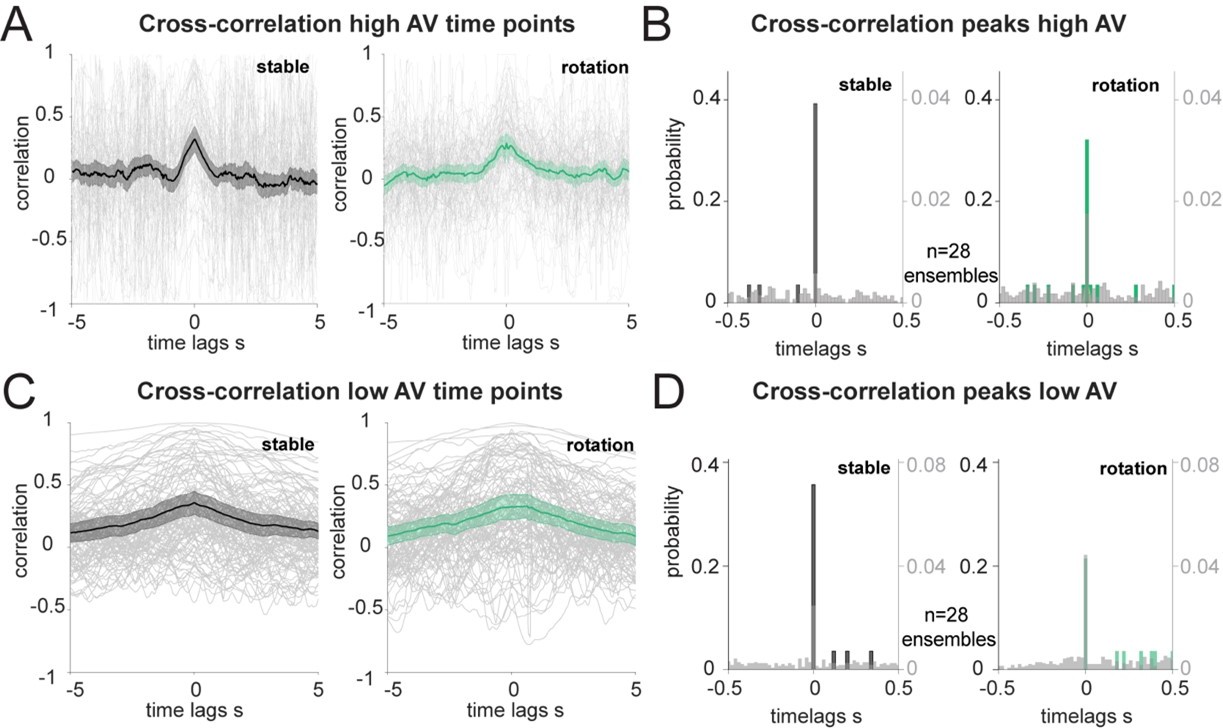
Correlation of decoded HD errors at different angular velocity.
(A): Individual trials (grey traces, n=108) and averages of the unique ensembles (n=28) of the cross correlations between decoded errors composed only of the time points with high AV (more than 30°/s). (B): Distribution of the time lags corresponding to the cross-correlation peaks from A, in 20 ms bins. Wilcoxon Signed-Rank test between before and after rotation p=0.537 and two-sample Kolmogorov-Smirnov test, p<0.0001 for both stable and shifted versus the null distributions in grey, n=28 ensembles. (C): Same as A, but for decoded errors composed of time points with low AV. (D): Same as B, but for the peaks in C. Wilcoxon Signed-Rank test between before and after rotation p=0.131 and two-sample Kolmogorov-Smirnov test, p<0.05 for both stable and shifted versus the null distributions in grey, n=28 ensembles.
Author response image 2
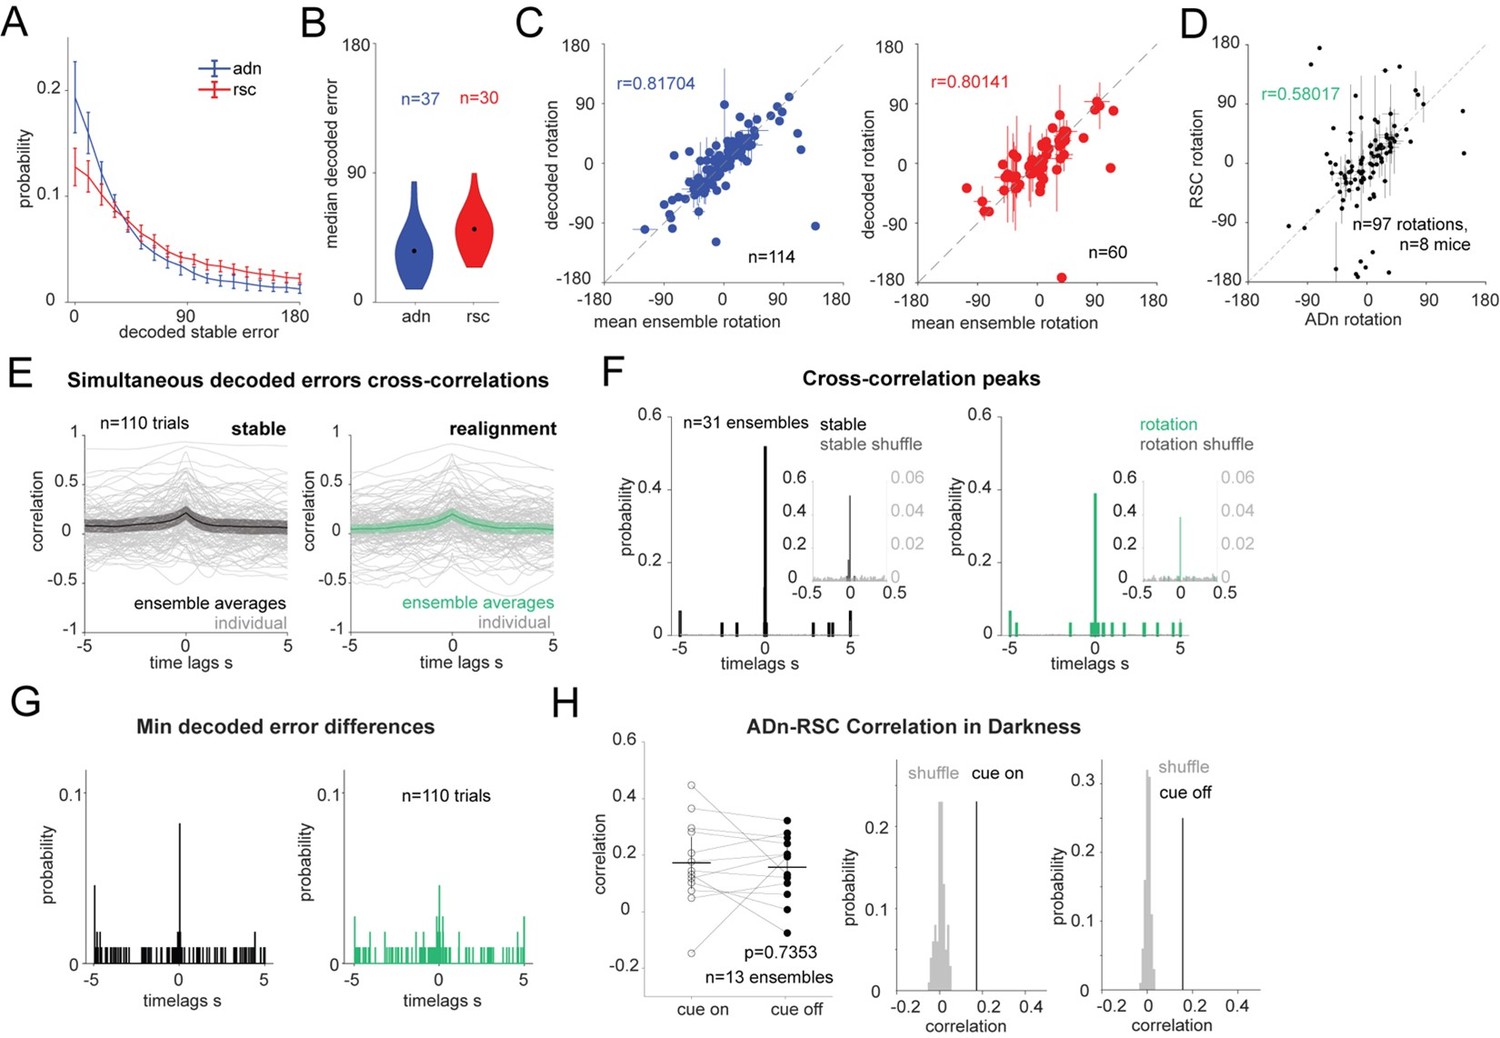
LSTM-based decoding of HD recapitulates GLM-based decoding results.
(A): Mean and 95% CI of the absolute decoding error distribution for ADn (blue) and RSC (red) for each region from the test period from rotation trials (n=37 unique ensembles ADn, N=30 for RSC). (B): Violin plots of the medians of the absolute decoded errors for ADn and RSC ensembles (p<0.001, Mann-Whitney test, medians highlighted in black 35.69° in ADn, n=37, and 50.88° in RSC, n=30). (C): Left: scatter plot with error bars of the mean rotations from simultaneous ADn HD neurons tuning curves versus the mean rotations calculated from decoding HD from ADn neurons (circular correlation coefficient=0.82, p<0.0001, n=114 ensembles averaged across trials of positive and negative small and large rotations). Right: Same as E but for RSC (circular correlation coefficient=0.80, p<0.0001, n=60 ensembles). (D): (left) Correlation of the decoded rotations from simultaneous ADn and RSC ensembles (circular correlation coefficient r=0.58, p<0.001, n=97 trials averaged across the same ensembles and for similar small positive, small negative, large positive, large negative and null rotations, from 8 mice).(Right) the correlation value is above the 99th of 100 correlation values calculated for shuffled RSC rotation values. (E): Cross correlations of ADn vs RSC decoded HD errors are on average highest at 0 s time lags both in the 75s stable test period (left) and in the 75s after cue rotation (grey traces are the individual trials, n=110, colored black and green are the mean and the 95% CI of the unique ensembles, n=31). (F): Distributions of time lags corresponding to the cross-correlation peaks from the ensemble traces from stable periods (left) and after cue rotation (right) vs in grey the distributions from cross correlations with 100 times shuffled RSC decoded errors (n=31, p<0.0001 Kolmogorov-Smirnov test between the true and the shuffled distributions for both stable and realignment data, p=0.832 Wilcoxon Signed-Rank test between stable and realignment time lags of peak correlations). Insets show the same distributions zoomed in the -0.5 to 0.5 s range. Left y-axis and right y-axis are on different scales to show the values of the correlations from shuffled trials. (G): Distributions of the time lags corresponding to the minimum absolute decoded error of the median differences shown in K (p=0.618 Wilcoxon Signed-Rank test between stable and realignment time lags of peak correlations). (H): Left, comparison of the correlation values for the 13 unique ensembles between cue on and cue off periods (Wilcoxon Signed-Rank test p=0.7353). Middle and right, the mean correlation values for cue on and cue off are above the 99th of 100 mean correlations with shuffled RSC drifts.
Author response image 3

Normalized decoded rotations.
Left 2 graphs, distribution of the decoded rotations, normalized by the size of the cue rotation, from ADn ensembles, right 2 graphs from RSC ensembles. Purple indicates the small cue rotations, green the large cue rotations.
Author response image 4
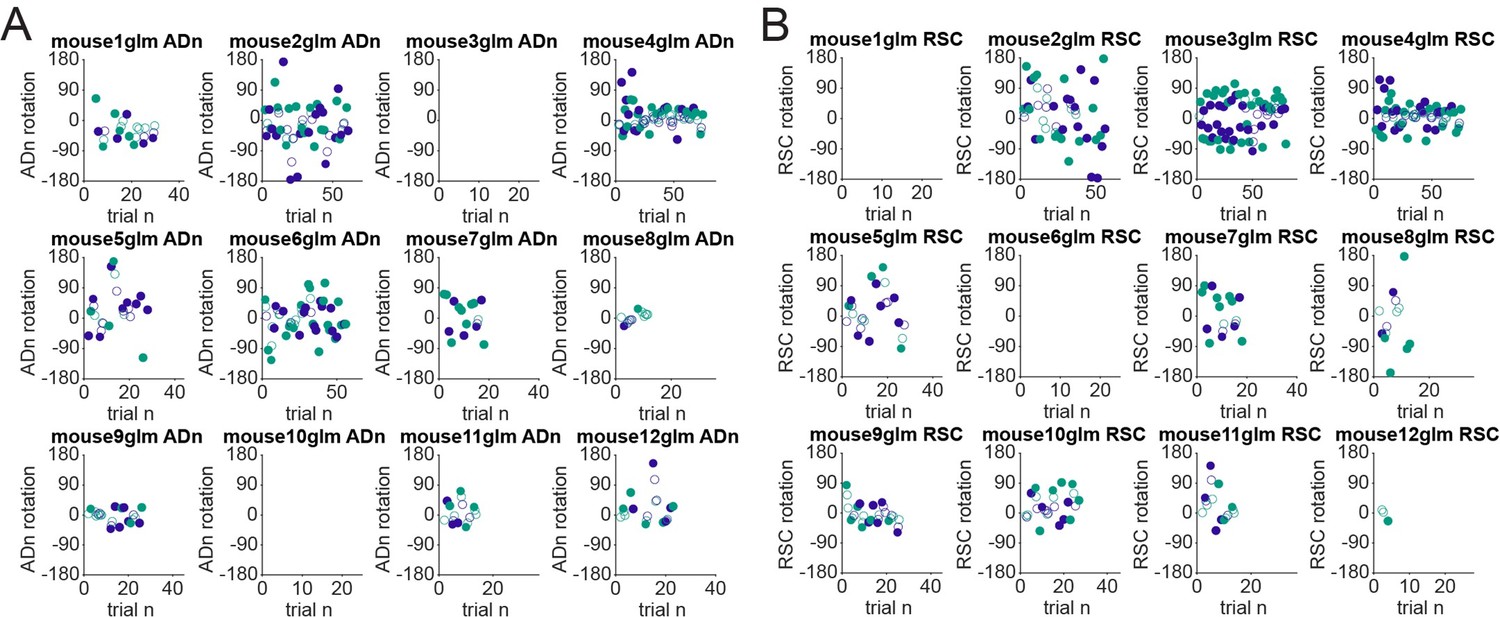
Rotations over time.
(A): Decoded rotations from ADn ensembles plotted over trials for each mouse. We have labeled the data points according to the size of the cue rotation (green for large cue rotations and purple for small cue rotations). The filled markers are trials included in the analyses presented in Figure 2 and in Figure 2 – Supplements 1, 2 and 3; open markers are trials rejected by the threshold for decoding accuracy in comparison with the decoded HD from shuffled spikes or by a decoded rotation less than 17.2°. (B): Same as A, but for RSC ensembles.
Author response image 5
Number of HD cells over time.
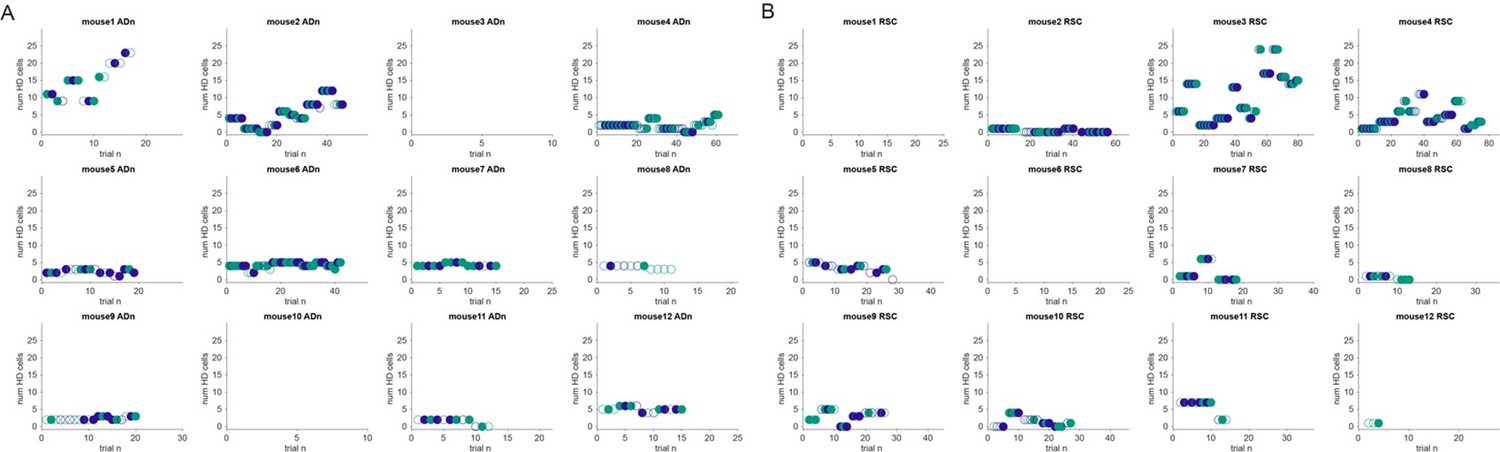
(A): Number of HD cells recorded in ADn over trials plotted by mouse. As in Rebuttal Figure 4, the open markers are trials rejected by the threshold for decoding accuracy in comparison with the decoded HD from shuffled spikes or by a decoded rotation less than 17.2°. Green indicates the large cue rotations, purple the small cue rotations. (B): Number of HD cells recorded in RSC over trials, as in A.
Author response image 6

Egocentric information of HD cells.
Left, ADn (n=150) HD directional information (bits/spike) of classified HD cells vs egocentric directional information with respect to the angular position of the cue, with both axes on the logarithmic scale. Units for which egocentric information is not above 95% of the shuffled spikes were marked as open circles. Right, same analysis applied to RSC HD cells (n=73).
Author response image 7
Decoding accuracy over the number of cells.
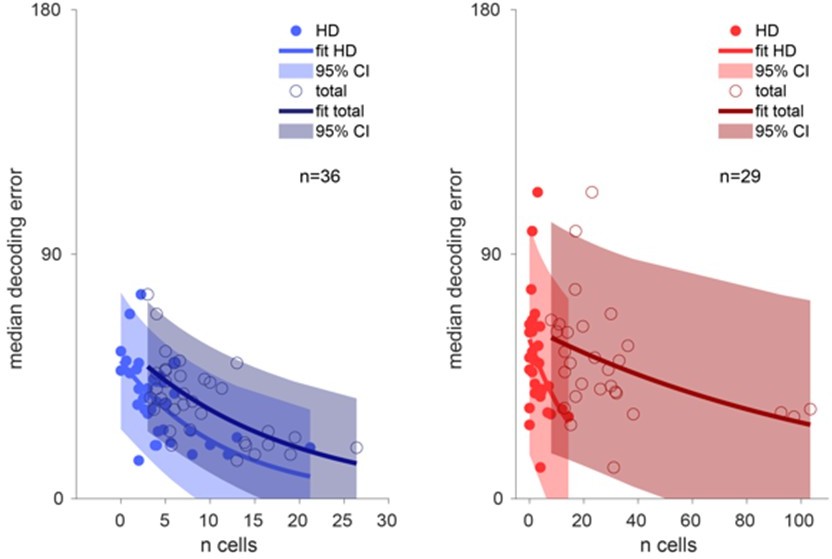
Left, decoding accuracy of ADn ensembles (n=36) over the number of ADn HD cells (light blue line exponential fit and 95% confidence interval, filled markers) and over the total number of recorded ADn cells (dark blue line exponential fit and 95% confidence interval, open markers). Right, same plot but for RSC (n=29), with bright red and dark red, respectively, to indicate the relationship over the number of classified HD cells (filled markers) and total number of units (open markers).
Author response image 8

Accuracy of decoded drift in darkness.
Top, the decoded drift from individual ADn trials during cue-on (left) and cue-off (right) periods, calculated every 2 minutes, plotted against that calculated from the tuning curves of HD units. Bottom, same analysis but for RSC HD ensembles.
Additional files
-
MDAR checklist
- https://cdn.elifesciences.org/articles/82952/elife-82952-mdarchecklist1-v1.docx
-
Supplementary file 1
Recording Sessions Summary.
- https://cdn.elifesciences.org/articles/82952/elife-82952-supp1-v1.pdf
Download links
A two-part list of links to download the article, or parts of the article, in various formats.
Downloads (link to download the article as PDF)
Open citations (links to open the citations from this article in various online reference manager services)
Cite this article (links to download the citations from this article in formats compatible with various reference manager tools)
Coordinated head direction representations in mouse anterodorsal thalamic nucleus and retrosplenial cortex
eLife 13:e82952.
https://doi.org/10.7554/eLife.82952


